Survey of Non-Group Health Insurance Enrollees, Wave 3
Findings
Introduction
This survey is the third in a series that seeks to shed light on the experiences and opinions of those purchasing their own health insurance in the non-group market. The Affordable Care Act (ACA) has had a significant impact on this group, through new rules that standardized benefits and guaranteed coverage for those with pre-existing conditions, and through the establishment of income-based federal financial assistance to those buying insurance through new health insurance Exchanges or Marketplaces created by the law.
Starting on January 1st, 2014, all newly purchased non-group coverage has had to follow new rules under the ACA (i.e. “ACA-compliant”). This survey, conducted February 9 – March 26, 2016, after the close of the law’s third open enrollment period, focuses on individuals who purchased ACA-compliant coverage, whether inside or outside of a Marketplace. The survey also includes individuals who are currently enrolled in “non-ACA compliant” plans (those purchased before March 2010 that were grandfathered in and those purchased before October 2013 that were allowed to continue under a federal transition policy at the discretion of states and insurers); however, few people remain in non-compliant plans and the sample size does not allow their results to be reported separately.1
This report details findings from the latest survey and draws trends and comparisons using data from the first and second surveys in the series, conducted at the end of each of the previous enrollment periods in 2014 and 2015. It also draws some comparisons to the experiences and opinions of people with employer-sponsored insurance through data collected on a separate series of surveys, the Kaiser Health Tracking Polls.2
Key Findings
Basic Demographics of the Non-Group Market
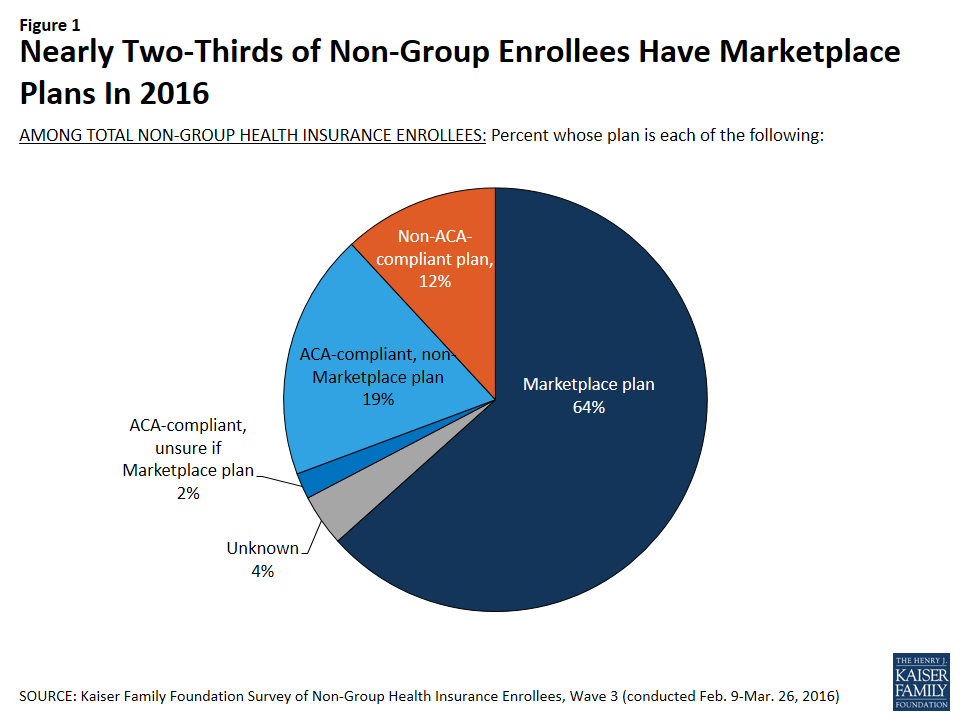
Looking at the non-group market as a whole, nearly two-thirds of enrollees (64 percent) report being in a Marketplace plan.3 This is similar to the share who had Marketplace plans in 2015 (59 percent) and an increase from 2014 (48 percent). Currently, about one in five enrollees (19 percent) report being in an ACA-compliant, non-Marketplace plan purchased from a broker or insurance company, and 12 percent report having pre-ACA, non-compliant plans.4
One concern raised about the ACA’s guarantee of coverage for those with pre-existing conditions was whether enough healthy people would enroll to offset higher claims from less healthy people enrolling in new coverage because insurers could no longer exclude them. The expectation was that sicker people would enroll initially because they were certain they needed coverage, with the hope that an increasing number of healthier people would sign up over time. The share of people who say they are in fair or poor health has been fairly consistent through the first three open enrollment periods, with most changes from year to year within the survey’s margin of sampling error.
| Table 1: Self-Reported Health Status of Non-Group Enrollees | ||||||
| In general, would you say your health is excellent, very good, good, fair, or poor? | ALL ACA-COMPLIANT PLANS | MARKETPLACE PLANS ONLY | ||||
| 2014 | 2015 | 2016 | 2014 | 2015 | 2016 | |
| NET Excellent/Very good/Good | 82% | 85% | 80% | 79% | 85% | 78% |
| Excellent | 22 | 24 | 22 | 21 | 23 | 19 |
| Very good | 29 | 33 | 31 | 27 | 34 | 32 |
| Good | 31 | 28 | 27 | 31 | 28 | 27 |
| NET Fair/Poor | 17 | 15 | 20 | 20 | 15 | 22 |
| Fair | 13 | 11 | 15 | 16 | 10 | 16 |
| Poor | 4 | 4 | 5 | 4 | 4 | 6 |
| NOTE: Don’t know/ Refused responses not shown. | ||||||
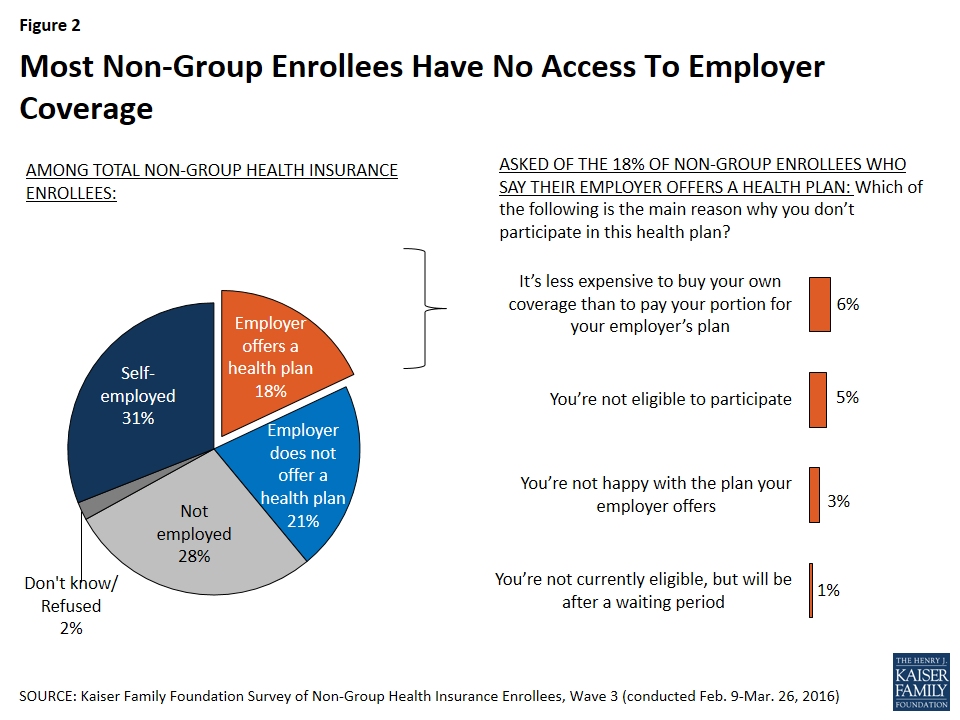
Most individuals with non-group coverage don’t have access to coverage from an employer, either because they are self-employed (31 percent), not employed (28 percent), or their employer does not offer a health plan (21 percent). Among the 18 percent who work for an employer that offers coverage, most are either not eligible to enroll in their employer’s plan (5 percent are not currently eligible and 1 percent are in an eligibility waiting period), or say it’s less expensive to buy their own coverage than to pay the premium for their employer plan (6 percent). Three percent say they’re not happy with the plan their employer offers.
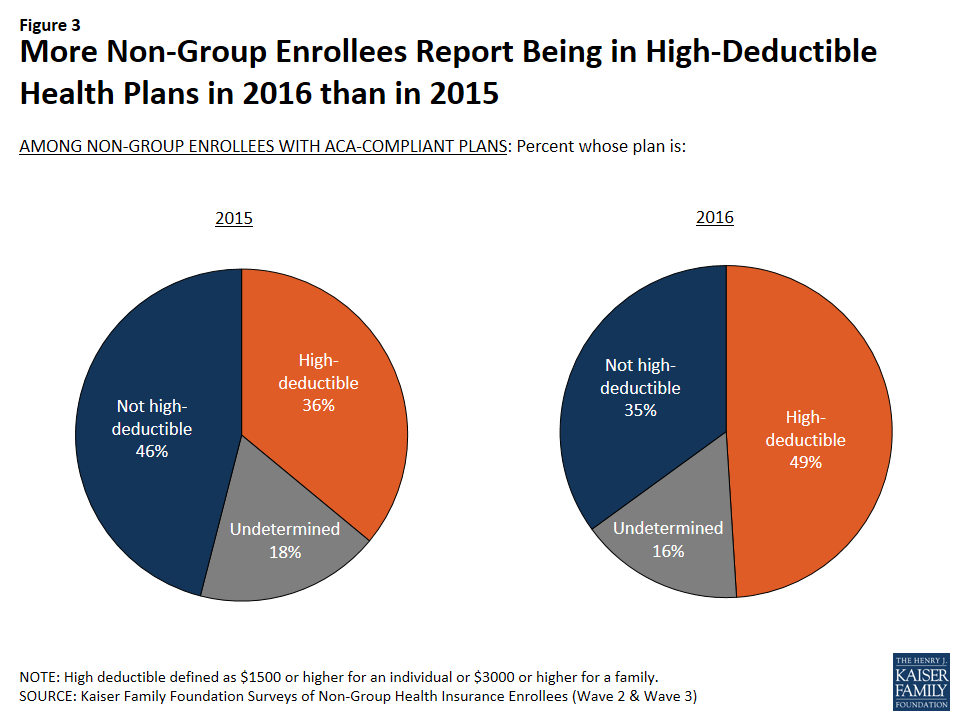
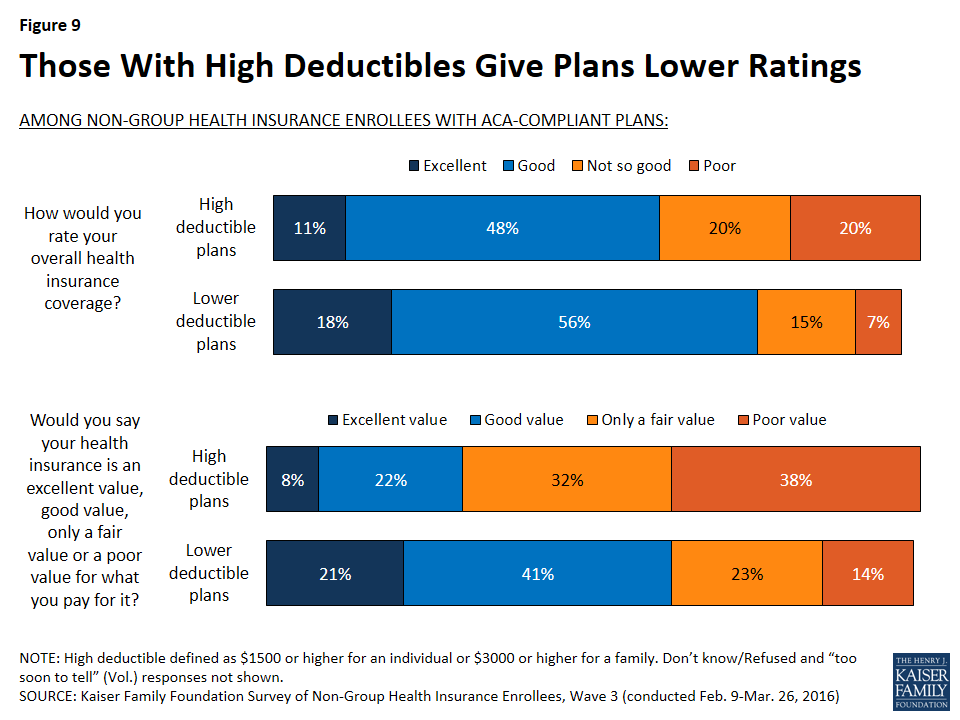
A somewhat higher share of non-group enrollees now report being in plans with high deductibles than did so in 2015. In the current survey, about half (49 percent) of those with ACA-compliant non-group coverage say their plan has an annual individual deductible of at least $1,500 or a family deductible of at least $3,000, up from just over a third (36 percent) last year. Those with Marketplace plans are somewhat less likely to report having a high deductible (46 percent, compared with 61 percent of those in ACA-compliant non-Marketplace plans), likely because many Marketplace enrollees qualify for cost-sharing subsidies that lower their deductible.5
Health Plan Ratings and Satisfaction with Coverage
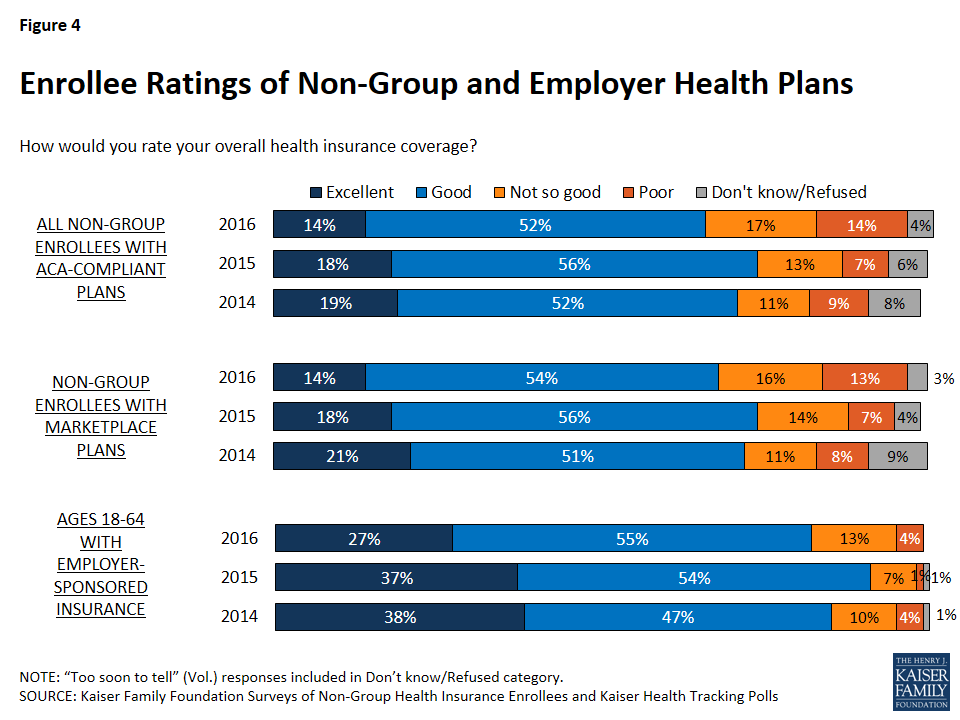
The majority of enrollees in ACA-compliant non-group plans give their overall coverage a positive rating, with 14 percent calling their plan “excellent” and about half (52 percent) saying it is “good.” However, the share rating their coverage as “not so good” or “poor” is higher in 2016 (31 percent) than it was in the two previous waves of the survey (20 percent in 2014 and 21 percent in 2015). Non-group enrollees have consistently given their plans lower ratings than their counterparts in employer-sponsored plans, however among those with employer coverage, the share rating their coverage as “not so good” or “poor” is also higher in 2016 than it was in previous years. It is also notable that those with Marketplace plans are less likely to give their plans low ratings than those with ACA-compliant plans purchased outside the Marketplace (29 percent versus 38 percent).
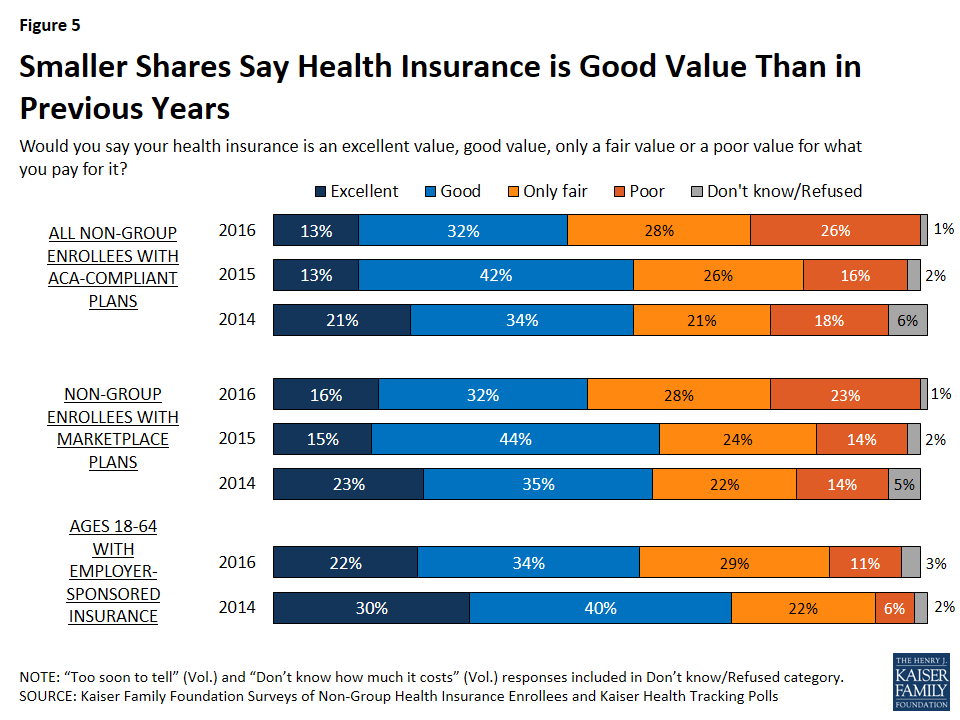
Similar to the trend in overall plan ratings, the current survey finds those with ACA-compliant non-group plans are less likely than in previous years to say their coverage is an “excellent” or “good” value for what they pay for it. Just over half (54 percent) now rate the value of their coverage as “only fair” or “poor” (up from 42 percent in 2015 and 39 percent in 2014). Individuals with Marketplace coverage are more likely to give their plan a positive rating than those with ACA-compliant, non-Marketplace plans (48 percent versus 35 percent). Those with employer-sponsored coverage, who generally pay a lower portion of their premium, are more likely than those with non-group coverage to see their plan as at least a “good” value for the money, but the share of this group saying the value is “only fair” or “poor” has also increased, from 28 percent in 2014 to 40 percent in 2016.
Looking beyond overall plan ratings, most people with ACA-compliant non-group coverage say they are satisfied with various elements of their plans. Despite media coverage of narrowing provider networks, three-quarters of those with ACA-compliant non-group plans say they’re “very” or “somewhat” satisfied with their plan’s choice of hospitals (75 percent) and primary care providers (75 percent), and about six in ten (61 percent) say the same about the choice of specialists. Satisfaction levels are similar when looking just at those enrolled in Marketplace plans.
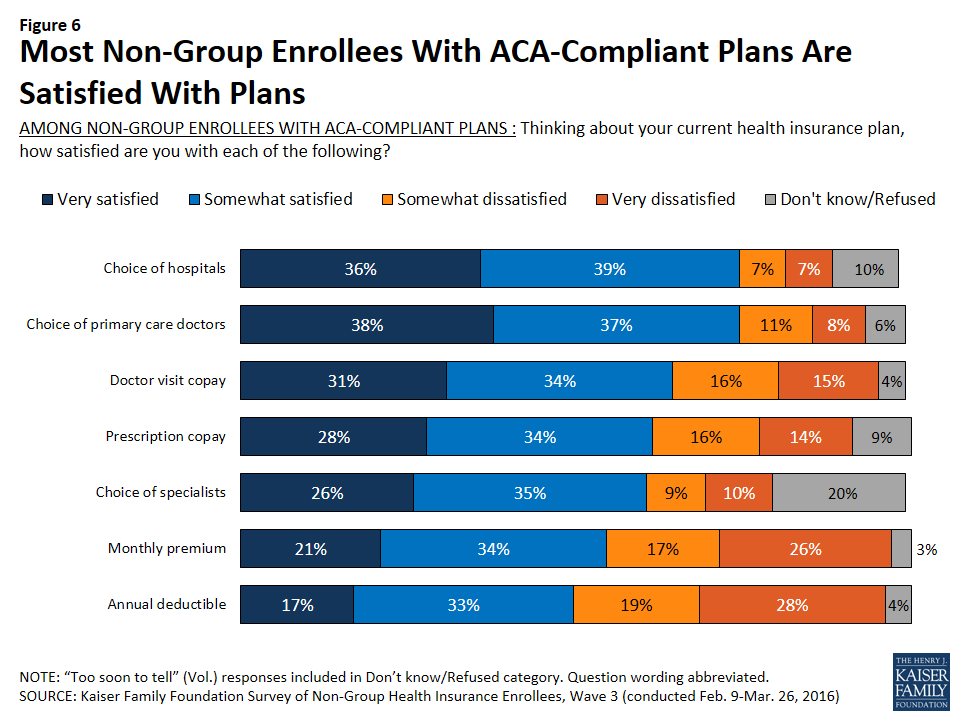

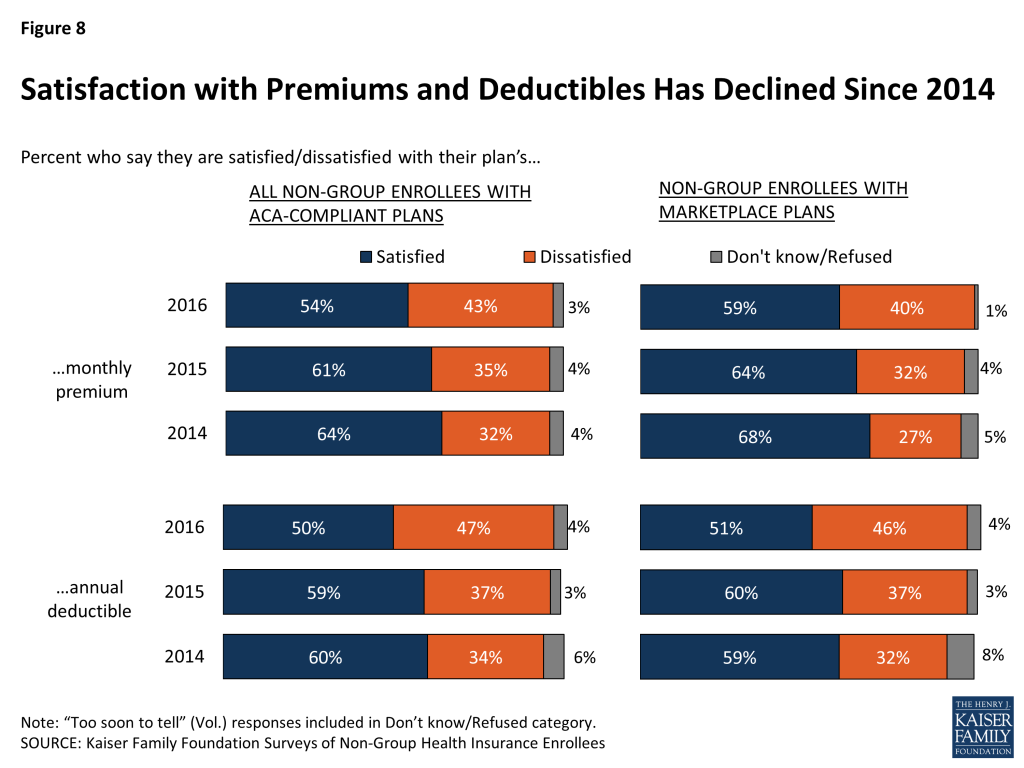
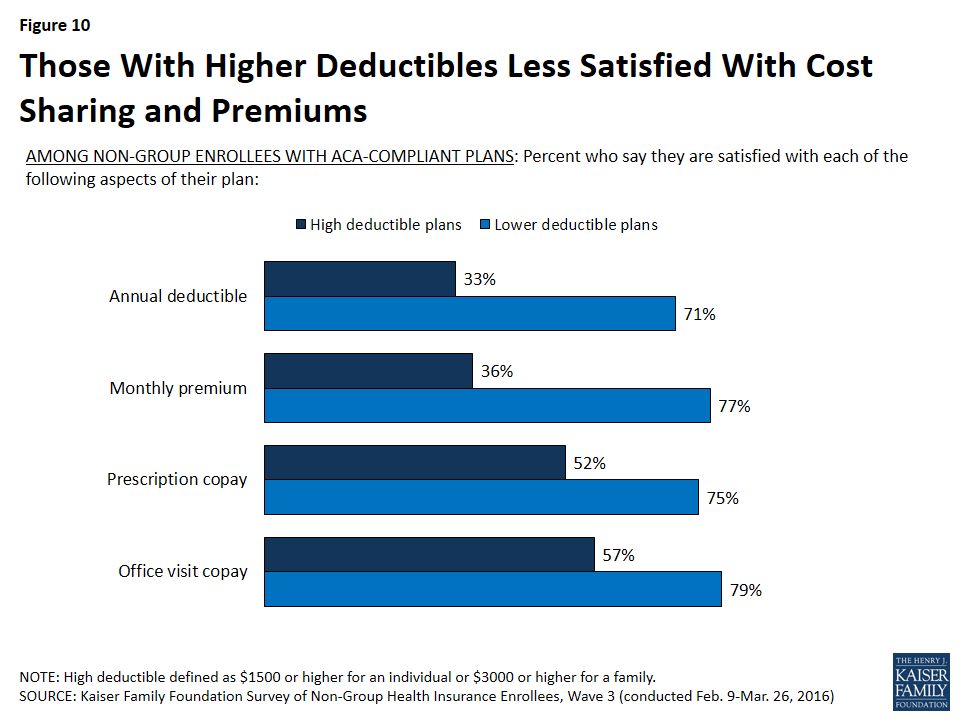
A majority of enrollees also say they are satisfied with their plan’s premium (54 percent of all those in ACA-compliant plans and 59 percent of those in Marketplace plans), and about half say the same about their deductible (50 percent of ACA-compliant enrollees and 51 percent of Marketplace enrollees). However, satisfaction with premiums and deductibles has declined since 2014. Nearly half now say they are dissatisfied with their plan’s annual deductible (47 percent among all those ACA-compliant plans and 46 percent in Marketplace plans), and four in ten are dissatisfied with their monthly premium (43 percent and 40 percent, respectively).
Each of these trends toward more negative ratings of non-group coverage may be related to the fact that more enrollees now report being in high-deductible plans (as noted above, 49 percent of those with ACA-compliant plans now have a high-deductible plan, up from 36 percent in 2015). The latest survey finds that those with high-deductible plans give their coverage lower ratings overall and are less likely than their counterparts in lower-deductible plans to say they are satisfied not only with their deductible, but also with their copays and premiums.
Financial Protection of Health Insurance
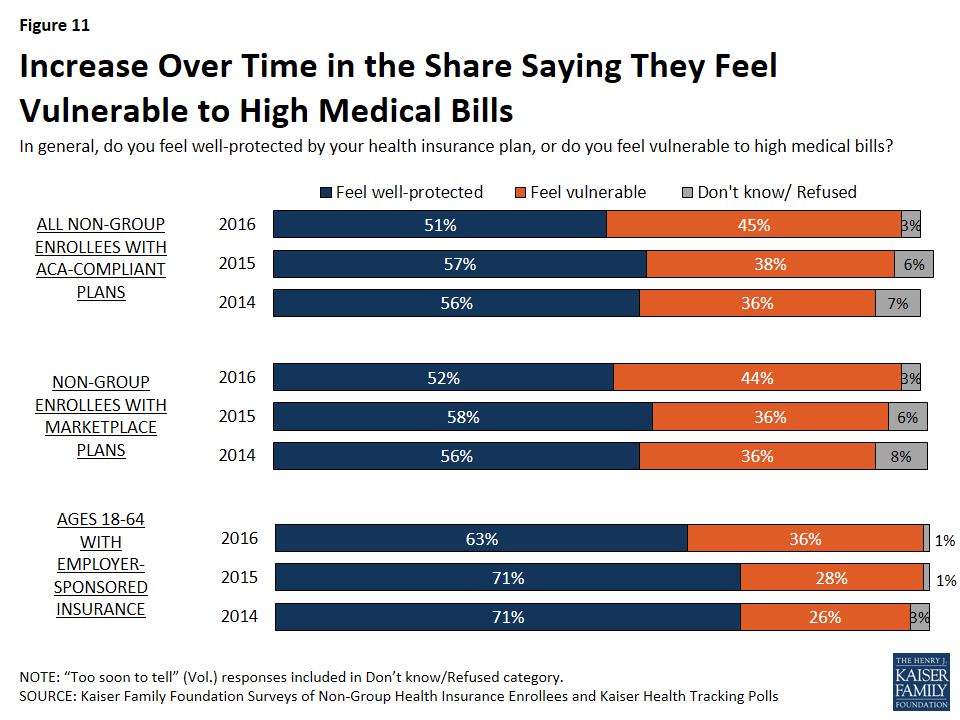
About half (51 percent) of non-group enrollees with ACA-compliant plans say they feel well-protected by their health insurance; however, the share saying they feel vulnerable to high medical bills has risen over the past two years, from 36 percent in 2014 to 45 percent in the current survey. Again, it’s notable that while those with employer coverage are more likely than non-group enrollees with ACA-compliant plans to say they feel well-protected, this group has also seen a similar increase in the share saying they feel vulnerable (from 26 percent in 2014 to 36 percent today).
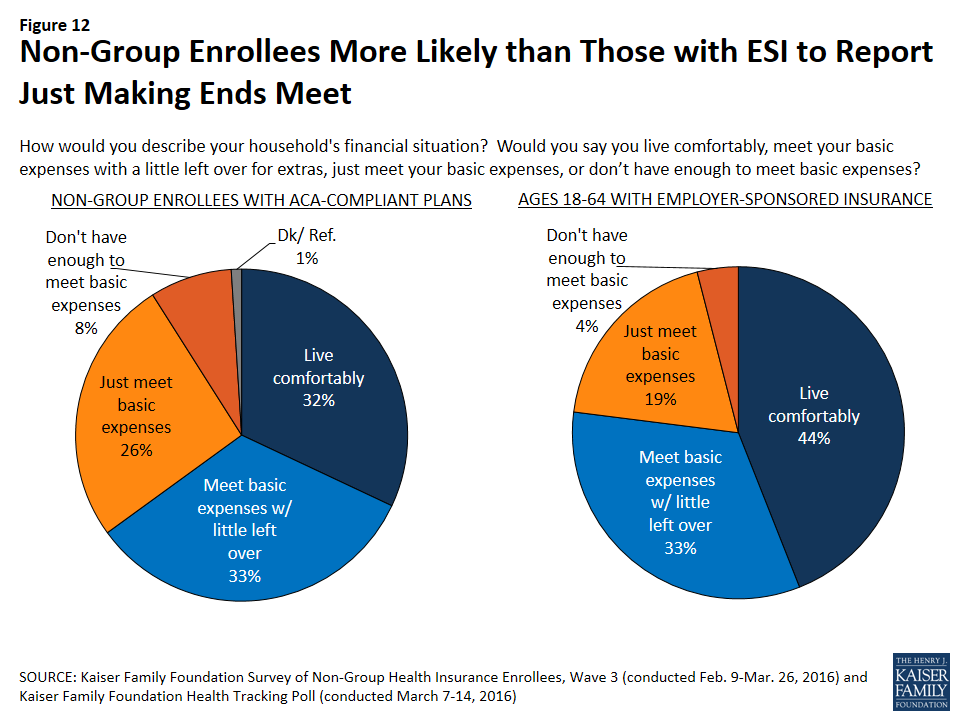
People with ACA-compliant non-group coverage generally report more tenuous financial circumstances than people who get insurance through their jobs. Those with ACA-compliant non-group plans are less likely than those with employer plans to say they “live comfortably” (32 percent versus 44 percent), and more likely to say they either “just meet basic expenses” or “don’t have enough to meet basic expenses” (34 percent versus 23 percent).
Given this, it’s no surprise that difficulty affording health care costs ranks among several other categories of expenses that non-group enrollees say they find it difficult to afford. Half (50 percent) of those with ACA-compliant plans say it is difficult for them to afford the out-of-pocket health care costs not covered by insurance, and a similar share (46 percent) say it’s difficult to afford their monthly premiums (nearly identical to the 45 percent who said so in 2014). A similar percentage (51 percent) says it is difficult for them to afford paying off debt, while a much larger share (71 percent) reports difficulty saving money for retirement, education, and other purposes. Ranking lower in terms of difficulty, a third (33 percent) say they find it difficult to afford basic necessities like food, housing, and utilities.
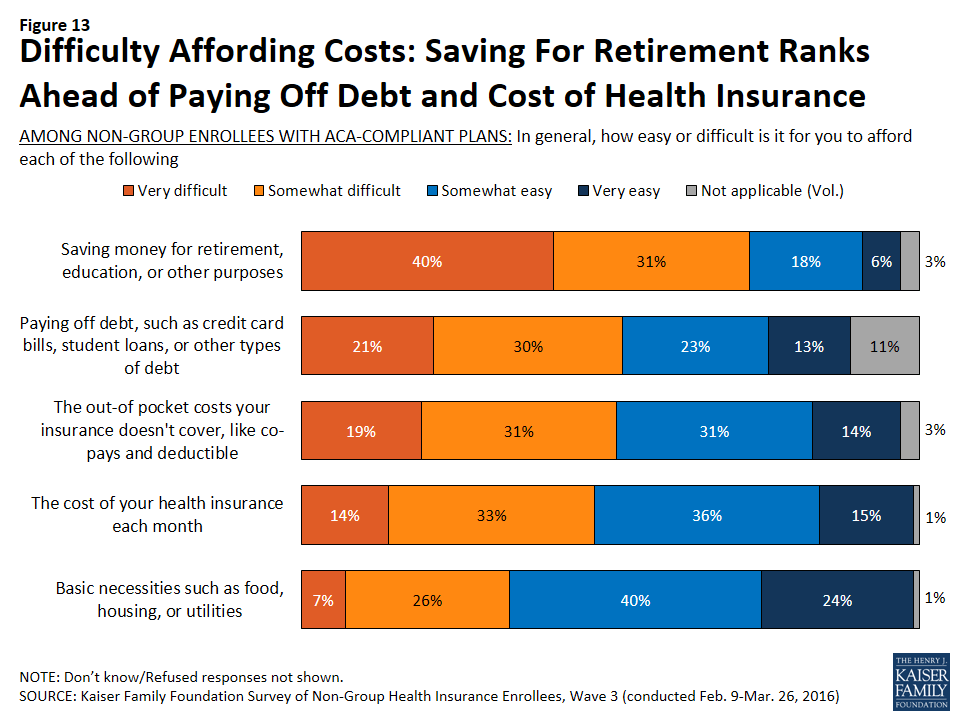
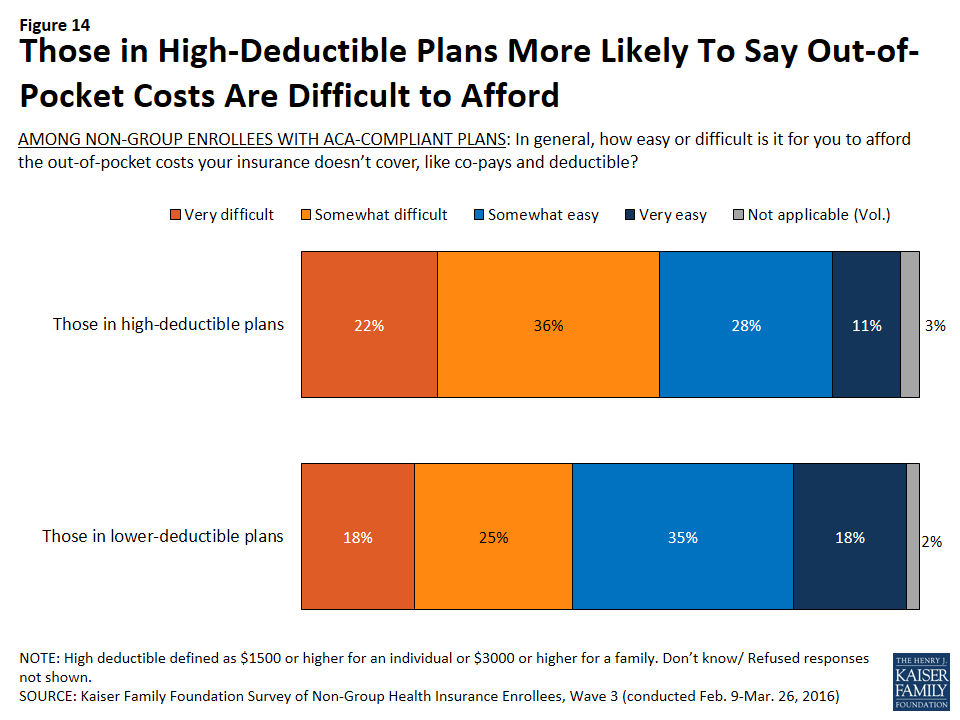
Not surprisingly, those whose plans have higher deductibles are more likely than those with lower deductibles to say it is difficult for them to afford their out-of-pocket health care costs (58 percent versus 43 percent). This is despite the fact that those with high-deductible plans report higher incomes on average than those whose plans have lower deductibles.
Plan Utilization and Reported Problems
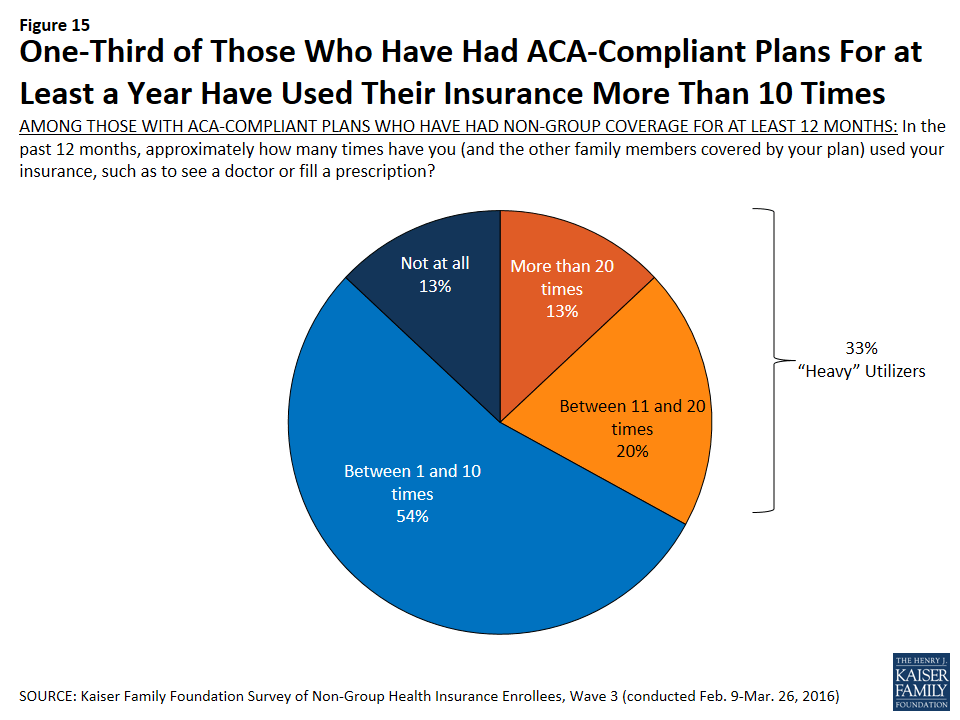
Among those with ACA-compliant plans who’ve had non-group coverage for at least 12 months, a third (33 percent) can be classified as “heavier” utilizers, saying they have used their insurance more than 10 times in the past 12 months to visit a doctor or fill a prescription. Most enrollees (54 percent) say they’ve used their plans between 1 and 10 times, and 13 percent say they haven’t used their plans at all.
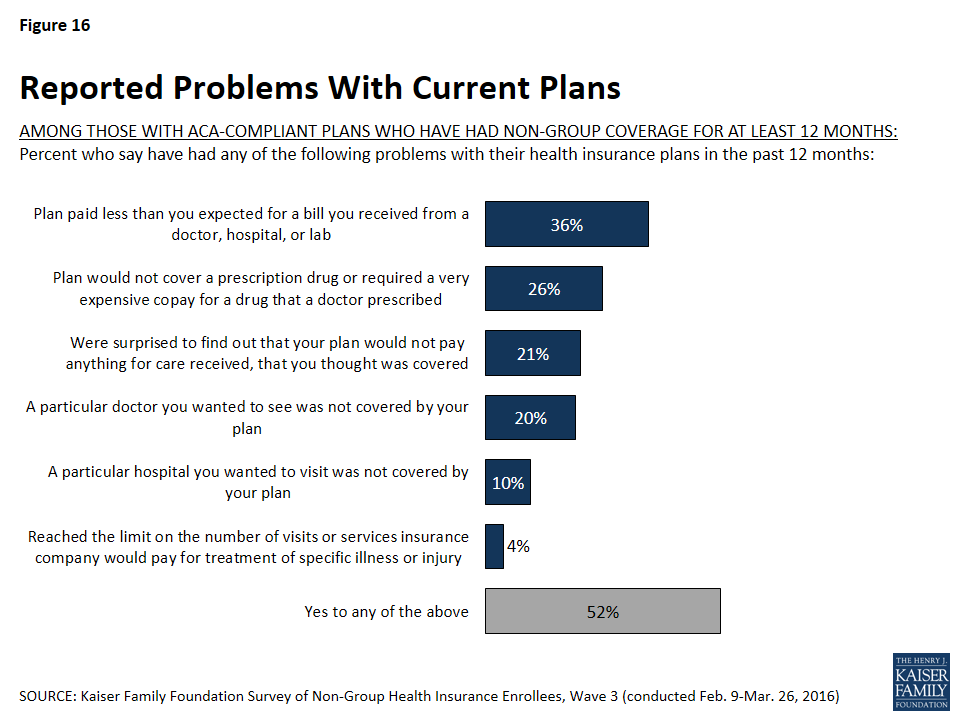
Among those who’ve had ACA-compliant non-group coverage for at least a year, many report having problems with their plans. Most commonly, just over a third (36 percent) say their plan paid less than they expected for a bill, about a quarter (26 percent) say their plan wouldn’t cover or required a very expensive copay for a drug prescribed by their doctor, one in five (21 percent) say they were surprised to find their plan wouldn’t pay anything for care they thought was covered, and a similar share (20 percent) say that a particular doctor they wanted to see wasn’t covered by their plan. Fewer say they wanted to visit a hospital that wasn’t covered (10 percent) or that they reached the limit on what their insurance would pay for treatment of a specific illness or injury (4 percent). About half (52 percent) report having at least one of these problems.
Those who are heavier utilizers of health insurance are more likely than their counterparts to report some of these problems, including their plan paying less than they expected for a bill (47 percent versus 31 percent), their plan not covering a prescription or requiring a very expensive copay (37 percent versus 20 percent). Heavy utilizers are also more likely to report problems paying medical bills in the past 12 months (31 percent versus 16 percent).
| Table 2: Heavy Utilizers More Likely to Report Problems With Their Plans Than Light Utilizers | |||
| AMONG THOSE WITH ACA-COMPLIANT PLANS WHO HAVE HAD NON-GROUP COVERAGE FOR AT LEAST 12 MONTHS: Percent who say: | Total | Heavy Utilizers | Light Utilizers |
| Their plan paid less than they expected for a medical bill | 36% | 47% | 31% |
| Their plan would not cover or required a very expensive copay for a prescription drug prescribed by a doctor | 26 | 37 | 20 |
| They have had problems paying medical bills in the past 12 months | 21 | 31 | 16 |
| NOTE: “Heavy utilizers” are classified as those who say they have used their insurance more than 10 times in the past 12 months | |||
In addition to problems with their plans, one in five (20 percent) of those who’ve had ACA-compliant coverage for at least a year say there was a time in the last 12 months when they or another family member covered by their plan needed medical care but did not get it because of the cost. Nearly as many (16 percent) say there was a time in the past year when they did not fill a prescription because of the cost.
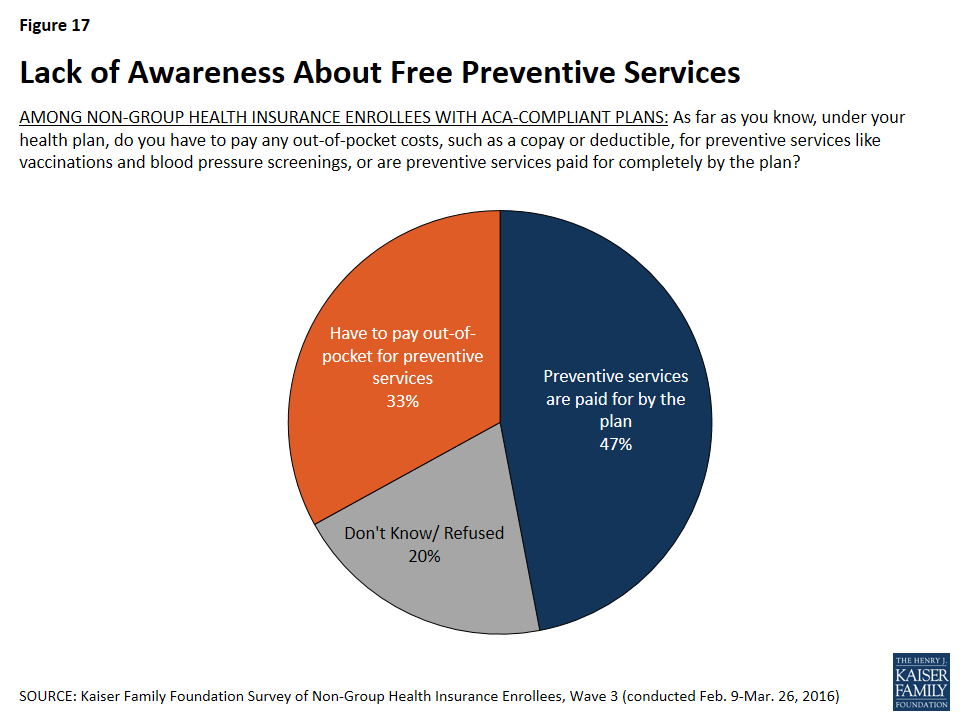
The survey also finds a lack of awareness about new rules for coverage introduced by the ACA. Among all those with ACA-compliant coverage, fewer than half (47 percent) know that preventive services are covered completely by their plans, while a third (33 percent) think that copays or deductibles apply to preventive services and one in five (20 percent) are not sure. Among those in high-deductible plans, awareness is even lower: 41 know that preventive services are covered with no cost-sharing.
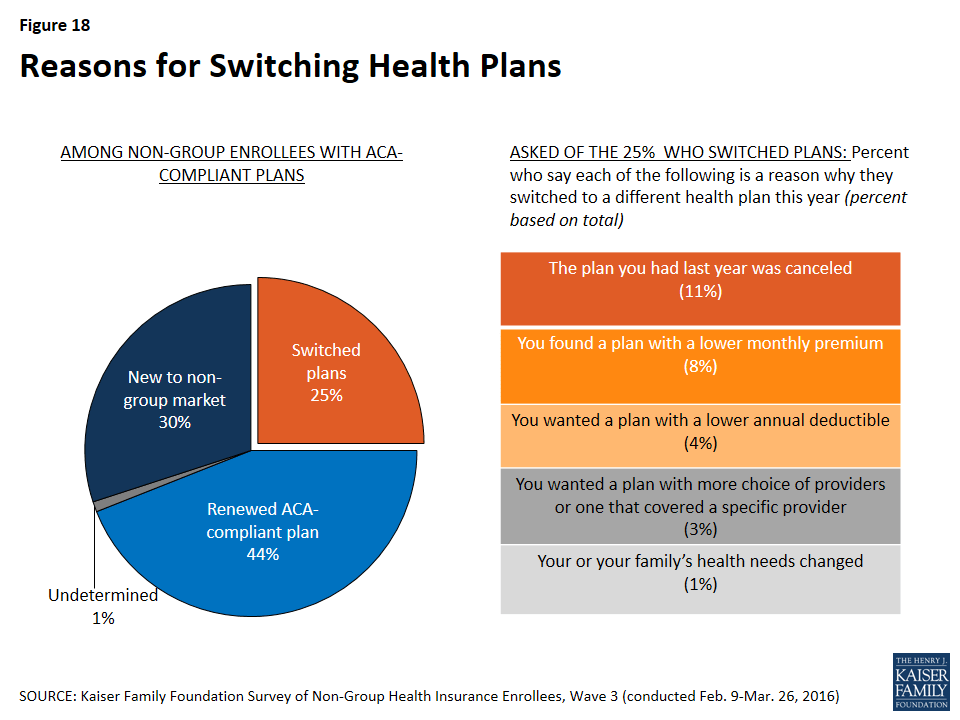
Health Plan Switching
Looking at all those with ACA-compliant non-group plans, three in ten (30 percent) are new to the non-group market this year, and 44 percent report renewing a 2015 plan. Twenty-five percent of all those in ACA-compliant plans, and 23 percent of those in Marketplace plans, say they chose a new plan in the latest open enrollment period.6
Most of those who switched plans either said the plan they had last year was cancelled (11 percent of all those with ACA-compliant plans) or that they found a plan with a lower monthly premium than they would have had to pay to renew their existing plan (8 percent). Smaller shares said they wanted a plan with a lower deductible (4 percent) or that they wanted a plan with a broader choice of providers or one that covered a specific provider (3 percent).
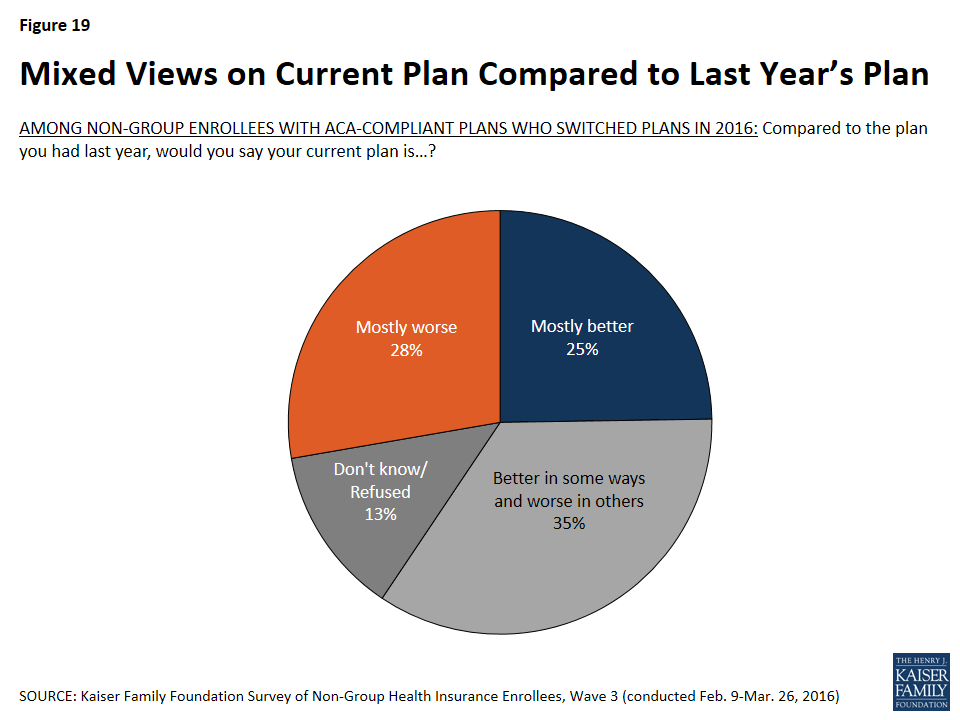
Among those who switched plans in the most recent enrollment period, there is not an overwhelming consensus that their new plan is better or worse than their old plan. Roughly equal shares say their new plan is better (25 percent) and worse (28 percent), with about a third saying it is better in some ways and worse in others (35 percent).
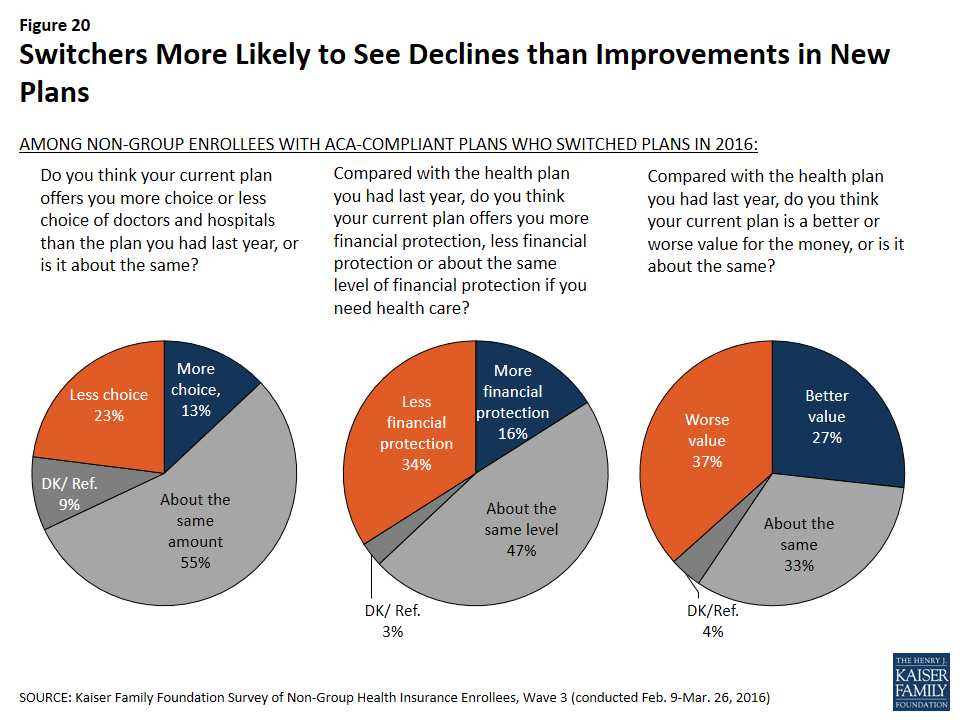
Similarly, large shares of plan switchers say their new plan is about the same as their old plan in terms of the choice of doctors and hospitals (55 percent) and the level of financial protection offered by the plan (47 percent). However, the share saying their new plan is worse on each of these measures is larger than the share saying it’s better: 23 percent say their new plan offers less choice of providers compared with 13 percent who say it offers more choice, and 34 percent say their new plan provides less financial protection compared with 16 percent who say it provides more. The picture is also mixed but tilting negative on value for the money: one-third say their new plan offers about the same value for the money as their old plan, but more see their plan as a worse value (37 percent) than a better one (27 percent).
Experiences with Shopping and Renewing Coverage
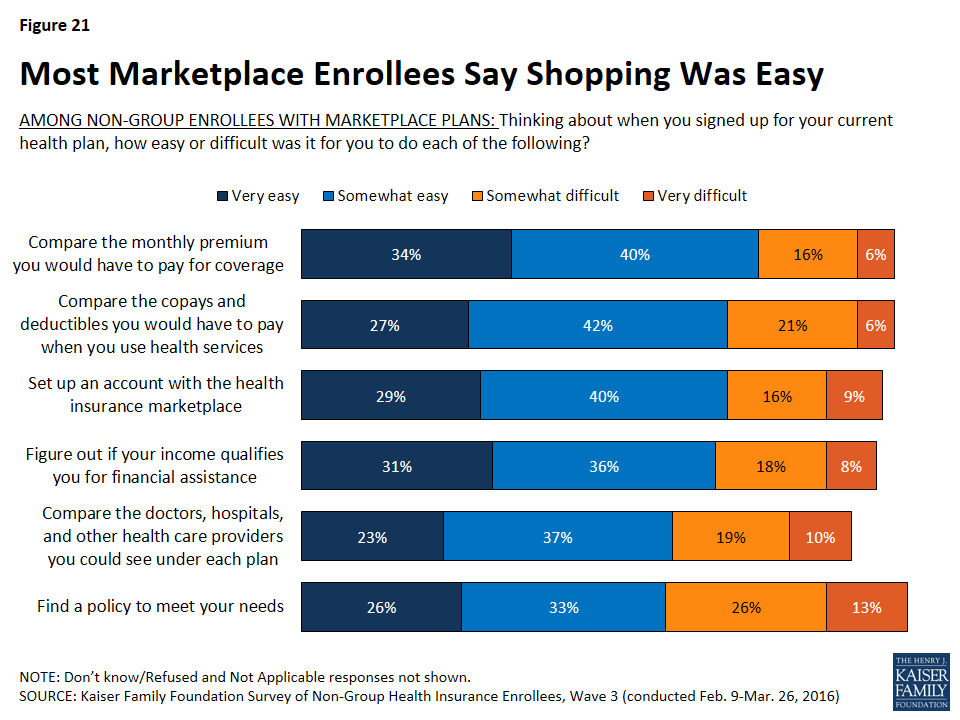
Among those with Marketplace coverage, most say that when they were shopping for their current plan, it was easy to compare premiums, cost-sharing, and provider networks, and to find a policy to meet their needs. While most measures of the shopping experience are similar to 2015, among those with Marketplace plans, the share saying it was difficult to set up an account with the marketplace decreased from 34 percent in 2014 to 25 percent this year.
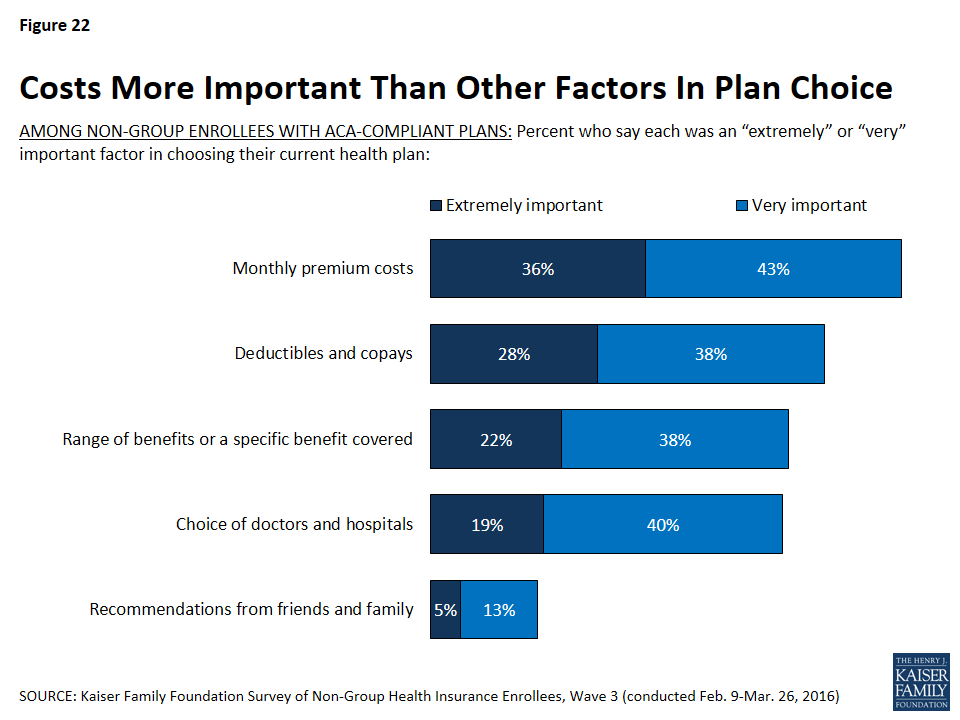
When asked about the most important factors in choosing a plan, non-group enrollees in ACA compliant plans are more likely to cite costs than other factors. The monthly premium cost of the plan (36 percent) was rated most frequently as an “extremely important” factor in plan choice, followed by the amount of deductibles and copays (28 percent). About one in five each said the range of benefits covered (22 percent) and the choice of doctors and hospitals (19 percent) were “extremely important” factors, while very few (5 percent) said the same about recommendations from friends and family.
Among those with ACA-compliant plans, four in ten (39 percent) say they got help with the enrollment or renewal process this year, while about six in ten (59 percent) either auto-renewed or completed the process on their own. These rates are similar to 2015, when 44 percent reported getting help with the enrollment process. Those who are new to the non-group market this year and those who switched plans for 2016 are more likely to say they got help with the enrollment process than those who renewed a 2015 plan (45 percent, 55 percent, and 27 percent respectively). Among all those who got help with enrollment, the most frequently-reported source of assistance was health insurance brokers or agents (15 percent, including 34 percent of those who switched plans), followed by navigators and other enrollment assistance programs (8 percent), family members or friends (7 percent), and health plan representatives (6 percent).
| Table 3: About Four in Ten Non-Group Enrollees Report Getting Help With Enrollment Process | ||||
| Total | New to non-group market | Switched plans for 2016 | Renewed 2015 plan | |
| Someone helped you | 39% | 45% | 55% | 27% |
| Health insurance broker/agent | 15 | 14 | 34 | 6 |
| Navigator/enrollment assistance program | 8 | 11 | 7 | 6 |
| Family member/friend | 7 | 8 | 7 | 6 |
| Health plan representative | 6 | 6 | 5 | 6 |
| Community/county health worker | 1 | 2 | <1 | 1 |
| Someone else | 3 | 3 | 2 | 3 |
| Completed the process on your own | 57 | 53 | 45 | 66 |
| Auto-renewed (Vol.) | 2 | — | — | 4 |
| Don’t know/Refused | 2 | 2 | 1 | 2 |
Opinions of the Affordable Care Act Among Those with Non-group Coverage
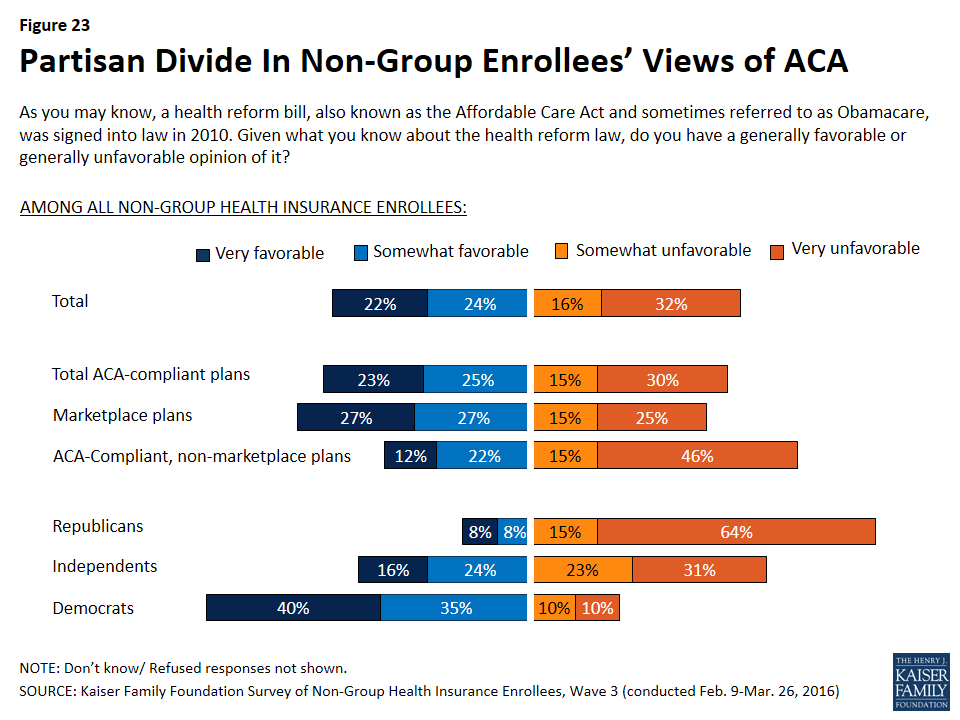
As in previous waves of the survey, and as is true among the general population, overall views of the Affordable Care Act among those with non-group coverage are largely divided, with 46 percent saying they have a favorable view of the law and 48 percent unfavorable. Even among this population – whose views one might expect to be divided more on the basis of experience – the biggest differences in opinion are along partisan lines, with 75 percent of Democrats having a favorable view of the law, 79 percent of Republicans expressing an unfavorable view, and independents divided (40 percent favorable, 44 percent unfavorable). Those with Marketplace coverage are more likely to have a favorable view of the law than those with ACA-compliant, non-Marketplace coverage (54 percent versus 34 percent).
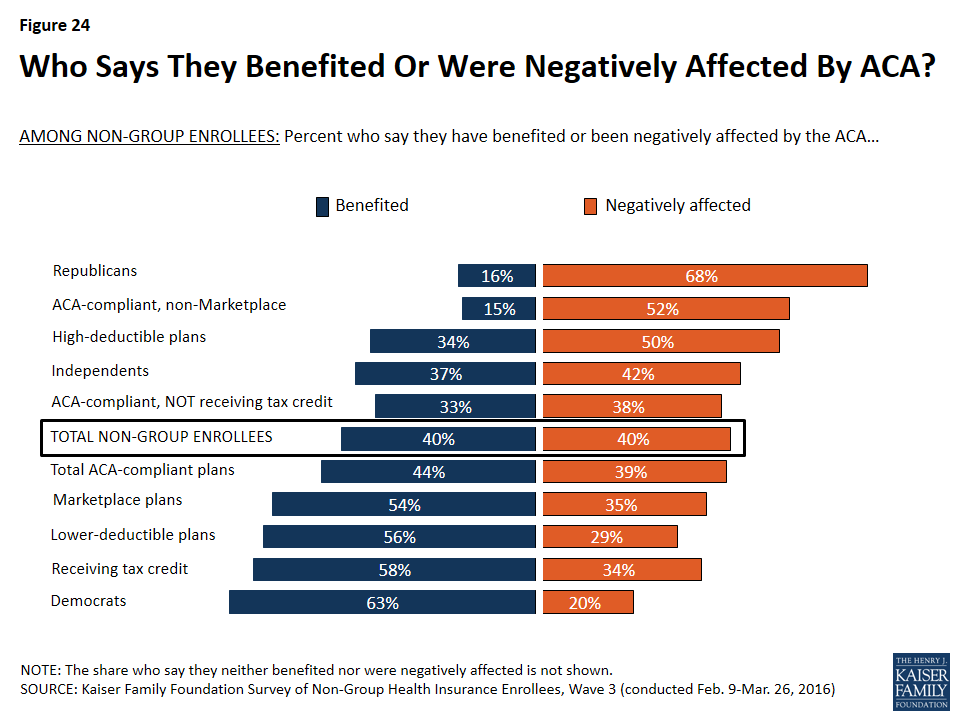
When non-group enrollees overall (including those in both ACA-compliant and non-compliant plans) are asked how they feel the ACA has affected them personally, equal shares say they’ve benefited from the law and been negatively affected by it (40 percent each). The share feeling they’ve benefited from the law is the same as in 2015, but the share feeling they’ve been negatively impacted is up 7 percentage points from 33 percent last year. Similar to last year, the largest divide in how people feel the law has impacted them is partisan, with Democrats overwhelmingly feeling they’ve benefited and Republicans overwhelmingly feeling they’ve been negatively affected. Other differences are evident, too: those in lower-deductible plans, those in Marketplace plans, and those who report getting a tax credit to help pay their premium are more likely to feel they’ve benefited from the law, while those in higher-deductible plans, those not receiving a tax credit, and those with non-Marketplace plans are more likely to feel they’ve been negatively affected.
Discussion
The ACA significantly transformed the non-group insurance market, making it accessible to people who are sick and more affordable for people with lower incomes. Now in its third year of implementation, the ACA has led to substantial increases in non-group enrollment, with 12.7 million people signing up in the recent open enrollment period for 2016. However, enrollment growth appears to be slowing, raising concerns about the potential to attract additional healthy people to the insurance risk pool.7
This series of three surveys of non-group enrollees under the ACA reveals the gains that have been made and the challenges that still remain.
The process for signing up in the Marketplaces is generally seen as easy, and has improved since the early technical problems. Enrollees are largely satisfied with their coverage, including the choice of doctors and hospitals, which is typically narrower than in employer-sponsored health plans. And, many enrollees have been shopping for coverage and switching plans to save money.
At the same time, the share of enrollees who see their plan as a good value has been declining, reflecting growing dissatisfaction with premiums and cost-sharing. Some enrollees who have had their plan for a year or more report expensive drug copays, as well as surprise medical bills and other unexpected expenses they thought their plan covered.
These are important signals to track to identify potential gaps in consumer understanding of how their plans work and the adequacy and transparency of coverage. These trends also could affect the potential for Marketplaces to attract new enrollees – particularly people who are currently healthy – and retain existing consumers.
Methodology
The Kaiser Family Foundation (KFF) Survey of Non-Group Health Insurance Enrollees is the third in a series of surveys examining the views and experiences of people who purchase their own health insurance, including those whose coverage was purchased through a state or federal Health Insurance Marketplace and those who bought coverage outside the Marketplaces. The survey was designed and analyzed by researchers at KFF. Social Science Research Solutions (SSRS) collaborated with KFF researchers on sample design and weighting, and supervised the fieldwork. KFF paid for all costs associated with the survey.
The survey was conducted by telephone from February 9 through March 26, 2016 among a random sample of 786 adult U.S. residents who purchase their own insurance. Computer-assisted telephone interviews conducted by landline (293) and cell phone (493 including 302 who had no landline telephone) were carried out in English and Spanish by SSRS. Respondents were considered eligible for the survey if they met the following criteria:
- Between the ages of 18-64
- Currently covered by health insurance that they purchase themselves or purchased insurance that would begin in the next month
- Not covered by health insurance through an employer, COBRA, Medicare, Medicaid, a parent’s plan, or the U.S. military or VA
- If a small business owner, the health insurance they purchase is only for themselves and/or their family, and does not cover non-related employees of their business
Because the study targeted a low-incidence population, the sample was designed to increase efficiency in reaching this group, and consisted of three parts: (1) respondents reached through random digit dialing (RDD) landline and cell phone (N=142); (2) respondents reached by re-contacting those who indicated in a previous RDD survey that they either purchased their own insurance or were uninsured (N=234); (3) respondents reached as part of the SSRS Omnibus survey (N=410), a weekly, nationally representative RDD landline and cell phone survey. All RDD landline and cell phone samples were generated by Marketing Systems Group.
A multi-stage weighting process was applied to ensure an accurate representation of the national population of non-group enrollees ages 18-64. The first stage of weighting involved corrections for sample design, including accounting for the likelihood of non-response for the re-contact sample, number of eligible household members for those reached via landline, and a correction to account for the fact that respondents with both a landline and cell phone have a higher probability of selection. In the second weighting stage, demographic adjustments were applied to account for systematic non-response along known population parameters. No reliable administrative data were available for creating demographic weighting parameters for this group, since the most recent Census figures could not account for the changing demographics of non-group insurance enrollees brought about by the ACA. Therefore, demographic benchmarks were derived by compiling a sample of all respondents ages 18-64 interviewed on the SSRS Omnibus survey during the field period (N=7,601) and weighting this sample to match the national 18-64 year-old population based on the 2015 U.S. Census Current Population Survey March Supplement parameters for age, gender, education, race/ethnicity, region, population density, marital status, and phone use. This sample was then filtered to include respondents qualifying for the current survey, and the weighted demographics of this group were used as post-stratification weighting parameters for the standard RDD and omnibus samples (including gender, age, education, race/ethnicity, marital status, income, and population density). A final adjustment was made to the full sample to control for previous insurance status (estimated based on the combined RDD and omnibus samples), to address the possibility that the criteria used in selecting the prescreened sample could affect the estimates for previous insurance status.
Weighting adjustments had a minor impact on the overall demographic distribution of the sample, with the biggest adjustments being made based on age (this is common in all telephone surveys, as younger respondents are the most difficult to reach and convince to participate). Weighted and unweighted demographics of the final sample are shown in the table below.
| Unweighted % of total | Weighted % of total | ||
| Age | 18-24 | 7% | 12% |
| 25-29 | 8 | 11 | |
| 30-39 | 13 | 16 | |
| 40-49 | 16 | 21 | |
| 50-64 | 56 | 40 | |
| Refused | * | * | |
| Gender | Male | 48 | 49 |
| Female | 52 | 51 | |
| Education | Less than high school graduate | 4 | 6 |
| High school graduate | 20 | 26 | |
| Some college | 27 | 28 | |
| Graduated college | 31 | 25 | |
| Graduate school or more | 16 | 13 | |
| Technical school/other | 1 | 1 | |
| Refused | * | * | |
| Race/Ethnicity | White, non-Hispanic | 74 | 67 |
| Black, non-Hispanic | 7 | 9 | |
| Hispanic | 8 | 11 | |
| Other/Mixed | 8 | 10 | |
| Refused | 3 | 3 | |
| Self-reported health status | Excellent | 22 | 23 |
| Very good | 32 | 32 | |
| Good | 29 | 27 | |
| Fair | 13 | 14 | |
| Poor | 4 | 5 |
All statistical tests of significance account for the effect of weighting. The margin of sampling error (MOSE) including the design effect is plus or minus 4 percentage points for results based on the total sample. Unweighted Ns and MOSE for key subgroups are shown in the table below. For other subgroups the margin of sampling error may be higher.
| Group | N (unweighted) | MOSE |
| Total non-group enrollees | 786 | ±4 percentage points |
| ACA-compliant plans | 671 | ±5 percentage points |
| Marketplace plans | 512 | ±5 percentage points |
Endnotes
- Throughout this report, “ACA-compliant plans” refers to plans purchased after January 1, 2014, while “non-ACA-compliant plans” are those purchased before that date. ↩︎
- For full methodological details for comparison data from Kaiser Health Tracking Polls, see: March 2016 (https://modern.kff.org/report-section/kaiser-health-tracking-poll-march-2016-methodology/), March 2015 (https://modern.kff.org/report-section/kaiser-health-tracking-poll-march-2015-methodology/), and May 2014 (https://modern.kff.org/report-section/kaiser-health-tracking-poll-may-2014-methodology/) ↩︎
- Throughout this report, individuals in Marketplace plans are those who say they purchased their plan from a state or federal Marketplace, those who report purchasing a Marketplace plan from an insurance broker or agent or directly from an insurance company, and those who say they are receiving an advance premium tax credit or that their premium is reduced based on their income. ↩︎
- Sample size for those who report being in a pre-ACA, non-compliant plan is insufficient to analyze and report on. ↩︎
- M. Rae, L. Levitt, G. Claxton, et al., “Patient Cost-Sharing in Marketplace Plans, 2016,” Kaiser Family Foundation, November 2015. https://modern.kff.org/health-costs/issue-brief/patient-cost-sharing-in-marketplace-plans-2016/ ↩︎
- Among current Marketplace enrollees who had non-group coverage in 2015, 35 percent report switching plans in 2016. The Department of Health and Human Services (HHS) reports that 43 percent of consumers re-enrolling in Marketplace coverage in HealthCare.gov states switched plans. The difference between these two estimates is likely due to the fact that the survey data are self-reported while the HHS is using administrative records in reporting. See HHS Issue Brief: https://aspe.hhs.gov/pdf-report/health-insurance-marketplaces-2016-open-enrollment-period-final-enrollment-report ↩︎
- L. Levitt, G. Claxton, A. Damico, and C. Cox, “Assessing ACA Marketplace Enrollment,” Kaiser Family Foundation, March 2016. https://modern.kff.org/health-reform/issue-brief/assessing-aca-marketplace-enrollment ↩︎