KFF Health Tracking Poll: Health Care Costs in the Current Moment of Economic Anxiety
Findings
Multiple recent polls have found that economic anxiety in the U.S. is on the rise, and decades of KFF polling show how the rising cost of health care is a key component of people’s economic concerns. New data from the KFF Health Tracking Poll provide additional insights into who is struggling most in the current economy and how the cost of health care factors into those struggles. Overall, it shows that younger adults, LGBT adults, Hispanic adults, and those with more modest incomes are some of the groups most likely to report problems earning a living and affording health care and other necessities. Large shares of those who are uninsured or purchase their own insurance also report challenges earning a living and paying for care. Those with higher incomes are not immune from the problem of health care affordability; about one in five of those with incomes of $90,000 or more say their household had problems affording health care (19%) or prescription drugs (18%) in the past year.
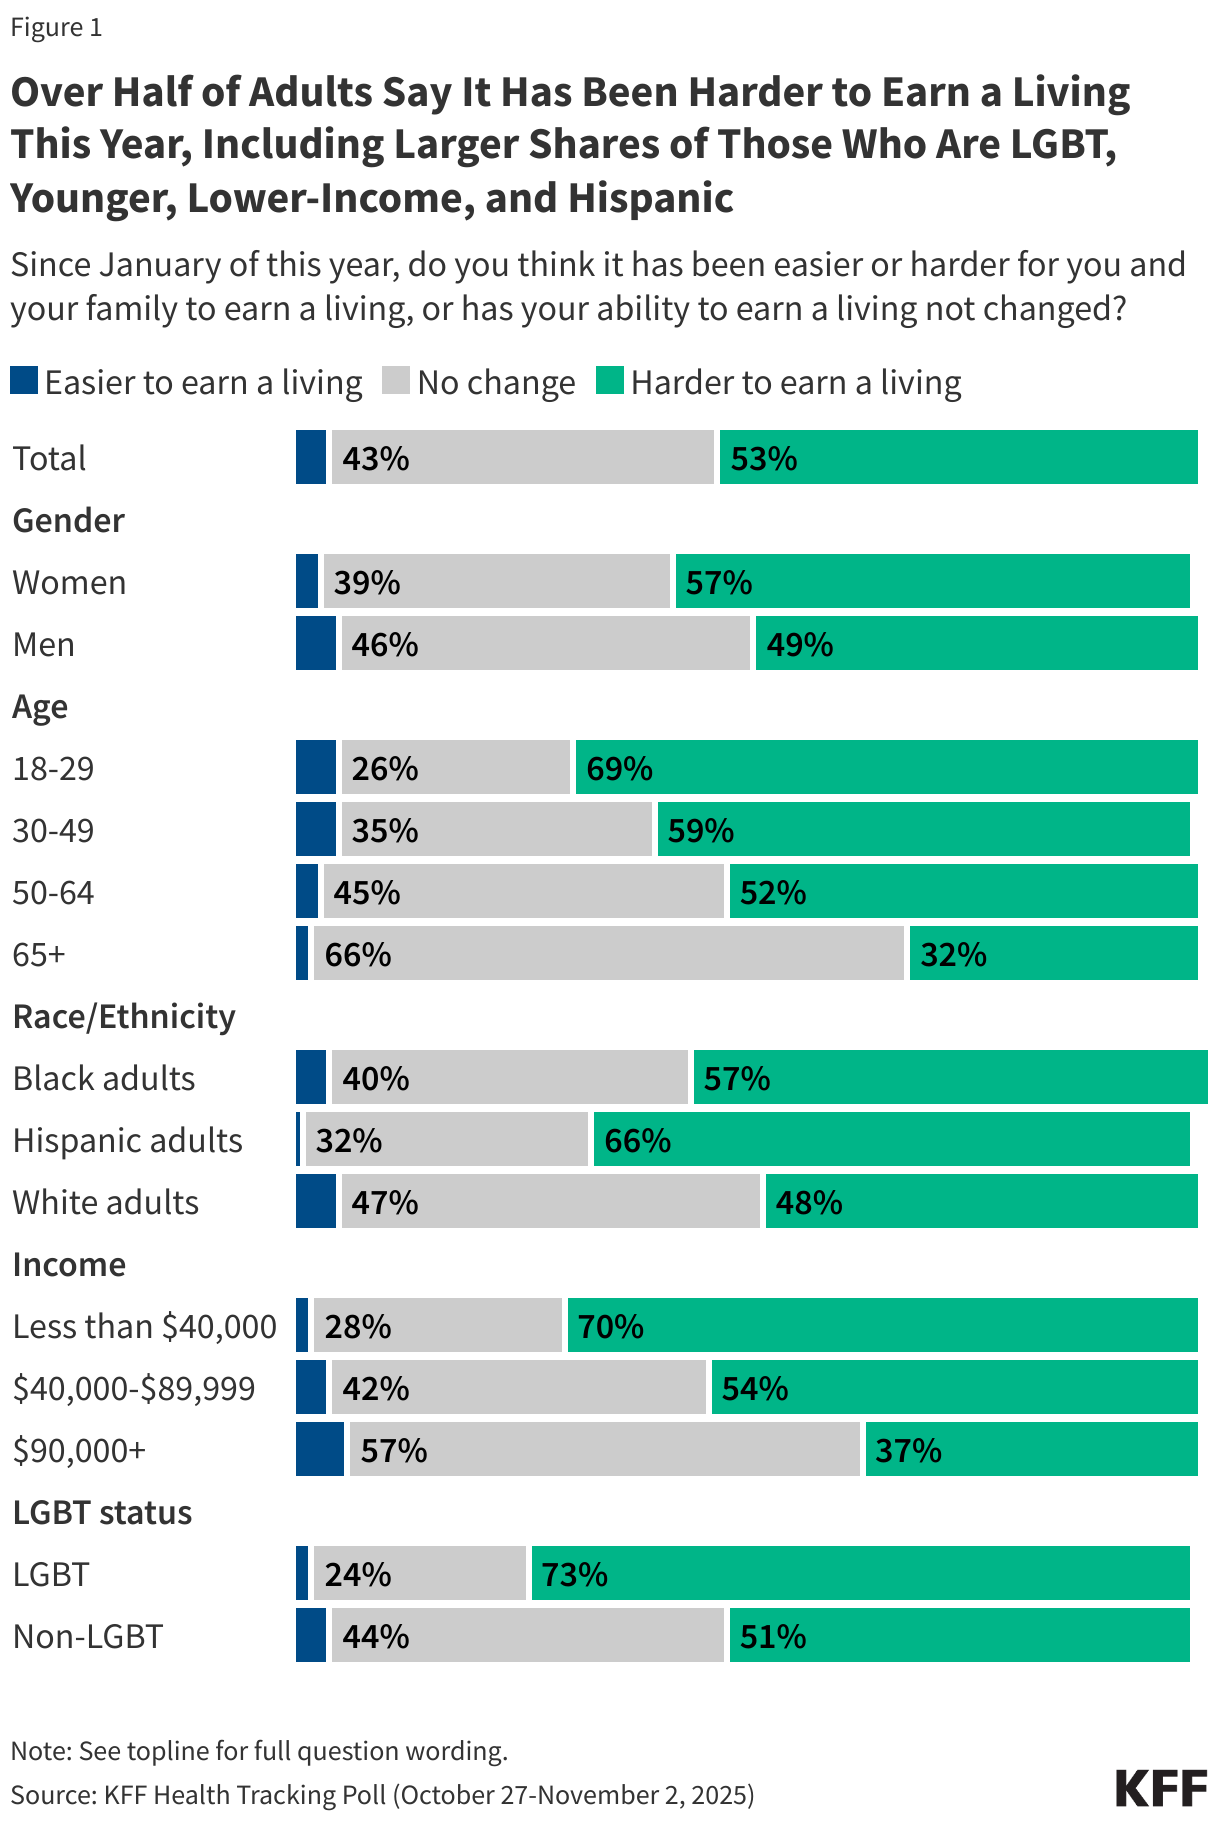
Many adults are struggling to earn a living, particularly those who are LGBT, younger, Hispanic, and living in lower-to-moderate income households. A little over half (53%) of U.S. adults overall say it has been harder for them and their family to earn a living since January, while just 4% say it has been easier and four in ten (43%) say their ability to earn a living hasn’t changed. The share who report difficulty earning a living is higher among certain groups, with nearly three-quarters of LGBT adults (73%), seven in ten of those with household incomes under $40,000 (70%) and those ages 18-29 (69%), and two-thirds of Hispanic adults (66%) saying it has been harder to earn a living this year. Women are also somewhat more likely to report difficulty earning a living compared to men (57% vs. 49%).
Very few across groups say it has been easier for them and their family to earn a living this year, though the share is slightly higher among those with incomes of $90,000 or more (6%) compared to those with incomes under $40,000 (2%).
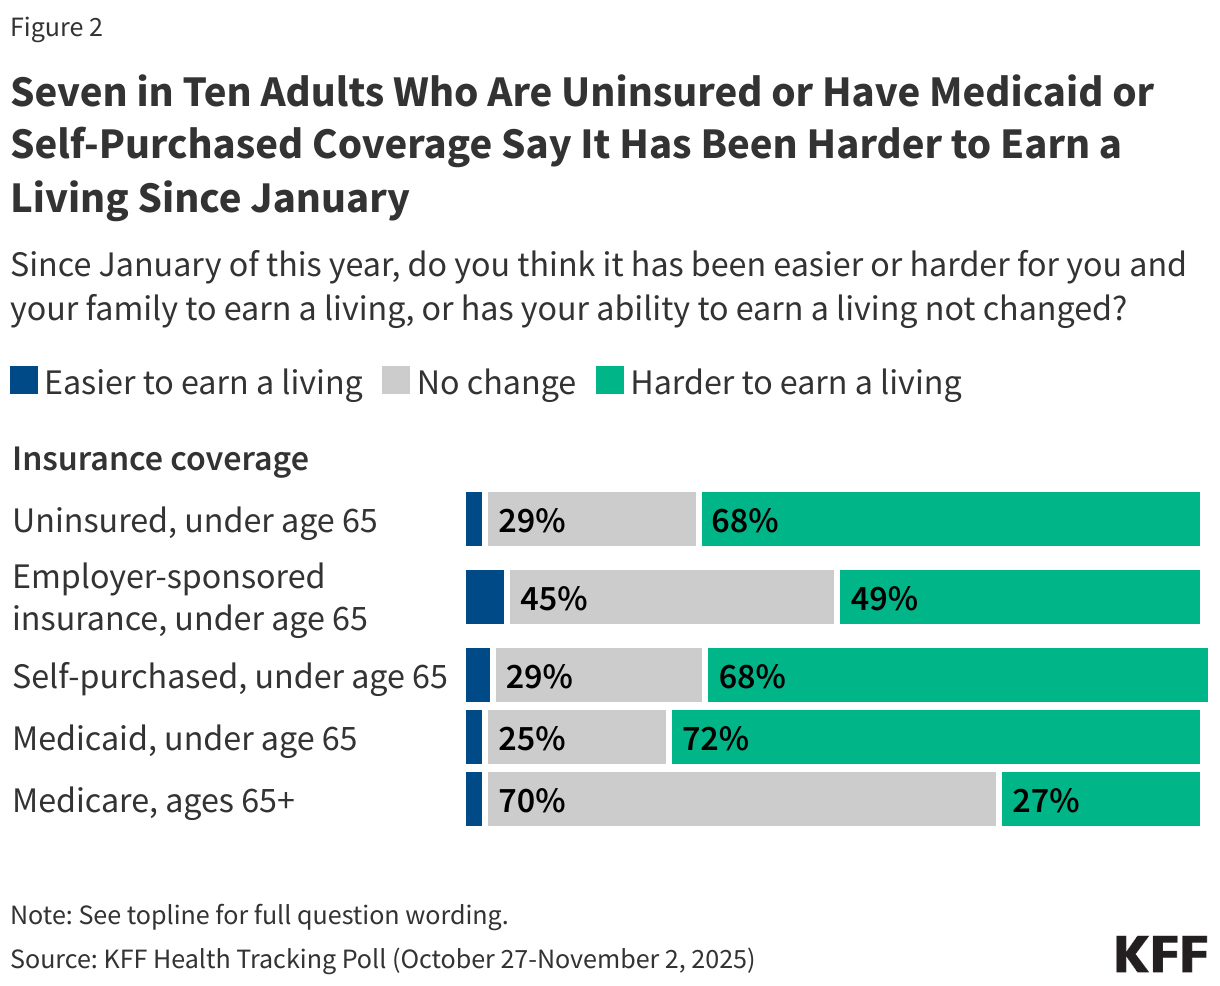
Uninsured adults and those with Medicaid or self-purchased insurance are more likely than those with employer coverage or Medicare to report difficulty earning a living. About seven in ten adults under age 65 who are uninsured (68%) or covered by Medicaid (72%) say it has been harder for them and their families to earn a living since January. The share is similar (68%) among those who purchase their own insurance, many of whom are self-employed or work in small businesses. By comparison, about half (49%) of those covered by an employer and just a quarter (27%) of adults ages 65 and over with Medicare coverage say it has been harder for them and their families to earn a living this year.
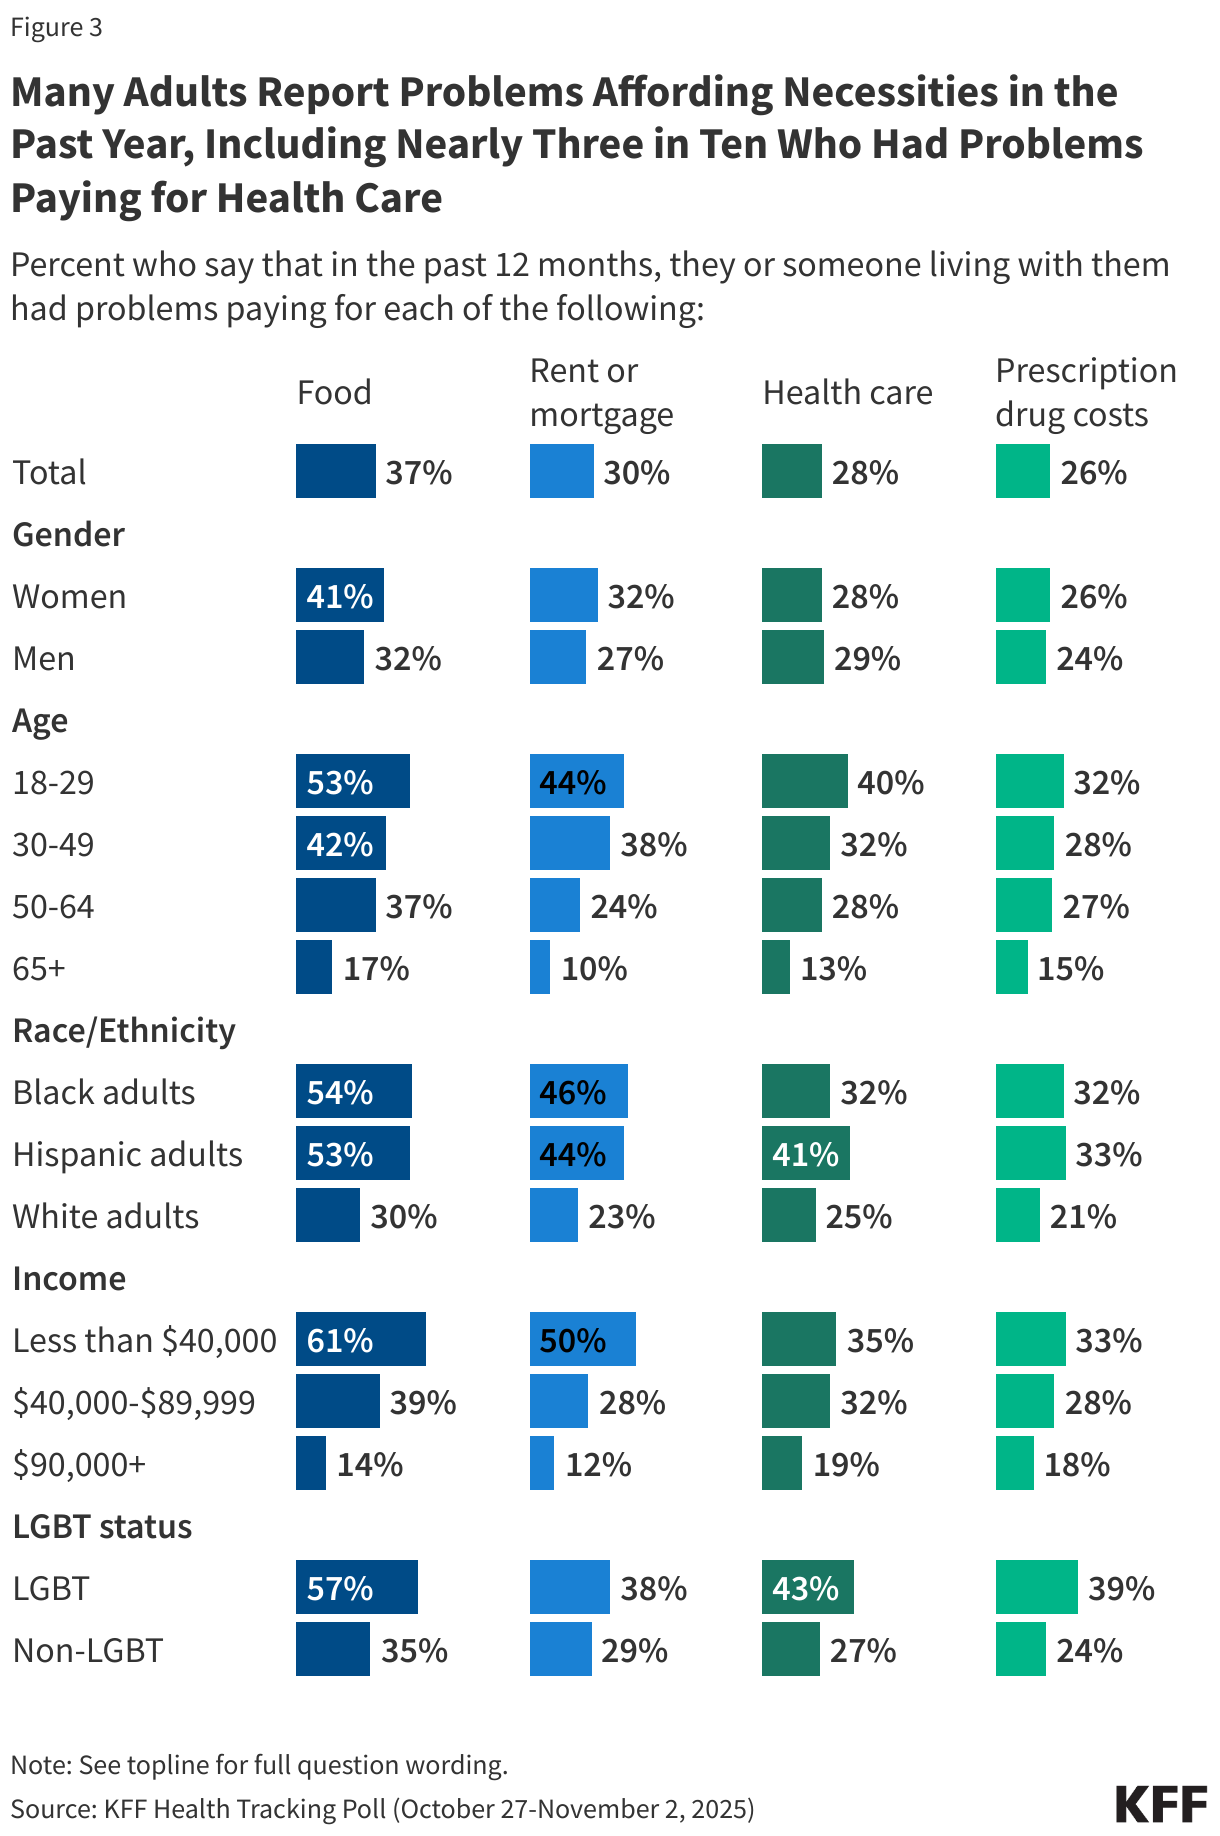
The cost of health care and prescription drugs is an important component of the financial struggles facing individuals and families in the current economy. Nearly four in ten adults overall (37%) report that their household had problems paying for food in the past year, while three in ten (30%) said they had problems paying their rent or mortgage. Problems affording health care are also common, with about three in ten (28%) saying they had problems paying for health care, up slightly from 23% in May 2025, and about a quarter (26%) reporting problems affording prescription drugs.
Problems affording each of these necessities are more common among the same groups who are most likely to say it’s been harder for their families to earn a living since January. For example, about six in ten of those in households earning less than $40,000 a year (61%) and at least half of LGBT adults (57%), Black adults (54%), Hispanic adults (53%), and adults under age 30 (53%) say their household had problems paying for food in the past twelve months.
Four in ten LGBT adults (43%), Hispanic adults (41%) and younger adults (40%) report problems paying for health care, higher than their non-LGBT, White, and older counterparts. While problems with health care affordability are somewhat higher among those with lower and moderate incomes, people with higher incomes are not immune. About one in five adults in households earning at least $90,000 a year say they had problems affording health care (19%) or prescription drugs (18%) in the past year.
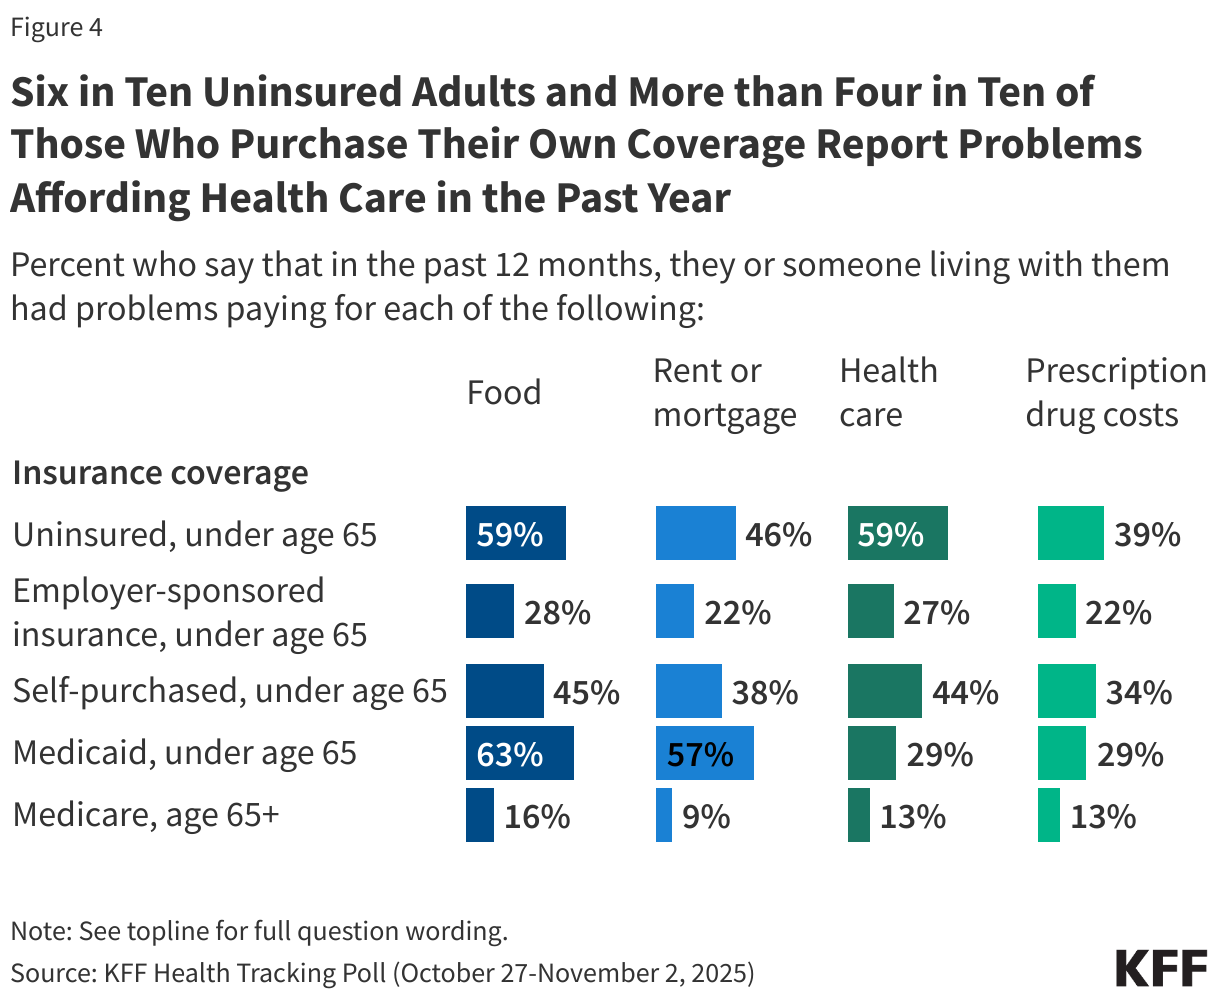
Six in ten (59%) uninsured adults report problems paying for health care in the past year, as do more than four in ten (44%) of those who purchase their own coverage. Large shares of the uninsured and those who purchase their own coverage also report problems affording food (59% and 45%, respectively), housing (46% and 38%), and prescription drugs (39% and 34%). If Congress does not act before the end of this year to extend the enhanced premium tax credits for individuals who purchase coverage through the ACA Marketplace, those who purchase their own coverage are likely to face increasing financial hardship in the coming year.
Likely reflecting their lower incomes, about six in ten adults ages 18-64 with Medicaid coverage report problems paying for food (63%) and housing (57%) in the past year. Medicaid offers this population some protection from health care expenses, but still about three in ten say they had problems affording health care (29%) or prescription drugs (29%) in the past twelve months.
Methodology
This KFF Health Tracking Poll was designed and analyzed by public opinion researchers at KFF. The survey was conducted October 27-November 2, 2025, online and by telephone among a nationally representative sample of 1,350 U.S. adults in English (n=1,274) and in Spanish (n=76). The sample includes 1,031 adults (n=63 in Spanish) reached through the SSRS Opinion Panel either online (n=1,007) or over the phone (n=24). The SSRS Opinion Panel is a nationally representative probability-based panel where panel members are recruited randomly in one of two ways: (a) Through invitations mailed to respondents randomly sampled from an Address-Based Sample (ABS) provided by Marketing Systems Groups (MSG) through the U.S. Postal Service’s Computerized Delivery Sequence (CDS); (b) from a dual-frame random digit dial (RDD) sample provided by MSG. For the online panel component, invitations were sent to panel members by email followed by up to three reminder emails.
Another 319 (n=13 in Spanish) adults were reached through random digit dial telephone sample of prepaid cell phone numbers obtained through MSG. Phone numbers used for the prepaid cell phone component were randomly generated from a cell phone sampling frame with disproportionate stratification aimed at reaching Hispanic and non-Hispanic Black respondents. Stratification was based on incidence of the race/ethnicity groups within each frame. Among this prepaid cell phone component, 143 were interviewed by phone and 176 were invited to the web survey via short message service (SMS).
Respondents in the prepaid cell phone sample who were interviewed by phone received a $15 incentive via a check received by mail. Respondents in the prepaid cell phone sample reached via SMS received a $10 electronic gift card incentive. SSRS Opinion Panel respondents received a $5 electronic gift card incentive (some harder-to-reach groups received a $10 electronic gift card). In order to ensure data quality, cases were removed if they failed two or more quality checks: (1) attention check questions in the online version of the questionnaire, (2) had over 30% item non-response, or (3) had a length less than one quarter of the mean length by mode. Based on this criterion, one case was removed.
The combined cell phone and panel samples were weighted to match the sample’s demographics to the national U.S. adult population using data from the Census Bureau’s 2024 Current Population Survey (CPS), September 2023 Volunteering and Civic Life Supplement data from the CPS, and the 2025 KFF Benchmarking Survey with ABS and prepaid cell phone samples. The demographic variables included in weighting for the general population sample are gender, age, education, race/ethnicity, region, civic engagement, frequency of internet use and political party identification. The weights account for differences in the probability of selection for each sample type (prepaid cell phone and panel). This includes adjustment for the sample design and geographic stratification of the cell phone sample, within household probability of selection, and the design of the panel-recruitment procedure.
The margin of sampling error including the design effect for the full sample is plus or minus 3 percentage points. Numbers of respondents and margins of sampling error for key subgroups are shown in the table below. For results based on other subgroups, the margin of sampling error may be higher. Sample sizes and margins of sampling error for other subgroups are available on request. Sampling error is only one of many potential sources of error and there may be other unmeasured error in this or any other public opinion poll. KFF public opinion and survey research is a charter member of the Transparency Initiative of the American Association for Public Opinion Research.
| Group | N (unweighted) | M.O.S.E. |
|---|---|---|
| Total | 1,350 | ± 3 percentage points |
| Party ID | ||
| Democrats | 424 | ± 6 percentage points |
| Independents | 422 | ± 6 percentage points |
| Republicans | 412 | ± 6 percentage points |
| MAGA Republicans | 377 | ± 6 percentage points |
| Adults who have ever used GLP-1 drugs | 239 | ± 8 percentage points |