Where is Medicaid Spending Headed?

Published: Nov 29, 1996

This content package page includes a report providing an overview of the changes in Medicaid expenditures since 1988, including an analysis of the slowdown in Medicaid growth since 1992. Also included in the package is a press release, chart pack and fact sheet on Medicaid spending and enrollment trends.

Where is Medicaid Spending Headed? – Report

Published: Nov 29, 1996

Where is Medicaid Spending Headed?

Prepared for: The Kaiser Commission on the Future of Medicaid

Prepared by: John Holahan and David Liska, The Urban Institute

December 1996

In 1995, the United States witnessed a major debate over the future course of the Medicaid program. At the heart of this debate were the individual entitlement to benefits, the desire to limit federal spending, and the degree of control and flexibility given to states over their separate programs. The Congress proposed that the Medicaid program be repealed and replaced with a block grant to states; states would be given fixed allocations of federal dollars as well as broad flexibility on how these funds would be spent on health care for low-income individuals. The Clinton Administration, in contrast, would have kept the Medicaid entitlement but would have placed a cap on spending per enrollee-again with considerable increases in state flexibility.

Much of the impetus behind the calls for major program restructuring came from the rapid growth in Medicaid expenditures that occurred between 1988 and 1992. Medicaid spending was argued to be “out of control” and a major financial burden to states. The program was also viewed as “out of control” from the perspective of the federal government, as well as a major contributor to the federal deficit. In April 1996, the Congressional Budget Office (CBO) forecast that Medicaid spending would grow by about 10 percent per year through the year 2002, faster than the projected increases in inflation and in the US. population.

In this paper we first discuss reasons for the rapid growth in Medicaid spending between 1988 and 1992. We then show that Medicaid spending has, in fact, slowed considerably since 1992 and argue that this slowdown is likely to continue. After growing by an average annual rate of 22.4 percent between 1988 and 1992, Medicaid expenditures increased by an average of 9.5 percent each year between 1992 and 1995. Furthermore, although the data are preliminary, 1995-1996 spending growth for Medicaid appears to be about 3.2 percent.

This dramatic reduction in the rate of spending growth is attributable to a number of factors. First, the rapid growth that marked the 1988-1992 period has been curtailed by federal legislation limiting use of provider taxes and donations and placing a ceiling on disproportionate share hospital (DSH) payments. Second, general and medical price inflation are substantially lower today than in the earlier period. Third, the factors propelling rapid enrollment growth have diminished considerably-much of the increase in enrollment was a response to federal and state expansions in eligibility for low-income pregnant women and children, the recession, and court decisions and regulatory changes involving coverage for individuals with disabilities. Finally, Medicaid spending has slowed because of state cost containment efforts, including increased enrollment of Medicaid beneficiaries in capitated managed care arrangements.

The Medicaid Growth Explosion from 1988 to 1992

Between 1988 and 1992, Medicaid expenditures grew on average by 22.4 percent per year, increasing from $53.5 billion in 1988 to $119.9 billion in 1992. As shown in Table 1, expenditures on the elderly and disabled grew each year by an average of 14.7 percent and 17.0 percent, respectively. Spending on adults and children grew from $13.1 billion to $30.9 billion, an average annual increase of 23.9 percent. While spending on adults and children grew more rapidly in percentage terms than did spending on the elderly and blind and disabled, the impact on total spending was mitigated by lower per capita costs for adults and children .

Table 2 shows that Medicaid enrollment increased from 22.0 million to 29.8 million Americans from 1988 to 1992. Increases in the enrollment of the elderly were relatively slow, increasing from 3.1 to 3.5 million, or 3.2 percent per year. There was, however, substantial growth in coverage of the disabled, with enrollment increasing from 3.4 to 4.5 million, or by 6.7 percent per year. The high annual cost of covering the disabled means that this expansion has been extremely important to the cost of the program. The number of adults and children increased from 15.4 to 21.8 million, an average annual increase of 9.0 percent.

There are a large number of reasons for the growth in Medicaid expenditures during this period. Although precise contributions are difficult to quantify, the following factors seem to be particularly significant: DSH payments, enrollment, and costs per enrollee. An earlier analysis conducted for the Kaiser Commission on the Future of Medicaid found that all of these factors were important contributors to spending growth in this period.1

First, an important contributor to the large increase in Medicaid spending during this period was the aggressive use of provider taxes and donations and Disproportionate Share Hospital (DSH) payments.2 These arrangements brought federal dollars to states, with the funds largely distributed to hospitals providing disproportionate amounts of care to low-income individuals. The typical practice was for states to require provider contributions or impose taxes on providers-Medicaid programs would then increase payments to the same providers through DSH payments. These DSH payments would return much, if not all, of the hospital’s donation or tax payment; the state could then claim federal matching funds for the DSH payment to the hospital. In many cases, these funds were used to assist hospitals in supporting indigent care for low-income individuals. In others, federal funds substituted for expenditures states would have otherwise made, and leaving total health expenditures for health care relatively the same. However these funds were used, it had a major impact on Medicaid expenditure growth during this period. DSH payments accounted for about $400 million in 1988 and grew to more than $17 billion by 1992.

The second major factor related to increases in enrollment. A series of legislative mandates extended Medicaid coverage to pregnant women and children and to the elderly and disabled. In the late 1980’s, Medicaid ended the exclusive link between participation in the Aid to Families with Dependent Children (AFDC) program and access to Medicaid coverage. By 1990, federal law required coverage of all pregnant women, infants, and children under age six with incomes below 133 percent of the federal poverty line regardless of AFDC recipiency. States were given the option to extend coverage to pregnant women and infants up to 185 percent of the poverty line with federal matching payments and 33 states have done so. States are now required to cover children ages 6 through 12 up to the federal poverty line. Poor children ages 13 to 18 are scheduled to be phased in by the year 2002. Between 1988 and 1992, 4.5 million pregnant women and children were covered through these mandates.3These new eligible groups composed about 50 percent of the total increase in enrollment, though they accounted for a substantially lower share of total spending growth.4

Congress also extended Medicaid eligibility to elderly and disabled Medicare beneficiaries. The Medicare Catastrophic Coverage Act of 1988 and the Omnibus Budget Reconciliation Act of 1990 required Medicaid programs to cover Medicare costs for low-income persons not eligible for cash assistance-Qualified Medicare Beneficiaries (QMBs). States are required to cover Medicare premiums and cost sharing for all Medicare eligible persons with incomes below the federal poverty line. By 1995, this was extended to premium assistance for Medicare eligibles with incomes between 100 percent and 120 percent of poverty. Because of data limitations, it is difficult to know how many enrollees have been covered by these provisions; one estimate is that there are 1.3 million low-income elderly and disabled in 1995 who received premium assistance through the QMB legislation and would not have otherwise qualified for Medicaid.5

Medicaid also expanded during these years because of the recession and in concert with other related programs. For example, between 1988 and 1991, AFDC enrollment increased by 15.6 percent and food stamp enrollment by about 20 percent. States also took a number of steps to simplify the eligibility and enrollment processes during this period.

Supplemental Security Income (SSI) program enrollment also grew because of court decisions, principally the Zebley court decision which increased coverage for disabled children. More important, at the same time, a regulatory broadening of the list of qualifying medical conditions affecting disabled children, as mandated by Congress, also expanded SSI enrollment and Medicaid eligibility. During these years, many states and localities intensified efforts to enroll individuals who would have otherwise been covered by state or local general assistance programs in SSI to obtain the federal cash contributions as well as Medicaid coverage. Another cause of Medicaid enrollment growth during this period was SSI coverage of many individuals with acquired immunodeficiency syndrome (AIDS), substance abuse problems, and other social and medical problems.

Third, increased in health care prices are an important contributor to Medicaid expenditure growth and yet are largely outside the control of the program. Medical price inflation accounted for about one third of Medicaid spending growth between 1988 and 1992.6 While states did not strictly have to increase provider payment rates with inflation, it has proven difficult over the long term to allow these rates to continue to diverge widely from private and Medicare rates without eroding provider participation in Medicaid. Furthermore, the Boren Amendment requires states to pay the cost of efficiently and economically operated facilities such as hospitals and nursing homes; the costs of such facilities have clearly increased with inflation as a direct result of wage costs, among other factors.

Another factor contributing to Medicaid expenditure increases during this period was growth in utilization, in part due to changes in the average health status of enrollees. Average Medicaid utilization rates increased because of changes in the population gaining coverage. For example, expansions to cover pregnant women would automatically bring in a group that will incur health care expenditures higher than an average adult. Increased coverage of AIDS patients and substance abusers also adds high-cost groups. The 1989 amendments to the Early and Periodic Screening Diagnosis and Treatment (EPSDT) program for children, which required additional screening services-plus Medicaid coverage of all needed services irrespective of their coverage under a particular state benefit package-also increased costs.

Medicaid’s financial role in nursing home care also expanded during this time. While the number of nursing home beneficiaries grew only modestly, the role of Medicaid financing increased because of newly enacted protections against spousal impoverishment that reduced the cost for nursing home residents whose spouses continued to live in the community. Medicaid expenditures during this period also grew in many states because of greater availability of Medicaid-financed long term care in the community and at home and reportedly because of more widespread divestiture of assets to become eligible for nursing home benefits.

Finally, states became increasingly aggressive during this period in shifting services to Medicaid that had previously been financed by other state and federal programs.7 This practice, known as “Medicaid maximization,” results in the shift of services that have formerly been paid for by state only dollars on to Medicaid where they receive federal matching payments. These services include state-funded institutional services for the developmentally disabled and mentally ill, and home and community-based services for the disabled funded under Title XX.

The Slowdown in Medicaid Expenditure Growth, 1992 to 1995

Following four years of rapid expansion, Medicaid program growth slowed precipitously after 1992. After four years with an average annual growth rate of 22.4 percent, Medicaid spending grew on average by 9.5 percent per year between 1992 and 1995 (Table 1). Spending increased from $119.9 billion in 1992 to $157.3 in 1995. Annual increases in spending continued to be higher for families (12.1 percent) than for the disabled (11.3 percent) and for the elderly (7.9 percent). Preliminary data suggest that Medicaid expenditures grew by about 3.2 percent in 1996. The low 1996 growth probably, at least partially, reflects an acceleration of state spending in 1995 because of proposed legislation to restructure Medicaid that would have used 1995 data as the basis for distribution of block grants. Looking across 1994 and 1996, however, the average annual spending growth is about 6 percent per year.

Disproportionate Share Hospital Payments (DSH)

There are several reasons for the decline in Medicaid spending growth. An important reason the growth in Medicaid expenditures have declined is because of 1991 and 1993 legislation affecting the use of disproportionate share payments.8 As shown in Table 1, disproportionate share payments increase by only 2 percent per year between 1992 and 1995, after several years of explosive growth. In 1991, legislation banned the use of provider donations and severely restricted the kinds of provider taxes that states could employ. In effect, states could no longer make a guarantee that a hospital could be “made whole” for a donation or tax payment through reciprocal DSH payments. The 1991 legislation also capped DSH payments to 12 percent of program expenditures. Any state whose DSH payments exceeded 12 percent would be frozen at 1993 levels until DSH payments were at 12 percent of Medicaid expenditures. The states whose DSH payments were below 12 percent were allowed to grow at the same rate as program spending. Because program spending has slowed, the allowed rate of growth in DSH payments has also slowed. The 1993 legislation restricted the level of DSH payments to hospitals. States could no longer pay a hospital more than that facility was losing through low Medicaid reimbursement rates or through the provision of uncompensated care. This severely restricted states’ ability to pay large amounts of money to specific hospitals and has reduced Medicaid expenditures in some of these states.

Return to top

Where is Medicaid Spending Headed?:Press Release Fact Sheet Report Part One Part Two Tables and References
Poll Finding

Kaiser/Harvard Health News Index, December 1996

Published: Nov 29, 1996

The December 1996 edition of the Kaiser Family Foundation/Harvard Health News Index includes questions about major health issues covered in the news, including questions about California Proposition 215, Mammograms and Teen Drug Use. The survey is based on a national random sample of 1,000 Americans conducted December 13-17, 1996 which measures public knowledge of helth stories covered by news media during the previous month. The Health News Index is designed to help the news media and people in the health field gain a better understanding of which health stories in the news Americans are following and what they understand about those health issues. Every two months Kaiser/Harvard issues a new index report.

Where is Medicaid Spending Headed?

Published: Nov 29, 1996

Enrollment

Another important factor is that Medicaid enrollment increases slowed substantially. After increasing by 7.9 percent annually between 1988 and 1992, enrollment growth slowed to 5.3 percent per year in the following three years (Table 2). Table 3 shows that the rate of growth in enrollment of Medicaid beneficiaries slowed between 1991 and 1995. Enrollment growth increased by 11 percent in 1992 but by only 1.8 percent in 1995. Enrollment growth among the aged slowed from 7.2 percent in 1992 to 1.2 percent in 1995. In 1995 the blind and disabled grew by 6.8 percent, a substantial decrease from the 10.7 percent seen in 1992. Finally, among adults and children, Medicaid growth increased by 11.7 percent in 1992 and 9.1 percent in 1993, but by only 0.8 percent in 1995.

Enrollment growth slowed for a number of reasons. First, there was a decline in AFDC rolls in recent years following an improved economy, as well as efforts in many states to reduce welfare program participation primarily through tougher work requirements. Second, growth in coverage for pregnant women and children has also declined. One reason for the faster growth in the early 1990’s was the relatively new coverage mandates affecting pregnant women and children. This program now has relatively high participation, and growth in this group has slowed considerably as would be expected.

Third, the growth in the blind and disabled population has also begun to slow down. Much of the growth in the early 1990’s was due to court decisions and regulatory changes that resulted in dramatic increases in enrollment of disabled children. Since the initial burst of new enrollment, growth rates in enrollment of the disabled population in the last three years in Medicaid has slowed. Program data reveal that the growth in the SSI disabled, at more than 10 percent per year in the early 1990’s, fell to about 5.8 percent in 1995.9 Finally, there has also been a slowdown in growth among the elderly. Much of the rapid enrollment increase among the elderly in recent years was due to the introduction of the QMB program. The program experienced rapid growth initially, but again as would be expected in any new program, increases in participation have slowed. Moreover, the number of elderly receiving cash assistance through SSI continues to decline.

Spending per Enrollee

Another set of causes of lower Medicaid growth rates is due to controls on spending per enrollee. Growth in spending per enrollee fell from 9.5 percent to 4.9 percent per year. It is too soon to know why this has happened but there seem to be a number of possible reasons. The first is the rapid growth in managed care which seems to be achieving at least short term savings in several states. Initially, participation in Medicaid managed care was voluntary on the part of the enrollee. The evidence on the success of these voluntary programs in containing costs is mixed in part because the favorable selection into managed care plans makes it difficult to measure savings.10 Recently, there has also been a rapid expansion of mandatory managed care through both Section 1915(b) “Freedom of Choice” and Section 1115 “Research and Demonstrations” waiver programs. Managed care enrollment has growth dramatically from 3.6 million beneficiaries in 1992 to 11.6 million-one third of Medicaid enrollment-in 1995. The Section 1915(b) waivers are more numerous, but are typically limited to a geographic area in a state. Managed care can be mandatory for eligible beneficiaries residing in that area. Thirty three states have obtained Section 1915(b) waivers for managed care.

The Section 1115 waivers permit states to move substantially further in enrolling Medicaid beneficiaries in managed care.11 The most prominent of the early Section 1115 waiver programs have been in Hawaii, Oregon, and Tennessee. These programs often extend coverage to uninsured people in the state up to higher income levels than typically included in Medicaid. Hawaii essentially extended coverage to all uninsured persons (excluding the disabled) below 300 percent of the federal poverty line. Oregon extended coverage to all non-disabled individuals below 100 percent of poverty. Tennessee embarked on a major expansion with the intent of covering all of the uninsured below 400 percent of the poverty line. Expansions by these states were financed through savings derived from capitated payments to managed care plans and the use of the state’s DSH payments.

Today, 15 states have received HCFA approval for Section 1115 waiver programs, and 11 have implemented these programs.12 One major change in the evolution of Section 1115 waiver programs is that they have moved away from expansion of eligibility and consolidation of existing non-Medicaid programs that finance health care for the poor. Instead, in later waiver programs, the major emphasis is less on eligibility expansion and more on achieving savings through managed care.

The growth of managed care and the changes in federal DSH policy cannot explain all or even most of the slowdown in Medicaid spending growth. For example, the growth in spending per enrollee fell more for the elderly and blind and disabled than for families (Table 2), the population most affected by the growth in managed care. One explanation is the drop in average annual medical price inflation from 8.2 percent from 1988 to 1992, to 5.1 percent from 1992 to 1995. States also appear to have successfully adopted other policies to limit expenditure growth, particularly for long-term care (Table 1). Many states also seem less willing to use Medicaid as the vehicle through which to funnel state spending for a wide range of social service programs. While the basic financial incentives in Medicaid have not been changed and a return to Medicaid maximization efforts could reappear, for the moment these efforts appear to have stalled.

CBO’s April 1996 Baseline

In their April 1996 baseline estimate, CBO forecast an average annual increase in federal Medicaid spending of 9.7 percent between 1996 and 2002. Medicaid enrollment would rise from 36.8 million to 43.1 million, and program spending would increase from $95.7 billion to $166.4 billion. In August 1996, the CBO issued a partially revised (total spending only) Medicaid spending baseline, where projected 1996 spending was reduced by approximately $4 billion. The CBO is currently considering a substantial revision to this baseline.

We use the April 1996 CBO baseline as a reference point, however, given that it was the most recently available set of detailed CBO estimates. Because the growth rates for 1997 to 2002 were unchanged, a lower level of 1996 spending does not significantly affect our conclusions. However, the reader should bear in mind that the absolute levels in CBO baseline and in our alternative simulation are overstated.

As shown in Table 4, the number of beneficiaries were assumed to grow by 2.7 percent per year and spending on benefits by 10.2 percent per year between 1996 and 2002. The CBO assumed a 5.0 percent average annual growth in DSH payments each year and a 10.2 percent annual growth in administrative costs. The CBO forecast of beneficiary growth represented an assumption of slower enrollment growth than in past periods. Similarly, spending per beneficiary was also assumed to be lower (7.3 percent per year). The growth in DSH payments represented a substantially slower growth than experienced from 1988 to 1992 because of federal legislation in 1991 and 1993 affecting these expenditures.

Why Medicaid Spending Growth Will Remain Slow in the Near Future

There are many reasons to believe that Medicaid spending growth will be even less than that under the current CBO baseline. First, the growth in enrollment of persons living in low-income families is likely to be below rates seen in the early 1990’s. As shown in Table 3, there have been sharp declines in the growth of adults and children receiving Medicaid. The mandated coverage expansions of pregnant women and children have relatively high participation; continued rapid growth in this group should not be expected apart from the incremental inclusion of poor children under age 18. In addition, there has been a decline in AFDC rolls in recent years in part because of the improved economy as well as the widespread efforts to reduce welfare program participation. Recent welfare reform legislation will also probably depress Medicaid enrollment. While current rules for Medicaid eligibility largely remain, the work requirements and the establishment of separate enrollment procedures for the Temporary Assistance to Needy Families (TANF) program and for Medicaid are likely to result in lower participation rates. CBO projected growth in enrollment of adults and children to be 2.4 percent per year between 1996 and 2002 (Table 4). This is more than double the likely growth in the poverty population and seems high given the recent experience.

Second, the current CBO forecast assumes slower growth in enrollment than actually experienced in the early 1990’s, but their projections are higher than experienced in the most recent year. For example, the QMB program experienced rapid growth initially, but as would be expected in any new program increases in participation have slowed. Moreover, the number of elderly receiving cash assistance through SSI and, thus, Medicaid coverage continues to decline. As shown in Table 3, enrollment growth of the elderly is declining and grew by less than 1.0 percent in 1995. Enrollment of the elderly in Medicaid should continue to grow faster than the growth of the elderly population (about 1.8 percent). However, CBO assumed it would increase by 2.8 percent between 1996 and 2002, significantly faster than growth in the elderly population.

Third, the growth among the blind and disabled is also likely to slow. As shown in Table 3, there has been a slowdown in enrollment of the disabled in Medicaid in the last three years following dramatic increases due to court decision in the early 1990’s. Program data reveal that the growth in the SSI disabled between 1994 and 1995 fell to about 5.8 percent in 1995 and increased by only 2.1 percent in the first half of 1996.13CBO estimated that the disabled would grow by only 3.8 percent per year between 1996 and 2002 (Table 4), a seemingly modest growth rate but one that still may be too high, given recent trends. Recent legislation affecting SSI eligibility for disabled children and those with substance abuse problems will also lower enrollment rates.

Fourth, the current CBO forecast does not seem to adequately account for reductions in the growth in spending per enrollee that have occurred in the 1992 to 1995 period and are likely to continue. CBO assumes that federal spending per beneficiary will grow by 7.4 percent per year, about 4.6 percentage points faster than the rate of general inflation. This is higher than recent experience; for example, spending per beneficiary grew by 5.0 percent between 1992 and 1995. The CBO forecast for increased spending per beneficiary for the elderly and disabled was well above that of the previous four years. Much of the recent growth is among QMBs and modestly disabled children. Since both of these groups that are growing the fastest also have relatively low expenditures, this seems unwarranted. CBO assumes that long-term care spending per beneficiary will increase by about 6.3 percent annually (not shown). Finally, CBO assumes spending on acute care services per beneficiary would grow at about 7.5 percent between 1996 and 2002 (not shown). This is faster than most states are reportedly experiencing through the increased use of managed care, reductions in benefits, and other aggressive cost containment policies.

Finally, CBO assumes that DSH spending will continue to grow by 5 percent per year, despite the fact that many states with high levels of DSH spending are constrained by 1991 and 1993 legislation affecting DSH payments.

An Alternative Forecast

In Table 5, we present a hypothetical baseline that makes different assumptions about continuation of recent trends. In this baseline, we make the following assumptions: the number of elderly beneficiaries will grow by 2.5 percent per year; the number of disabled beneficiaries will grow by 3.5 percent per year; and the growth of adults and children in families will be 1.0 percent per year. These are all consistent with trends in recent years and still faster than the growth in the projected poverty populations of the relevant groups. We then assume that spending per beneficiary for acute care services would slow to 5.0 percent per year for all groups; these assumptions are consistent with projections of Medicaid managed care savings and recent experience (1992-1995). Long-term care spending per beneficiary is assumed to increase at 6.0 percent, again consistent with recent experience. Finally, we assume that DSH payments will grow no faster in each state than permitted by current law.

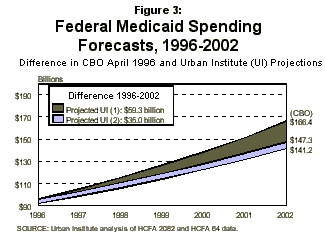
The result of these changes are shown in Table 5. Federal Medicaid spending would increase by 7.4 percent annually and grow to only $147.3 billion by the year 2002. Federal Medicaid spending over the 1996 to 2002 period would be $59.3 billion lower than the CBO April 1996 baseline. Medicaid enrollment would be 2.7 million below the April 1996 CBO estimate. Acute care spending would increase more slowly than long-term care spending, reflecting the growth in managed care.

Earlier we mentioned that the 1996 spending level used as the basis of our projections was too high because of the unexpected (yet still preliminary) 3.2 percent growth in Medicaid spending between 1995 and 1996. This would result in 1996 spending levels of $91.7 billion instead of $95.8 billion. Applying our growth assumptions to this lower 1996 base reduces federal Medicaid spending in the year 2002 to $141.4 billion and reduces spending over the 1996-2002 period by another $35.0 billion.

We believe these growth rate assumptions are in line with the experience of the past few years. The CBO has to date been more conservative in their recent baseline forecasts. They have implicitly assumed that recent cost containment success will not continue and that Medicaid will return to a higher spending growth path. While one cannot rule this out, it seems likely that most of the reasons for Medicaid’s extraordinary growth in the 1988-1992 period-eligibility expansions, both AFDC and SSI growth as well as federal and state eligibility expansions, and DSH payments-are unlikely to have the same effects in the future. The recent welfare reform legislation, the Personal Responsibility and Work Opportunity Act of 1996, increases the odds of slower Medicaid growth in the near future.

Implications

While a conservative forecast like CBO’s is arguably prudent, the implications are significant-particularly if the “true” baseline is in fact lower. The first is that Medicaid spending growth would be substantially slower than has been experienced in the recent past and lower than now being projected by CBO. A lower baseline means that there is less of a need for major changes in the program in order to meet budget targets because Medicaid’s contribution to the federal budget deficit would be smaller. It would also suggest that states have been able to contain spending growth without the additional flexibility Congressional or Clinton proposals would have provided.

A lower baseline would also mean that the changes in policies that would be required to live within a block grant or per capita cap could be much less than has previously been believed. Of course, if Medicaid spending growth has fallen because states have already adopted policies that would allow them to reduce expenditures, then further cuts would still prove quite difficult. Furthermore, achieving the savings in absolute dollar terms envisioned by the 1995 proposals would be quite difficult, given the lower baseline. Consideration of increased flexibility and some limits on Medicaid spending may still be advisable, but these can be achieved with less significant changes in policy than a block grant would represent.

A final implication follows from the fact that an important share of the reduction in spending under our hypothetical baseline is achieved because of lower enrollment growth. We suggest that Medicaid enrollment would be about 2.7 million lower than had been projected by the CBO. Policy makers need to be concerned about the insurance coverage of those who otherwise would have Medicaid coverage; recent evidence suggests these individuals may not secure private coverage.14 If they do not, the number of uninsured in 2002 will increase even without further erosion of employer-sponsored coverage. If employer-sponsored coverage continues to drop as it has recently at the same time as Medicaid enrollment growth slows, the number of uninsured persons could rise precipitously by 2002. Thus, there is still considerable reason for caution before making significant reductions in Medicaid spending growth.

Return to top

Where is Medicaid Spending Headed?:Press Release Fact Sheet Report Part One Part Two Tables and References
Where is Medicaid Spending Headed? – Fact Sheet

Published: Nov 29, 1996

Medicaid Enrollment and Spending Growth

Overview

In 1995, Medicaid provided health and long-term care for 34.8 million low-income, elderly, and disabled Americans at a cost of $157.3 billion, $151.8 billion for services and $5.5 billion for administration. After expanding considerably in the early 1990’s, Medicaid spending and enrollment growth have slowed markedly. Medicaid spending growth has declined from 22.4 percent per year to 9.5 percent per year between 1992 and 1995. Preliminary data suggest the growth rate for 1995-96 has fallen dramatically to about 3 percent; however, spending from 1996-2002 is projected by the Urban Institute to grow at 7.4 percent.

Beneficiary Growth: 1988-1995

2074-enroll_1.gif

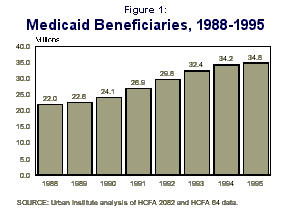
Medicaid enrollment growth has risen steadily over the last seven years. Between 1988 and 1995, the number of Medicaid beneficiaries grew 58 percent, from 22.0 million to 34.8 million (Figure 1). In part, the recession increased welfare and thus Medicaid enrollment. But much of this growth occurred between 1992 and 1994 and resulted largely from federal and state expansions in coverage of low-income pregnant women and children.

In addition, greater coverage of people with AIDS and actions that expanded SSI eligibility for disabled children increased coverage of disabled Medicaid beneficiaries. Eligibility expansions to assist low-income Medicare beneficiaries also increased the number of elderly Medicaid beneficiaries.

In recent years enrollment growth has leveled off. From 1992 to 1994, the number of beneficiaries grew 7.6 percent per year; the growth rate was only 1.8 percent between 1994 and 1995.

Future Medicaid Enrollment:

During the next six years, Medicaid enrollment is predicted by the Urban Institute to continue to grow at 1.6 percent, a rate similar to that of 1994-95. This would result in a total of 40.4 million beneficiaries in 2002.

Cost Explosion: 1988-1992

2074-enroll_2.gif

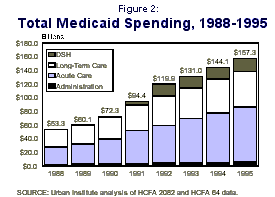
Between 1988 and 1992, Medicaid’s total (state and federal) costs more than doubled, growing from $53.5 billion in 1988 to $119.9 in 1992 (Figure 2). This growth rate of 22.4 percent per year made it one of the fastest growing components of state and federal budgets during that time. In 1988, federal spending on Medicaid accounted for about 2.5 percent of all federal spending; by 1992, Medicaid made up more than 5 percent of the federal budget.

Reasons Behind the Cost Explosion:

The rise in Medicaid’s costs between 1988 and 1992 was equally attributable to three factors: health care inflation, state financing practices (including the use of provider taxes and donations and disproportionate share hospital (DSH) payments) and expansions in enrollment due to legislative changes and the recession. Expansion in coverage of low-income women and children, the lowest cost Medicaid beneficiaries, accounted for most of the enrollment growth but only a fraction of the spending growth.

Spending Growth Slowdown: 1992-1995

Since 1992, Medicaid’s spending growth has slowed dramatically. Total Medicaid spending grew from $119.9 million in 1992 to $157.3 million in 1995–an average growth rate of 9.5 percent per year, substantially less than the 22.4 percent rate during the previous five years (Table 1).

Table 1: State and Federal Medicaid Expenditures, 1988-1995Spending (billions) Ave. Annual Growth Type of Spending 1988 1992 1995 1988-92 1992-95Total $53.5 $119.92 $157.3 22.4% 9.5% Benefits $50.6 $98.5 $132.8 18.1% 10.5% Acute $25.4 $55.5 $80.4 21.6% 13.1% Long-Term $25.1 $42.9 $52.3 14.3% 6.8% DSH $0.4 $17.5 $19.0 149.9% 2.7% Admin. $2.4 $3.9 $5.5 12.2% 12.6%

Reasons For Cost Slowdown:

Although it is difficult to quantify the precise contribution of each factor, the slowdown in the growth of Medicaid’s costs appears to be related to the following factors:

  • Limitations on DSH: Federal legislation capped money available to states through DSH payments. After rising by more than 250 percent between 1991-92, DSH payments actually fell by 1 percent in 1992-93. Provider taxes and donations as financing mechanisms were also limited.
  • Slower Enrollment Growth: After increases averaging 7.9 percent annually between 1988 and 1992, enrollment growth fell to 5.3 percent in the following three years. The earlier bursts in enrollemnt due to expanded eligibility for children and pregnant women have largely subsided. The improved economy and changes in AFDC also contributed to a slowing of enrollment growth.
  • Slower Growth in Spending per Beneficiary: Declines in medical price inflation, enrollment of women and children into capitated managed care and limits on long-term care spending may have accounted for some of the slowdown in the growth of spending per beneficiary found among all beneficiary groups (Table 2).

Table 2: Average Spending per Beneficiary, 1988-1995Cost per Beneficiary Ave. Annual Growth Type of Beneficiary 1988 1992 1995 1988-92 1992-95All $2,298 $3,303 $3,816 9.5% 4.9% Elderly $5,794 $8,848 $10,166 11.2% 4.7% Blind & Disabled $5,619 $8,099 $8,685 9.6% 2.4% Families $848 $1,416 $1,728 13.7% 6.8%

Projected Spending: 1996-2002

2074-enroll_3.gif

Although preliminary data show a slowdown in Medicaid spending growth from 1995 to 1996 to 3 percent, it is unlikely to remain this low in the future. Urban Institute projects Medicaid spending will increase 7.4 percent per year and will grow to $147 billion by 2002–$59 billion lowerthan CBO’s April 1996 baseline. If 1996 spending remains below the CBO baseline, total federal savings using the 7.4 percent growth rate could reach $94 billion from 1996 to 2002 (Figure 3). These findings suggest that Medicaid’s contribution to the federal deficit would be substantially smaller than predicted.


Source: Where is Medicaid Spending Headed? By John Holahan and David Liska, the Urban Institute, November 1996. Prepared for the Kaiser Commission on the Future of Medicaid.

Return to top

Where is Medicaid Spending Headed?:Press Release Fact Sheet Report


National Survey of Women about Their Knowledge, Attitudes, and Practices Regarding Their Reproductive Health – Toplines/Survey

Published: Nov 1, 1996

The Kaiser Survey on Public Knowledge and Attitudes about STDs other than AIDS

Questionnaire and Toplines

November 20, 1996

Conducted for The Henry J. Kaiser Family Foundation by Market Facts, Inc.

Number of Interviews: 707 men and women ages 18-64 Margin of Error: plus or minus 4 percentage points Dates of Interviewing: November 8-10, 1996

1. Can you tell me the names of any sexually transmitted diseases or S.T.D.s, which also used to be called V.D. or venereal diseases? (Probe once:) What others can you name? (Do not read list. Enter all that apply.)

Gonorrhea 68% AIDS or HIV or human immunodeficiency virus 60% Syphilis 53% Herpes or genital herpes or herpes simplex virus or HSV 37% Chlamydia 24% Warts or genital warts or human papilloma viruses or HPVs 7% HBV or Hepatitis-B virus 4% Pubic lice 4% Crabs 3% Trich or trichomoniasis 2% BV or bacterial vaginosis 1% Chancroid 1% Other 4% None 7% Don’t know 4% Refused/No answer 1%

As you may know, HIV or AIDS is one of the most serious sexually transmitted diseases. Now I am going to ask you a few questions about sexually transmitted diseases OTHER than HIV or AIDS.

2. To the best of your knowledge are there ways that sexually active people can avoid getting sexually transmitted diseases?

Yes 93% No 6% Don’t know 1% Refused/No answer *

3. To the best of your knowledge, are all sexually transmitted diseases curable?

Yes 17% No 80% Don’t know 3% Refused *

4. Of every 100 people in this country, how many do you think will become infected with a sexually transmitted disease at some point in their lives? Just give me your best guess by responding with any number between 1 and 100 (Enter number from 1 to 100. Do not accept a range.)

1-10 16% 11-20 12% 21-30 16% 31-40 7% 41-50 20% 51-60 6% 61-70 4% 71-80 11% 81-90 4% 91-100 3% Don’t know 11% Mean answer given: 42% Percent responding with correct answer (21 to 30): 16%

5. Do you know anyone who has had a sexually transmitted disease? Again we are asking about sexually transmitted diseases other than HIV or AIDS.

Yes 45% No 54% Don’t know * Refused * 6. Do you think the number of people getting infected with sexually transmitted diseases has gone up, gone down or stayed about the same over the last 10 years? (Do not read list. Enter only one response.)

Gone up 72% Stayed about the same 17% Gone down 9% Don’t know 2% Refused *

7. Do you think the average person is more likely to get HIV or AIDS or some other sexually transmitted disease like herpes or gonorrhea? (Do not read list. Enter only one response.)

HIV/AIDS 25% Other STD like herpes or gonorrhea 55% Both just as likely 12% Don’t know 7% Refused/No answer 1%

8. Does having a sexually transmitted disease, other than HIV or AIDS, make a person more vulnerable to being infected with HIV or AIDS, less vulnerable, or does it have no effect? (Do not read list. Enter only one response.)

More vulnerable 44% No effect 43% Less vulnerable 3% Don’t know 10% Refused *

9a. If you wanted to get tested to see if you were infected with a sexually transmitted disease, which one of the following would be the most important factor in choosing where to get tested? (Read and randomize list.)

Expertise of the person giving the test 56% Confidentiality 29% Convenience 7% Cost 6% Don’t know (do not read) 2% Refused/No answer (do not read) * (Delete answer given in QU. 9a. before displaying answers for QU. 9b. Keep QU. 9b. in same order as QU. 9a.)

9b. Of those items remaining, what would be the next most important? (Read list. Enter only one response.)

Confidentiality 44% Expertise of the person giving the test 27% Cost 14% Convenience 14% Don’t know (do not read) 1% Refused (do not read) *

10. If you were to get tested or treated for a sexually transmitted disease, would you be reluctant to use your normal health insurance arrangement?

Yes 29% No 68% Don’t know 2% Refused/No Answer 1%

11. A test is being developed that can be used at home to test for a sexually transmitted disease, other than AIDS or HIV. To use this test, you would buy a kit in a drug store, provide a urine sample, and send your sample to a laboratory. Then, you would get the results by calling a confidential telephone number. If you thought there was a chance you might have a sexually transmitted disease, how likely would you be to use this home test, very likely, somewhat likely, not too likely, or not at all likely? (Do not read list. Enter only one response.)

Likely (net) 57% -Very likely 34% -Somewhat likely 23%

Not Likely (net) 42% -Not too likely 14% -Not at all likely 28%

Don’t know 1% Refused/No answer *

12. Do you think most people really do each of the following, or not? Do you think most people really (insert phrase), or not?

Yes No Don’tKnow Refused Ask a new sexual partner if he or she is infected with any sexually transmitted diseases 12% 85% 3% * Tell a new sexual partner if they are infected with a sexually transmitted disease 11% 86% 3% * Use condoms each time they have sex with this new sexual partner 22% 75% 3% * Use protection when they have oral sex, like using a condom 4% 89% 7% * Get tested for sexually transmitted diseases before they have sex for the first time or stop using condoms 11% 85% 4% * Use condoms to prevent sexually transmitted diseases if they are already using a different kind of birth control to prevent pregnancy 31% 65% 4% *

13. Do you think the government should require that all health insurance plans pay for tests for sexually transmitted diseases?

Yes 66% No 32% Don’t know 2% Refused/No answer *

14. Do you think teens should have to get their parents’ permission to get tested and treated for sexually transmitted diseases, or not?

Yes 32% No 67% Don’t know 1% Refused/No answer *

15a. Do you think high schools should provide teenagers with information about sexually transmitted diseases and how they are spread?

Yes 95% No 4% Don’t know 1% Refused/No answer *

15b. Do you think high schools should make condoms available to those teenagers who want them to protect themselves against sexually transmitted diseases? (Do not read list. Enter only one response.)

Yes 53% No 44% It depends 1% Don’t know 2% Refused/No answer *

95-1773A-04b

Return to top

The Kaiser Survey on Public Knowledge and Attitudes about STDs other than AIDS:Report Survey

The Kaiser Survey About Public Knowledge and Attitudes About STDs Other Than AIDS

Published: Nov 1, 1996

A summary and toplines from a national survey conducted for the Foundation by Market Facts, Inc. of public knowledge about STDs overall and their attitudes towards policy options to confront the spread of STDs. This survey was released at a briefing on Sexually Transmitted Diseases: Exposing the Epidemic.

Sexually Transmitted Diseases in America: Exposing the Epidemic – Resource List

Published: Nov 1, 1996

Sexually Transmitted Diseases In America:

Exposing the Epidemic

November 20, 1996

Briefing Participants:

Peggy ClarkePresidentAmerican Social Health AssociationP.O. Box 13827Research Triangle Park, NC27709919/361-8400Press contact: Sharon Broom919/361-8416

Jacqueline Darroch Forrest, Ph.D.Vice President for ResearchThe Alan Guttmacher Institute120 Wall StreetNew York, NY 10005Press Contact: Susan Tew212/248-1111 ext. 208

Helene D. Gayle, M.D., M.P.H.Director, National Center forHIV, STD,and TB PreventionCenters for Disease Control and Prevention MSEO71600 Clifton RoadAtlanta, GA 30333Press contact: Melissa Shepard404/639-8890

Penelope Hitchcock, D.V.M., M.S.Chief, STD Branch, NIAIDNational Institutes of HealthRm. 3A21, Solar Building6003 Executive Blvd.Rockville, MD 20892301/402-0443

Azadeh Khalili Executive DirectorHIV/AIDS Technical Assistance Project131 Livingston St.Brooklyn, NY 11201718/935-5606

Felicia H. Stewart, M.D.Director of Reproductive HealthProgramsKaiser Family Foundation2400 Sand Hill RoadMenlo Park, CA 94025Press Contact: Tina Hoff,Communications Program Officer415/ 854-9400, ext. 106

Kathleen Toomey, M.D.State Epidemiologist andDirector, Epidemiology andPrevention BranchDivision of Public HealthDepartment of Human Resources2 Peachtree Street, NWAtlanta, GA 30303404/657-2588Press contact: Joyce Goldberg404/656-4937

Judith Wasserheit, M.D.Director, Division of STD/HIV PreventionCenters for Disease Control and Prevention MSEO21600 Clifton RoadAtlanta, GA 30333404/639-8260Press contact: Melissa Shepard404/639-8890

Other References:

American College of Obstetriciansand GynecologistsDepartment of Public InformationPO Box 96920Washington, DC 20090-6920Media Inquiries: (202)484-3321

Barbara LevineDirector of Government Relations and Affiliate AffairsAmerican Public Health Association1015 15th Street, NWWashington, DC 20005Press office: 202/789-5677Week of 11/17 – 11/19 only:212/261-6365

Marie BassProject Director, Reproductive Health Technologies ProjectBass and Howes1818 N Street, NWSuite 450Washington, DC 20036202/530-2900

Leslie Wolfe, Ph.D.PresidentCenter for Women Policy Studies1211 Connecticut Ave., NWSuite 312Washington, DC 20036202/872-1770

Tom Eng, W.M.D., M.P.H.Study DirectorInstitute of MedicineNational Academy of Sciences2101 Constitution AvenueWashington, DC 20418Press contact: Molly Galvin202/334-2138

Susan Wysocki, R.N.C., M.P.PresidentNational Association ofNurse Practitioners in ReproductiveHealth1090 Vermont Avenue, NWSuite 800Washington, DC 20005202/408-7025

Marilyn KeefeDirector of ServicesNational Family Planningand Reproductive Health Association122 C Street, NWSuite 380Washington, DC 20001202/628-3535

Carolyn PatiernoCo-ChairpersonSTD Prevention PartnershipDirector of Program ServicesSexuality Information andEducation Council of the UnitedStates (SIECUS)130 West 42nd Street, Suite 350New York, NY 10036-7802212-819-9770, ext.305

For information about local/regional spokespeople on STDs, call:Joan CatesAmerican Social Health Association919-361-8417

Return to top

Sexually Transmitted Diseases in the United States: Exposing the Epidemic:Fact Sheet Q & A Resource List

Sexually Transmitted Diseases in America:  Exposing the Epidemic – Main Page

Published: Nov 1, 1996

Sexually Transmitted Diseases in America: Exposing the Epidemic

Provides some context about the STD epidemic, including taking a closer look at the prevalence of STDs in the United States, the long-term health consequences, and the public and private responses tothe epidemic, particularly, innovations in prevention, diagnosis and treatment.

Medicaid Update: Expenditures and Beneficiaries in 1994

Published: Oct 30, 1996

Table 1Medicaid Beneficiaries by Group, 1988-1994 United States Beneficiaries (thousands) Average Annual Growth (%) Beneficiary Group 1988 1990 1992 1993 1994 1988-1994 1988-90 1990-92 1992-94 1988-94 All Beneficiaries 22,014 24,066 29,811 32,441 34,183 7.6 4.6 11.3 7.1 9.2

Cash Assistance 15,945 16,144 18,460 19,475 19,847 3.7 0.6 6.9 3.7 4.5

Other Beneficiaries 6,068 7,922 11,351 12,966 14,336 15.4 14.3 19.7 12.4 18.8 Elderly 3,130 3,167 3,547 3,680 3,828 3.4 0.6 5.8 3.9 4.1

Cash Assistance 1,664 1,532 1,573 1,564 1,574 -0.9 -4.1 1.3 0.0 -1.1

Other Beneficiaries 1,466 1,635 1,974 2,116 2,254 7.4 5.6 9.9 6.8 9.0 Blind and Disabled 3,443 3,717 4,471 4,991 5,381 7.7 3.9 9.7 9.7 9.3

Cash Assistance 2,753 2,966 3,517 3,906 4,223 7.4 3.8 8.9 9.6 8.9

Other Beneficiaries 690 750 954 1,085 1,159 9.0 4.3 12.8 10.2 10.9 Adults 5,081 5,696 6,982 7,451 7,860 7.5 5.9 10.7 6.1 9.1

Cash Assistance 3,867 3,865 4,379 4,568 4,571 2.8 0.0 6.4 2.2 3.4

Other Beneficiaries 1,214 1,831 2,603 2,884 3,288 18.1 22.8 19.2 12.4 22.0 Children 10,360 11,486 14,811 16,319 17,115 8.7 5.3 13.6 7.5 10.6

Cash Assistance 7,662 7,781 8,992 9,437 9,479 3.6 0.8 7.5 2.7 4.3

Other Beneficiaries 2,698 3,706 5,820 6,882 7,635 18.9 17.2 25.3 14.5 23.1 Source: Urban Institute calculations based on HCFA 2082 data. Does not include the US Territories. Totals may not add due to rounding. “Cash” refers to beneficiary groups who receive AFDC or SSI. “Other” groups (non-cash, poverty-related) include the medically needy, poverty-related expansion groups, and 1115 waiver eligibles (where identifiable). Beneficiaries are defined as individuals enrolled in the Medicaid program who actually receive medical services.