It’s Your (Sex) Life:  Your Guide to Safe and Responsible Sex

Published: Aug 31, 1997

Contraception 911

If a condom breaks, a diaphragm slips, or you realize after having sex that you forgot to take the pill for three days in a row, it can be enough to make the calmest person very upset! Fortunately, there is something you can do. If you act within 72 hours after unprotected intercourse, two doses of a special combination of birth control pills, available by prescription, can prevent or delay ovulation and reduce the chance of pregnancy by about 75 percent. The method is called emergency contraception (the morning-after pill).

You can get the pills from a doctor or a family planning clinic. If there is any chance you might already be pregnant you’ll need a pregnancy test. (If you are pregnant, the treatment won’t work.) The medication isn’t without side effects, though; nausea, especially, is very common for a day or so. And it’s not foolproof – it only reduces your chance of pregnancy by 75%. And even if it does work, the pregnancy protection doesn’t last so you’ll need to go back to another birth control method right away. Generally, emergency contraception costs $55 to $245 for the whole shebang (examination, pregnancy test, and pills); costs are less – or even free – at family planning clinics and health centers. To find a provider near you, you can call the Emergency Contraception Hotline at 1-888-NOT2LATE.

What Doesn’t Work

If you’re considering any of these folklorist contraceptive methods, fuhgeddaboudit!!! Here’s why:

  • Douching: Rather than rinsing sperm out of the vagina, douching could actually send them swimming upstream towards an egg. (It can also increase the risk of infection.) All in all, a bad idea!
  • Peeing after intercourse: An old folks’ tale! Urinating after sex does nothing to protect against pregnancy because the urinary opening is near to, but not inside, the vagina. So sperm won’t be touched by the liquid rush.
  • Having intercourse during your period: First of all, just because you’re bleeding doesn’t mean you’re having your “true” period; some women bleed during ovulation. And it’s often hard to predict when you’ll ovulate. So you’d better use protection whenever you have intercourse, all month long.

How to Negotiate with Your Partner

Think you might be ready to have sex with a special someone? Before deciding, make sure you’ve considered all the issues and discussed them with your partner. After all, the decision is – always! – up to both partners. Here are three tricky sexual scenarios and solutions for how to handle them:

Scenario #1: You’re thinking about having sex but you’re just not comfortable talking about it with your partner.

Solution: First things first: If you can’t talk about it, how are you going to feel comfortable doing it? Maybe one of you thinks that talking about sex kills the mood or that it should just happen naturally when the moment is right. Wrong, wrong, wrong. Talking about sex can actually help you trust each other more and feel closer to each other because it shows you care. But most importantly, it helps you make wiser decisions, and if you decide to begin a sexual relationship, to plan ahead to protect yourselves against pregnancy and STDs. In fact, you should hash out what you’re willing to do and what you’re not and agree to use condoms for your mutual protection before things get too intimate.

Scenario #2: Your partner does not want to use a condom.

Solution: Some people will use a zillion lame excuses to weasel out of using condoms so you’d better be armed with a snappy comeback. If she says, “It takes away the romance,” you could say, “So could getting an STD.” If he says, “I can’t feel anything with a condom,” tell him “You’ll feel even less if you don’t use one because we won’t be having sex.” If she swears she won’t give you any diseases, tell her it’s nothing personal but you want to make sure both of you stay healthy. The bottom line: Don’t feel bad about saying “No condom, no sex.”

Scenario #3: You’ve already had intercourse together but now you realize that it’s just too soon for you – and you don’t want it to happen again.

Solution: It’s not too late to slam on the brakes. One thing to keep in mind is that just because you’ve done it once or twice doesn’t mean you have to do it again and again. It’s okay to say “no” to any part of sex at any time, regardless of what you’ve done in the past. The key is to be firm and clear – hopefully, before you get to the undressing stage – about how you’re feeling and what you want for the future. If your partner tries to push the issue, stand your ground, and remind him or her how strongly you feel about slowing things down. Anyone worth your time and affection should respect that.

Sexually Transmitted Diseases

You’ve heard about all these scary things that can happen to you if you don’t practice safer sex, and you may even know people who have caught sexually transmitted diseases (STDs). Which isn’t surprising, considering that at least one in four people will contract an STD at some point in his or her life. What is there to worry about? Plenty. Here’s what you need to know about the risks of unprotected sex.

Each year more than 12 million Americans, including 3 million teenagers, are infected with STDs, and many of them probably thought they didn’t need to worry about protection. While a few STDs are just annoying, many others can have lasting effects on your health and sex life. We all know that HIV is an incredibly deadly STD. In fact, half of all new HIV infections occur in people under 25, and AIDS has become the leading cause of death among Americans between the ages of 25 and 44. And if you think the new AIDS drugs you have been hearing about are a magic cure, forget it. They are hard to take, often have strong side effects, and do not always work. Other STDs can cause nasty recurrent symptoms, such as painful or itchy sores, and a select few can cause death or increase the risk of cancer for both women and men. What’s more, several STDs can cause infertility, meaning you could never have children.

And get this: Almost any STD increases your chances of contracting HIV. In fact, people who already have an STD, like herpes, gonorrhea or chlamydia, are three to five times more likely to become infected with HIV than someone who does not have an STD if they have unsafe sex with an HIV-positive partner.

It’s a myth that you can tell if someone has an STD by the way he or she looks or acts. That wholesome-looking guy or woman may look safe and seem safe but appearances can be deceiving. After all, you’re not just having sex with that person but with everyone they’ve ever had sex with . . . and everyone THEY’VE ever had sex with… and… well, you get the point. Because lots of STDs have no symptoms (or only subtle ones), your partner may not even know he or she has one. That’s why if you have had sex in your life, you should get tested for STDs like chlamydia, and for HIV, even if you have no symptoms and are feeling just fine.

To be blunt about it: The only way to be sure you’re having safer sex is to keep your partner’s blood, semen, or vaginal fluids out of your body. Abstinence is the safest course. But, if you’re going to have sex, always use a condom.

How can you tell if you’re infected with an STD?What should you do if you are?

If you’ve been experiencing burning urination; heavy, smelly discharge from the vagina, penis or anus; bumps, sores or itching in the genital area; pain or tenderness in the pelvic area; or other funky symptoms, you may have a sexually transmitted disease. In that case, you need a medical visit right away so you can get tested.

Why is it important to get tested early? Because if you have an STD and don’t know it – and so don’t get treatment – you could pass it on to your partner and you could risk your health and your ability to have kids in the future. Not all STDs are curable, but even for ones that aren’t, treatments are available that can help. If you have HIV, for example, finding out early means you can take advantage of new medications that are more effective if you take them before you start to get sick.

If you are a woman and you’ve been experiencing cramping or persistent pain in the abdomen or back; abdominal tenderness with movement or going to the bathroom; abnormal vaginal discharge; pain during intercourse; or any of these symptoms with a fever over 100.5 degrees Fahrenheit – these may be signs of pelvic inflammatory disease (PID). If you have these symptoms, see a doctor or go to a clinic or a hospital emergency room immediately; PID can lead to infertility in a woman if it’s left untreated. PID can also be silent – an infection that spreads to your tubes from chlamydia or gonorrhea with no severe signs that could alert you that something is wrong.

Now, to get the inside scoop on the most common STDs, consult this table:

STD Chart

STD: Chlamydia What it is: A bacterial infection of the genital area. How many get it: About 4 million Americans each year; the highest rates are among women aged 15 to 19 – in fact, in some communities studies have found that up to 30 percent of sexually active teenage women and 10 percent of sexually active teenage men are infected. Signs: There are no symptoms in most women and many men who have it. Others may experience abnormal vaginal bleeding (not your period), unusual discharge or pain within one to three weeks of having sex with an infected partner. How it’s spread: Through vaginal or anal intercourse. Treatment: Oral antibiotics cure the infection; both partners must be treated at the same time to prevent passing the infection back and forth – and need to abstain from intercourse until the infection is gone. Possible consequences: Pelvic inflammatory disease (PID) in women, tubal (ectopic) pregnancy, infertility, and increased risk of HIV infection.

STD: Trichomoniasis (“Trich”) What it is: A parasitic infection of the genital area. How many get it: As many as 3 million Americans each year. Signs: Often there are no symptoms, especially in men. Some women note a frothy, smelly, yellowish – green vaginal discharge, and/or genital area discomfort, usually within 3 to 28 days after exposure to the parasite. How it’s spread: Through vaginal intercourse. Treatment: Antibiotics can cure the infection. Both partners need to be treated at the same time to prevent passing the infection back and forth – and need to abstain from intercourse until the infection is gone. Possible consequences: Increased risk of HIV infection; can cause complications during pregnancy. Also, it’s common for this infection to happen again and again.

STD: Gonorrhea What it is: A bacterial infection of the genital area. How many get it: Approximately 800,000 Americans a year; the highest rates are among women aged 15 to 19. Signs: Most women and many men who get it have no symptoms. For those who do get symptoms, it can cause a burning sensation while urinating, green or yellowish vaginal or penile discharge, and for women, abnormal vaginal bleeding, pelvic pain, and/or fever within 10 days of getting infected. It takes 1 to 14 days for symptoms – such as discharge or pain – to appear. How it’s spread: Through vaginal, oral, or anal intercourse. Treatment: Oral antibiotics. Both partners need to be treated at the same time to prevent passing the infection back and forth – and need to abstain from intercourse until the infection is gone. Possible consequences: PID, tubal (ectopic) pregnancy, sterility, increased risk of HIV infection. The infection can spread into the uterus and fallopian tubes. It can also cause complications during pregnancy (including stillbirth) or infant blindness or meningitis (from an infected mom during delivery).

STD: Human Papilloma Virus (HPV) What it is: A viral infection with 60 different types, primarily affecting the genital area, both the outer and inner surfaces. How many get it: An estimated 500,000 to 1 million Americans per year; about 40 million people already have it. Signs: Soft, itchy warts in and around the vagina, penis, and anus, may appear two weeks to three months after exposure. Many people, however, have no symptoms but may still be contagious. How it’s spread: Through vaginal or anal intercourse, or by touching or rubbing an infected area. Treatment: There is no cure. Warts can be removed through medication or surgery. Even with such treatments, the virus stays in the body and can cause future outbreaks. Possible consequences: Increased risk of genital cancer for men and women. Some virus types cause the most common form of cervical cancer in women.

STD: Genital Herpes What it is: A viral infection of the genital area (and sometimes around the mouth). How many get it: Between 200,000 and 500,000 Americans each year; an estimated 40 million Americans already have genital herpes. Signs: There are two kinds of herpes. Herpes 1 causes cold sores and fever blisters on the mouth but can be spread to the genitals; Herpes 2 is usually on the genitals. Nearly two – thirds of people who are infected with herpes don’t even realize it. An outbreak can cause red bumps that turn into painful blisters or sores on the vagina, penis, buttocks, thighs, or elsewhere. During the first attack, it can also lead to fever, headaches, and a burning sensation when you urinate. Symptoms usually appear within 2 to 20 days of infection but can take longer in some cases. The first outbreak is usually more severe than later recurrences. How it’s spread: By touching an infected area or having vaginal, oral, or anal intercourse. Warning: some people may be contagious even when they don’t have symptoms. Treatment: There is no cure. An antiviral drug can help the pain and itching and also reduce the frequency of recurrent outbreaks. Possible consequences: Recurrent sores (the virus lives in the nerve roots and keeps coming back), as well as increased risk of HIV infection. May cause complications during pregnancy, possibly causing severe illness, disabilities, or (in rare cases) death for an infant if there is active infection during childbirth. (A cesarean section delivery can reduce this risk.)

STD: Syphilis What it is: An infection caused by small organisms, which can spread throughout the body. How many get it: About 120,000 Americans a year. Signs: In the first phase, sores may appear on the genitals or mouth about three weeks to three months after exposure, lasting for three to six weeks. Often, however, there are no noticeable symptoms. In the second stage, about three to six weeks after sores appear, a variety of symptoms can appear, including a rash (often on the palms of the hands and soles of the feet). How it’s spread: Through vaginal, oral, or anal sex – and through kissing. Treatment: Antibiotic treatment can cure the disease if it’s caught early, but medication can’t undo damage the disease has already done. Both partners must be treated at the same time. Possible consequences: Increased risk of HIV infection. If syphilis is untreated, about a third of people who reach the disease’s late phase may experience brain damage, heart disease, nerve damage, and other incapacitating health problems. If untreated, it can seriously harm or even kill a developing fetus during pregnancy.

STD: Hepatitis B Virus (HBV) What it is: A viral infection primarily affecting the liver. How many get it: About 200,000 Americans a year; more than 1.5 million people in the U.S. now have HBV. Signs: Many people don’t have any symptoms. Others may experience severe fatigue, achiness, nausea and vomiting, loss of appetite, darkening of urine, or abdominal tenderness, usually within one to two months of exposure. Yellowing of the skin and whites of the eyes (called jaundice), and darkening of the urine can occur later. How it’s spread: Through vaginal, oral, and anal sex – and through kissing. Also by sharing contaminated needles. Treatment: Most cases clear up within one to two months without treatment, during which complete abstinence from alcohol is recommended until liver function returns to normal. Some people are contagious for the rest of their lives. A vaccine is now available to prevent this STD. Possible consequences: Chronic, persistent inflammation of the liver and later cirrhosis or cancer of the liver; plus, 90 percent of babies born to women with HBV will carry the virus unless they are vaccinated within an hour of birth.

STD: HIV What it is: The human immunodeficiency virus (HIV), the cause of AIDS. How many get it: An estimated 40,000 to 80,000 Americans are infected each year. AIDS is the leading cause of death among Americans between the ages of 25 and 44. Signs: Many people who have HIV don’t even know it because symptoms may not appear for 10 years or longer. Others experience unexplained weight loss, flu-like symptoms, diarrhea, fatigue, persistent fevers, night sweats, headaches, mental disorders, or severe or recurring vaginal yeast infections. How it’s spread: Through body fluids such as blood, semen, vaginal fluids and breast milk – in other words, during vaginal, oral or anal intercourse; by sharing contaminated needles; via pregnancy or breast – feeding. During vaginal intercourse, the risks of catching the virus are higher for women than for men. Treatment: There is no cure – and AIDS is considered fatal. Several new antiviral medications can slow progression of the infection and delay the onset of AIDS symptoms. Early treatment can make a big difference. Possible consequences: It is the deadliest STD of all and can weaken the body’s ability to fight disease, making someone with HIV vulnerable to certain cancers and infections such as pneumonia. Fifteen to thirty percent of babies born to HIV – positive mothers can get the disease if the mother is not receiving treatment, but treatment can reduce that rate significantly.

Possible STD Symptoms

Do you or your partner have any of these symptoms? If so, you can review the information in the corresponding sections, and consult your doctor.

Return to top

It’s Your (Sex) Life; Your Guide to Safe & Responsible SexReport Two Part One Part Three

Estimated Cost of a Child Health Program in California – Report

Published: Aug 31, 1997

Estimated Cost of a Child Health Program in California

Prepared by Gordon R. Trapnell, F.S.A., Actuarial Research Corporation

For the Kaiser Family Foundation

September 10, 1997

Summary

The Balanced Budget Act of 1997 created a new federal/state program to cover uninsured children. The new federal legislation provides states with a substantial amount of flexibility in designing their child health insurance programs by expanding their existing Medicaid programs, creating new state child health insurance programs, or a combination of both. This report provides an analysis of the cost of covering California children through the options available under the federal program.

The analysis is based on an August 27th plan presented by the Wilson Administration for covering uninsured children in California — the California Children’s Health Plan (CCHP). A key element of the proposed CCHP is to expand coverage to uninsured children using a private insurance mechanism, which the Wilson Administration has said would be slightly less expensive on a per child basis than using the Medicaid program (which is called Medi-Cal in California). The Wilson Administration estimates that the proposed CCHP would cost $74.75 per child per month, while expanding Medi-Cal would cost $76.60 per child. These figures do not include premium contributions made by families or various state administrative costs that might be required under either approach. If families made an average $8 monthly premium contribution per child as suggested in the CCHP proposal, then the government’s cost per child under the CCHP would drop to $66.75 per month. The table on page 33 of the Administration’s published August 27th plan shows that the estimated total program costs assuming full participation at 580,000 children under Medi-Cal would be more costly than under their proposed private insurance approach.

Our analysis follows the same basic approach used in the comparative fiscal analysis in the August 27th description of the CCHP. Our analysis finds that while the per month enrollee premium estimate for a private insurance plan is only slightly less than the premium estimated by the Administration for its private insurance proposal, the per enrollee cost of a Medi-Cal approach is significantly less than the Administration’s Medi-Cal estimate. The primary reason our cost estimates for the Medi-Cal option are less expensive than the Wilson Administration’s Medi-Cal estimates is that we have assumed that children who will enroll in the new program will be less expensive than children currently enrolled in Medi-Cal. In a full-participation scenario, we find that a Medi-Cal expansion would be significantly less costly than a private insurance approach. (See Exhibit 1)

In sum, in our analysis:

  • the cost of a private insurance option would be $74.39 per child per month, slightly less (-0.5%) than the Wilson Administration’s estimates for its CCHP proposal;
  • the cost of a Medi-Cal approach would be $60.65 per child per month, substantially less (-21%) than the Wilson Administration’s Medi-Cal estimates. As a result, we estimate that a Medi-Cal approach would cost 18 percent less than the Wilson Administration’s CCHP private insurance option. If the average $8 per month enrollee premium contribution per child is used to offset government expenditures under the private option, the private insurance option premium would be $66.39, making the Medi-Cal estimated cost 9 percent less than the private insurance option amount.

The Wilson Administration estimates that 580,000 uninsured children would be eligible for a new program. Our analysis suggests that if all of these children enrolled (and no currently insured children dropped private coverage and became eligible), then using our estimate of per child costs would yield a Medi-Cal option cost for 1998 that would be approximately $96 million per year less than a private insurance option. If a family average premium contribution of $8 per enrollee per month is used to offset government expenditures under the private option, government spending for the Medi-Cal expansion option would be approximately $40 million per year less than for the private insurance option.

One reason why using Medi-Cal might be less expensive than providing coverage through a private insurance mechanism is that Medi-Cal has historically paid providers at lower rates than private health plans. However, the benefits provided by Medi-Cal are more comprehensive — and therefore more expensive — than those provided by most private health plans (and than those provided in the proposed CCHP).

Exhibit 1

ARC Premium Calculations For Child Health Insurance In California — CY 1998

Per Child Per Month Costs Medi-Cal Option Base Monthly Per Capita $50.32 Adjusted Benefit Package $50.22 Projected to 1998 $54.86 Adjusted to HMO rates $54.31 Adjusted for Additional Administrative Functions $60.65 HIPC-Based Consortia Plan (Private Insurance Option) Base Monthly Per Capita $60.03 Adjusted Benefit Package $67.28 Projected to 1998 $70.84 Adjusted to HMO rates $70.84 Adjusted for Additional Administrative Functions $74.39

Estimated 1998 Aggregate Costs(Maximum-Enrollment-Based Calculations, Assuming Total Enrollment of 580,000) Medi-Cal Plan $422.1 million Consortia Plan – gross $517.8 million minus $8/month enrollee charge $55.7 million Net Consortia Plan $462.1 million Difference $40.0 million Source: Estimates based on analysis by Actuarial Research Corporation.

Objective

Our objective is to estimate the cost per child covered of implementing a Child Health Program in California (CCHP) in one of two modes:

  • Through an expansion of Medi-Cal income limits and liberalizing asset restrictions
  • Through an independent program as suggested by Governor Wilson, modeled on the California HIPC structure, but with plans limited to HMOs (and EPOs) in order to keep cost sharing at levels suitable for a low income population.

In both cases we project the incurred cost of the first year of an expansion or new program that begins in July 1998.

Medi-Cal Expansion

1. Base

We do not have a comprehensive set of premium rates for Medi-Cal, but rather:

  • A DHS tabulation of the Medi-Cal FFS claims for children other than infants and foster children, for the period July 1995 through June 1996.
  • A somewhat detailed description of the derivation of the original premium rates proposed for Local Initiatives and Commercial Plans under the two plan model county rates from the experience of the Santa Barbara County Operated Health Plan, together with supporting data and information provided in the report “Two Plan Model; Capitation Rates for July 1, 1995 – May 31, 1996 and June 1, 1996 – September 30, 1997.”
  • DHS estimates of the average incurred FFS cost per capita for (i) members of families and (ii) foster children for the periods July ’95 through June ’96 and July ’96 through June ’97. In both cases the estimates exclude the costs of those institutionalized and specialized services for such children, and any other services not capitated with the “local initiative” prepaid plans.
  • A comprehensive set of HMO payment rates from several years ago.

In addition, we have a copy of the Capitation Rate Manual for Fiscal Year 1990-91, compiled by the California Medi-Cal actuaries, which provides a number of factors concerning key financial relationships.

Of these data sets the most relevant are (i) the rate structure derived from the Santa Barbara plan and calibrated with the estimated average FFS claims incurred per capita for July 1996 through June 1997 and (ii) the tabulation, apparently on an incurred basis, of a sample of children ages 1-18. The average incurred FFS cost per child per month of eligibility from the DHS tabulation for the period July 1995 through June 1996 was $50.32 per eligible per month (PEPM).

This rate is somewhat lower than the average FFS cost per eligible month in that period for foster children in the eight counties in which the two plan model will be implemented, $58.20 (which was actually higher than the estimated cost a year later of $57.47). This cost PEPM for foster children appears to be higher than found in the tabulation of all children for some combination of area differentials (most of the two plan counties are in the areas with higher average Medi-Cal costs) and a higher average cost for foster children than for children in families (which apparently are somewhat older on average and may include more children with special Medi-Cal needs). Both the estimate for foster children and that for all eligible children exclude the cost of expensive conditions found in infants.

Given the methodology followed by California in setting rates to be paid to health plans, the estimated FFS cost PEPM in July ’95 through June ’96 appears to provide the most reliable basis for an estimate of what the State would offer HMOs to cover an expanded child population. (It also necessarily provides the basis for an estimate of the average that would be paid if the services are not provided through prepaid plans, i.e. on a FFS basis.) The California methodology, well documented by the Medi-Cal actuaries in various reports, has been to:

  • Project the average FFS cost by category of eligibility, age-sex group and county of residence
  • Adjust for difference in the average cost of those eligible for enrollment in an HMO in each category of eligibility
  • Adjust for differences in the benefits for which HMOs are responsible and those retained by Medi-Cal
  • Increase the per capitas by an allowance for those state administrative expenses that will be replaced by contracting with managed care plans
  • Decrease the results for the state’s share of managed cost savings.

Prepaid plans are offered the resulting rates on a take it or leave it basis.

In addition, the total paid to prepaid plans can not exceed estimates of what would have been paid in a FFS system, according to Federal laws and regulations. Thus the estimated FFS cost PEPM controls what can be paid to prepaid plans under Medicaid, and is by definition what a FFS program would cost.

The rate structure derived by the Medi-Cal actuaries produces numbers that appear to be reasonable in relationship to those from the FFS tabulation, but require adjustments for:

  • Deriving a rate for children between 1st and 18th birthdays from the average family member rates
  • Area differences between payments in the twelve two plan counties and the entire state
  • Differences in the benefit package offered through the prepaid plans and all Medi-Cal benefits (to the extent that benefits were limited in the prepaid benefit packages).

Since each of these steps may involve error, we rely here on the rate ($50.23) derived from FFS data for a population most like what is to be enrolled under CCHP. However, we note that to the extent that the new program will enroll some age groups in larger numbers than others (especially if distinctions are introduced), this provides a promising base for estimates of the relative cost of different age groups.

2. Adjustments to benefit package and eligibility

By definition, the benefit package would be the same as the full Medicaid program. Thus the tabulations of FFS data cited above exclude services not currently capitated with HMOs. The value for the average experience of all eligible children during the twelve months ending in June 1996 appears to include all categories of benefits, including some related to institutional services. These should probably be excluded from the estimate, on the grounds that most needing institutional services are already eligible for Medi-Cal, and would not be included in the expansion population. The adjustment appears to be a decrease of the order of $.10 PEPM.

It is not clear whether the services provided to crippled children are included in the base data. If they were, the cost PEPM should be further reduced by around 5% to allow for the relatively high cost per capita of this group, compared to what may be expected to be found in the expansion program.

3. Projection to First Program Year

The period for which the base rates were tabulated was from July 1995 through June 1996. The estimates from DHS estimates for the average incurred FFS cost per capita for (i) members of families and (ii) foster children for the periods July 1995 through June 1996 and July 1996 through June 1997 can be used to update this base for another year. The average increase is 2.1%.

The resulting rate represents the average cost of FFS Medi-Cal during the period from July 1996 through June 1997. We wish to project the cost to the period July 1998 through June 1999, which occurs two years later. We project the increase to be 3.5% per year. After incorporating these two trend factors, the estimated average FFS claims incurred for non-infant non-foster-child Medi-Cal children is $54.86.

4. Adjustments for prepaid plan payment rates

Medi-Cal has increased payment rates to HMOs by 1% to reflect the estimated savings in Medi-Cal administrative expenses, and decreased rates by a small percentage to obtain a state share of managed care savings, e.g. a projected 2% in the calculation of two plan county rates. The rates are also reduced by around 0.5% to reflect a loss of interest when capitations are paid in advance rather than claims paid some time after the date on which services are performed.

After these adjustments, the average payment rates to prepaid plans for Medi-Cal children ages 1 – 18 would be $54.31 PEPM.

5. Medi-Cal administrative expense

The primary categories of expense that will be expanded would be expenses relating to eligibility determination and enrollment in prepaid plans. There would also be a modest increase in the workloads of the central staff and auditors. All additional expenses would be marginal expenses, since the same basic systems and procedures in place for Medi-Cal would be extended to the new eligible groups.

The most important new expense would be determining eligibility for a large new population. There would also be increased cost to calculate a new category of rates and to integrate the new beneficiary class into the current system of contracting with prepaid plans. The new categories would also produce an increase in auditing expense and the cost to analyze encounter data from the prepaid plans. Even relatively large such increases in the work loads of central staff, however, would not produce more than nominal increases in administrative outlays.

We have been provided the following information from the operation of the Medi-Cal program and plans for an expansion through Medi-Cal to cover new eligible children:

  • Medi-Cal reimburses the counties $119.51 per intake per case (family) and $20.46 per month for “ongoing costs”.
  • Planning for an expansion of Medi-Cal under the Child Health Program is based on payment to the counties of $119.51 per case “at least once per case” per year for “intake” and “redetermination” after any year of continuous eligibility and an allowance of $10.23 per month per active case.

The latter amounts appear excessive for the marginal costs of administering an expansion population under Medi-Cal, but would produce the $116.02 projected per case (and something more than the $9.67 projected in the August 27 description, as a monthly cost per eligible since some children would not be eligible for multiples of full years). In addition, although eligibility determination is the largest expense of an expansion of Medi-Cal, it is not the only additional expense. There would also be increases in Medi-Cal expenditures for a number of other functional expenses, including hearings and appeals, auditing of payments to health plans, central office staff time, etc.

The level of reimbursement to counties, however, appears to be excessive for the marginal cost of determining eligibility for an expansion population in which incomes should be more stable, and for which income verification will not have to be performed for all eligibles (since many with relatively low health needs will never apply). We also note that past expansions of eligibility of children do not appear to have produced significant increases in Medi-Cal administrative costs as a percentage of benefits Consequently, we will base our estimate on an average administrative expense for eligibility of 60% of that projected, and increase the result by 1% of the average benefits per capita (including payments to health plans) to allow for other functions.

This produces an average administrative cost of $6.34 in addition to the basis of payment to health plans, bringing the total estimate to $60.65 PEPM.

6. Payment of bad debts

An important effect of the expansion should be some relief to major providers from the burden of bad debts. The primary beneficiaries would be the “essential providers”, i.e. institutions that now receive Disproportionate Share payments and cross subsidies to Federally Qualified Health Centers. To the extent that the state’s share of differential payments (including the extent to which a higher payment rate has been built into the two plan county rates) will be reduced by the new benefits, the state’s cost for the program will be reduced.

7. Coverage of children now covered by employer plans

A strong incentive is created by the new coverage for families that now pay for coverage of their children through employer plans to drop this coverage. Their children would become eligible for Medicaid immediately.

Medicaid, however, can consider such coverage in determining eligibility. Further, the Medicaid eligibility is designed to detect employment and ask about such coverage, and the questions would be repeated quarterly. Medicaid has the option (and, if cost-effective, is required by HCFA) to pay the employee contribution rates to obtain coverage for persons eligible for Medicaid. It should be noted, however, that this affects aggregate outlays, but not necessarily the PEPM).

8. Selection

The average rate PEPM derived above is determined for coverage of the full population eligible for the expansion, estimated to be some 580,000 children. In practice, only some fraction of these children would actually become enrolled, issued health cards and enrolled in prepaid plans. Thus there would continue to be a FFS program paying some claims for eligibles before they are enrolled in prepaid plans. The method of estimation implicitly averages such claim payments and the cost of processing with the premium rates paid to the prepaid plans.

Further, although those who are enrolled will include most with major health expenses, some of the expenses of the potential expansion population will not be paid under the expansion because the providers to not find obtaining eligibility worth the effort and because some care will not be provided to those who do not obtain eligibility. On the other hand, the average cost per person found eligible will be significantly higher than the average expenditure per potential eligible derived above.

9. Other considerations

One possible shortcoming of the estimates derived above is that the plans may balk at the level of rates being offered. Since we assume the newly covered group will be offered as part of the overall package, however, a decision to withdraw would necessarily involve losing the rest of the Medi-Cal enrollment. For this reason, we only mention the possibility that the increased size of the contract at what appear to be below market rates may result in some loss of potential contractors.

Consortia Plan

1. Base

The most important consideration in the choice of a base is to emulate the procedures that will be followed to determine the premium rates that will be paid for the coverage. A fundamental difference between the procedures used to determine rates for the consortia plans offered in California and the managed Medicaid plans is that the plans are free to bid rates that they believe constitute prudent business decisions, without the implicit threat of loss of existing market share.

In contrast, in the managed Medi-Cal program, the prepaid plans must accept the rates offered, or not participate. Many have participated despite the apparently low level of payment rates offered. Further, if additional volume is not accepted, the plans would lose their present share of this market. It is much more difficult for a HMO management to decide to drop an existing product line than to decide not to bid on a new class of business.

The most appropriate base for which we have adequate publicly available information from which to estimate the premium rates that would be bid by health plans in a new program offered by MRMIB would be the average of the HMO “Preferred” plans being offered through the HIPC, averaged over the areas in which the uninsured children live. This base is most appropriate for the CCHP plan because:

  • The mechanism is more like that to be used for CCHP than CalPERS, since there will be needs to maintain eligibility roll by individual/family, eligibility depends on payment of premiums (complete with grace periods), there are enrollments taking place throughout the year, etc.
  • In addition, enrollment is open to biased selection through dumping of sick employees by very small employers (who constitute a large proportion of the actual enrollment).
  • The average is less biased toward urban areas where there are proportionately more civil servants than the near poverty population.

Since we do not have the enrollment by plan in HIPC, nor any rates specifically for children living alone, we determine an adjusted premium rate for those plans offered widely throughout each of the six HIPC areas from that charged for single adults using (i) standard demographic relationships relating to the average cost of covering children and single adults through HMOs and (ii) the average Medi-Cal costs of children over age one to that for all children under age 19.

The next step is based on an assumption concerning how the premium rates would be charged, namely that payments by CCHP would be based on the lowest rate of prepaid plans widely available throughout each county (less $8.00) and families would be responsible for the additional premium charged by the health plan chosen. This would mean that the CCHP expenditure would in effect be based on the premium rates of the lowest cost plan in each county. To simulate this basis, we based the estimate on the average of the lowest cost among plans widely available in each area. (We believe that this method (i) overweights areas 1 and 2, which have the highest of the lowest premium rates for widely available plans to offset (ii) a bias in projecting the lowest cost plans (usually Kaiser Permanente) to be fully available in all counties in areas 3 through 6. The result was an average child premium of $60.03.

2. Adjustments to benefit package

We estimate the benefits included in the August 27 descriptive proposal. (These benefits may have to be increased to meet the “actuarial equivalence tests” required by federal law.) Accordingly, adjustments must be made for including vision care (including eyeglasses) and a full benefit package for preventive and restorative services for dental care. We estimate the cost of these additional benefits to be $7.25.

3. Projection to first program year

The present HIPC rates are for calendar year 1997. We are estimating the average cost during the first operating year of a program that would be in effect during 1999, and perhaps begin as early as July 1998. We project the cost for July 1998 through June 1999. Thus the general level of rates needs to be projected for 1.5 years. The projection was made at 3.5% annually.

4. Administrative expenses

The average administrative expenses will be significantly higher than currently experienced in the HIPC for:

  • Enrollment, eligibility determination and premium processing for individual family units rather than employers, meaning smaller numbers of persons per contract.
  • Premium collection costs will be higher, with more late payments and grace period notices and processing. (Dealing with inexperienced family heads rather than the administrators of small employers.)
  • More rapid turnover, with higher finders fees and enrollment expenses as a proportion of total expenses.
  • Units are limited to one or more children, without any adults, meaning both smaller families and much lower premium per family unit, than found in individual insurance.

Administrative expenses as a percentage of the average benefits will be increased for two primary reasons: (i) the additional cost to deal with individual families, especially low income families and (ii) the cost of administrative functions will be divided by a much lower average premium per unit.

Unlike the situation with an expansion of Medi-Cal, a new operation is to be brought into existence under MRMIB, requiring the hiring a completely new staff, renting new facilities and purchase or lease of equipment, software, etc. The cost to set up and run the organization will be a higher percentage of the relatively low premium rates for children compared to those of the HIPC. Thus there should be no savings compared to the level of functional costs of the HIPC, but these will constitute a much higher percentage of benefits.

The primary functional area in which the unit expenses will be greater is in dealing with individual enrollments and all the attendant problems. The complications will affect both the umbrella organization and the health plans, although primarily the former. (It is also not clear that the HMOs will build the additional cost of dealing with individuals into their bids, since many HMOs cross subsidize individual product administrative expenses.)

Typical administrative expenses of health insuring organizations that deal primarily with individuals run 15% to 20% or more of benefits (although much of this is marketing expenses). Further, although the average duration of individual health insurance policies tends to be relatively short, e.g. an average of three to four years, turnover in the population to be covered is likely to be much higher, perhaps one third to one half of the enrollment each year. Further, by limiting coverage to children in the families, there is less premium over which to spread the cost of administration. Consequently, the average administrative expenses are likely to run an order of magnitude higher than for the current mix of small employer groups. The $50 finder’s fees, which are payable for nearly all new enrollments, with one-third turnover each year, by themselves increase premiums by nearly 2%.

The most suitable starting point would be the total administrative costs of the HIPC divided by the number of employment groups. This would be biased upward, since the cost to deal with employment groups of many individuals will be higher than for a family. But the calculation is likely to be more instructive than beginning with the percentage allowance in the current HIPC rates.

In comparison to the administrative costs found in Medi-Cal, allowances must be made for the additional functions associated with coverage dependent not only on eligibility determination but on the collection of monthly premium rates, especially given the targeted income group and the creation of a completely separate organization to handle all staff functions. The latter include:

  • Maintaining enrollment files
  • Premium collection (including pursuit of unpaid premiums due)
  • Margins to fund uncollectible premiums due and interest on grace periods
  • Commissions and finders’ fees
  • Accounting, audit, etc.
  • Actuarial
  • Investment of surplus
  • Employee services and benefits management
  • Insurances (e.g. E&O)
  • Provider/plan relations
  • Compliance with regulations and other staff functions (e.g. legal, actuarial, etc.).
  • Corporate overhead
  • Risk/profit charges to fund increasing needs for working capital.

Although this is a highly uncertain estimate, it is difficult to see how administrative expenses could be less than 10% to 15% of benefits. This compares to a present level of administrative expenses of a few percent of premium built into the rates charged by the HIPC, i.e. an increase of the order of 5% beyond the percentage included in HIPC rates. Compounding these factors from the base rate yields a final cost per child of $74.39.

4. Anti-selection

The average cost per child under the proposed CCHP program would be increased by limiting eligibility to those willing to pay the premium. This is not reflected in these estimates. As with the August 27 proposal’s support material, for purposes of discussing the relative merits of alternative implementations, the estimates are based on a “high cost” scenario reflecting enrollment at the total number of uninsured eligible children implied by Census data.

5. Coverage of children now covered by employer plans

A strong incentive is created by the new coverage for families that now pay for coverage of their children through employer plans to drop this coverage. Their children would become eligible for the new program after six months.

There would appear to be few barriers to such conversion of child coverage from employer plans to CCHP. First, eligibility is only determined on an annual basis, and without the kind of investigation that is likely to find all existing insurance coverage. Further, some families would decide that a six month waiting period was well worth having the new program pick up a much higher proportion of the cost. Thus a substantial coverage of children now covered by employer sponsored insurance must be anticipated under this program. However, as noted previously, this primarily affects the aggregate program costs, rather than the PEPM.

Talking about STDs with Health Professionals: Women’s Experiences – Report

Published: Aug 31, 1997

Talking About STDs with Health Professionals

Women’s Experiences

More than 12 million new cases of sexually transmitted diseases (STDs) other than HIV/AIDS, including three million among teenagers alone, occur every year. At current rates, at least one person in four will contract an STD at some point in his or her life. With as many as 56 million individuals – more than one in five Americans – estimated to be currently infected with an incurable viral STD such as herpes or genital warts, STDs remain a serious health threat in this country. In fact, STD rates in the United States are the highest in the industrialized world, and are higher than in some developing countries.

More than 1 in 5 Americans is estimated to be currently infected with an incurable viral STD.

Source: Centers for Disease Control and Prevention, 1993While public education efforts by the Centers for Disease Control and Prevention (CDC) and the American Social Health Association (ASHA) along with the release of studies such as the one issued November 1996 from the Institute of Medicine (IOM), The Hidden Epidemic: Confronting Sexually Transmitted Diseases, have helped to focus greater national attention on the STD epidemic, the general public remains largely unaware of the prevalence and risk of STDs. In a Kaiser Family Foundation survey conducted at the time of the release of the IOM report, less than a quarter of Americans over the age of 18 when asked what STDs they were aware of, named chlamydia – the most common STD and, according to the CDC, the most prevalent reportable infectious disease of any kind. Just 2 percent could name trichomoniasis or ‘trich,’ the STD with the second highest incidence in the U.S., at 3 million estimated cases annually. One in ten respondents could not name any STDs. Perhaps even more disconcerting was how limited most Americans’ knowledge is about the link between STDs and HIV, with more than half (56%) of respondents unaware that STD infections increase susceptibility to the HIV virus.

Another survey by the Foundation conducted with Glamour magazine earlier this year also found that many women may be mistakenly assuming they are being screened for STDs during routine gynecological exams. Two out of five women 18-44 years old (42%) said they believed they are automatically tested, that is without requesting it, for at least some STDs other than HIV as part of their regular gynecological exams. A pap smear – the primary purpose of which is to screen for cervical cancer – can also detect genital warts, in some cases. However, the test does not detect other more common STDs such as chlamydia, gonorrhea, and trich. Specific STD screening and testing is generally at the discretion of the doctor or at the request of the patient. Although the American College of Obstetricians and Gynecologists (ACOG) recommends testing for STDs other than HIV for women at ‘risk’ for STDs (defined in general as women who have a history of STDs or of multiple sex partners), routine screenings are not necessarily always – or ever – included as part of a woman’s routine exam.

percentages.jpg

Building on this previous study as well as on anecdotal evidence that many women may not always be getting the care they assume they are getting or even assessing their own risk appropriately when it comes to STDs, Kaiser Family Foundation and Glamour partnered again for a second survey to learn more about how women and their health providers approach the issue of STDs during gynecological or obstetrical visits. In particular, we were curious to learn about how often and with which patients doctors and other health professionals are discussing STDs, whether health providers are counseling women on the risk factors for STDs, and how women feel about their experiences talking about – or not talking about – STDs with their health provider.

The topics asked about are based on ASHA’s Personal Health History form and ACOG’s Guidelines for Women’s Health Care. To attempt to answer these questions, staff at the Foundation in coordination with Glamour magazine staff devised a survey that queried 482 women between the ages of 18-44 who had been to a new doctor within the last year for gynecological or obstetrical care. Criteria used to select the sample were based on an assumption that the first gynecological or obstetrical visit with a new patient was the one most likely for doctors or other health professionals to discuss STDs.

The survey found that not only do STDs rarely get discussed during gynecological or obstetrical visits, but many women may not be adequately screened by their health providers for their risk of STDs. The survey also indicated that women generally expected STDs to be discussed with them by their provider as part of routine reproductive care, and that many are very receptive to automatic testing even at additional costs. A summary of the key findings follows. The survey is also reported on in the October 1997 issue of Glamour.

What the Experts Say…According to the American Social Health Association (ASHA), information on sexual history is integral to assessing a patient’s risk for STD infection. In fact, questions about sexual history are part of an STD risk assessment form developed by ASHA for use by doctors. A woman’s number of sexual partners is important information her health professional should know, according to Contraceptive Technology (1994) and the American College of Obstetricians and Gynecologists (ACOG) Guidelines for Women’s Health Care (1996). Contraceptive Technology recommends asking every patient how many sexual partners he/she has had in the last year. ACOG’s guidelines also recommend a clinician ask every patient about his/her sexual history and practices, which includes their number of sexual partners. ACOG states that a patient’s number of sexual partners may not only indicate STD risk, but also help determine the best method of contraception for her.Findings:

Many women may not be screened adequately for STDs by their health providers.

Only 15 percent of women of reproductive age say they had a conversation with a health professional about STDs at their first visit for gynecological or obstetrical care. Many of the women who did not have a conversation about STDs reported not providing their health professional with the information he or she would have needed to adequately assess the patient’s risk for STDs, such as:

  • 35 percent of these women said they did NOT provide information about whether they were currently sexually active;
  • 61 percent said they did NOT provide information about whether they were in a monogamous relationship;
  • 67 percent said they did NOT provide information about whether they used condoms regularly;
  • 77 percent said they did NOT provide information about how many sexual partners they had had in the last year;
  • 94 percent said they did NOT provide information about oral or anal sex.

In fact, one in five of these women (20%) said they did not think their health provider had enough information to make an adequate assessment of their risk. Of those women who did not have a conversation about STDs with a health professional but thought that he or she should have discussed the subject with them, almost one in three (30%) said they did not think their health provider had enough information to accurately assess their risk.

There is also evidence that many women may not be informed about STD risk factors. Significant percentages of women who felt their health provider had enough information to know whether they were at risk for STDs reported that they did not provide basic information about their current and past sexual activity that may have affected that assessment. Because American men and women have such limited knowledge about STDs, many of these women may not know what information specifically their health provider should have gathered from them to assess their STD risk. Given the national estimates for STDs in this country, it is likely that some of these women are under-estimating their risks or may not even be aware of whether they have an STD.

Although most women – 92 percent – filled out a form with questions about their medical history when they saw their new health provider for the first time, only half – 54 percent – said that form included questions about sexual history or current sexual activity even though the purpose of their visit was for gynecological or obstetrical care.

Health providers rarely discuss STDs as part of gynecological or obstetrical visits.

As compared to other reproductive and sexual health topics, such as birth control or breast exams, health professionals initiated conversations about STDs far less often. Only about one in ten (12%) health professionals raised the subject of STDs with a new patient. Eight in ten (83%) believe it is a topic that should be a part of routine counseling when seeing a new doctor for gynecological care.

About a third (32%) of health providers who talked about STDs with a patient recommended testing. Women were most likely to report the provider recommended tests for gonorrhea, HIV/AIDS, chlamydia, and syphilis. Those who did have conversations generally reported being made to feel ‘very comfortable’ about the discussion (76%). Few felt ‘judged’ in any way (94% said no; 6% yes).

topics_discussed.jpg

Women expect their health providers to raise the subject of STDs.

Most women (64%) say it is up to the health professional to raise the topic of STDs during a gynecological visit. A quarter (23%) say it is primarily the patient’s responsibility to initiate this conversation, and 12 percent say the responsibility is shared. In fact, a third (33%) of the women who did not discuss STDs during their visit thought their health provider should have raised the subject with them.

Eighty-six percent of women who did discuss STDs during their first visit with a new doctor said they felt it was ‘expected’ that the topic would come up. About half (47%) said they were ‘relieved’ once it was discussed.

The Real Facts: The Most Common STDs

pix.gif

STD

pix.gif

Incidence(in US pop.)

pix.gif

Curable?

pix.gif

Symptoms

pix.gif

Long-term Health Effects

pix_black.gif

Chlamydia4,000,000YesGenital discharge, burning during urination. Women: lower abdominal pain, pain during intercourse. Men: swelling or pain in testicles.If left untreated, may lead to PID

pix_black.gif

Trichomoniasisor”Trich”3,000,000YesVaginal discharge, vaginal odor, discomfort during intercourse, and painful urination.Inflammation of fallopian tubes, low birth weight and premature infants.

pix_black.gif

Pelvicinflammatory disease(PID)1,000,000YesDull pain or tenderness in the lower abdomen, abnormal periods, abnormal vaginal discharge, nausea and/or vomiting, fever and chills.Damages the fallopian tubes, making it difficult or impossible for a woman to have children. Increased risk for ectopic pregnancy, chronic abdominal pain, pelvic adhesions (tissue grows which connects internal organs together), pelvic abscesses.

pix_black.gif

HPVorgenitalwarts500,000 – 1,000,000NoWarts on the vulva, vagina, anus, cervix, penis or scrotum, which may lead to itching, pain or bleeding.Increased risk of cervical cancer.

pix_black.gif

Gonorrhea80,000YesDischarge from penis, vagina or rectum, and burning or itching during urination. Sore throat.If left untreated, may lead to PID.

pix_black.gif

Genitalherpes200,000 – 500,000NoItching or burning in genital area; pain in the legs, buttock, or genital area, or vaginal discharge. Flu-like symptoms.Nerve pain, inflammation of spinal cord, urethral strictures, and miscarriage, stillbirth, or non surviving premature infant.

pix_black.gif

Syphilis101,000YesPainless sore (chancre) on genitals or in vagina, skin rash and flu-like symptoms, mild fever, fatigue, sore throat, hair loss and swollen glands throughout body.In late, or tertiary stage, mental illness, blindness, heart disease and death.

pix_black.gif

HIV/AIDS80,000NoFlu-like symptoms, such as fever, loss of appetite and weight, fatigue, enlarged lymph modes.Partial paralysis/weakness of muscles, symptoms affecting the spinal cord, lowered resistance to opportunistic infections, increased risk of cervical cancer, and death.

Return to top Next

Talking About STDs with Health Professionals: Women’s Experiences: Report Part One Part Two Press Release Survey

Why Some Men Don’t Use Condoms: Male Attitudes about Condoms and Other Contraceptives

Published: Aug 30, 1997
  • Report: Why Some Men Don’t Use Condoms: Male Attitudes About Condoms and Other Contraceptives

Small Employers and Health Insurance and State Reforms of Small Group Health Insurance

Published: Aug 30, 1997

Fact sheets on health insurance among small employers and state reforms of small group health insurance.

  • Fact Sheet: Small Employers and Health Insurance
  • Fact Sheet: Small Employers and Health Insurance
  • Fact Sheet: State Reforms of Small Group Health Insurance
  • Fact Sheet: State Reforms of Small Group Health Insurance

What are HIV Prevention Needs of Adults Over 50?

Published: Aug 30, 1997
  • Fact Sheet: What Are HIV Prevention Needs of Adults Over 50?

Retiree Health Trends and Implications of Possible Medicare Reforms – Report

Published: Aug 30, 1997

Retiree Health Trends and Implications of Possible Medicare Reforms

Prepared by: Hewitt Associates LLC

Prepared for: Kaiser Medicare Policy Project

September 1997

Preparation of this report was supported by The Henry J. Kaiser Family Foundation Grant Number 96-1710B. The study consists of a review and analysis of recent trends in the provision of employer-sponsored health benefits to retirees, as well as an assessment of potential changes to employer-sponsored retiree health plans in the future, including the effects of certain proposed changes to Medicare. The views expressed in this paper are solely the responsibility of the authors and do not necessarily represent those of The Henry J. Kaiser Family Foundation.

Acknowledgments

This report was prepared by Frank B. McArdle, Ph.D., and Dale H. Yamamoto, F.S.A., of Hewitt Associates, a global management consulting firm specializing in human resource solutions. Saline Leckman prepared the tables allowing for a comparison of trends between 1991 and 1996. Libby Terry and Nancy Newman collaborated on many aspects of this report.

For Further Information Contact:

    Frank B. McArdle, Ph.D.Hewitt Associates LLC2401 Pennsylvania Avenue, N.W.Suite 450Washington, DC 20037(202) 331-1155

Contents

Executive Summary

Retiree Health Benefits Play an Important Role

Employer-sponsored retiree health benefits are a source of valuable coverage to individuals, both through the provision of coverage to early retirees before they become eligible for Medicare and as a supplement to Medicare for retirees age 65 and over. More than a third (approximately 12 million) of Medicare aged and disabled beneficiaries have employer-sponsored coverage.

In 1996, most large employers (1,000 or more employees) provided some form of retiree health benefits, of which the vast majority provided coverage both before and after age 65. However, because of rising health care costs and changes in accounting rules, and after years of expanding coverage and benefits, the prevalence of employers offering such coverage has been declining since the early 1990s; eligibility has been tightened; and more of the costs have been shared with retirees.

In addition, because Medicare pays a large portion of the costs for post-65 retirees, certain proposed changes to Medicare could potentially accelerate the decline in retiree health coverage by shifting financial liability to employers and to retirees.

The purpose of this study is twofold:

  • Document trends in retiree health benefits using an extensive database that annually tracks benefit provisions of major employers, and
  • Analyze the potential impact on retiree health plans of major Medicare reform proposals, such as increasing the age of eligibility.

Key Trends

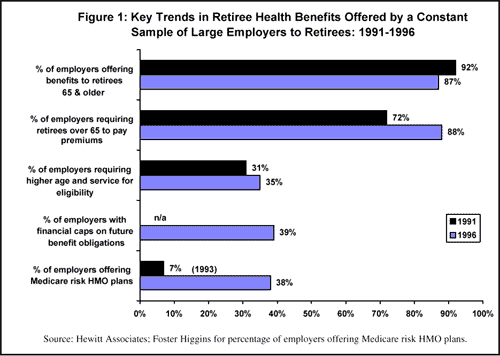
Part I of this report analyzes key trends in retiree health plans for a constant sample1 of large companies in the Hewitt database, finding that between 1991 and 1996, the vast majority of large employers continued to provide retiree health benefits, but there were significant changes in coverage, eligibility rules, and beneficiary contribution requirements. (Figure 1 summarizes selected key findings with respect to coverage of retirees.)

Availability of coverage declined for retirees ages 65 and over

  • For retirees age 65 and over, the share of large employers offering retiree benefits declined from 92 percent in 1991 to 87 percent in 1996.2

More retirees charged premiums

  • The share of large employers requiring pre-65 retirees to pay premiums increased from 85 percent in 1991 to 95 percent in 1996, and increased for post-65 retirees from 72 percent in 1991 to 88 percent in 1996.

Eligibility for postretirement medical coverage tightened through higher age and service requirements

  • The percentage of large employers setting minimum eligibility requirements for benefits at age 55 and 10-15 years of service (versus age 50 and shorter years of service) increased from 31 percent in 1991 to 35 percent in 1996.

Financial caps placed on future retiree health obligations

  • Virtually no large employers had financial caps on their future benefit obligations in 1991. By 1996, 39 percent of large employers have some form of dollar cap on the employer’s contribution for post-65 retiree coverage, and 36 percent had caps on pre-65 coverage.

More employers encourage use of managed care for retirees

  • The number of large employers offering Medicare risk HMOs has grown sharply from 7 percent in 1993 to 38 percent in 1996, according to other survey data.3

Implications of Medicare Reforms

Changing our focus from existing trends to possible future changes in retiree health plans, Part II of this report considers another potential wave of changes that might result from three significant Medicare reform proposals.

Option #1: Proposed increase in the Medicare age of eligibility

During the recent Medicare reform debate in connection with the Balanced Budget Act of 1997, the Senate included a provision that would have gradually raised the Medicare age of eligibility from 65 to 67, in tandem with the already scheduled increase in the Social Security eligibility age. Although dropped from the final bill, this issue will likely be revisited, and if enacted, could have a significant impact on retiree health plans. A few examples of the impact of raising the eligibility age include:

  • Raising the Medicare eligibility age to 67 would mean that plan costs for a 65-year-old retiree could be two to four times higher (depending on plan design) for each year of coverage without Medicare.
  • For a typical large company with a predominately younger workforce, the employer’s actuarial cost for lifetime retiree health benefits would rise about 16 percent (18 percent for a large employer with an older workforce).
  • Employer response to the eligibility age increase will vary, but the increased costs could encourage them to reduce (or eliminate) their retiree health financial commitment to active employees, while preserving coverage for current retirees, along with plan design changes.
    • For example, eliminating Medicare eligibility may increase the retiree health plan costs for a 66-year old from $1,000 per person per year to $4,000. To keep the cost effect neutral, the employer could require the retiree to pay the extra $3,000 for coverage, or redesign the plan to offset the increased cost. A cost-neutral plan redesign might include, for example, a $10,000 deductible, 50 percent coinsurance, with a $50,000 out-of-pocket limit on the retiree’s obligations.

Option #2: Changes in Medicare payments to Medicare HMOs

With employers increasingly moving toward Medicare managed care to keep costs down and provide comprehensive coverage to retirees, the favorable financial impact of that strategy could be significantly affected by changes in the way Medicare pays health plans in the future.

The Balanced Budget Act of 1997 makes significant changes in payments to Medicare managed care plans, in part to increase payment rates in rural areas but also to reduce future Medicare spending increases. Employers will soon begin the process of assessing what the specific financial impact of these changes may be. The revised payment formulas may significantly alter the geography of Medicare managed care plan offerings to retirees, as well.

Smaller payment increases in certain areas of the country as a result of the 1997 legislation could potentially make managed care plans less attractive to employers and to retirees in those areas if HMO benefits are reduced or premiums rise. Alternatively, payment and other policies that support the expansion of Medicare managed care may help to stabilize retiree health benefit coverage by helping to manage employer costs over the long term.

Option #3: Proposed shift to a defined contribution program

Another option for reforming Medicare, supported by some experts in the health care community, is to shift away from having Medicare pay the cost of each beneficiary’s care, e.g., a defined benefit approach, toward a defined contribution approach in which Medicare would pay a fixed sum for each beneficiary, who would then use that sum, e.g., through a voucher-like mechanism, to select coverage from competing health plans. In fact, the Balanced Budget Act of 1997 creates a private fee-for-service option under Medicare+Choice. The conferees note that this private fee-for-service option “represents the first defined contribution plan in which beneficiaries may enroll in the history of the [Medicare] program.”4

Broad-based use of a defined contribution approach, while empowering retirees to choose their own health plan, also shifts financial risk to employers sponsoring retiree health plans and to retirees. In addition, that cost shift could grow over time if the defined contribution rate increases yet fails to keep pace with medical inflation. This is particularly worrisome to employers because Medicare coverage is already less generous than what large employers typically offer active employees. Comparing the plan value of Medicare benefits to those of 250 large employers participating in the 1996 Hewitt Health Value InitiativeTM database, 82 percent of the indemnity plans offered to active employees provide higher benefit levels than Medicare.

A broad-based defined contribution scheme for Medicare could also create administrative complexities for employers, in terms of the difficulty of coordinating the retiree plan with the specific Medicare health plans retirees choose, and determining an appropriate price for them.

The combination of financial and administrative impacts could thus lead employers to reassess the manner and the extent of coverage they offer to future retirees.

Summary

Retiree health benefits remain important to employees and retirees, even though the prevalence of such coverage has declined, eligibility has tightened, and more cost sharing is required of retirees. Potentially the biggest source of profound changes to employer-sponsored retiree health programs in the future would come from proposals to restructure the Medicare program. Depending on their specific nature, such changes could either create a safety net beneath employer-sponsored coverage for retirees or create additional incentives for employers to cut back. Policymakers focusing on potential reforms of Medicare would be well advised to take a more integrated look at the interactions between Medicare coverage and the employer-sponsored retiree health coverage on which millions of retirees still depend.

About the Hewitt Associates Database

Hewitt Associates has been tracking the salaried employee benefit provisions of major employers since 1972 through annual updates to its database of companies. The 1996 Hewitt database contains plan design information on 1,050 major employers, including 62 percent of Fortune 500 companies. Analyses of trends based on large employers (e.g., those with usually at least 1,000 employees) provides a reliable indication of the main sponsors of employer-provided coverage for retirees, because smaller firms are far less likely to provide such coverage. Ninety percent of the Hewitt database consists of companies employing 1,000 or more employees; 57 percent of the database consists of companies with 5,000 or more employees, representing roughly 25 percent of all public and private companies in the United States of that size.

1318-chart1.gif

Return to top

Retiree Health Trends And Implications Of Possible Medicare Reforms:Press Release Fact SheetReport Part One Part Two Part Three Part Four Part Five Part Six Part Seven Part Eight

Retiree Health Trends and Implications of Possible Medicare Reforms – Fact Sheet

Published: Aug 30, 1997

Retiree Health Trends And Implications Of Possible Medicare Reforms

September 1997

Approximately 12 million of Medicare’s 39 million beneficiaries receive employer-sponsored retiree health benefits as a supplement to their Medicare coverage. In addition, millions of retired workers under age 65 rely on retiree health benefits as their primary source of health insurance coverage. While employer-sponsored health insurance is an important source of coverage for current retirees, health benefits for future retirees are uncertain.

Retiree Health Benefits Decline, 1991-1996

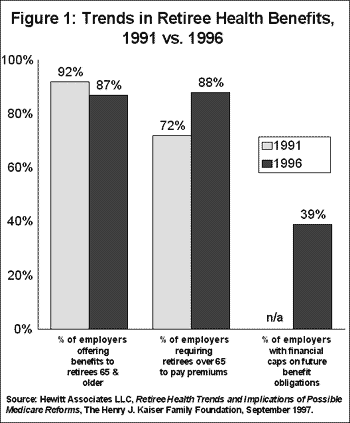
A declining share of large employers offered health benefits to retirees in 1996 compared to 1991, and an increasing share implemented reforms to limit their financial liability for retiree coverage (Figure 1), based on an analysis of a constant sample of about 600 large employers (with 1,000+ employees) conducted by Hewitt Associates LLC.

1318-fig1.gif

Availability of retiree coverage has declined:

Based on a constant sample of large employers, the share of employers offering retiree benefits to retirees age 65 and over declined from 92 percent in 1991 to 87 percent in 1996. Coverage for pre-65 retirees remained relatively stable. By comparison, the proportion of all large firms offering retiree coverage declined from 80% in 1991 to 71% in 1996, based on the Hewitt database.

Required payment of premiums has increased:

The share of large employers requiring post-65 retirees to pay premiums increased from 72 percent in 1991 to 88 percent in 1996; for pre-65 retirees, the share increased from 85 percent to 95 percent.

Use of financial caps has grown:

Dollar caps on future employer obligations for retiree health costs has emerged as a new feature of retiree benefits. In 1991, virtually no large employers had such caps; by 1996, 39 percent had caps on post-65 retiree coverage and 36 percent had caps on pre-65 coverage.

Other reforms have been implemented:

Between 1991 and 1996, a growing share of large employers tightened eligibility requirements, increased deductibles, raised contributions for dependent coverage, and increased enrollment of retirees in managed care plans.

The trend toward declining retiree benefits in the 1990s is due to a number of factors including: the pressure to control increasing health care costs; new accounting rules (FAS 106) which require companies to report accrued future retiree health benefit liabilities on their current financial statements; and employer concerns about the future financial impact of an aging population.

Medicare Reforms Affect Employer-Sponsored Retiree Coverage

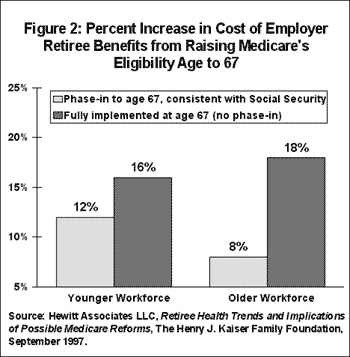
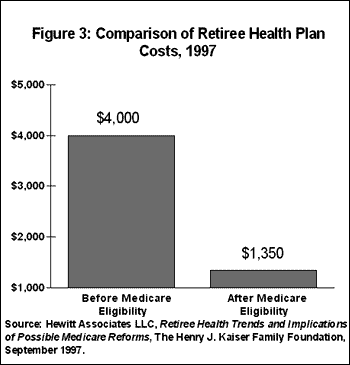
Because retiree health benefits generally supplement Medicare for retirees age 65 and older, changes in the Medicare program are likely to affect health care costs incurred by both employers and retirees. For example, raising Medicare’s eligibility age gradually from 65 to 67 (linking the Medicare and Social Security eligibility age) would increase the actuarial costs for lifetime retiree benefits by 12 percent for large employers with a younger workforce and by 8 percent for employers with an older workforce (Figure 2). When fully implemented at age 67 (no phase-in), this change would increase costs by 16 percent for employers with a younger workforce and by 18 percent for employers with an older workforce. This is because the average per person cost of health coverage for a retiree before Medicare eligibility is about three times the cost of a retiree with Medicare coverage ($4,000 vs. $1,350, respectively) (Figure 3).

1318-fig2.gif
1318-fig3.gif

Changes in Medicare HMO payments could also impact retiree health costs. Higher Medicare HMO payments in rural areas, as enacted under the Balanced Budget Act of 1997, could encourage the migration of plans to rural areas and allow employers in these areas to move additional retirees into managed care plans. However, reductions in future Medicare payments to HMOs in other areas could make managed care a less attractive option for employers and retirees if HMOs respond to payment changes by offering fewer benefits or charging higher premiums.

More comprehensive Medicare reforms under discussion, such as a shift to a defined contribution program, could also impact employer-sponsored retiree coverage. Under a defined contribution approach, Medicare would pay a fixed sum on behalf of each beneficiary and beneficiaries could apply the amount to the cost of coverage from a variety of Medicare-approved private health plans. If Medicare’s defined contribution rate does not keep pace with medical inflation, additional costs are likely to be shifted to employers, retiree with employer-sponsored coverage, and other beneficiaries.

Issues

Employer-sponsored retiree health plans play an important role in covering retirees both before and after Medicare eligibility. Retirees are generally at an age when health problems tend to increase, annual incomes decline, and coverage for medical expenses becomes more critical. Since 1991, there have been declines in the availability and generosity of retiree health benefits offered by employers. Employers and retirees face significant financial risks from potential changes to the Medicare program because of the strong interaction between employer-sponsored retiree health benefits and the Medicare program.

This fact sheet is based on Retiree Health Trends and Implications of Possible Medicare Reforms, prepared by Hewitt Associates LLC with support from the Kaiser Family Foundation, September 1997. This study analyzed key trends in retiree health plans from 1991 through 1996 using a constant sample of large companies (generally those with at least 1,000 employees) in the Hewitt Associates database. The 1996 Hewitt database contains plan design information for 1,050 major employers. The study also analyzed the potential impact of Medicare reform options on retiree health plans.

Return to top

Retiree Health Trends And Implications Of Possible Medicare Reforms:Press Release Fact Sheet Report