Medicaid Expenditures and Beneficiaries: National and State Profiles and Trends, 1990-1995
The independent source for health policy research, polling, and news.

In 1995, 17.5 million children — one-quarter of all children under age 18 — had Medicaid coverage for health care services. Medicaid, the federal/state health program for the poor, pays for a broad range of services for children including well-child care, immunizations, prescription drugs, doctor visits, and hospitalization, and a range of long-term care services for children with disabilities.
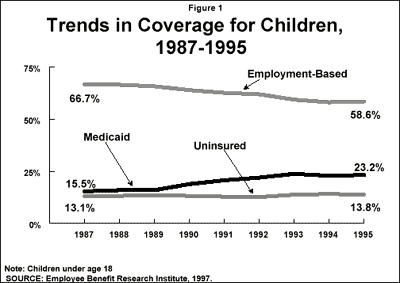
Medicaid plays a particularly strong role for low-income children, covering two-thirds (64%) of all poor children and a quarter( 27%) of children with incomes between 100% and 199% of the federal poverty level (FPL). While employer-based insurance coverage of children declined from 1987 to 1995, expansions in Medicaid have resulted in greater coverage of children in low-income families (Figure 1). During this same period, Medicaid enrollment grew from about 10 million — 15.5% of all children — to 17.5 million children (23.2%).
Despite the importance of Medicaid today, about 10 million children are uninsured. Lack of insurance is particularly high among low-income children. Seventy percent of uninsured children are in families with incomes below 200% of poverty. The new State Child Health Insurance Program, enacted as part of the Balanced Budget Act of 1997, is intended to provide coverage to this group.
Eligibility
Being poor does not automatically qualify a child for Medicaid. In the past 15 years, Medicaid eligibility for children has been broadened considerably through federal legislation and state optional expansions. Prior to 1986, Medicaid primarily served children who received AFDC cash assistance. Today, children qualify for Medicaid based on their age and income.
Medicaid coverage is especially prominent among young children, covering 33% of infants and 29% of children ages 1 to 5. Because recent expansions focused on young children, older children are less likely to qualify for Medicaid. Medicaid covers 22% of children between the ages of 6 to 12 years and 17% of teens between the ages of 13 to 18 years.
Medicaid Coverage of Children:
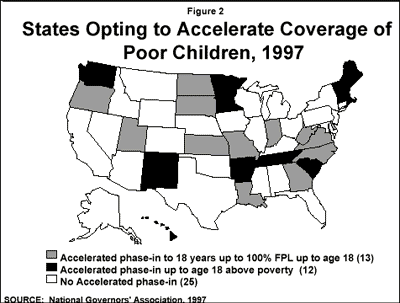
States are mandated to cover certain groups of children based on age and income criteria. By 2002, all states will be required to have phased-in coverage of children under age 19 with incomes below poverty. States can choose to expand Medicaid eligibility beyond federal minimum standards by raising age and income levels for children (Figure 2). They can also use Section 1115 research and demonstration waivers to broaden eligibility. In total, 41 states have expanded Medicaid coverage to children in one or more age or income levels. Federal coverage requirements for children are as follows:
Because states established varied Medicaid income eligibility levels for children, and because of state variations in per capita income there is considerable variation in Medicaid coverage, ranging from 13% of children in Colorado to 47% in West Virginia. Similarly, Medicaid pays for 39% of all births nationally, but coverage varies from 21% of births in Massachusetts to 61% in Georgia.
The Balanced Budget Act (BBA) of 1997 creates new options for states to strengthen and expand Medicaid coverage for children. The new State Children’s Health Insurance Program (CHIP) was enacted as part of the Balanced Budget Act (BBA) of 1997. This new capped federal program allocates $20.3 billion over five years in the form of a matched grant to states to expand coverage to uninsured low-income children through either a separate state program or by broadening Medicaid — or both. The funds became available on October 1, 1997 and are targeted to uninsured children under 19 with income below 200% of poverty who are not eligible for Medicaid or not covered by private insurance.
Provisions of the Balance Budget Act also included some important changes to Medicaid. It clarifies the state Medicaid option to accelerate the phase-in for children born before September 30, 1983. In addition, the new law gives states the option to extend presumptive eligibility to children, meaning that services provided to low-income uninsured children will be covered by Medicaid before the Medicaid eligibility determination process is complete. States can also offer 12 month continuous eligibility to children, regardless of any changes in family income during that period.
Services and Costs
Federal guidelines require that Medicaid cover a comprehensive set of services with nominal or no cost-sharing for children. Access to these services is important because poor children experience more health problems than more affluent children. Children with Medicaid are eligible to receive physician and outpatient services, prescription drugs, inpatient hospital care, and long-term care services.
Medicaid coverage also entitles children to early and periodic screening, diagnostic, and treatment (EPSDT) services including a comprehensive health and developmental history and physical exam, immunizations, laboratory tests including blood lead levels, and health education. Children found to have conditions requiring further attention are covered for needed treatment.
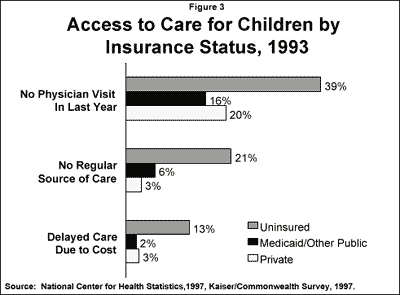
The importance of health insurance in securing access to health care services is well documented. Despite their complex health and social needs, children with Medicaid coverage have access to care that is similar to higher income privately insured children (Figure 3).
In 1995, Medicaid spent $25.4 billion on health care services for 17.5 million children in low-income families and about $7.1 billion for one million disabled children. The majority (93%) of the expenditures for non-disabled children are for acute care services, with one third for inpatient hospital care.
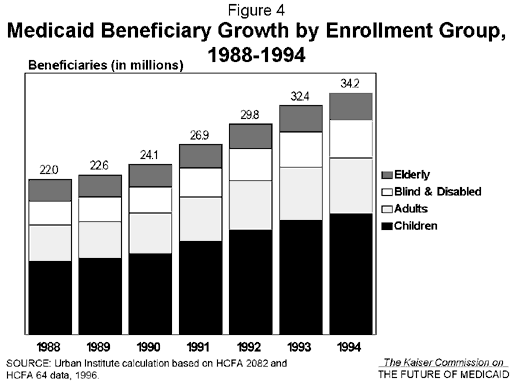
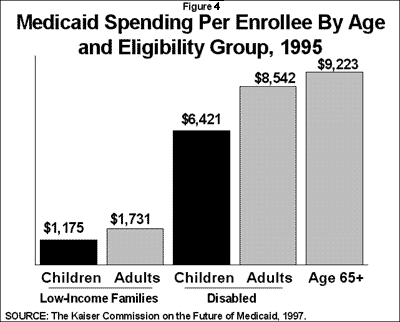
While low-income children represent half of the 35 million Medicaid beneficiaries, they account for only 16.7% of overall Medicaid spending. In 1995, Medicaid spent an average of $1,175 per low-income child enrolled in the program. On average, children cost less to care for than older Medicaid beneficiaries, but some disabled children have very costly health and long-term care needs. Medicaid spent an average of $6,421 per year per child qualifying on the basis of disability (Figure 4).
Issues and Challenges
Expanding Coverage.
To broaden coverage of low-income uninsured children, Congress enacted the new State Child Health Insurance Program and included provisions to allow states to facilitate enrollment and continuity of coverage under Medicaid. Key issues facing state Medicaid agencies include how the new children’s program will be structured, financed, and implemented, as well as how it will be integrated with or build on the state’s existing Medicaid program.
Participation.
An estimated 3 million of the 9.8 million uninsured children are eligible for but not enrolled in Medicaid. This is largely due to enrollment barriers or lack of awareness of the program. States can streamline the eligibility process and facilitate enrollment. For example, 25 states allow mail-in eligibility applications and 29 states have dropped the asset test. Medicaid eligibility policy has also changed markedly as a result of the 1996 welfare law, which eliminated the automatic link between cash assistance and Medicaid. Ongoing and intensified outreach and educational efforts will be necessary to assure that all the children who are eligible for assistance under Medicaid are enrolled.
Managed Care.
In 1996, 40% of beneficiaries were enrolled in managed care, mostly low-income children and their parents. The BBA of 1997 expands state flexibility by allowing states to mandate Medicaid managed care enrollment without requiring states to obtain a Section 1115 or 1915(b) waiver. States will still need a waiver to mandatorily enroll special needs children, but will be able to enroll other non-disabled children. Managed care has the potential to improve access to preventive and primary care, but given the vulnerable nature of the Medicaid population, it requires careful implementation and monitoring to assure quality and access.
Medicaid Facts: Medicaid’s Role for Children
This fact sheet provides an overview of children’s eligibility and coverage under Medicaid, summarizes Mediciad benefits and expenditures for children, and highlights key issues facing the program as it continues to serve children.
A booklet to help health care consumers understand managed care.
The September/October 1997 edition of the Kaiser Family Foundation/Harvard Health News Index includes questions about major health stories covered by news media, including questions about AIDS, Condoms in Schools and Tobacco Companies. The survey was based on a national random sample of 1,007 Americans conducted October 17-21, 1997 which measures public knowledge of health stories covered in the news media the previous month. The Health News Index is designed to help the news media and people in the health field gain a better understanding of which health stories in the news Americans are following and what they understand about those health issues. Every two months, Kaiser/Harvard issues a new index report.
Health care benefits had been offered to active employees for a long period of time before health coverage became a retiree benefit offered by employers. The key event that made employer-sponsored retiree health care a possible benefit for retirees was the enactment of Medicare in 1965. It was then felt possible to provide a widely desired benefit at a relatively low cost, since the Medicare program would pay the majority of the costs.
Millions of Retirees Have Employer-Sponsored Coverage
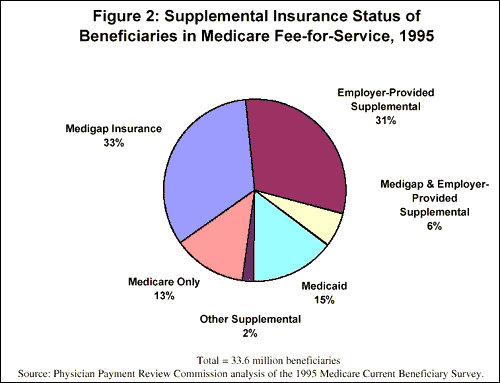
Based on the 1995 Medicare Current Beneficiary Survey5 analysis by Physician Payment Review Commission (PPRC), about 12 million individuals (37 percent of Medicare aged and disabled beneficiaries) have employer-provided supplemental coverage, including about 2 million with employer-provided coverage and Medigap.
Retiree Health Is a Highly Valued Medicare Supplement
As with other matters related to retirement, the appreciation of retiree health benefits increases with age. For example, based on a Hewitt database of employee surveys, there is a twelve-fold increase in value assigned to retiree health care benefits for employees age 55 and over compared to the group age 25 to 34.6
The availability of employer-provided coverage is more critical for the pre-65 retirees because they will generally not have access to other insurance or it will be very expensive for them to purchase, if it is available at all. Post-65 retirees at least have Medicare if they have no other health insurance.
Even Medicare, however, provides a relatively low level of benefit when compared to the typical employer plan for active employees. Comparing the Medicare level of benefits to 250 large employers participating in the 1996 Hewitt Health Value InitiativeTM who offer indemnity type benefits, the Medicare design falls in the lowest quartile measured by plan value (18th percentile). That is, 82 percent of the indemnity plans offered by large employers to active employees provide richer or better benefit levels than traditional Medicare. Most of the employers participating in the 1996 Hewitt Health Value Initiative have more than 5,000 employees. Employers with fewer employees will tend to provide a lower level of benefit.
Assuming that the typical employer medical plan considers about 65 percent of total health care costs as a cost covered by the medical plan (excluded costs include items such as over-the-counter drugs, dental care and eye glasses)7, and that the average indemnity medical plan reimburses about 83 percent of covered costs8, the typical employer plan will pay 54 percent (0.83
State Reforms of Small Group Health Insurance
Between 1989 and 1995, 45 states enacted laws to make health insurance more accessible and attractive to small businesses. The small group market was targeted for reform because about half of all uninsured workers are either self-employed or working in firms with fewer than 25 employees (EBRI, 1996).
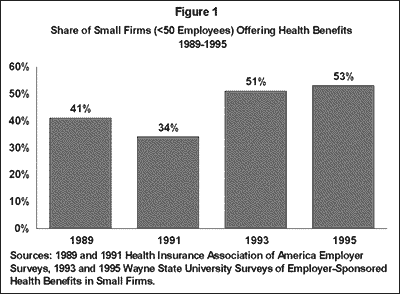
The problem is that only about half of all small firms offer health insurance (Figure 1). In 1995, 53% of small businesses (<50 employees) offered health benefits, and while this is up from 1989 when only 41% offered coverage, it is still much lower than health coverage among larger firms.
Many insurers are willing to sell coverage to small firms, but some insurer practices in the small group market have drawn concern. Some companies refused to sell policies to businesses in specific “high-risk” industries for example, or to firms with fewer than 10 employees. Also, because insurers tended to base premiums for small groups on the medical histories of prospective enrollees, some small businesses have reported that the poor health of their employees or employees’ dependents resulted in their inability to qualify for coverage.
Although these problems exist, they are not widespread. Most small firms say that they can get coverage if they want it. More than three-quarters (of both insured and uninsured small firms) say that they have been solicited to buy health insurance in the last six months, and more than a third indicate that they have received at least six or more inquires.
Three General Types of Small Group Reform
“Bare-bones” policies.
These laws allow insurers to sell “bare-bones” insurance to certain classes of small firms, typically those newly entering the group coverage market. The policies are dubbed “bare-bones” because they are usually exempt from most mandated benefit laws and premium taxes, which allows small firms to purchase basic coverage at lower premiums.
Premium regulations.
Premium rating bands or requirements that insurers follow community rating are two examples of such regulations. These rules are intended to narrow the range in premiums, so that coverage will be more affordable for higher-risk firms.
Standards for underwriting and contracting practices.
These are designed to make coverage both more attractive and available to employers. Included under this category are laws which:
The most common reforms are listed in Figure 2 with the number of states that have enacted them. In many cases, the state enacted a small package of measures in 1991 or 1992 and then adopted additional reforms a couple of years later. By 1995, most states had enacted all of the reforms listed here.
Figure 2Small Group Reforms at the State Level Number of States with the Measure as of: Type of State Legislative Reform: ’89 ’91 ’93 ’95 Bare-Bones Insurance Plans Can be Sold 1 9 31 43
To provide an independent source of information about the cost of covering uninsured children in California, the Henry J. Kaiser Family Foundation commissioned an analysis by the Actuarial ResearchCorporation (ARC), which provides actuarial assistanceto a variety of public and private clients. ARC’s analysis suggests that expanding California’s Medicaid program (which is called Medi-Cal) would be substantially less expensive than developing a new private insurance program as proposed.