A Consumers Guide to Understanding Managed Care
A booklet to help health care consumers understand managed care.
Poll Finding
Kaiser/Harvard Health News Index, September/October 1997
The September/October 1997 edition of the Kaiser Family Foundation/Harvard Health News Index includes questions about major health stories covered by news media, including questions about AIDS, Condoms in Schools and Tobacco Companies. The survey was based on a national random sample of 1,007 Americans conducted October 17-21, 1997 which measures public knowledge of health stories covered in the news media the previous month. The Health News Index is designed to help the news media and people in the health field gain a better understanding of which health stories in the news Americans are following and what they understand about those health issues. Every two months, Kaiser/Harvard issues a new index report.
Comparison of the Medicaid Provisions in the Balanced Budget Act of 1997 (P.L. 105-33) with Prior Law
- Report: A Comparison of the Medicaid Provisions in the Balanced Budget Act of 1997 (P.L. 105-33) w-Prior Law
Small Employers and Health Insurance and State Reforms of Small Group Health Insurance – Fact Sheet
State Reforms of Small Group Health Insurance
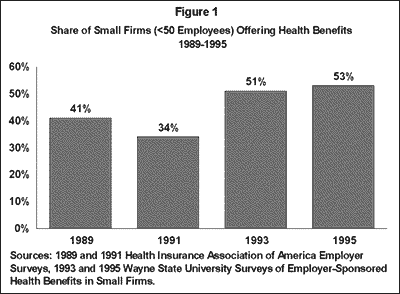
Between 1989 and 1995, 45 states enacted laws to make health insurance more accessible and attractive to small businesses. The small group market was targeted for reform because about half of all uninsured workers are either self-employed or working in firms with fewer than 25 employees (EBRI, 1996).
The problem is that only about half of all small firms offer health insurance (Figure 1). In 1995, 53% of small businesses (<50 employees) offered health benefits, and while this is up from 1989 when only 41% offered coverage, it is still much lower than health coverage among larger firms.
Many insurers are willing to sell coverage to small firms, but some insurer practices in the small group market have drawn concern. Some companies refused to sell policies to businesses in specific “high-risk” industries for example, or to firms with fewer than 10 employees. Also, because insurers tended to base premiums for small groups on the medical histories of prospective enrollees, some small businesses have reported that the poor health of their employees or employees’ dependents resulted in their inability to qualify for coverage.
Although these problems exist, they are not widespread. Most small firms say that they can get coverage if they want it. More than three-quarters (of both insured and uninsured small firms) say that they have been solicited to buy health insurance in the last six months, and more than a third indicate that they have received at least six or more inquires.
Three General Types of Small Group Reform
“Bare-bones” policies.
These laws allow insurers to sell “bare-bones” insurance to certain classes of small firms, typically those newly entering the group coverage market. The policies are dubbed “bare-bones” because they are usually exempt from most mandated benefit laws and premium taxes, which allows small firms to purchase basic coverage at lower premiums.
Premium regulations.
Premium rating bands or requirements that insurers follow community rating are two examples of such regulations. These rules are intended to narrow the range in premiums, so that coverage will be more affordable for higher-risk firms.
Standards for underwriting and contracting practices.
These are designed to make coverage both more attractive and available to employers. Included under this category are laws which:
- limit the non-issue of policies to certain types of firms,
- guarantee the renewability of employer coverage,
- allow insured persons to move between plans without having to satisfy new pre-existing condition clauses, and
- limit initial waiting periods that workers must satisfy for coverage of their pre-existing conditions.
The most common reforms are listed in Figure 2 with the number of states that have enacted them. In many cases, the state enacted a small package of measures in 1991 or 1992 and then adopted additional reforms a couple of years later. By 1995, most states had enacted all of the reforms listed here.
Figure 2Small Group Reforms at the State Level Number of States with the Measure as of: Type of State Legislative Reform: ’89 ’91 ’93 ’95 Bare-Bones Insurance Plans Can be Sold 1 9 31 43
Retiree Health Trends and Implications of Possible Medicare Reforms
Health care benefits had been offered to active employees for a long period of time before health coverage became a retiree benefit offered by employers. The key event that made employer-sponsored retiree health care a possible benefit for retirees was the enactment of Medicare in 1965. It was then felt possible to provide a widely desired benefit at a relatively low cost, since the Medicare program would pay the majority of the costs.
Millions of Retirees Have Employer-Sponsored Coverage
Based on the 1995 Medicare Current Beneficiary Survey5 analysis by Physician Payment Review Commission (PPRC), about 12 million individuals (37 percent of Medicare aged and disabled beneficiaries) have employer-provided supplemental coverage, including about 2 million with employer-provided coverage and Medigap.
Retiree Health Is a Highly Valued Medicare Supplement
As with other matters related to retirement, the appreciation of retiree health benefits increases with age. For example, based on a Hewitt database of employee surveys, there is a twelve-fold increase in value assigned to retiree health care benefits for employees age 55 and over compared to the group age 25 to 34.6
The availability of employer-provided coverage is more critical for the pre-65 retirees because they will generally not have access to other insurance or it will be very expensive for them to purchase, if it is available at all. Post-65 retirees at least have Medicare if they have no other health insurance.
Even Medicare, however, provides a relatively low level of benefit when compared to the typical employer plan for active employees. Comparing the Medicare level of benefits to 250 large employers participating in the 1996 Hewitt Health Value InitiativeTM who offer indemnity type benefits, the Medicare design falls in the lowest quartile measured by plan value (18th percentile). That is, 82 percent of the indemnity plans offered by large employers to active employees provide richer or better benefit levels than traditional Medicare. Most of the employers participating in the 1996 Hewitt Health Value Initiative have more than 5,000 employees. Employers with fewer employees will tend to provide a lower level of benefit.
Assuming that the typical employer medical plan considers about 65 percent of total health care costs as a cost covered by the medical plan (excluded costs include items such as over-the-counter drugs, dental care and eye glasses)7, and that the average indemnity medical plan reimburses about 83 percent of covered costs8, the typical employer plan will pay 54 percent (0.83
Estimated Cost of a Child Health Program in California – Report
Estimated Cost of a Child Health Program in California
Prepared by Gordon R. Trapnell, F.S.A., Actuarial Research Corporation
For the Kaiser Family Foundation
September 10, 1997
Summary
The Balanced Budget Act of 1997 created a new federal/state program to cover uninsured children. The new federal legislation provides states with a substantial amount of flexibility in designing their child health insurance programs by expanding their existing Medicaid programs, creating new state child health insurance programs, or a combination of both. This report provides an analysis of the cost of covering California children through the options available under the federal program.
The analysis is based on an August 27th plan presented by the Wilson Administration for covering uninsured children in California — the California Children’s Health Plan (CCHP). A key element of the proposed CCHP is to expand coverage to uninsured children using a private insurance mechanism, which the Wilson Administration has said would be slightly less expensive on a per child basis than using the Medicaid program (which is called Medi-Cal in California). The Wilson Administration estimates that the proposed CCHP would cost $74.75 per child per month, while expanding Medi-Cal would cost $76.60 per child. These figures do not include premium contributions made by families or various state administrative costs that might be required under either approach. If families made an average $8 monthly premium contribution per child as suggested in the CCHP proposal, then the government’s cost per child under the CCHP would drop to $66.75 per month. The table on page 33 of the Administration’s published August 27th plan shows that the estimated total program costs assuming full participation at 580,000 children under Medi-Cal would be more costly than under their proposed private insurance approach.
Our analysis follows the same basic approach used in the comparative fiscal analysis in the August 27th description of the CCHP. Our analysis finds that while the per month enrollee premium estimate for a private insurance plan is only slightly less than the premium estimated by the Administration for its private insurance proposal, the per enrollee cost of a Medi-Cal approach is significantly less than the Administration’s Medi-Cal estimate. The primary reason our cost estimates for the Medi-Cal option are less expensive than the Wilson Administration’s Medi-Cal estimates is that we have assumed that children who will enroll in the new program will be less expensive than children currently enrolled in Medi-Cal. In a full-participation scenario, we find that a Medi-Cal expansion would be significantly less costly than a private insurance approach. (See Exhibit 1)
In sum, in our analysis:
- the cost of a private insurance option would be $74.39 per child per month, slightly less (-0.5%) than the Wilson Administration’s estimates for its CCHP proposal;
- the cost of a Medi-Cal approach would be $60.65 per child per month, substantially less (-21%) than the Wilson Administration’s Medi-Cal estimates. As a result, we estimate that a Medi-Cal approach would cost 18 percent less than the Wilson Administration’s CCHP private insurance option. If the average $8 per month enrollee premium contribution per child is used to offset government expenditures under the private option, the private insurance option premium would be $66.39, making the Medi-Cal estimated cost 9 percent less than the private insurance option amount.
The Wilson Administration estimates that 580,000 uninsured children would be eligible for a new program. Our analysis suggests that if all of these children enrolled (and no currently insured children dropped private coverage and became eligible), then using our estimate of per child costs would yield a Medi-Cal option cost for 1998 that would be approximately $96 million per year less than a private insurance option. If a family average premium contribution of $8 per enrollee per month is used to offset government expenditures under the private option, government spending for the Medi-Cal expansion option would be approximately $40 million per year less than for the private insurance option.
One reason why using Medi-Cal might be less expensive than providing coverage through a private insurance mechanism is that Medi-Cal has historically paid providers at lower rates than private health plans. However, the benefits provided by Medi-Cal are more comprehensive — and therefore more expensive — than those provided by most private health plans (and than those provided in the proposed CCHP).
Exhibit 1
ARC Premium Calculations For Child Health Insurance In California — CY 1998
Per Child Per Month Costs Medi-Cal Option Base Monthly Per Capita $50.32 Adjusted Benefit Package $50.22 Projected to 1998 $54.86 Adjusted to HMO rates $54.31 Adjusted for Additional Administrative Functions $60.65 HIPC-Based Consortia Plan (Private Insurance Option) Base Monthly Per Capita $60.03 Adjusted Benefit Package $67.28 Projected to 1998 $70.84 Adjusted to HMO rates $70.84 Adjusted for Additional Administrative Functions $74.39
Estimated 1998 Aggregate Costs(Maximum-Enrollment-Based Calculations, Assuming Total Enrollment of 580,000) Medi-Cal Plan $422.1 million Consortia Plan – gross $517.8 million minus $8/month enrollee charge $55.7 million Net Consortia Plan $462.1 million Difference $40.0 million Source: Estimates based on analysis by Actuarial Research Corporation.
Objective
Our objective is to estimate the cost per child covered of implementing a Child Health Program in California (CCHP) in one of two modes:
- Through an expansion of Medi-Cal income limits and liberalizing asset restrictions
- Through an independent program as suggested by Governor Wilson, modeled on the California HIPC structure, but with plans limited to HMOs (and EPOs) in order to keep cost sharing at levels suitable for a low income population.
In both cases we project the incurred cost of the first year of an expansion or new program that begins in July 1998.
Medi-Cal Expansion
1. Base
We do not have a comprehensive set of premium rates for Medi-Cal, but rather:
- A DHS tabulation of the Medi-Cal FFS claims for children other than infants and foster children, for the period July 1995 through June 1996.
- A somewhat detailed description of the derivation of the original premium rates proposed for Local Initiatives and Commercial Plans under the two plan model county rates from the experience of the Santa Barbara County Operated Health Plan, together with supporting data and information provided in the report “Two Plan Model; Capitation Rates for July 1, 1995 – May 31, 1996 and June 1, 1996 – September 30, 1997.”
- DHS estimates of the average incurred FFS cost per capita for (i) members of families and (ii) foster children for the periods July ’95 through June ’96 and July ’96 through June ’97. In both cases the estimates exclude the costs of those institutionalized and specialized services for such children, and any other services not capitated with the “local initiative” prepaid plans.
- A comprehensive set of HMO payment rates from several years ago.
In addition, we have a copy of the Capitation Rate Manual for Fiscal Year 1990-91, compiled by the California Medi-Cal actuaries, which provides a number of factors concerning key financial relationships.
Of these data sets the most relevant are (i) the rate structure derived from the Santa Barbara plan and calibrated with the estimated average FFS claims incurred per capita for July 1996 through June 1997 and (ii) the tabulation, apparently on an incurred basis, of a sample of children ages 1-18. The average incurred FFS cost per child per month of eligibility from the DHS tabulation for the period July 1995 through June 1996 was $50.32 per eligible per month (PEPM).
This rate is somewhat lower than the average FFS cost per eligible month in that period for foster children in the eight counties in which the two plan model will be implemented, $58.20 (which was actually higher than the estimated cost a year later of $57.47). This cost PEPM for foster children appears to be higher than found in the tabulation of all children for some combination of area differentials (most of the two plan counties are in the areas with higher average Medi-Cal costs) and a higher average cost for foster children than for children in families (which apparently are somewhat older on average and may include more children with special Medi-Cal needs). Both the estimate for foster children and that for all eligible children exclude the cost of expensive conditions found in infants.
Given the methodology followed by California in setting rates to be paid to health plans, the estimated FFS cost PEPM in July ’95 through June ’96 appears to provide the most reliable basis for an estimate of what the State would offer HMOs to cover an expanded child population. (It also necessarily provides the basis for an estimate of the average that would be paid if the services are not provided through prepaid plans, i.e. on a FFS basis.) The California methodology, well documented by the Medi-Cal actuaries in various reports, has been to:
- Project the average FFS cost by category of eligibility, age-sex group and county of residence
- Adjust for difference in the average cost of those eligible for enrollment in an HMO in each category of eligibility
- Adjust for differences in the benefits for which HMOs are responsible and those retained by Medi-Cal
- Increase the per capitas by an allowance for those state administrative expenses that will be replaced by contracting with managed care plans
- Decrease the results for the state’s share of managed cost savings.
Prepaid plans are offered the resulting rates on a take it or leave it basis.
In addition, the total paid to prepaid plans can not exceed estimates of what would have been paid in a FFS system, according to Federal laws and regulations. Thus the estimated FFS cost PEPM controls what can be paid to prepaid plans under Medicaid, and is by definition what a FFS program would cost.
The rate structure derived by the Medi-Cal actuaries produces numbers that appear to be reasonable in relationship to those from the FFS tabulation, but require adjustments for:
- Deriving a rate for children between 1st and 18th birthdays from the average family member rates
- Area differences between payments in the twelve two plan counties and the entire state
- Differences in the benefit package offered through the prepaid plans and all Medi-Cal benefits (to the extent that benefits were limited in the prepaid benefit packages).
Since each of these steps may involve error, we rely here on the rate ($50.23) derived from FFS data for a population most like what is to be enrolled under CCHP. However, we note that to the extent that the new program will enroll some age groups in larger numbers than others (especially if distinctions are introduced), this provides a promising base for estimates of the relative cost of different age groups.
2. Adjustments to benefit package and eligibility
By definition, the benefit package would be the same as the full Medicaid program. Thus the tabulations of FFS data cited above exclude services not currently capitated with HMOs. The value for the average experience of all eligible children during the twelve months ending in June 1996 appears to include all categories of benefits, including some related to institutional services. These should probably be excluded from the estimate, on the grounds that most needing institutional services are already eligible for Medi-Cal, and would not be included in the expansion population. The adjustment appears to be a decrease of the order of $.10 PEPM.
It is not clear whether the services provided to crippled children are included in the base data. If they were, the cost PEPM should be further reduced by around 5% to allow for the relatively high cost per capita of this group, compared to what may be expected to be found in the expansion program.
3. Projection to First Program Year
The period for which the base rates were tabulated was from July 1995 through June 1996. The estimates from DHS estimates for the average incurred FFS cost per capita for (i) members of families and (ii) foster children for the periods July 1995 through June 1996 and July 1996 through June 1997 can be used to update this base for another year. The average increase is 2.1%.
The resulting rate represents the average cost of FFS Medi-Cal during the period from July 1996 through June 1997. We wish to project the cost to the period July 1998 through June 1999, which occurs two years later. We project the increase to be 3.5% per year. After incorporating these two trend factors, the estimated average FFS claims incurred for non-infant non-foster-child Medi-Cal children is $54.86.
4. Adjustments for prepaid plan payment rates
Medi-Cal has increased payment rates to HMOs by 1% to reflect the estimated savings in Medi-Cal administrative expenses, and decreased rates by a small percentage to obtain a state share of managed care savings, e.g. a projected 2% in the calculation of two plan county rates. The rates are also reduced by around 0.5% to reflect a loss of interest when capitations are paid in advance rather than claims paid some time after the date on which services are performed.
After these adjustments, the average payment rates to prepaid plans for Medi-Cal children ages 1 – 18 would be $54.31 PEPM.
5. Medi-Cal administrative expense
The primary categories of expense that will be expanded would be expenses relating to eligibility determination and enrollment in prepaid plans. There would also be a modest increase in the workloads of the central staff and auditors. All additional expenses would be marginal expenses, since the same basic systems and procedures in place for Medi-Cal would be extended to the new eligible groups.
The most important new expense would be determining eligibility for a large new population. There would also be increased cost to calculate a new category of rates and to integrate the new beneficiary class into the current system of contracting with prepaid plans. The new categories would also produce an increase in auditing expense and the cost to analyze encounter data from the prepaid plans. Even relatively large such increases in the work loads of central staff, however, would not produce more than nominal increases in administrative outlays.
We have been provided the following information from the operation of the Medi-Cal program and plans for an expansion through Medi-Cal to cover new eligible children:
- Medi-Cal reimburses the counties $119.51 per intake per case (family) and $20.46 per month for “ongoing costs”.
- Planning for an expansion of Medi-Cal under the Child Health Program is based on payment to the counties of $119.51 per case “at least once per case” per year for “intake” and “redetermination” after any year of continuous eligibility and an allowance of $10.23 per month per active case.
The latter amounts appear excessive for the marginal costs of administering an expansion population under Medi-Cal, but would produce the $116.02 projected per case (and something more than the $9.67 projected in the August 27 description, as a monthly cost per eligible since some children would not be eligible for multiples of full years). In addition, although eligibility determination is the largest expense of an expansion of Medi-Cal, it is not the only additional expense. There would also be increases in Medi-Cal expenditures for a number of other functional expenses, including hearings and appeals, auditing of payments to health plans, central office staff time, etc.
The level of reimbursement to counties, however, appears to be excessive for the marginal cost of determining eligibility for an expansion population in which incomes should be more stable, and for which income verification will not have to be performed for all eligibles (since many with relatively low health needs will never apply). We also note that past expansions of eligibility of children do not appear to have produced significant increases in Medi-Cal administrative costs as a percentage of benefits Consequently, we will base our estimate on an average administrative expense for eligibility of 60% of that projected, and increase the result by 1% of the average benefits per capita (including payments to health plans) to allow for other functions.
This produces an average administrative cost of $6.34 in addition to the basis of payment to health plans, bringing the total estimate to $60.65 PEPM.
6. Payment of bad debts
An important effect of the expansion should be some relief to major providers from the burden of bad debts. The primary beneficiaries would be the “essential providers”, i.e. institutions that now receive Disproportionate Share payments and cross subsidies to Federally Qualified Health Centers. To the extent that the state’s share of differential payments (including the extent to which a higher payment rate has been built into the two plan county rates) will be reduced by the new benefits, the state’s cost for the program will be reduced.
7. Coverage of children now covered by employer plans
A strong incentive is created by the new coverage for families that now pay for coverage of their children through employer plans to drop this coverage. Their children would become eligible for Medicaid immediately.
Medicaid, however, can consider such coverage in determining eligibility. Further, the Medicaid eligibility is designed to detect employment and ask about such coverage, and the questions would be repeated quarterly. Medicaid has the option (and, if cost-effective, is required by HCFA) to pay the employee contribution rates to obtain coverage for persons eligible for Medicaid. It should be noted, however, that this affects aggregate outlays, but not necessarily the PEPM).
8. Selection
The average rate PEPM derived above is determined for coverage of the full population eligible for the expansion, estimated to be some 580,000 children. In practice, only some fraction of these children would actually become enrolled, issued health cards and enrolled in prepaid plans. Thus there would continue to be a FFS program paying some claims for eligibles before they are enrolled in prepaid plans. The method of estimation implicitly averages such claim payments and the cost of processing with the premium rates paid to the prepaid plans.
Further, although those who are enrolled will include most with major health expenses, some of the expenses of the potential expansion population will not be paid under the expansion because the providers to not find obtaining eligibility worth the effort and because some care will not be provided to those who do not obtain eligibility. On the other hand, the average cost per person found eligible will be significantly higher than the average expenditure per potential eligible derived above.
9. Other considerations
One possible shortcoming of the estimates derived above is that the plans may balk at the level of rates being offered. Since we assume the newly covered group will be offered as part of the overall package, however, a decision to withdraw would necessarily involve losing the rest of the Medi-Cal enrollment. For this reason, we only mention the possibility that the increased size of the contract at what appear to be below market rates may result in some loss of potential contractors.
Consortia Plan
1. Base
The most important consideration in the choice of a base is to emulate the procedures that will be followed to determine the premium rates that will be paid for the coverage. A fundamental difference between the procedures used to determine rates for the consortia plans offered in California and the managed Medicaid plans is that the plans are free to bid rates that they believe constitute prudent business decisions, without the implicit threat of loss of existing market share.
In contrast, in the managed Medi-Cal program, the prepaid plans must accept the rates offered, or not participate. Many have participated despite the apparently low level of payment rates offered. Further, if additional volume is not accepted, the plans would lose their present share of this market. It is much more difficult for a HMO management to decide to drop an existing product line than to decide not to bid on a new class of business.
The most appropriate base for which we have adequate publicly available information from which to estimate the premium rates that would be bid by health plans in a new program offered by MRMIB would be the average of the HMO “Preferred” plans being offered through the HIPC, averaged over the areas in which the uninsured children live. This base is most appropriate for the CCHP plan because:
- The mechanism is more like that to be used for CCHP than CalPERS, since there will be needs to maintain eligibility roll by individual/family, eligibility depends on payment of premiums (complete with grace periods), there are enrollments taking place throughout the year, etc.
- In addition, enrollment is open to biased selection through dumping of sick employees by very small employers (who constitute a large proportion of the actual enrollment).
- The average is less biased toward urban areas where there are proportionately more civil servants than the near poverty population.
Since we do not have the enrollment by plan in HIPC, nor any rates specifically for children living alone, we determine an adjusted premium rate for those plans offered widely throughout each of the six HIPC areas from that charged for single adults using (i) standard demographic relationships relating to the average cost of covering children and single adults through HMOs and (ii) the average Medi-Cal costs of children over age one to that for all children under age 19.
The next step is based on an assumption concerning how the premium rates would be charged, namely that payments by CCHP would be based on the lowest rate of prepaid plans widely available throughout each county (less $8.00) and families would be responsible for the additional premium charged by the health plan chosen. This would mean that the CCHP expenditure would in effect be based on the premium rates of the lowest cost plan in each county. To simulate this basis, we based the estimate on the average of the lowest cost among plans widely available in each area. (We believe that this method (i) overweights areas 1 and 2, which have the highest of the lowest premium rates for widely available plans to offset (ii) a bias in projecting the lowest cost plans (usually Kaiser Permanente) to be fully available in all counties in areas 3 through 6. The result was an average child premium of $60.03.
2. Adjustments to benefit package
We estimate the benefits included in the August 27 descriptive proposal. (These benefits may have to be increased to meet the “actuarial equivalence tests” required by federal law.) Accordingly, adjustments must be made for including vision care (including eyeglasses) and a full benefit package for preventive and restorative services for dental care. We estimate the cost of these additional benefits to be $7.25.
3. Projection to first program year
The present HIPC rates are for calendar year 1997. We are estimating the average cost during the first operating year of a program that would be in effect during 1999, and perhaps begin as early as July 1998. We project the cost for July 1998 through June 1999. Thus the general level of rates needs to be projected for 1.5 years. The projection was made at 3.5% annually.
4. Administrative expenses
The average administrative expenses will be significantly higher than currently experienced in the HIPC for:
- Enrollment, eligibility determination and premium processing for individual family units rather than employers, meaning smaller numbers of persons per contract.
- Premium collection costs will be higher, with more late payments and grace period notices and processing. (Dealing with inexperienced family heads rather than the administrators of small employers.)
- More rapid turnover, with higher finders fees and enrollment expenses as a proportion of total expenses.
- Units are limited to one or more children, without any adults, meaning both smaller families and much lower premium per family unit, than found in individual insurance.
Administrative expenses as a percentage of the average benefits will be increased for two primary reasons: (i) the additional cost to deal with individual families, especially low income families and (ii) the cost of administrative functions will be divided by a much lower average premium per unit.
Unlike the situation with an expansion of Medi-Cal, a new operation is to be brought into existence under MRMIB, requiring the hiring a completely new staff, renting new facilities and purchase or lease of equipment, software, etc. The cost to set up and run the organization will be a higher percentage of the relatively low premium rates for children compared to those of the HIPC. Thus there should be no savings compared to the level of functional costs of the HIPC, but these will constitute a much higher percentage of benefits.
The primary functional area in which the unit expenses will be greater is in dealing with individual enrollments and all the attendant problems. The complications will affect both the umbrella organization and the health plans, although primarily the former. (It is also not clear that the HMOs will build the additional cost of dealing with individuals into their bids, since many HMOs cross subsidize individual product administrative expenses.)
Typical administrative expenses of health insuring organizations that deal primarily with individuals run 15% to 20% or more of benefits (although much of this is marketing expenses). Further, although the average duration of individual health insurance policies tends to be relatively short, e.g. an average of three to four years, turnover in the population to be covered is likely to be much higher, perhaps one third to one half of the enrollment each year. Further, by limiting coverage to children in the families, there is less premium over which to spread the cost of administration. Consequently, the average administrative expenses are likely to run an order of magnitude higher than for the current mix of small employer groups. The $50 finder’s fees, which are payable for nearly all new enrollments, with one-third turnover each year, by themselves increase premiums by nearly 2%.
The most suitable starting point would be the total administrative costs of the HIPC divided by the number of employment groups. This would be biased upward, since the cost to deal with employment groups of many individuals will be higher than for a family. But the calculation is likely to be more instructive than beginning with the percentage allowance in the current HIPC rates.
In comparison to the administrative costs found in Medi-Cal, allowances must be made for the additional functions associated with coverage dependent not only on eligibility determination but on the collection of monthly premium rates, especially given the targeted income group and the creation of a completely separate organization to handle all staff functions. The latter include:
- Maintaining enrollment files
- Premium collection (including pursuit of unpaid premiums due)
- Margins to fund uncollectible premiums due and interest on grace periods
- Commissions and finders’ fees
- Accounting, audit, etc.
- Actuarial
- Investment of surplus
- Employee services and benefits management
- Insurances (e.g. E&O)
- Provider/plan relations
- Compliance with regulations and other staff functions (e.g. legal, actuarial, etc.).
- Corporate overhead
- Risk/profit charges to fund increasing needs for working capital.
Although this is a highly uncertain estimate, it is difficult to see how administrative expenses could be less than 10% to 15% of benefits. This compares to a present level of administrative expenses of a few percent of premium built into the rates charged by the HIPC, i.e. an increase of the order of 5% beyond the percentage included in HIPC rates. Compounding these factors from the base rate yields a final cost per child of $74.39.
4. Anti-selection
The average cost per child under the proposed CCHP program would be increased by limiting eligibility to those willing to pay the premium. This is not reflected in these estimates. As with the August 27 proposal’s support material, for purposes of discussing the relative merits of alternative implementations, the estimates are based on a “high cost” scenario reflecting enrollment at the total number of uninsured eligible children implied by Census data.
5. Coverage of children now covered by employer plans
A strong incentive is created by the new coverage for families that now pay for coverage of their children through employer plans to drop this coverage. Their children would become eligible for the new program after six months.
There would appear to be few barriers to such conversion of child coverage from employer plans to CCHP. First, eligibility is only determined on an annual basis, and without the kind of investigation that is likely to find all existing insurance coverage. Further, some families would decide that a six month waiting period was well worth having the new program pick up a much higher proportion of the cost. Thus a substantial coverage of children now covered by employer sponsored insurance must be anticipated under this program. However, as noted previously, this primarily affects the aggregate program costs, rather than the PEPM.
Estimated Cost of a Child Health Program in California
To provide an independent source of information about the cost of covering uninsured children in California, the Henry J. Kaiser Family Foundation commissioned an analysis by the Actuarial ResearchCorporation (ARC), which provides actuarial assistanceto a variety of public and private clients. ARC’s analysis suggests that expanding California’s Medicaid program (which is called Medi-Cal) would be substantially less expensive than developing a new private insurance program as proposed.
Talking about STDs with Health Professionals: Women’s Experiences – Report
Talking About STDs with Health Professionals
Women’s Experiences
More than 12 million new cases of sexually transmitted diseases (STDs) other than HIV/AIDS, including three million among teenagers alone, occur every year. At current rates, at least one person in four will contract an STD at some point in his or her life. With as many as 56 million individuals – more than one in five Americans – estimated to be currently infected with an incurable viral STD such as herpes or genital warts, STDs remain a serious health threat in this country. In fact, STD rates in the United States are the highest in the industrialized world, and are higher than in some developing countries.
More than 1 in 5 Americans is estimated to be currently infected with an incurable viral STD.
Source: Centers for Disease Control and Prevention, 1993While public education efforts by the Centers for Disease Control and Prevention (CDC) and the American Social Health Association (ASHA) along with the release of studies such as the one issued November 1996 from the Institute of Medicine (IOM), The Hidden Epidemic: Confronting Sexually Transmitted Diseases, have helped to focus greater national attention on the STD epidemic, the general public remains largely unaware of the prevalence and risk of STDs. In a Kaiser Family Foundation survey conducted at the time of the release of the IOM report, less than a quarter of Americans over the age of 18 when asked what STDs they were aware of, named chlamydia – the most common STD and, according to the CDC, the most prevalent reportable infectious disease of any kind. Just 2 percent could name trichomoniasis or ‘trich,’ the STD with the second highest incidence in the U.S., at 3 million estimated cases annually. One in ten respondents could not name any STDs. Perhaps even more disconcerting was how limited most Americans’ knowledge is about the link between STDs and HIV, with more than half (56%) of respondents unaware that STD infections increase susceptibility to the HIV virus.
Another survey by the Foundation conducted with Glamour magazine earlier this year also found that many women may be mistakenly assuming they are being screened for STDs during routine gynecological exams. Two out of five women 18-44 years old (42%) said they believed they are automatically tested, that is without requesting it, for at least some STDs other than HIV as part of their regular gynecological exams. A pap smear – the primary purpose of which is to screen for cervical cancer – can also detect genital warts, in some cases. However, the test does not detect other more common STDs such as chlamydia, gonorrhea, and trich. Specific STD screening and testing is generally at the discretion of the doctor or at the request of the patient. Although the American College of Obstetricians and Gynecologists (ACOG) recommends testing for STDs other than HIV for women at ‘risk’ for STDs (defined in general as women who have a history of STDs or of multiple sex partners), routine screenings are not necessarily always – or ever – included as part of a woman’s routine exam.

Building on this previous study as well as on anecdotal evidence that many women may not always be getting the care they assume they are getting or even assessing their own risk appropriately when it comes to STDs, Kaiser Family Foundation and Glamour partnered again for a second survey to learn more about how women and their health providers approach the issue of STDs during gynecological or obstetrical visits. In particular, we were curious to learn about how often and with which patients doctors and other health professionals are discussing STDs, whether health providers are counseling women on the risk factors for STDs, and how women feel about their experiences talking about – or not talking about – STDs with their health provider.
The topics asked about are based on ASHA’s Personal Health History form and ACOG’s Guidelines for Women’s Health Care. To attempt to answer these questions, staff at the Foundation in coordination with Glamour magazine staff devised a survey that queried 482 women between the ages of 18-44 who had been to a new doctor within the last year for gynecological or obstetrical care. Criteria used to select the sample were based on an assumption that the first gynecological or obstetrical visit with a new patient was the one most likely for doctors or other health professionals to discuss STDs.
The survey found that not only do STDs rarely get discussed during gynecological or obstetrical visits, but many women may not be adequately screened by their health providers for their risk of STDs. The survey also indicated that women generally expected STDs to be discussed with them by their provider as part of routine reproductive care, and that many are very receptive to automatic testing even at additional costs. A summary of the key findings follows. The survey is also reported on in the October 1997 issue of Glamour.
What the Experts Say…According to the American Social Health Association (ASHA), information on sexual history is integral to assessing a patient’s risk for STD infection. In fact, questions about sexual history are part of an STD risk assessment form developed by ASHA for use by doctors. A woman’s number of sexual partners is important information her health professional should know, according to Contraceptive Technology (1994) and the American College of Obstetricians and Gynecologists (ACOG) Guidelines for Women’s Health Care (1996). Contraceptive Technology recommends asking every patient how many sexual partners he/she has had in the last year. ACOG’s guidelines also recommend a clinician ask every patient about his/her sexual history and practices, which includes their number of sexual partners. ACOG states that a patient’s number of sexual partners may not only indicate STD risk, but also help determine the best method of contraception for her.Findings:
Many women may not be screened adequately for STDs by their health providers.
Only 15 percent of women of reproductive age say they had a conversation with a health professional about STDs at their first visit for gynecological or obstetrical care. Many of the women who did not have a conversation about STDs reported not providing their health professional with the information he or she would have needed to adequately assess the patient’s risk for STDs, such as:
- 35 percent of these women said they did NOT provide information about whether they were currently sexually active;
- 61 percent said they did NOT provide information about whether they were in a monogamous relationship;
- 67 percent said they did NOT provide information about whether they used condoms regularly;
- 77 percent said they did NOT provide information about how many sexual partners they had had in the last year;
- 94 percent said they did NOT provide information about oral or anal sex.
In fact, one in five of these women (20%) said they did not think their health provider had enough information to make an adequate assessment of their risk. Of those women who did not have a conversation about STDs with a health professional but thought that he or she should have discussed the subject with them, almost one in three (30%) said they did not think their health provider had enough information to accurately assess their risk.
There is also evidence that many women may not be informed about STD risk factors. Significant percentages of women who felt their health provider had enough information to know whether they were at risk for STDs reported that they did not provide basic information about their current and past sexual activity that may have affected that assessment. Because American men and women have such limited knowledge about STDs, many of these women may not know what information specifically their health provider should have gathered from them to assess their STD risk. Given the national estimates for STDs in this country, it is likely that some of these women are under-estimating their risks or may not even be aware of whether they have an STD.
Although most women – 92 percent – filled out a form with questions about their medical history when they saw their new health provider for the first time, only half – 54 percent – said that form included questions about sexual history or current sexual activity even though the purpose of their visit was for gynecological or obstetrical care.
Health providers rarely discuss STDs as part of gynecological or obstetrical visits.
As compared to other reproductive and sexual health topics, such as birth control or breast exams, health professionals initiated conversations about STDs far less often. Only about one in ten (12%) health professionals raised the subject of STDs with a new patient. Eight in ten (83%) believe it is a topic that should be a part of routine counseling when seeing a new doctor for gynecological care.
About a third (32%) of health providers who talked about STDs with a patient recommended testing. Women were most likely to report the provider recommended tests for gonorrhea, HIV/AIDS, chlamydia, and syphilis. Those who did have conversations generally reported being made to feel ‘very comfortable’ about the discussion (76%). Few felt ‘judged’ in any way (94% said no; 6% yes).

Women expect their health providers to raise the subject of STDs.
Most women (64%) say it is up to the health professional to raise the topic of STDs during a gynecological visit. A quarter (23%) say it is primarily the patient’s responsibility to initiate this conversation, and 12 percent say the responsibility is shared. In fact, a third (33%) of the women who did not discuss STDs during their visit thought their health provider should have raised the subject with them.
Eighty-six percent of women who did discuss STDs during their first visit with a new doctor said they felt it was ‘expected’ that the topic would come up. About half (47%) said they were ‘relieved’ once it was discussed.
The Real Facts: The Most Common STDs

STD
Incidence(in US pop.)
Curable?
Symptoms
Long-term Health Effects

Chlamydia4,000,000YesGenital discharge, burning during urination. Women: lower abdominal pain, pain during intercourse. Men: swelling or pain in testicles.If left untreated, may lead to PID
Trichomoniasisor”Trich”3,000,000YesVaginal discharge, vaginal odor, discomfort during intercourse, and painful urination.Inflammation of fallopian tubes, low birth weight and premature infants.
Pelvicinflammatory disease(PID)1,000,000YesDull pain or tenderness in the lower abdomen, abnormal periods, abnormal vaginal discharge, nausea and/or vomiting, fever and chills.Damages the fallopian tubes, making it difficult or impossible for a woman to have children. Increased risk for ectopic pregnancy, chronic abdominal pain, pelvic adhesions (tissue grows which connects internal organs together), pelvic abscesses.
HPVorgenitalwarts500,000 – 1,000,000NoWarts on the vulva, vagina, anus, cervix, penis or scrotum, which may lead to itching, pain or bleeding.Increased risk of cervical cancer.
Gonorrhea80,000YesDischarge from penis, vagina or rectum, and burning or itching during urination. Sore throat.If left untreated, may lead to PID.
Genitalherpes200,000 – 500,000NoItching or burning in genital area; pain in the legs, buttock, or genital area, or vaginal discharge. Flu-like symptoms.Nerve pain, inflammation of spinal cord, urethral strictures, and miscarriage, stillbirth, or non surviving premature infant.
Syphilis101,000YesPainless sore (chancre) on genitals or in vagina, skin rash and flu-like symptoms, mild fever, fatigue, sore throat, hair loss and swollen glands throughout body.In late, or tertiary stage, mental illness, blindness, heart disease and death.
HIV/AIDS80,000NoFlu-like symptoms, such as fever, loss of appetite and weight, fatigue, enlarged lymph modes.Partial paralysis/weakness of muscles, symptoms affecting the spinal cord, lowered resistance to opportunistic infections, increased risk of cervical cancer, and death.
Talking About STDs with Health Professionals: Women’s Experiences: Report Part One Part Two Press Release Survey
Talking about STDs with Health Professionals: Women’s Experiences
Now I am going to ask you a series of questions about sexually transmitted diseases other than HIV or AIDS, such as gonorrhea, syphilis, herpes, and chlamydia. We want to learn from you how the topic of sexually transmitted diseases, also called STDs, was handled in your visit so that we can help doctors do a better job of addressing STDs with their patients.
Again, please remember that your answers to these questions will be kept completely confidential, and your responses will be shown only in combination with those of the other people we survey.
28. Now, thinking back to this last visit, were there any patient education materials like brochures or videos, about STDs in the (doctor’s office [If private “doctor’s office” or “DK/REF” at Qu. 4b] / clinic [If “family planning” or “other type of clinic” at Qu. 4b])? (Single response)
Yes 61 No 30 Don’t know 9 Refused 0 29. Did someone in your (doctor’s office [If private “doctor’s office” or “DK/REF” at Qu. 4b] / clinic [If “family planning” or “other type of clinic” at Qu. 4b]) discuss sexually transmitted diseases, other than AIDS, with you at this visit? (Single response)
Yes 15 No 85 Don’t know * Refused 0 30a. Who initiated this conversation, you or someone in your (doctor’s office [If private “doctor’s office” or “DK/REF” at Qu. 4b] / clinic [If “family planning” or “other type of clinic” at Qu. 4b])? (Single response)
Based on those who discussed STDs. (n=72)
You 17 Someone in your doctor’s office/clinic 83 Don’t know 0 Refused 0 30b. Please tell me whether each of the following apply to how you felt when the health professional raised the subject of STDs with you? Did you feel (insert list)? (Single response) (Record Yes/No/DK/Ref for each) (Rotate first two statements only)
Based on those who discussed STDs. (n=72)
Yes No Don’t know Refused Relieved 47 47 4 1 Offended or insulted 4 94 1 0 It was expected 86 14 0 0 30c. Where did this discussion take place? (Do not read list) (Multiple response) (If respondent says “examining room” probe with: Was that while you were dressed or undressed?)
Based on those who discussed STDs. (n=72)
In examining room while you were dressed 44 In doctor’s personal office 36 In examining room while you were undressed 17 In counseling room 4 All other 3 In waiting room 1 Don’t know 0 Refused 0 30d. Where would you have preferred this conversation took place? Would you say (read list)? (Single response)
Based on those who discussed STDs. (n=72)
In doctor’s personal office 46 In examining room while you were dressed 42 Doesn’t matter 6 In examining room while you were undressed 4 Don’t know 1 Refused 1 31a. Please tell me whether each of the following apply to how you would have felt if the health professional had talked about STDs with you? Would you have felt (insert list)? (Single response) (Record Yes/No/DK/Ref for each) (Rotate first two statements only)
Based on those who did NOT discuss STDs. (n=408)
Yes No Don’t know Refused Relieved 24 72 4 * Offended or insulted 6 93 1 0 It was expected 64 36 0 * 31b. Do you think the health professional should have raised the subject with you? (Single response)
Based on those who did not discuss STDs. (n=408)
Yes 33 No 66 Don’t know 2 Refused 0 31c. Do you think you should have raised the subject of STDs? (Single response)
Based on those who did NOT discuss STDs. (n=408)
Yes 15 No 85 Don’t know 1 Refused 0 32. Why not? (Do not read list) (Multiple response)
Based on those who did not believe they or health professional should have raised STDs. (n=255)
Don’t feel at risk for STDs/only one partner/married 77 Discussed with doctor or health professional before 7 Visit was for other reason 7 No reason to (unspec.) 6 Already know about STDs/Office knows my history 2 Already been tested 2 Don’t know what STDs are 1 Don’t know 0 Refused 0 33. In general, do you think STDs should be discussed as part of seeing a new doctor orhealth professional for gynecological care? (Single response)
Yes 83 No 6 Depends 9 Don’t know 2 Refused 0 34. Who do you think has the primary responsibility for raising the subject of STDs, the health professional or the patient? (Do not read list) (Single response)
Health professional 64 Patient 23 Both 12 Neither 0 Don’t know 1 Refused 0 35. Who would you prefer talk to you about STDs, a doctor, a nurse, a counselor, or someone else in the doctor’s office? (Do not read list) (Single response)
Doctor 71 Nurse 12 Doesn’t matter 12 Counselor 2 Either a doctor or nurse 2 All other * No one * Don’t know * Refused 0 36. Did you feel you and your health professional had enough time to discuss STDs? (Single response)
Based on those who discussed STDs. (n=72)
Yes, had enough time 94 No, not enough time 6 Don’t know 0 Refused 0 37a. Did the health professional seem embarrassed or uncomfortable during your discussion about STDs? (Single response)
Based on those who discussed STDs. (n=72)
Yes 4 No 96 Don’t know 0 Refused 0 37b. Were you embarrassed or uncomfortable during this discussion? (Single response)
Based on those who discussed STDs. (n=72)
Yes 7 No 93 Don’t know 0 Refused 0 38. Did the health professional seem like he or she was judging you during this discussion? (Single response)
Based on those who discussed STDs. (n=72)
Yes 6 No 94 Don’t know 0 Refused 0 39. Did the health professional suggest to you that you should be tested for any STDs? (Single response)
Based on those who discussed STDs. (n=72)
Yes 32 No 67 Don’t know 1 Refused 0 40. Which, if any, specific STDs did the health professional recommend you get tested for? (Read list) (Rotate) (Multiple response) Probe: Can you think of any others?
Based on those for whom health professional suggested STD testing. (n=23)
Gonorrhea 74 AIDS/HIV 70 Chlamydia 65 Syphilis 52 Herpes 35 Human Papilloma Virus, or genital warts 30 Trichomonas 13 All others 13 No specific STDs mentioned 9 41. Omitted
42. Would you say the subject of STDs was discussed in a way that made you feel very comfortable, somewhat comfortable, not very comfortable, or not at all comfortable? (Single response)
Based on those who discussed STDs. (n=72)
Very comfortable (4) 76 Mean: 3.7 Somewhat comfortable (3) 21 Not very comfortable (2) 3 Not at all comfortable (1) 0 Don’t know 0 Refused 0 43. Did you feel that the health professional asked you enough questions, and knew enough about you, to be able to tell whether or not you were at risk for STDs? (Single response)
Total Among womenwho did not talkabout STDs(n=408) Yes 80 80 No 19 20 Don’t know 1 * Refused 0 0 44. Next I’m going to describe different issues that might affect how comfortable a patient feels about discussing STDs with a doctor or other health professional. Please rate how important each one is to you, very important, somewhat important, not very important or makes no difference.
The first [next] is (insert list). (Single response)
Where the conversation takes place, such as the exam room or in a private office:
Very important (4) 26 Mean: 2.5 Somewhat important (3) 25 Not very important (2) 20 Makes no difference (1) 29 Don’t know 0 Refused 0 Whether you are certain that the conversation is completely confidential:
Very important (4) 80 Mean: 3.7 Somewhat important (3) 15 Not very important (2) 2 Makes no difference (1) 4 Don’t know 0 Refused 0 Whether you feel the health professional might be judging you:
Very important (4) 46 Mean: 3.1 Somewhat important (3) 27 Not very important (2) 14 Makes no difference (1) 13 Don’t know * Refused 0 Whether the health professional is a [rotate] woman or man/man or woman:
Very important (4) 19 Mean: 2.1 Somewhat important (3) 19 Not very important (2) 19 Makes no difference (1) 43 Don’t know 0 Refused 0
Talking About STDs With Health Professionals: Women’s Experiences:Press Release Report Survey Part One Part Two Part Three