News Release

How Do Quality and Access Compare In Medicare Advantage Versus Traditional Medicare?

Published: Nov 6, 2014

Today a record three in 10 Medicare beneficiaries are enrolled in Medicare Advantage health plans, mainly HMOs and PPOs, which are paid by the government to provide Medicare benefits to their enrollees. Given the projected rise in Medicare Advantage enrollment, an important question for both consumers and policymakers is how quality and access to care compares for beneficiaries in traditional Medicare versus Medicare Advantage plans.

To try to answer this question, the Kaiser Family Foundation commissioned a comprehensive review of the literature: 45 studies published since 2000, including 40 that involve direct comparisons between traditional Medicare and Medicare Advantage plans. Conducted by lead author Marsha Gold, Senior Fellow Emeritus with Mathematica Policy Research, the analysis offers insights, but finds shortcomings in the available research, making it hard to draw broad conclusions about the relative performance of the two coverage options.

The report finds that the data used in studies that compare traditional Medicare and Medicare Advantage tend to be old and provide limited examination of the experience since 2010, when the Affordable Care Act altered the landscape. For the most part, studies reflect the experience of HMOs, not local and regional PPOs that have helped fuel the recent boom in Medicare Advantage enrollment. Because of data constraints, most studies focus on a limited set of quality and access measures, and use data based on selected states or markets, rather than the experiences of plans and enrollees nationwide.

Within those limitations, the analysis finds:

  • At least through 2009, Medicare HMOs tend to perform better than traditional Medicare in providing preventive services and using resources more conservatively. These are measures where HMOs have historically been strong.
  • Beneficiaries themselves continue to rate traditional Medicare more favorably than Medicare Advantage plans in terms of quality and access, though one study suggests that the difference may be narrowing for the average beneficiary. Among beneficiaries who are sick, the gap is particularly large, and favors traditional Medicare.
  • Performance varies widely across Medicare Advantage plans even within the same type, which limits the ability to generalize across the program.

What Do We Know About Health Care Access and Quality in Medicare Advantage Versus the Traditional Medicare Program? concludes that better information is needed to inform policymaking and suggests strengthening available data and other support for tracking and monitoring performance across Medicare Advantage plans and traditional Medicare as each sector evolves.

What Do We Know About Health Care Access and Quality in Medicare Advantage Versus the Traditional Medicare Program?

Authors: Marsha Gold and Giselle Casillas
Published: Nov 6, 2014

Executive Summary

While the majority of Medicare beneficiaries still receive their benefits through the traditional Medicare program, 30 percent now obtain them through private health plans participating in Medicare Advantage. As the number of Medicare Advantage enrollees continues to climb, there is growing interest in understanding how the care provided to Medicare beneficiaries in Medicare Advantage plans differs from the care received by beneficiaries in traditional Medicare.

Despite the interest, the last comprehensive review of research evidence on health care access and quality in Medicare Advantage and traditional Medicare is more than 10 years old and did not focus exclusively on Medicare (Miller and Luft 2002). That study found that health maintenance organizations (HMOs) provide care that is roughly comparable in quality to the care provided by non-HMOs (mainly traditional indemnity insurance), and that quality varied across health plans. It also found that HMOs used somewhat fewer hospital and other expensive resources in delivering care, with enrollees rating them worse on many measures of access and satisfaction. However, the market has changed substantially over the last decade, making it important that policymakers have available more current analysis, particularly on Medicare health plans.

This literature review synthesizes the findings of studies that focus specifically on Medicare and have been published between the year 2000 and early 2014. Forty-five studies met the criteria for selection, including 40 that made direct comparisons between Medicare health plans and traditional Medicare. An additional five studies are included, even though they have no traditional Medicare comparison group, because they include a comparison of health care access and quality in different types of Medicare Advantage plans. A full list of the studies included in this analysis is found in the Works Cited.

FINDINGS

What the Literature Shows

The review of the literature comparing quality and access provided under traditional Medicare and Medicare Advantage plans suggests the following:

  • HEDIS Effectiveness Metrics on Preventive Care. Medicare Advantage, on average, scores more highly than traditional Medicare on subsets of Medicare HEDIS indicators – primarily those pertaining to use of preventive care services. Two studies found Medicare preferred provider organizations (PPOs) outperformed traditional Medicare on some metrics (particularly mammography rates), though HMOs nevertheless performed better than PPOs. All of these studies were conducted prior to changes made by the Affordable Care Act (ACA) to improve coverage of preventive services under traditional Medicare.
  • Beneficiary Reports on Quality and Access (CAHPS). Medicare beneficiaries generally rated Medicare Advantage lower than traditional Medicare on questions about health care access and quality, especially if beneficiaries had a chronic illness or were sick; however, the difference in ratings between traditional Medicare and Medicare Advantage narrowed on some metrics by 2009 (e.g., overall care ratings). Keenan et al. (2009) found that sick beneficiaries in Medicare Advantage rated their plans substantially lower than beneficiaries of similar health status in traditional Medicare, and Elliott et al. (2011) found significantly lower CAHPS ratings (and greater disparities between Medicare Advantage and traditional Medicare) among vulnerable subgroups of beneficiaries in Medicare Advantage. Little is known about how CAHPS scores vary by type of Medicare Advantage plan since most studies are based on HMOs or periods in which HMOs were the main plan type.
  • Potentially Avoidable Hospital Admissions. Based on six studies involving beneficiaries in a limited number of states and/or plans represented by the Alliance of Community Health Plans (ACHP), Medicare beneficiaries in HMOs are less likely to be hospitalized for a potentially avoidable admission than beneficiaries in traditional Medicare. Four of these studies rely on data prior to 2006, and reflect HMO experiences in mature markets.
  • Readmission Rates. While a number of studies examine whether readmission rates differ among beneficiaries in Medicare Advantage and traditional Medicare, the evidence from these studies is inconclusive because findings differ across the studies and many studies lack adjustments for important potentially confounding factors.
  • Health Outcomes. There is some evidence that good coverage, as defined by relatively low cost-sharing (whether through Medicare HMOs or through Medicare with supplemental coverage), may result in earlier diagnoses of some cancers compared to traditional Medicare alone. Treatment patterns for some cancers also may differ between Medicare HMOs and traditional Medicare, but studies do not show that this affects patient outcomes. However, the age of the studies, the gaps in controls for selection, and the evolving nature of guidelines for appropriate care limit the conclusions that can be drawn.
  • Resource Utilization. Medicare HMOs appear to provide a less resource-intensive style of practice than traditional Medicare, as measured in studies examining end-of-life care, use of certain procedures, and overall utilization rate in HMOs, especially for hospital services. However, most of these studies provide little direct evidence of whether less intensive care is better or worse or how the appropriateness of care differs between Medicare Advantage and traditional Medicare.
  • Variation by Geography, by Plan Type, and by Plan Experience. On a variety of metrics, performance among Medicare Advantage plans varies substantially across plans, even among plans of the same plan type. The variations by market in more established HMOs with integrated delivery systems tend to be more represented in existing research, and to perform better. Performance on quality and access metrics varies across geographic areas, and the variations in Medicare Advantage and traditional Medicare ratings are not necessarily the same.

The Available Evidence has Substantial Limitations

To make a definitive comparison of both quality and access in traditional Medicare and Medicare Advantage plans, one would ideally draw from studies with relatively recent data that is nationally representative in terms of both the characteristics of health plans participating in Medicare Advantage and the characteristics of beneficiaries covered by the Medicare program. Performance measures would capture a broad range of metrics assessing both quality of care and access to care, and would include enrollees’ assessments, process measures, and outcome measures. The comparisons would adjust for factors that might explain differences in performance between Medicare Advantage and traditional Medicare, such as variations in medical practice by geographical location and patient health status. In an ideal world, studies would provide information to help clarify if differences vary by plan type, and how quality and access indicators compare for the typical Medicare beneficiary, as well as beneficiaries who are in relatively poor health with significant medical needs.

Unfortunately, while available evidence provides some insights, it falls short on many desirable dimensions. The most serious shortfalls are in the lack of timely data, the primary focus on HMOs rather than the full range of Medicare Advantage plans, and study populations that exclude important subgroups of beneficiaries (such as the under-65 disabled) and lack information on the experience of vulnerable subgroups of beneficiaries, such as those in poor health or with significant needs. In addition, available metrics are limited in their ability to capture performance across the full continuum of care and care for the total patient, particularly on a national basis.

Our review of the literature comparing quality and access measures between traditional Medicare and Medicare Advantage finds:

  • Limited Insight into Experiences After Implementation of the Affordable Care Act (ACA). With one limited exception involving hospice care, none of the 40 studies comparing Medicare Advantage to traditional Medicare rely on data from 2010 or later. Thus, it is not yet possible to assess the performance of Medicare Advantage relative to traditional Medicare that reflects plan performance after the implementation of the Medicare Advantage payment changes included in the ACA (payment reductions, coupled with quality bonus payments). Fourteen of the 40 studies report only on experience in the 1990s or earlier, and of the 27 others covering the 2000-2009 period, 16 provide estimates between 2006 and 2009, after the introduction of the Medicare prescription drug benefit.
  • Studies Reflect Mainly HMO Experience, Not Newer Plan Types. Almost all of the literature applies to the experience of beneficiaries in HMOs, rather than in the full range of plans that are currently available. In 2014, for example, one-third of all Medicare Advantage enrollees are in plans other than HMOs, mainly PPOs. Only three of the 40 studies that compared traditional Medicare to Medicare Advantage (and two of the five that compared Medicare Advantage plans only) included findings that were specific to Medicare PPOs. Others either are limited to HMOs, apply to a period when HMOs were the overwhelming plan type, or do not analyze data by plan type. As a result, the results are not generalizable to the Medicare Advantage program as a whole as contrasted with the experience of its older HMO component.
  • Limited Insight into the Experience of Beneficiaries with More Complex Medical Needs. Few of the existing studies provide insight on how Medicare Advantage and traditional Medicare perform on quality and access metrics for beneficiaries whose health characteristics suggest that they could have more complex needs. Only four studies, all based on beneficiary survey data, focused explicitly on subgroups of the Medicare population defined by the authors as high-need based on health or functional status (Keenan et al. 2009, Elliott et al. 2011, Pourat et al. 2001, and Beatty and Dhont 2001). One study (Elliott et al. 2011) also examined disparities in care for vulnerable subgroups defined by various socioeconomic indicators, along with health status. The inability to reflect the experiences of beneficiaries with significant health needs is a major limitation in the literature.
  • Data Constraints Limit National Studies. While several studies are national in scope (plans and beneficiaries), the metrics they include are limited by available data. Of the 17 national studies comparing Medicare Advantage to traditional Medicare (of 40 in total), 10 rely exclusively on CAHPS or other national population surveys, and seven use HEDIS data compared to claims data for traditional Medicare. Vital statistics data dealing with mortality were used in two of the studies as well. Studies on many metrics relevant to quality either do not exist (like intermediate outcomes for beneficiaries with multiple chronic conditions or the personal experience with care of these patients) or, like studies of potentially avoidable admissions and readmissions, depend on data from a limited set of states or locales.

THE BOTTOM LINE

Despite great interest in comparisons between traditional Medicare and Medicare Advantage, studies comparing overall quality and access to care between Medicare Advantage plans and traditional Medicare tend to be based on relatively old data, and a limited set of measures.

On the one hand, the evidence indicates that Medicare HMOs tend to perform better than traditional Medicare in providing preventive services and using resources more conservatively, at least through 2009. These are metrics where HMOs have historically been strong. On the other hand, beneficiaries continue to rate traditional Medicare more favorably than Medicare Advantage plans in terms of quality and access, such as overall care and plan rating, though one study suggests that the difference may be narrowing between traditional Medicare and Medicare Advantage for the average beneficiary. Among beneficiaries who are sick, the differential between traditional Medicare and Medicare Advantage is particularly large (relative to those who are healthy), favoring traditional Medicare. Very few studies include evidence based on all types of Medicare Advantage plans, including analysis of performance for newer models, such as local and regional PPOs whose enrollment is growing.

As the beneficiary population ages, better evidence is needed on how Medicare Advantage plans perform relative to traditional Medicare for patients with significant medical needs that make them particularly vulnerable to poorer care. The ability to assess quality and access for such subgroups is limited because many data sources do not allow subgroups to be identified or have too small a sample size to support estimates. Also, in many cases, metrics employed may not be specific to the particular needs or the way a patient’s overall health and functional status or other comorbid conditions influence the care they receive.

At a time when enrollment in Medicare Advantage is growing, it is disappointing that better information is not available to inform policymaking. Our findings highlight the gaps in available evidence and reinforce the potential value of strengthening available data and other support for tracking and monitoring performance across Medicare Advantage plans and traditional Medicare as each sector evolves.

Report: Introduction

Medicare is critical to the well-being of the nation’s seniors and people with disabilities, many of whom have low to moderate incomes, complex health care needs, and other characteristics that leave them disproportionately vulnerable.1  While the majority of Medicare beneficiaries still receive their benefits through the traditional Medicare program, 30 percent now obtain their benefits through private health plans participating in Medicare Advantage.2  As the number of enrollees in Medicare Advantage continues to climb, there is growing interest in understanding how care provided to Medicare beneficiaries in traditional Medicare and Medicare Advantage differs.Despite the considerable interest in this topic, solid analysis summarizing existing research comparing Medicare Advantage to traditional Medicare on various quality and access metrics is relatively limited. Historical reviews of performance differences across health plans have generally focused on comparisons of organizational structures (like health maintenance organizations or HMOs) rather than focusing on particular payers, like Medicare. The most widely cited reviews available have been conducted over the years by Miller and Luft, with the most recent review covering work through mid-2001.3  It concluded that the quality of care provided by HMOs was roughly comparable to traditional insurance, though it varied across health plans; HMOs used somewhat fewer hospital and other expensive resources to deliver care compared to traditional insurance, and had lower ratings by enrollees on many measures of access and satisfaction. An earlier study in the series (Miller and Luft 1997) noted that Medicare beneficiaries with chronic conditions had worse outcomes in HMOs.4 

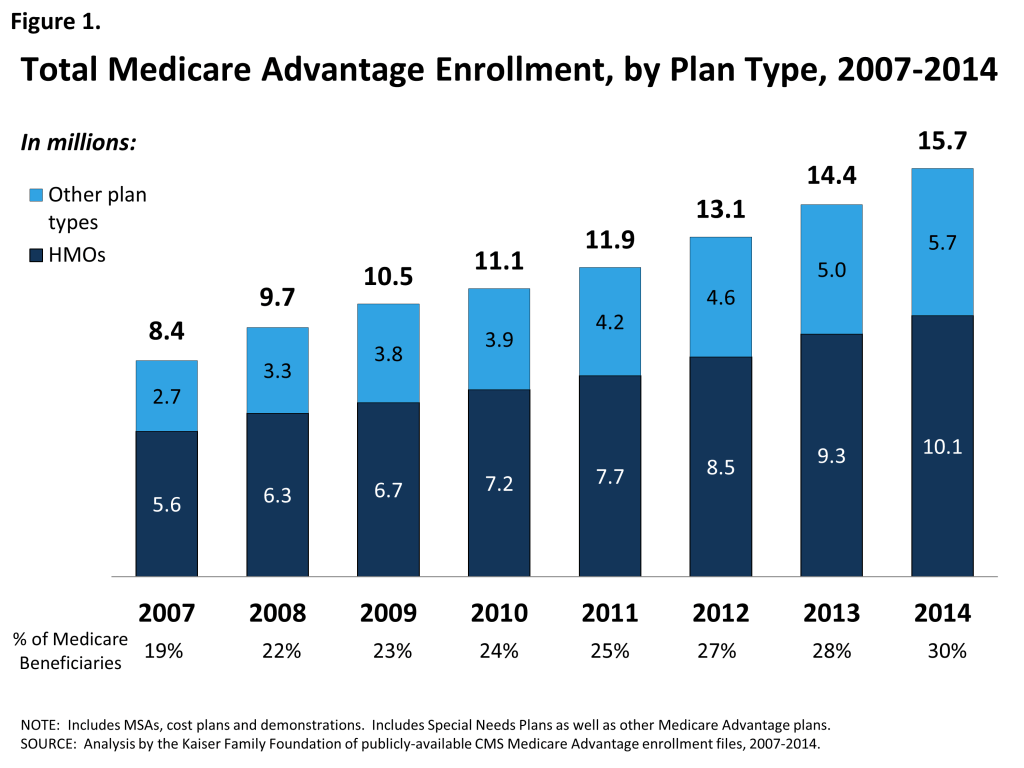
Since these reviews were published, the environment has changed considerably. The historical base of HMOs in nonprofit staff and group model plans has shifted considerably, with new growth in for-profit plans that use more decentralized provider networks that tend to be less integrated.5  Further, since the mid-2000s, the number and share of Medicare beneficiaries enrolled in private plans, now called Medicare Advantage, has increased dramatically, and while most enrollees are in HMOs, a growing number are enrolled in other types of plans, such as local and regional PPOs (Figure 1).

Figure 1: Total Medicare Advantage Enrollment, by Plan Type, 2007-2014

The policy environment and incentives facing providers in the Medicare program also have changed in ways that put increasing emphasis on payments that take into account performance on quality and efficiency metrics. For Medicare Advantage, the Affordable Care Act of 2010 (federal health reform law) enacted changes in payments to plans that are now being phased in, slowing the increase in Medicare Advantage payments and linking them more closely with performance on quality and other performance metrics.6  Medicare Advantage plans that score four or more out of five stars are provided bonus payments and those that score the highest (so-called “five star plans”) gain other advantages, particularly the ability to continuously enroll beneficiaries throughout the year.7  Payment to hospitals, physicians, and other providers in the traditional Medicare program also are increasingly tied to quality metrics as a result of changes in the ACA and other legislation. The ACA also improved coverage of preventive services under traditional Medicare, which has been a metric in which managed care plans have historically performed better.

Such changes increase the interest within the policy community in current information comparing the quality of care provided to beneficiaries in Medicare Advantage plans and traditional Medicare. Proponents of the insurance industry argue that quality under Medicare Advantage has improved and is better than under the traditional program – an accomplishment, they argue, that could be undermined by ongoing reductions in payments as required under the federal health reform law.8 

In a recent review, Newhouse and McGuire (2013) summarized three studies they coauthored that compared Medicare Advantage to traditional Medicare, and concluded that the findings from those studies favored Medicare Advantage.9  The review has gotten considerable attention.10  Lost in the discussion, however, is the fact that the main thrust of the article focused on efficiency and selection within Medicare Advantage, with the authors acknowledging that research comparing the quality of care in Medicare Advantage versus traditional Medicare is limited.

Report: Methods

This study seeks to fill the gap in available information on current evidence comparing quality and access in Medicare Advantage plans and traditional Medicare. Unlike earlier literature reviews, the focus of this paper is on Medicare, and limited to studies that are relatively current; that is, published between 2000 and early 2014.

Study Sources and Inclusion Criteria

We identified the initial list of studies using a Google Scholar search for articles on “Medicare Advantage/Medicare HMOs” published since 2000. We reviewed titles and abstracts to identify studies focusing on access/quality metrics and including a design that had some comparison group—typically traditional Medicare, or what some still refer to as Medicare fee-for-service (FFS). Because Google Scholar does not index the most recent year’s publications and is a less established search source, we also contracted with a trained health research librarian to conduct a formal Medline search covering the period 2000−2014.11  That search used the terms “Medicare health plans,” “Medicare HMO,” “Medicare Advantage,” and “Medicare Advantage PPO” in comparison to “FFS Medicare,” “Medicare,” and “traditional Medicare,” with the keywords “quality of care,” “access,” and “outcomes”.12  To ensure coverage of studies that may be relevant to the policy debate but are not found in the academic literature, we also reviewed the sources cited in industry briefs and the most recent Medicare Payment Advisory Commission (MedPAC) report to Congress on Medicare Advantage.13  In addition, we checked citations in those studies identified for any other relevant studies not already identified.14 

To be included in the review, studies had to include (1) a written description of methods and data sources, (2) a formal comparison group, and (3) outcome measures relevant to access or quality. Although we did not otherwise exclude studies based on the quality of their methods, we reviewed articles for how they handled such potentially confounding factors as geographic location, enrollee mix, and health and risk factors associated with selection. Because our analysis focused on Medicare health plans available for general enrollment, we excluded studies focused on specialized plans—particularly social HMOs, PACE, and Special Needs Plans (SNPs).

Relevant Metrics of Interest

Health care quality problems can arise though underuse, overuse, and misuse of services.15  Some of these domains are better captured in existing quality metrics than others.16  Because the review was focused on access and quality of health care received by beneficiaries in different types of insurance arrangements, rather than insurance per se, studies focused primarily on benefits or the factors that influence health plan selection were not considered. Five categories of metrics are considered in this paper.

HEDIS Effectiveness of Care Metrics.

HEDIS measures, which Medicare health plans report to the Centers for Medicare and Medicaid Services (CMS), are central to oversight in Medicare Advantage. In 2014, Medicare Advantage plans were required to submit audited data consistent with National Committee for Quality Assurance (NCQA) specifications for 25 metrics on health care effectiveness and another three on access and availability of services, among other metrics.17  HEDIS effectiveness indicators focus on the processes of care or intermediate outcomes rather than ultimate outcomes; metrics relevant to those with chronic illness are limited, though efforts are underway to broaden the measure set. Patient-level data used to support these metrics come from claims, encounter data, and for some metrics, medical records. A subset of these metrics is used to support calculation of Medicare Advantage plan star quality ratings, the basis for bonus payments to plans. Increasing efforts have been made to align reporting requirements across Medicare Advantage plans of different types, but data historically have been most available for HMOs and least available for private FFS plans and regional PPOs.18  HEDIS metrics are not routinely calculated for traditional Medicare. MedPAC is considering better ways to align requirements and metrics across programs, taking into account the differences in data sources used in each sector.19 

CAHPS™ Quality Metrics.

CAHPS is a health plan member survey that provides patient reports of care experiences with their plan, including ratings of access to care and satisfaction with the plan and its providers.20  To support its use, CMS conducted a related survey of beneficiaries in traditional Medicare residing in those same geographical areas (in 2011, it replaced this survey with a requirement that freestanding prescription drug plans collect CAHPS data). Using its contractors, CMS has developed a number of composite measures of reported care and use of preventive services, as well as global health ratings. Some of the same items are included in standard national surveys, such as the Medicare Current Beneficiary Survey (MCBS) and the National Health Interview Survey (NHIS). Because they provide insight into how beneficiaries view care, beneficiary surveys long have been a central component of most efforts to examine access and quality of care in Medicare.

Quality Metrics around Hospitalizations.

From a quality and value perspective, metrics that provide information on the appropriateness and quality of hospital care are of growing interest. Key metrics in this area focus on the appropriateness of hospital admissions that potentially could be avoided by more timely and appropriate primary care, the appropriateness and quality of facilities and professional services used, and the ability to structure discharges in ways that avoid personally and financially costly complications and hospital readmissions. CMS now captures data on case-mix adjusted Medicare rehospitalization rates as part of HEDIS reporting from health plans. In the absence of national data, most research on this topic has used data available through all-payer discharge data sets available in selected states and from the Agency for Healthcare Research and Quality’s (AHRQ’s) databases. Only some of these files have appropriate identifiers to distinguish enrollment in Medicare health plans, and the timeliness of information often lags. While adjusting for case mix and severity is important in all comparisons of quality, it is particularly important in studies of hospital appropriateness or outcomes, when poor outcomes may be small in number and highly sensitive to the mix of enrollees.

Other Utilization Metrics.

Given the limitations in available data that directly measure access and quality of health services for beneficiaries in Medicare Advantage and traditional Medicare, researchers have included various other measures of utilization as a proxy for direct measures of these aspects of care. Like the hospital utilization measures, some of these metrics target specific kinds of utilization that have been used as markers for overuse, underuse, or misuse of services, including emergency department (ED) visits, patterns of care at the end of life, procedure use for urgent versus non-urgent conditions, or high-cost procedures versus others. Medicare Advantage plans report on some of these metrics in the Utilization and Relative Resource Use section of the HEDIS performance monitoring submission form. Utilization-based measures can be difficult to interpret as quality metrics when norms defining appropriateness are lacking or in dispute, and when it is unclear what constitutes overuse or underuse and whether overuse or underuse are markers for better or worse care. Such measures also require careful risk adjustment for selection. Studies that use aggregate measures of utilization probably are better interpreted as indications of resource use rather than quality of care.

Health Care Outcomes and Mortality.

Ultimately, the goal of medical care is to improve patient outcomes and quality of life. Data sets available for studies of this type are limited and those that exist do not always include good information on health insurance type or adequate data to link with other sources containing such data. There are also methodological challenges in adjusting for patient selection and mix adequately. Cancer studies are supported by cancer registry data maintained by states and the National Cancer Institute’s Surveillance and Epidemiology and End Results (SEER) data, among others.


Report: Findings

Overview of Published Studies

A total of 45 unique studies were identified using the methods and criteria discussed (Table 1), of which 40 involved comparisons between Medicare Advantage plans and traditional Medicare. The other five studies made comparisons among Medicare HMOs or between HMOs and PPOs, but did not compare Medicare Advantage plans to traditional Medicare. A complete list of all the studies that are included in our review is found at the end of this document. An additional six studies compared the care received in Medicare health plans to care in the Veterans Health Administration (VHA) system; since they involve a highly specialized comparison, they are not included in the core analysis and text but their findings are summarized in the Appendix.

Table 1. Overview of Reviewed Studies
(All studies involved a comparison to traditional Medicare unless noted)
Type of Quality/Access MetricNumber
HEDIS Effectiveness of Care Indicators (studies focused mainly on prevention metrics)
• Medicare Advantage vs. traditional Medicare program3
• Variation across health plan types only (no TM comparison)4
Beneficiary Reports on Quality and Satisfaction
• CAHPS-based comparisons6
• MCBS, NHIS, and other surveys4
Appropriateness of Hospital Use and Outcomes
• Avoidable Hospitalizations6
• Quality of Admitting Hospital/Physician/Care5
• Readmission Rates3
Other Utilization Measures (reported in the HEDIS dataset or elsewhere)
• Service Use at End-of-Life2
• Procedure Use (1 study has no TM comparison, looks only at HMOs)2
• Overall Utilization3
Health Care Outcome and Mortality
• Overall Mortality1
• Stage of Cancer Diagnosis, Treatment, and Outcomes5
• Functional Status1
NOTE: The table classifies studies based on their primary area of focus. One study (Ayanian et al. 2013) included selected CAHPS indicators along with the main analysis of HEDIS effectiveness indicators. To avoid double counting, it is not listed twice here.
SOURCE: Authors’ analysis based on review of published papers.

Characteristics and Relevance of Core Studies

Table 2 summarizes the 40 studies that make comparisons between Medicare Advantage (or predecessor program health plans) and traditional Medicare. Studies (the rows) are grouped by type of quality or access metric,21  with columns providing detail on the main focus and characteristics of individual studies and the types of study controls and comparisons made. Table 3 provides the same information for the five studies involving comparisons solely within Medicare Advantage. Ideally, one would want studies with current data, across a wide variety of health plans nationally, using diverse outcome measures, with good controls for other factors that could explain differences in performance between Medicare Advantage and traditional Medicare. Unfortunately, the studies identified fall short in many of these areas.

Timeliness.

While this review aims to assess current Medicare Advantage practice, the studies available to support such an assessment are very limited. With one limited exception – an analysis of hospice use – none of the studies comparing Medicare Advantage to traditional Medicare include data from 2010 or later, which means none cover the experience of beneficiaries after the changes enacted in the ACA. Fourteen of the 40 studies use data from the 1990s or earlier. Of the 27 other studies covering the 2000-2009 period, 16 provide estimates for 2006 or later after the Medicare Advantage changes introduced in the Medicare Modernization Act of 2003 began to drive the market with the introduction of the Medicare prescription drug benefit in 2006.22 

Scope of Health Plans Studied.

While Medicare health plans have become increasingly diverse, and more beneficiaries are enrolling in Medicare PPOs, the research to date comparing the traditional Medicare program to Medicare Advantage plans still mainly reflects the HMO experience. Only three of the 40 studies that compared traditional Medicare to Medicare Advantage (and two of the five that compared Medicare Advantage plans only) included findings that were specific to Medicare PPOs. Most studies use data for a time period in which HMOs were the main Medicare health plan option. Some of the more recent studies are limited to HMOs to address data constraints or create more homogeneous comparisons. Other studies are not limited to HMOs but do not provide evidence that distinguishes findings by plan type or other plan characteristics. For example, among studies that involved comparisons to traditional Medicare, only two studies analyzed Medicare Advantage plan performance by plan maturity (years of Medicare Advantage experience) and three (two without a traditional Medicare comparison) analyzed the relationship between performance and plan tax status (for profit/nonprofit).

Results Targeting Beneficiaries with More Complex Medical Needs.

Few of the existing studies provide insight into how Medicare Advantage and traditional Medicare perform on quality and access metrics for beneficiaries whose health characteristics suggest that they could have more complex or specialized needs. Only four studies, all based on beneficiary survey data, focused explicitly on subgroups of the Medicare population defined by the authors as high need based on health, functional status, age, and/or income (Elliott et al. 2011, Keenan et al. 2009, Pourat et al. 2006, and Beatty and Dhont 2001). In the first two, using CAHPS data for 2003-2004 and 2009 respectively, Keenan et al. 2009 compared findings for beneficiaries based on self-reported health status, and Elliot et al. 2011 examined disparities for seven vulnerable subgroups (by socio-economic status and perceived health status). Using older data from the Medicare Current Beneficiary Survey (1996 and 1994 respectively), Pourat (2006) looked at chronically ill Medicare beneficiaries and Beatty and Dhont (2001) looked at under-65 disabled beneficiaries and elderly beneficiaries with one or more disabilities.

Several other studies included health status and health indicators as covariates in their analysis, but did not focus on these subgroups for comparisons of quality and access between traditional Medicare and Medicare Advantage. Almost all studies were either limited to beneficiaries 65 and older (versus younger beneficiaries qualifying by virtue of disability) or did not analyze the experience of under-65 disabled in Medicare Advantage versus traditional Medicare. While some of this reflects the exclusion in this review of studies on specialized health plans, such as Special Needs Plans, research shows that meaningful numbers of beneficiaries who are disabled and under-65 have long been enrolled in Medicare Advantage plans open for general enrollment.23  The inability to target findings to subgroups with more extensive needs is a major limitation since the studies that exist tend to show that such individuals, at least in survey data, are more likely to report more negatively on their care, regardless of the system they are in, and some studies show this more in Medicare Advantage than traditional Medicare (see Table 5).

Studies of National Scope are Limited.

Available studies include some that are national in scope, comparing Medicare health plans to traditional Medicare; 17 of the 40 studies that have traditional Medicare comparisons fall in this category. Such studies are feasible because CMS has supported the development of data that better support such analysis. In particular, CAHPS data support such comparisons and HEDIS data collection associated with Medicare Advantage provide nationally-representative data that on some metrics can be compared to estimates from claims generated in traditional Medicare. However, the data available to support comparisons on other types of metrics are limited nationally, which means that many analyses are feasible only for subgroups of states or communities that participate in various data collection efforts. For example, diagnostic specific studies involving hospitalizations are only feasible in some states with all payer hospitalization data sets since encounter data that equal claims data have not been collected historically for Medicare Advantage. Further, studies that link care for particular patients across settings or conditions tend not to be feasible in the absence of clinical data that allow for stronger comparisons between Medicare Advantage and traditional Medicare. In general, the lack of clinical data that link patient care across different settings has created a major barrier to developing more robust and meaningful quality measures, as many have noted. For example, the National Quality Forum has identified care coordination, patient centered care and outcomes, and care for patients with Alzheimer’s disease and related dementia as three of the top five priorities in terms of future development of measures that matter.24 

Control for Selection and Confounding Variation.

Because Medicare Advantage enrollment is voluntary, it is important to control for characteristics of Medicare beneficiaries that may influence their choice of health plan and also the outcomes of their medical care. Roughly speaking, such variables include socio-demographic characteristics (for example, age, sex, race, and ethnicity) and specific health metrics that relate both to overall health status and the severity of comorbidities associated with particular conditions under study. Because practice patterns and socio-demographic characteristics of beneficiaries enrolled in Medicare Advantage may vary geographically, MedPAC also has recommended that comparisons between Medicare Advantage and traditional Medicare be based on beneficiaries in the same geographical payment areas.25  Such adjustments reflect both the considerable variation in Medicare Advantage enrollment rates across the country and also the differences in individual markets that are likely to influence care both in Medicare Advantage and in traditional Medicare. In Table 2, the 40 studies that compare traditional Medicare to Medicare Advantage are described in terms of their use of locality, socio-demographic, and health status/risk controls, though more detail in the actual techniques used in individual studies are covered in later tables. The aggregate analysis suggests that most studies make some effort to control for confounding sources of variation, such as geography, population and health status, but do so to varying degrees. In many cases, the data available to support such adjustments are limited.

Study Findings by Type of Metric

This section reviews findings from studies organized by each of the five types of quality or access metrics: HEDIS effectiveness of care metrics, beneficiary-reported access and quality metrics, appropriateness and outcomes of Medicare hospitalizations, other utilization and resource use metrics, and health outcomes and mortality. In each subsection, a table summarizes all the studies of that type.

HEDIS Quality Metrics for Effective Care.

Studies Comparing Medicare Advantage to Traditional Medicare. Three studies (by two groups of researchers) provide direct comparisons between Medicare Advantage (mainly HMOs) and traditional Medicare on subsets of HEDIS indicators for effective care (Table 4). The Ayanian studies (2013a and 2013b) used relatively recent data (2003 through 2009) and adjusted for geographical location and socio-demographic characteristics of Medicare Advantage enrollees. The Brennan and Shephard (2010) study used data for 2006-2007 and adjusted for geography only. All three, however, find that Medicare HMOs outperform traditional Medicare on the subset of HEDIS indicators examined. Ayanian et al. (2013a) used indicators that could be constructed from claims data, comparing Medicare HMOs to traditional Medicare, with beneficiaries matched by location and selected demographics. The results showed higher scores for HMOs than for traditional Medicare in all years, with the difference greatest for 21 large, nonprofit HMOs established before 2006. The HEDIS metrics included were heavily weighted to preventive care, which previous studies had shown to be a strength of HMOs.26 

With respect to mammography, Ayanian et al. (2013b) also found more favorable patterns in Medicare HMOs compared to traditional Medicare, but the difference was less marked for Medicare PPOs relative to traditional Medicare. Brennan and Shephard’s (2010) analysis also included findings for PPOs for 8 of the 11 prevention measures analyzed. The authors’ findings, which largely reflect the HMO experience, showed substantially better performance by Medicare Advantage plans relative to traditional Medicare on eight measures, slightly better performance on one measure, and worse performance on two measures (monitoring of persistent medications and persistence of beta blockers), with Medicare Advantage performance particularly high on well-established metrics that Medicare Advantage plans had been required to report for many years (versus newer metrics). However, the findings from the comparison were limited because over this time period (2006-2007) PPO metrics used only administrative data whereas HMOs also could take advantage of medical records data.

Because Medicare health plans (at least HMOs) have been required to report on HEDIS metrics since 1997, their better performance on these indicators could be expected. However, there is not strong evidence linking public reporting per se to subsequent improvements in quality of care.27  With many HEDIS metrics now tied to Medicare Advantage bonus payments, health plans should have strong financial incentives to improve HEDIS scores. However, performance on HEDIS’s preventive indicators within traditional Medicare also could improve because of changes in Medicare benefits that remove cost sharing for many preventive services.

Variation across Types of Medicare Advantage Plans. Because comparisons involving traditional Medicare provided limited insight into newer types of Medicare Advantage plans, we expanded the review to include four studies that use HEDIS effectiveness scores to compare performance across different Medicare Advantage plan types (see Table 4). The most recent study (MedPAC 2014a) compared HMOs and local PPOs reporting for both 2011 and 2012 on a variety of HEDIS metrics, although with no adjustments for location, socio-demographic characteristics, or risk. The authors found differences in HEDIS scores by plan type narrowing over time as scores for Medicare Advantage plans improved, but HMOs still outscored local PPOs on most measures (PPOs only scored better on 4 of 42 measures), particularly on metrics that require extraction of medical records data. NCQA (2013) found improvements on some indicators, particularly those included in the star ratings used for bonus payments. There was a decline, however, in scores for substance abuse treatment metrics, particularly for Medicare PPOs.

Trivedi et al. (2005) found evidence that HEDIS quality improvements in HMOs were associated with reduced disparities in care for whites and blacks, though extensive differences across race remained. Studying HMOs in 1998, Schneider et al. (2005) found not-for-profit plans outperformed for-profit plans, but could not disentangle tax status from managerial processes in certain types of plans (e.g., network/independent practice association (IPA) versus group/staff). MedPAC (2014a) also has documented wide variation across Medicare Advantage plans, with newer plans performing worse than more established ones, even of the same type (i.e., HMOs).28  Ayanian et al. (2013a) also found stronger performance by more mature and larger nonprofit plans.

Together, these studies suggest that the better performance of Medicare HMOs relative to traditional Medicare on HEDIS metrics will vary with HMO characteristics and may not be generalizable, at least to the same extent, to other types of Medicare Advantage plans.

CAHPS and Similar Beneficiary-Reported Metrics

This review identified 10 studies comparing Medicare health plans to traditional Medicare using beneficiary survey data (Table 5), in addition to another study that primarily focused on HEDIS effectiveness but also include a few CAHPS metrics (see Ayanian et al. 2013a in Table 4). The most recent studies use CAHPS data, many of which appear to be undertaken by members of the CAHPS research team, with which CMS had contracted to work on Medicare CAHPS.

While designs varied across the CAHPS studies, the studies as a whole provide complementary insights and used similar measurement techniques and adjustments for case mix and geography. The earliest study (Landon et al. 2004), reporting on the 2000 and 2001 time frame, generally found that traditional Medicare was rated higher than Medicare health plans, which at that time were predominantly HMOs. Traditional Medicare was rated higher on global measures, personal physician ratings, and in absence of problems in getting needed care. Medicare Advantage plans were better at prevention and paperwork, but performance on all metrics varied considerably across states and regions, which the authors attribute to differences in norms of care rather than characteristics specific to plans.

More recent studies suggest that traditional Medicare continues to perform better on most beneficiary-reported metrics, particularly by beneficiaries who are in relatively poor health (Keenan et al. 2009). Another recent study by Elliot et al. (2011) also found larger differences in ratings between traditional Medicare and Medicare Advantage for beneficiaries with certain vulnerabilities, including those with low incomes, no high school degree, poor or fair self-rated health, those older than 85 years, women, and Blacks (Elliott et al. 2011). Ayanian et al. (2013a) found the difference in ratings between Medicare HMOs and traditional Medicare for personal care physicians and specialists to be narrowing by 2009 but also showed that beneficiaries still rated larger, non-profit, and older HMOs more highly than newer HMOs (see Table 3). Keenan et al. (2010) also reports more variability among Medicare Advantage plans compared to traditional Medicare.

For the most part, earlier studies using other beneficiary surveys have reported findings consistent with those from CAHPS. Two of the four studies using surveys other than CAHPS showed that beneficiaries rated care better in traditional Medicare than in Medicare HMOs (Safran et al. 2002; Pourat et al. 2006), one showed beneficiaries rated care as the same (Balsa et al. 2007) and the fourth had mixed findings (Beatty and Dhont 2001).

The Pourat et al. 2006 and Beatty and Dhont 2011 studies also are notable for including less healthy subgroups (chronically ill, those with functional disability). Pourat et al. 2006 (using 1996 data from the Medicare Current Beneficiary Survey) found that higher scores for traditional Medicare than Medicare Advantage held up when the analysis was conducted by chronic condition, disability, and health status, that the difference between Medicare Advantage and traditional Medicare was greater among those with chronic conditions than those without, and that traditional Medicare scores also were higher for beneficiaries with supplemental coverage than those without. Beatty and Dhont 2001 found that among their sample, Medicare Advantage scored better than traditional Medicare on access and affordability but not satisfaction, while those who were least healthy or most disabled rated systems more negatively regardless of plan type.

While Ayanian et al. (2013a) shows that differences may be narrowing over time on some metrics, these studies as a whole show that beneficiaries tend to rate Medicare Advantage plans lower than traditional Medicare on items related to health care access and quality, and this is especially true for beneficiaries in relatively poor health. While the direction of findings from studies involving CAHPS metrics are in the opposite direction from those using HEDIS effectiveness studies, both sets of studies show considerable variation in ratings across plans and geographic locales.

Appropriateness and Outcomes of Medicare Hospitalizations

For purposes of this analysis, we have grouped the next set of studies by their outcome variables: potentially avoidable hospitalizations, quality of admitting hospital/physician, and readmission rates (Table 6).

Potentially Avoidable Hospitalizations. Six studies were identified in this area, four of which use data from subsets of states participating in AHRQ’s Hospital Cost and Utilization Project (HCUP). Of the other two, one uses a single state’s all payer discharge data, and the other uses data from a subset of HMOs that it then matches to traditional Medicare data. With the exception of one largely descriptive study with few controls for confounding factors (Friedman et al. 2009), each of the studies finds that potentially avoidable admissions are lower for Medicare Advantage enrollees than for traditional Medicare, though four studies rely on data before 2006, and reflect HMO experience in mature markets.

Two of six studies are less transparent than the others on methodological issues, and appear to use fewer statistical controls, though they use more recent data (Friedman et al. 2009, Anderson 2009). Friedman et al. (2009) had a broader scope than other studies (13 states) and used AHRQ Prevention Quality indicators.

The findings showed no difference between Medicare Advantage and traditional Medicare on potentially avoidable hospitalizations; however, the analysis was mainly descriptive and did not include controls for patient selection or risk. Anderson’s study (2009), funded by America’s Community Health Plans, an industry association for nonprofit health plans, is not well documented and its methods appear to include no adjustments aside from selecting traditional Medicare data for beneficiaries in the same counties as the Medicare Advantage plans. The HMO comparison in the Anderson study was limited to a subset of HMOs known for their more integrated health care systems, and found that such systems have considerably lower rates of hospitalizations for potential avoidable admissions.

The other four studies span a small number of states and are older but included more statistical controls. Nicholas’s (2013) study linked discharge data to Medicare enrollment files in four states to estimate rates of potentially avoidable hospitalizations. Over the period studied (1999-2005), Medicare enrollees in health plans largely were in HMOs. After adjusting for differences in selection, the study found that ambulatory care sensitive admission rates were lower in Medicare Advantage plans than in traditional Medicare. It further found that the reductions were driven primarily by admissions where inexpensive, short term intervention and routine provision of maintenance medications can reduce risk of hospitalization. The conclusions noted that this is a positive sign that the difference could reflect care management in HMOs, which would make the findings more robust. Using 2004 data from four states, Basu (2012) compared potentially avoidable hospital admissions to “marker” admission rates (that is, admissions for conditions expected to be less discretionary) in Medicare Advantage (largely HMOs) in three states, finding that HMOs performed better than traditional Medicare in all three states and across four racial groups. The difference was particularly strong in the two states with the most mature managed care markets. An earlier study by Basu and Mobley (2007, using 2001 data), covering four states, also showed lower rates of preventable hospital admissions in three of the four states and an indication that effects were particularly strong in the two states with the most mature managed care. The final study (Zeng et al. 2006) is older and included only one state (California), and its findings are consistent with the others.

Though these stronger studies are not necessarily as current and nationally-representative as they might ideally be, they collectively point to lower rates of potentially avoidable hospitalizations in HMOs compared to traditional Medicare, at least in states with mature HMO markets.

Quality of Admitting Hospital and Specialist Care. Five studies compared the hospitals or specialists used by hospitalized patients in Medicare Advantage and traditional Medicare. As a whole, the findings of this body of work are inconclusive and four of the five studies are based on findings from single states.

Using HCUP data from 13 states, Friedman and Jiang (2010) compared risk-adjusted mortality rates and patient safety indicators for hospitals used by Medicare Advantage enrollees and traditional Medicare beneficiaries in urban areas with two or more hospitals. Findings were mixed. HMO patients were admitted to hospitals with higher-mortality rates but also to hospitals with lower rates of events threatening patient safety. Researchers also found greater variability across HMOs than in traditional Medicare in the use of high and low mortality hospitals for surgical care. Huesch (2010) found that Florida HMO patients were less likely to see cardiologists with a favorable outcome profile (lower morality profile), though physician characteristics such as specialty, year, and country of training were otherwise similar across settings. Basu and Friedman (2013) found hospitalized elderly Medicare beneficiaries in Florida HMOs in 2002 at higher risk for selected adverse outcomes associated with iatrogenic pneumothorax, post-operative respiratory failure, and accidental puncture or laceration than hospitalized elderly beneficiaries in traditional Medicare. The final two studies (Luft 2003 and Erickson et al. 2000; see Table 6) each based on a single state in the mid-1990s, had conflicting results.

Readmission rates. Four studies (including the previously discussed Anderson 2009 study) focused on hospital readmission rates.

The first two involve work commissioned by industry associations. The methods used in these studies are not fully documented, making it challenging to assess them. With support from America’s Health Insurance Plans (AHIP), Lemieux et al. (2012) found lower all-cause rates of readmission in Medicare Advantage compared to traditional Medicare from 2006‒2008. Because the data are proprietary (the MORE Registry), it is not clear which plans submitted data and how generalizable the findings are to different types of health plans and markets. While some use is made of the Jencks method to adjust for DRGs and descriptive tables are provided on points of interest, it is unclear if the research controls for differences between Medicare Advantage and traditional Medicare on geographic location, socio-demographic characteristics and health status/risk.29  Further, data on hospital readmissions do not distinguish between multiple readmissions of the same patient. The second study, Anderson (2009) as previously discussed, was supported by the America’s Community Health Plans. Anderson (2009) also looked at hospital readmission rates, finding them to be considerably lower among beneficiaries in ACHP Medicare Advantage plan members than beneficiaries in traditional Medicare. This study also used the Jencks model to determine hospital readmissions within 30 days and hospitalizations and emergency department visits for “ambulatory care-sensitive conditions” (ACSCs), but it is unclear how else the data were adjusted. As noted above, this study included established integrated delivery systems and nonprofit plans whose experience may not necessarily generalize to other types of Medicare Advantage plans.

Friedman et al. (2012) also looked at readmissions, although it included data for only five states, limiting the study’s generalizability. Friedman et al. (2012) focused specifically on initial readmissions and found that after controlling for beneficiaries’ health status, beneficiaries in traditional Medicare were less likely than beneficiaries in Medicare Advantage to be readmitted to the hospital after discharge; the opposite conclusion was reached prior to controlling for beneficiaries’ health status, indicating that studies not controlling for health status could be biased in favor of Medicare Advantage plans. The study by Smith et al. (2005) came to similar conclusions, although the research focused only on patients in a single health plan who had strokes and used older data from 1998-2000. These studies seem to provide weak evidence at best that Medicare Advantage plans have lower rates of potentially avoidable hospital readmissions than does traditional Medicare.

Other Utilization Metrics (including HEDIS utilization metrics)

Table 7 reviews studies using three other sets of utilization metrics comparing Medicare Advantage to traditional Medicare on end-of-life care, use of selected procedures, and overall utilization of services. As noted previously, these metrics, some included in HEDIS performance reporting, measure Relative Resource Use (RRU), the quality implications of which are hard to determine absent information on appropriateness of care to distinguish overuse from underuse or misuse.

Service use at end of life. Many believe that care at the end of life could be better with more focus on the total patient and their preferences, and doing so may result in savings by avoiding costly hospital stays and other care that offers limited benefits that patients and their families may not want.30  Medicare pays for hospice benefits the same way in Medicare Advantage and traditional Medicare. Specifically, Medicare Advantage enrollees who use hospice stay enrolled in their plan but Medicare (rather than the plan) pays directly for hospice benefits, as is done for beneficiaries using hospice in traditional Medicare.31 

Stevenson et al. (2013) examined end-of-life care during the last calendar year of life from 2003‒2009, comparing service use for continuously enrolled elderly Medicare beneficiaries in Medicare HMOs versus the traditional Medicare program. Beneficiaries in Medicare HMOs were more likely to use the hospice benefit, although the difference in the use of the hospice benefit between Medicare HMOs and traditional Medicare narrowed between 2003 and 2009. Medicare HMO enrollees in their last year of life also used fewer inpatient and emergency room services, though researchers were limited in their ability to adjust for any differences in the medical conditions of beneficiaries in Medicare HMOs and traditional Medicare or for patient preferences that also could be reflected in choice of health plan or sector. Stevenson et al. (2013) suggest that their findings could mean that Medicare HMOs do a better job of managing end-of-life care. Thus, it is not clear from the research whether differences in end-of-life care reflect the characteristics of beneficiaries drawn to Medicare HMOs (such as those preferring a less intensive style of care), HMO care management practices (more emphasis on shared decision-making and two way communication), or potential incentives on Medicare HMOs because hospice benefits are “carved out,” and paid directly by Medicare though the individual remains an HMO member. (HMO payments may encourage hospice use because it could potentially lower the costs incurred by the health plan.) Unfortunately, appropriate norms for end-of-life care are both lacking and controversial and very little information is available about the studied beneficiaries, making it hard to assess how to interpret these findings from a quality perspective.

MedPAC (2014b) also found higher rates of hospice use and shorter hospice stays among Medicare Advantage enrollees than among beneficiaries in traditional Medicare (without controlling for case mix); differences in length of hospice stay, they noted, could be a function of differences in primary diagnoses. MedPAC (2014) expressed concern that that the hospice carve-out may result in more fragmented care because no one entity is responsible for the care of the beneficiary and recommended that hospice become part of the Medicare Advantage benefit package.

Use of selected procedures. Matlock et al. (2013) examined rates for three cardiac procedures for Medicare beneficiaries in Medicare Advantage plans participating in the Cardiovascular Research Network (CVRN) consortium (mainly older, established plans that use integrated networks), and compared them with demographically adjusted rates for the same procedures in traditional Medicare over the 2003-2007 period. Though coronary artery bypass graft (CABG) rates were similar in the two sectors, Medicare Advantage enrollees had on average lower rates of angiography and percutaneous coronary interventions (PCI). The differences were driven more by procedures that were non-urgent than urgent, and thus reflect potentially more discretionary care. However, considerable variation existed geographically in each sector, and Medicare Advantage and traditional Medicare rates in the same areas were not necessarily correlated, meaning that the differences probably reflect plan variation, not just area variation in practice patterns. Though the study included both inpatient and outpatient procedures, it did not adjust traditional Medicare data for beneficiary health conditions that could drive both plan choice and procedure use. While the findings suggest that care for some procedures is less intense in older, established HMOs than in traditional Medicare, the study’s implications for quality are uncertain in the absence of data on appropriateness of care to determine whether care is better in one sector than another.

Looking at an earlier period (1997 and just at HMOs), Schneider et al. (2004) also found variability in rates of high-cost procedures for HMOs of different types (adjusted for location and demographics), with nonprofit plans generally having lower rates of procedure use than for-profit HMOs. However, tax status was confounded with differences in plan age and model type. The study included both high- and low-discretion procedures and the appropriateness of procedure use could not be assessed.

Overall Utilization of Services. Three studies examined overall utilization of health services. Using data from 2003-2009 and controlling for self-reported health status, location and socio-demographics, Landon et al. (2012) found that elderly Medicare beneficiaries in HMOs had fewer emergency room visits and inpatient days in a hospital. Medicare Advantage enrollees initially also made fewer ambulatory visits and had fewer surgical days than those in traditional Medicare but these rates converged by the end of the period. HMO enrollees also had lower rates for certain ambulatory procedures (such as hip and knee replacements) but not others (such as CABG surgery and femur fractures). While the authors conclude that patterns of use show less use of discretionary care in Medicare Advantage, suggesting more appropriate care patterns, the findings seem to provide stronger evidence for a difference in resource use than quality of care across the two sectors and could also reflect uncontrolled differences in patient mix. Two other, older studies also showed lower use of inpatient services (Mello et al. 2002; Dhanani et al. 2005) after adjustments for differences in health status.

While these studies speak to differences in use of services in HMOs compared to traditional Medicare, their ability to speak to differences in quality is limited by the lack of information with which to judge appropriateness of care; in other words, it is not clear if use of fewer services is a positive or negative outcome. Because utilization data are available differently in Medicare HMOs (HEDIS use reports) and traditional Medicare (claims), reporting completeness and coding of service use also may differ.

Health Care Outcomes and Mortality

Seven studies examined the relationship between enrollment in Medicare HMOs or traditional Medicare and patient outcomes of three types: mortality rates, stage of cancer diagnosis and outcomes, and functional status (Table 8).

Mortality. Using data from the late 1990s, Dowd et al. (2011) compared two-year mortality rates between Medicare HMOs and those in traditional Medicare between 1996‒2000. While earlier studies seemed to show lower mortality rates in HMOs, Dowd’s analysis found no such effect after using econometric controls to predict and compare HMO and traditional Medicare mortality rates, adjusting for socio-demographics, health and functional status, smoking, and 19 self-reported conditions. This study’s findings lend support for the need to adjust for selection in assessing effects on health outcomes.

Stage of cancer diagnosis and outcomes. Five studies used public or private cancer registry data to assess how enrollment in Medicare health plans affects stage of diagnosis, treatment, and outcomes for various types of cancer. While one of these studies covers the 2005‒2007 period, the others tend to be older or straddle a longer time frame. While the studies were not focused solely on Medicare, they included estimates for Medicare beneficiaries in Medicare Advantage and traditional Medicare and deal with important outcome variables and so were included in this review. The insurance variables used in these studies differ from some other studies (for example, some separate out traditional Medicare only and traditional Medicare with supplemental coverage) and the definitions of some metrics are not entirely clear (e.g., how employment based retiree coverage factors into the definitions).

The study by Ward et al. (2010) was the broadest (registry data for malignant cancer in 14,000 U.S. facilities) as well as the most recent (2005 – 2007). It focused on the probability of late-stage cancer diagnosis based on insurance plan type for those 55 – 74 years of age. Its main finding was that insurance matters, with the uninsured and those on Medicaid (some of whom, researchers note, probably were uninsured for part of the year) more likely to be diagnosed late, and late diagnosis was correlated with survival. Within the Medicare population, researchers found little if any difference between beneficiaries in Medicare HMOs and those in traditional Medicare with supplemental coverage (though only about 5 percent of those 65 and older were in Medicare managed care). Beneficiaries with both Medicare and Medicaid and those with traditional Medicare alone were more likely to be diagnosed late. However the study did not adjust for health status.

The other studies had mixed results. Looking at elderly men diagnosed with localized prostate cancer, Sadetsky et al. (2008) found differences in treatment style but not on survival and clinical risk at diagnosis after applying statistical controls. Looking at Medicare beneficiaries diagnosed at ages 65 – 79 with prostate, female breast, or colorectal cancer in counties with Medicare managed care, Riley et al. (2008) found breast cancer diagnosed earlier in Medicare HMOs but no difference in stage of diagnosis for the other two cancers. However, treatment patterns for two of the three cancers differed between Medicare HMOs and traditional Medicare, with beneficiaries in HMOs on average using a less resource intense style, but considerable diversity in services use across HMOs. Adjustments for patient mix were limited, however. Looking at elderly Medicare beneficiaries diagnosed with melanoma, Kirsner et al. (2005) found that those in Medicare HMOs were diagnosed earlier, leading to improved survival rates. However the data were from 1985-1994 and were highly concentrated in the West Coast, where several large HMOs operate. It is unclear whether the findings apply to current conditions or to locales where managed care is less mature. Looking at colorectal cancer in northern California, Lee-Feldstein et al. (2002) used data from 1987 to 1993 and found earlier diagnosis among beneficiaries in non-group (i.e., IPA) HMOs and traditional Medicare beneficiaries with supplemental coverage than for those with other coverage (single-group HMO, dual eligible, or Medicare with no supplement). Survival rates were similar across groups, however, meaning in this context that earlier diagnosis did not affect survival.

Taken as a whole, these studies suggest that more comprehensive insurance probably increases the chances of early cancer diagnosis, and that health plan type may influence treatment but not necessarily outcomes. However, the age of the studies, the gaps in controls for selection, and the evolving nature of guidelines for appropriate care limit the conclusions that can be drawn.

Functional status. Only one study looked at differences between Medicare Advantage plans and traditional Medicare using functional status as an outcome. Porell and Miltiades (2001), using data from 1991-1996, found that Medicare beneficiaries without a functional impairment who were in HMOs had the same probability of becoming disabled as beneficiaries in traditional Medicare; traditional Medicare beneficiaries with private supplemental insurance had a lower probability of becoming functionally impaired than those in traditional Medicare with no supplemental coverage. Once impaired, Medicare HMO enrollment status had no effect on beneficiaries’ functional status. However, the HMO sample was relatively small, and the study did not adjust for geographic locale.
Report: Summary Of Findings And Conclusions

This literature review included 45 studies published between 2001 and 2014 that examined how Medicare Advantage might affect health care quality and access to care, including 40 studies that made direct comparisons between Medicare health plans and traditional Medicare. As a body of work, these studies offer some insights, although the work is limited by shortfalls in the timeliness of data, the range of health plans studied and the comprehensiveness of the metrics available, particularly on a national basis. Recent studies still mainly capture the Medicare HMO experience rather than experience across the diversity of health plans now participating in Medicare Advantage, and none of them are current enough to provide insight on how Medicare Advantage compares to traditional Medicare after 2010. While many of the reviewed studies adjust for differences in location, patient mix, and health status between Medicare Advantage and traditional Medicare in some fashion, some studies do this better than others, and many studies are constrained by limitations in the available data. In addition, few studies (only four) examine in depth the particular experience of those who are less healthy, functionally impaired, or have other characteristics that make them relatively high users of medical care and potentially disproportionately vulnerable to poorer quality of care or access problems.

The review of the literature, 45 studies published between 2000 and 2014, comparing quality of care and access provided under traditional Medicare and Medicare Advantage plans, suggests the following:

  • HEDIS Effectiveness Metrics on Preventive Care. Medicare Advantage, on average, scores more highly than traditional Medicare on subsets of Medicare HEDIS indicators – primarily those pertaining to use of preventive care services. Two studies found Medicare preferred provider organizations (PPOs) outperformed traditional Medicare on some metrics (particularly mammography rates), though HMOs nevertheless performed better than PPOs. All of these studies were conducted prior to changes made by the ACA to improve coverage of preventive services under traditional Medicare.
  • Beneficiary Reports on Quality and Access (CAHPS). Medicare beneficiaries generally rated Medicare Advantage lower than traditional Medicare on questions about health care access and quality, especially if beneficiaries had a chronic illness or were sick; however, the difference in ratings between traditional Medicare and Medicare Advantage narrowed on some metrics by 2009 (e.g., overall care ratings). Keenan et al. 2009 found that sick beneficiaries in Medicare Advantage rated their plans substantially lower than beneficiaries of similar health status in traditional Medicare, and Elliott et al. 2011 found significantly lower CAHPS ratings (and greater disparities between Medicare Advantage and traditional Medicare) among vulnerable subgroups of beneficiaries in Medicare Advantage. Little is known about how CAHPS scores vary by type of Medicare Advantage plan since most studies are based on HMOs or periods in which HMOs were the main plan type.
  • Potentially Avoidable Hospital Admissions. Based on six studies involving beneficiaries in a limited number of states and/or plans represented by the Alliance of Community Health Plans (ACHP), Medicare beneficiaries in HMOs are less likely to be hospitalized for a potentially avoidable admission than beneficiaries in traditional Medicare. Four of these studies rely on data prior to 2006, and reflect HMO experiences in mature markets.
  • Readmission Rates. While a number of studies examine whether readmission rates differ among beneficiaries in Medicare Advantage and traditional Medicare, the evidence from these studies is inconclusive because findings differ across the studies and many studies lack adjustments for important potentially confounding factors.
  • Health Outcomes. There is some evidence that good coverage, as defined by relatively low cost-sharing (whether through Medicare HMOs or through Medicare with supplemental coverage), may result in earlier diagnoses of some cancers compared to traditional Medicare alone. Treatment patterns for some cancers also may differ between Medicare HMOs and traditional Medicare, but studies do not show that this affects patient outcomes. However, the age of the studies, the gaps in controls for selection, and the evolving nature of guidelines for appropriate care limit the conclusions that can be drawn.
  • Resource Utilization. Medicare HMOs appear to provide a less resource-intensive style of practice than traditional Medicare, as measured in studies examining end-of-life care, use of certain procedures, and overall utilization rate in HMOs, especially for hospital services. However, most of these studies provide little direct evidence of whether less intensive care is better or worse or how the appropriateness of care differs between Medicare Advantage and traditional Medicare.
  • Variation by Geography, by Plan Type, and by Plan Experience. On a variety of metrics, performance among Medicare Advantage plans varies substantially across plans, even among plans of the same plan type. The variations by market in more established HMOs with integrated delivery systems tend to be more represented in existing research, and to perform better. Performance on quality and access metrics varies across geographic areas, and the variations in Medicare Advantage and traditional Medicare ratings are not necessarily the same.

In summary, despite great interest in comparisons between traditional Medicare and Medicare Advantage, studies comparing overall quality and access to care between Medicare Advantage plans and traditional Medicare tend to be limited.

On the one hand, the evidence indicates that Medicare HMOs tend to perform better than traditional Medicare in providing preventive services and using resources more conservatively, at least through 2009. These are metrics where HMOs have historically been strong. On the other hand, beneficiaries continue to rate traditional Medicare more favorably than Medicare Advantage plans in terms of quality and access, such as overall care and plan rating, though one study suggests that the difference may be narrowing between traditional Medicare and Medicare Advantage for the average beneficiary. Among beneficiaries who are sick, the differential between traditional Medicare and Medicare Advantage is particularly large (relative to those who are healthy). Very few studies include evidence based on all types of Medicare Advantage plans, including analysis of performance for newer models, such as local and regional PPOs whose enrollment is growing.

As the beneficiary population ages, better evidence is needed on how Medicare Advantage plans perform relative to traditional Medicare for patients with significant medical needs that make them particularly vulnerable to poorer outcomes. The ability to assess quality and access for such subgroups is limited because many data sources do not allow subgroups to be identified or have too small a sample size to support estimates. Also, in many cases, metrics employed may not be specific to the particular needs or the way a patient’s overall health and functional status or other comorbid conditions influence the care they receive for particular services.

At a time when enrollment in Medicare Advantage is growing, it is disappointing that better information is not available to support policymaking on this program. Our findings highlight the gaps in available evidence and reinforce the potential value of strengthening available data and other support for tracking and monitoring performance across Medicare Advantage plans and traditional Medicare as each sector evolves.

Report: Works Cited

AHIP Center for Policy and Research. “Reductions in Hospital Days, Re-Admissions, and Potentially Avoidable Admissions among Medicare Advantage Enrollees in California and Nevada.” Washington: America’s Health Insurance Plans, (Revised) October 2009.[endnote 133466-1111]

AHIP Center for Policy and Research. “Using AHRQ’s ‘Revisit’ Data to Estimate 30-Day Readmission Rates in Medicare Advantage and the Traditional Fee-for-Service Program.” Washington: America’s Health Insurance Plans, October 2010.[endnote 133466-1112]

Anderson G. “The Benefits of Care Coordination: A Comparison of Medicare Fee-for-Service and Medicare Advantage.” Report prepared for the Alliance of Community Health Plans. September 2009.

Ayanian J et al. “Medicare Beneficiaries More Likely to Receive Appropriate Ambulatory Services in HMOs than in Traditional Medicare.” Health Affairs. 32(2013a): 1228-1235.

Ayanian J, Landon B, Zaslavsky A. Newhouse J. “Racial and Ethnic Differences in Use of Mammography Between Medicare Advantage and Traditional Medicare.” Journal of the National Cancer Institute. 105(2013b): 1891-1896.

Balsa AI, Cao Z, McGuire TG. “Does managed health care reduced health care disparities Between minorities and Whites?” Journal of Health Economics. 26(2007): 101-121.

Barnett MJ, Perry PJ, Langstaff JD, Kaboli PJ. “Comparison of rates of potentially inappropriate medication use according to the Zhan criteria for VA versus private sector Medicare HMOs.” Journal of Managed Care Pharmacy. 12(2006): 362-370.

Basu J. “Medicare Managed Care and Primary Care Quality: Examining Racial and Ethnic Effects across States.” Health Care Management Science. 15(2012): 15-28.

Basu J, Friedman B. “Adverse Events for Hospitalized Medicare Patients: Is There a Difference Between HMO and FFS Enrollees?” Social Work Public Health. 28(2013): 639-51.

Basu J, Mobley LR. “Do HMOs Reduce Preventable Hospitalizations for Medicare Beneficiaries?” Medical Care Research and Review. 64(2007): 544-567.

Beatty P, Dhont K. “Medicare Health Maintenance Organizations and Traditional Coverage: Perceptions of Health Care among Beneficiaries with Disabilities.” Archives of Physical Medicine and Rehabilitation. 82(2001): 1009-1017.

Bian J, Dow WH, Matchar DB. “Medicare HMO Penetration and Mortality Outcomes of Ischemic Stroke.” American Journal of Managed Care. 12(2006): 58-64.

Brennan N, Shephard M. “Comparing Quality of Care in the Medicare Program.” American Journal of Managed Care. 16(2010): 841-848.

Cohen R, Lemieux J, Schoenborn J, Mulligan T. “Medicare Advantage Chronic Special Needs Plan Boosted Primary Care, Reduced Hospital Use among Diabetes Patients.” Health Affairs. 31(2012): 110-119.

Dhanani N, O’Leary JF, Keeler E, Bamezai A, Melnick G. “The Effects of HMOs on the Inpatient Utilization of Medicare Beneficiaries.” Health Services Research. 39(2004): 1607-1627.

Dowd B, Maciejewski ML, O’Connor H, Riley G, Geng Y. “Health Plan Enrollment and Mortality in the Medicare Program.” Health Economics. 20(2011): 645-659.

Elliott MN, Haviland AM, Orr N, Hambarsoomian K, Cleary PD. “How Do the Experiences of Medicare Beneficiary Subgroups Differ Between Managed Care and Original Medicare?” Health Services Research. 46(2011): 1039-1058.

Erickson LC, Torchiana DF, Schneider EC, Newburger JW, Hannan EL. “The Relationship Between Managed Care Insurance and Use of Lower-Mortality Hospitals for CABG Surgery.” Journal of the American Medical Association. 283(2000): 1976-1982.

Farley DO, Elliott MN, Haviland AM, Slaughter ME, Heller A. “Understanding Variations in Medicare Consumer Assessment of Health Care Providers and Systems Scores: California as an Example.” Health Services Research. 46(2011): 1646-1662.

Friedman B, Jiang HJ. “Do Medicare Advantage Enrollees Tend to be Admitted to Hospitals with Better or Worse Outcomes Compared with Fee-for-Service Enrollees?” International Journal of Health Care Finance and Economics. 10(2010): 171-185.

Friedman B, Jiang HJ, Russo CA. “Medicare Hospital Stays: Comparisons Between the Fee-for-Service Plan and Alternative Plans, 2006.” Health Cost and Utilization Project (HCUP) Statistical Brief #66. January 2009.

Friedman B, Jiang HJ, Steiner CA, Bott J. “Likelihood of Hospital Readmission after First Discharge: Medicare Advantage vs. Fee-for-Service Patients.” INQUIRY: The Journal of Health Care Organization, Provision, and Financing. 49(2012): 202-213.

Huesch M. “Managing Care? Medicare Managed Care and Patient Use of Cardiologists.” Health Services Research. 45(2010): 329-354.

Keating N, Landrum MB, Meara E, Ganz PA, Guadagnoli E. “Do Increases in the Market Share of Managed Care Influence Quality of Cancer Care in the Fee-for-Service Sector?” Journal of the National Cancer Institute. 97(2005): 257-264.

Keenan PS, Elliott MN, Cleary PD, Zaslavsky AM, Landon BE. “Quality Assessments by Sick and Healthy Beneficiaries in Traditional Medicare and Medicare Managed Care. Medical Care. 47(2009): 882-888.

Keenan PS et al. “Geographic Area Variations in the Medicare Health Plan Era. Medical Care. 48(2010): 260-266.

Keyhani S et al. “Use of Preventive Care by Elderly Male Veterans Receiving Care Through the Veterans Health Administration, Medicare Fee-for-Service, and Medicare HMO Plans.” American Journal of Public Health. 97(2007): 2179-2185.

Kirsner RS, Wilkinson JD, Ma F, Pacheco H, Federman DG. “The Association of Medicare Health Care Delivery Systems with Stage at Diagnosis and Survival for Patients with Melanoma.” (Reprinted) Archives of Dermatology. 141(2005): 753-757.

Kulkarni VT et al. “Regional Associations Between Medicare Advantage Penetration and Administrative Claims-based Measures of Hospital Outcomes.” Medical Care. 50(2012): 406-409.

Landon BE, Zaslavsky AM, Bernard SL, Cioffi MJ, Cleary PD. “Comparison of Performance of Traditional Medicare vs Medicare Managed Care. Journal of the American Medical Association. 291(2004): 1744-1752.

Landon BE et al. “Analysis of Medicare Advantage HMOs Compared with Traditional Medicare Shows Lower Use of Many Services During 2003-09. Health Affairs. 31(2012): 2609-2617.

Lee-Feldstein A, Feldstein PJ, Buchmueller T. “Health Care Factors Related to Stage at Diagnosis and Survival among Medicare Patients with Colorectal Cancer.” Medical Care. 40(2002): 362-374.

Lemieux J, Sennett C, Wang R, Mulligan T, Bumbaugh, J. “Hospital Readmission Rates in Medicare Advantage Plans.” American Journal of Managed Care. 18(2012): 96-104.

Luft HS. “Variations in Patterns of Care and Outcomes after Acute Myocardial Infarction for Medicare Beneficiaries in Fee-for-Service and HMO Settings.” Health Services Research. 38(2003): 1065-1079.

Matlock DD et al. “Geographic Variation in Cardiovascular Procedure Use among Medicare Fee-for-Service vs Medicare Advantage Beneficiaries.” Journal of the American Medical Association. 310(2013): 155-162.

Medicare Payment Advisory Commission (MedPAC) Report to the Congress: Medicare Payment Policy. Chapter 13. “The Medicare Advantage Program: Status Report.” Washington: Medicare Payment Advisory Commission, March 2014.

Mello MM, Stearns SC, Norton EC. “Do Medicare HMOs Still Reduce Health Services Use after Controlling for Selection Bias?” Health Economics. 11(2002): 323-340.

Mittler JN, Landon BE, Fisher ES, Cleary PD, Zaslavsky AM. “Market Variations in Intensity of Medicare Service Use and Beneficiary Experiences with Care.” Health Services Research. 45(2010): 647-669.

National Committee for Quality Assurance (NCQA). “Improving Quality and Patient Experience: The State of Health Care Quality 2013.” Washington: National Committee for Quality Assurance, October 2013.

Newhouse JP, McGuire TG. “How Successful is Medicare Advantage?” Milbank Quarterly. 92(2014): 351−394.[endnote 133466-1113]

Nicholas LH. “Better Quality of Care or Healthier Patients? Hospital Utilization by Medicare Advantage and Fee-for-Service Enrollees.” Forum for Health Economics and Policy. 16(2013): 137-161.

Porell FW, Miltiades HB. “Disability Outcomes of Older Medicare HMO Enrollees and Fee-for-Service Medicare Beneficiaries.” Journal of the American Geriatrics Society. 49(2001): 615-631.

Pourat N, Kagawa-Singer M, Wallace SP. “Are Managed Care Medicare Beneficiaries with Chronic Conditions Satisfied with their Care?” Journal of Aging and Health. 18(2006): 70-90.

Riley GF et al. “Comparison of Cancer Diagnosis and Treatment in Medicare Fee-for-Service and Managed Care Plans.” Medical Care. 46(2008): 1108-1115.

Sadetsky N et al. “Prostate Cancer Outcomes among Older Men: Insurance Status Comparisons Results from CaPSURE Database.” Prostate Cancer and Prostatic Diseases. 11(2008): 280-287.

Safran DG, Wilson IB, Rogers WH, Montgomery JE, Chang H. “Primary Care Quality in the Medicare Program: Comparing the Performance of Medicare Health Maintenance Organizations and Traditional Fee-for-Service Medicare.” (Reprinted) Archives of Internal Medicine. 162(2002): 757-765.

Schneider EC, Zaslavsky AM, Epstein AM. “Use of High-Cost Operative Procedures by Medicare Beneficiaries Enrolled in For-Profit and Not-for-Profit Health Plans. New England Journal of Medicine. 350(2004): 143-150.

Schneider EC, Zaslavsky AM, Epstein AM. “Quality of Care in For-Profit and Not-for-Profit Health Plans Enrolling Medicare Beneficiaries.” American Journal of Medicine. 118(2005): 1392-1400.

Selim A et al. “Risk-Adjusted Mortality as an Indicator of Outcomes: Comparison of the Medicare Advantage Program with the Veterans Health Administration.” Medical Care. 44(2006): 359-365.

Selim A et al. “Change in Health Status and Mortality as Indicators of Outcomes: Comparison Between the Medicare Advantage Program and the Veterans Health Administration.” Quality of Life Research. 16(2007): 1179-1191.

Selim A et al. “Comparison of Health Outcomes for Male Seniors in the Veterans Health Administration and Medicare Advantage Plans.” Health Services Research. 45(2010): 376-396.

Smith MA, Frytak JR, Liou J, Finch MD. “Rehospitalization and Survival for Stroke Patients in Managed Care and Traditional Medicare Plans.” Medical Care. 43(2005): 902-910.

Stevenson DG, Ayanian JZ, Zaslavsky AM, Newhouse JP, Landon BE. “Service Use at the End-of-Life in Medicare Advantage Versus Traditional Medicare.” Medical Care. 51(2013): 931-937.

Trivedi AN, Grebla RC. “Quality and Equity of Care in the Veterans Affairs Health-Care System and in Medicare Advantage Health Plans.” Medical Care. 49(2011): 560-568.

Trivedi AN, Zaslavsky AM, Schneider EC, Ayanian JZ. “Trends in the Quality of Care and Racial Disparities in Medicare Managed Care.” New England Journal of Medicine. 353(2005): 692-700.

Ward EM, Fedewa SA, Cokkinides V, Virgo K. “The Association of Insurance and Stage of Diagnosis among Patients Aged 55 to 74 Years in the National Cancer Database.” Cancer Journal. 16(2010): 614­-621.

Zeng F et al. “The Effect of Medicare Health Maintenance Organizations on Hospitalization Rates for Ambulatory Care-Sensitive Conditions.” Medical Care. 44(2006): 900-907.

Appendix

Care for Seniors in Medicare Advantage Versus the Veterans Health Administration

This set of studies differs less on their outcome measures than on their comparison groups. Six studies focus specifically on care in Medicare health plans versus the VHA system, an organized delivery system that in the 1990s – 2000s put special emphasis on measuring and improving quality of care (Appendix Table A.1).[endnote 133466-101] Of the six, two studies focus on HEDIS-type quality indicators, two studies focus on functional status, one study focused on mortality, and one study focused on the use of potentially appropriate drugs. Over the time period studied, almost all Medicare Advantage plans were HMOs. In all of the studies, the VHA system scored better after adjustments for health status. Though the studies as a whole are reasonably strong methodologically, they were limited by inconsistencies in the data available across the VHA and Medicare programs. Veterans also are a unique and diverse population and it is not clear how those veterans drawn to the VHA might differ from seniors served in Medicare Advantage. Because selection is always an issue in these studies, the studies could understate the VHA’s relative performance if Medicare covered veterans drawn to the VHA are sicker than those in Medicare Advantage. However, studies focused on the VHA, like those looking more generally at Medicare Advantage, lend support to the view that mature, organized health systems perform better on HEDIS-type measures, and the importance of recognizing variation in performance across the managed care sector.


Endnotes

  1. Henry J. Kaiser Family Foundation. “Medicare at a Glance.” September 2014. ↩︎
  2. Gold M, Jacobson G, Damico A, Neuman T. Medicare Advantage enrollment spotlight: 2014 enrollment update. Washington, DC: Kaiser Family Foundation, May 2014. ↩︎
  3. Miller RS, Luft HS. HMO plan performance update: an analysis of the literature, 1997-2001. Health Aff. 2002;21(4):63-86. Earlier reviews in this series came to similar conclusions, though authors note that studies specific to quality were even more limited then. (See Miller RH, Luft HS. Does managed care lead to better or worse quality? Health Aff. 1997;16(5):7-25; and Miller RH, Luft HS. Managed care plan performance since 1980: a literature analysis. JAMA. 1997;2271(19): 1512-29.) ↩︎
  4. Miller RH, Luft HS. Does managed care lead to better or worse quality? Health Aff. 1997;16(5):7-25. ↩︎
  5. Gold, M. “The Changing U.S. Health Care System: Challenges for Responsible Public Policy.” Milbank Quarterly, vol. 77, no. 1, 1999, pp. 3-37. ↩︎
  6. Medicare Payment Advisory Commission. Report to Congress: Medicare Payment policy. March 2014a; Chapter 13, The Medicare Advantage Program: a status report. ↩︎
  7. Jacobson G, Neuman T, Damico A, Huang J. “Medicare Advantage Plan Star Ratings and Bonus Payments in 2012” Washington DC: Kaiser Family Foundation, November 2011. ↩︎
  8. America’s Health Insurance Plans. What you need to know: Medicare Advantage: providing high quality, cost efficient care for Medicare Beneficiaries. Available at http://ahip.org/Issues/Medicare-Advantage.aspx. Accessed August 9, 2014. ↩︎
  9. Newhouse JP, McGuire TB. Review article: how successful is Medicare Advantage? Milbank Q. 2014;92(2):351-394. The three studies cited (Ayanian et al. 2013a, Ayanian et al. 2013b, and Landon et al. 2012) are included in the review in this paper. Citations are in the reference list. ↩︎
  10. Frakt A. “The UpShot: Medicare Advantage is More Expensive but It May Be Worth It” New York Times, August 18, 2014; and John Graham, “Are Medicare Advantage Plans Overpaid and Corrupt?” National Center for Policy Analysis, August 27, 2014, Available at http://healthblog.ncpa.org., Accessed August 27, 2014. ↩︎
  11. The search was conducted in spring 2014 by Stephanie Albier at Pinpoint Search Strategies LLC in Silver Spring, MD. ↩︎
  12. Our review techniques aimed to provide an objective analysis comparing access and quality in Medicare Advantage and traditional Medicare in policy-relevant terms within the constraints of available resources. These constraints limited our ability to incorporate all of the techniques recommended for systematic reviews (See for example, guidelines developed by the Institute of Medicine. Available from: http://www.iom.edu/~/media/Files/Report%20Files/2011/Finding-What-Works-in-Health-Care-Standards-for-Systematic-Reviews/Standards%20for%20Systematic%20Review%202010%20 Insert.pdf.) Despite this, we believe we have identified the major studies in this area, particularly on a national scope, and provided sufficient documentation of our analysis to allow users to judge the results. ↩︎
  13. America’s Health Insurance Plans. 2014. op. cit. ↩︎
  14. While we looked online for relevant research syntheses on this topic by the Cochrane Collaborative or a similar Canadian group that emphasizes health system studies, we found none directly on the topic. ↩︎
  15. McGlynn EA et al. The quality of health care delivered to adults in the United States. NJEM. 2003 June 26;348(26):2635-45. ↩︎
  16. Medicare Payment Advisory Commission. Report to Congress: Medicare and the health care delivery system. Washington, DC. June 2014b. Chapter 3, Measuring quality of care in Medicare. ↩︎
  17. See NCQA’s Summary Table of Measures, Product Lines, and Changes in HEDIS 2014. Available from: http://www.ncqa.org/Portals/0/HEDISQM/HEDIS2014/List_of_HEDIS_ 2014_ Measures.pdf (Accessed 8/4/2014). Effectiveness metrics include the following: adult BMI assessment, breast cancer screening, colorectal cancer screening, glaucoma screening for older adults, spirometry testing for COPD, pharmacotherapy for COPD, cholesterol management for CVD, hypertension control, beta blocker after a heart attack, comprehensive diabetes care, disease-modifying anti-rheumatic drug therapy for rheumatoid arthritis, osteoporosis management, anti-depression medication management, follow-up care after hospitalization for mental illness, annual monitoring of patients on persistent medications, potentially harmful drug interactions, use of high-risk medications in the elderly, health outcomes survey, fall risk management, urinary incontinence management, osteoporosis testing in older women, physician activity in older adults, flu vaccinations for 65+, medical assistance with smoking and tobacco cessation, and pneumonia vaccination for 65+. Access/availability of care measures includes adult access to preventive ambulatory services, initial and engagement of alcohol and other drug dependence treatment, and call-answer timeliness. ↩︎
  18. Medicare Payment Advisory Commission. Report to Congress: Medical Payment Policy. March 2010; Chapter 6, Report on comparing quality among Medicare Advantage plans and between the Medicare Advantage and fee-for-service Medicare; and Medicare Payment Advisory Commission. Report to Congress: Medicare Payment policy. March 2012; Chapter 12, The Medicare Advantage Program: a status report, p. 326. ↩︎
  19. Medicare Payment Advisory Commission, June 2014b and March 2010, op. cit. ↩︎
  20. Additional information on the survey is posted on these two web sites: http://www.ma-pdpcahps.org/content/homepage.aspx and https://cahps.ahrq.gov/surveys-guidance/hp/ about/ Medicares-CAHPS-HP-Survey.html, accessed August 4, 2014. Beginning in 2011, Medicare replaced its survey of traditional Medicare beneficiaries with a requirement that freestanding prescription drug plans (PDPs) collect CAHPS data. ↩︎
  21. Almost all studies focused only on a single type of metric because of the data sources they employed. (Ayanian 2013a is an exception). Where more than one source is used, we classify the study based on its predominant method but discuss findings wherever they are relevant. ↩︎
  22. For additional information on the Medicare Modernization Act of 2003 and the evolution of the Medicare Advantage program over the first few years, see Gold, Marsha. “Medicare’s Private Plans: A Report Card on Medicare Advantage.” Health Affairs Web Exclusive, November 24, 2008. ↩︎
  23. See, for example, Gold, Marsha R., Gretchen A. Jacobson, and Rachel L. Garfield. “There Is Little Experience and Limited Data to Support Policy Making on Integrated Care for Dual Eligibles.” Health Affairs, vol. 312, no. 6, June 2012, pp. 1176-1187. ↩︎
  24. See National Quality Forum “Prioritizing Measures. Available at http://www.qualityforum.org/prioritizing_measures/ (accessed 10/9/2014). ↩︎
  25. MedPAC 2014a, op site. ↩︎
  26. Miller and Luft, 2002, op. cit. ↩︎
  27. Bundorf MK, Choudhry K, Baker L. Health plan performance measurement: does it affect quality of care for Medicare managed care enrollees? Inquiry. 2008;45:1658‒183. This period was before payment was tied to such metrics. ↩︎
  28. Medicare Payment Advisory Commission. Report to Congress: Medicare Payment policy, March 2011; Chapter 12, The Medicare Advantage program: a status update, p. 295. ↩︎
  29. Jencks SF. “Rehospitalizations among Patients in the Medicare Fee-for-Service Program” New England J. of Medicine 360:1418-1428, April 2, 2009. ↩︎
  30. Patrizi P, Thompson E, and Spector A. “Improving Care at the End of Life: How the Robert Wood Johnson Foundation and Its Grantees Built the Field,” Retrospective evaluation prepared for the Robert Wood Johnson Foundation, March 2011. ↩︎
  31.  See the Medicare Payment Advisory Commission’s March 2013 Report to Congress, including both Chapter 12 (Hospice Services) and Chapter 13 (Medicare Advantage). Washington DC. ↩︎
Poll Finding

Data Note: Gearing Up For Round 2 of Open Enrollment: Some Lessons From Round 1

Authors: Mira Norton, Bianca DiJulio, and Mollyann Brodie
Published: Nov 4, 2014

As the second round of open enrollment approaches, policy makers, journalists, insurers and enrollment groups may want to keep in mind what health insurance shoppers told us about their experiences during the first open enrollment period.  Two Kaiser Family Foundation surveys conducted last spring after the first open enrollment came to a close explored the shopping experience among two key groups impacted by the ACA: non-group health insurance purchasers1  and the previously uninsured in California2 , the state with the largest number of uninsured in the country prior to the ACA.  This data note examines selected findings from each of these surveys that shed light on how people navigated the new options and choices available under the ACA during last fall’s open enrollment, with the hope of informing our understanding of individuals needs during this second open enrollment period.

Four key takeaways emerge from these surveys:

  1. The websites were just one way people got information and enrolled in health plans – many also got help in person or over the phone.
  2. Costs, including the monthly premiums, deductible, and copays, were important factors in plan choice.
  3. Outreach efforts that reached individuals directly helped to boost enrollment
  4. Both those who successfully enrolled in coverage as well as those who remained uninsured expressed some trouble with the process, such as difficulty finding health insurance information, figuring out if their income qualified them for financial assistance, and comparing coverage and costs across plans.

Not Just A Website, Many Enrolled Via Other Means

In the fall of 2013, much media attention was paid to the problematic launch of the federal health insurance exchange website, Healthcare.gov. While many of the nation’s uninsured and non-group plan purchasers sought out information and plan options through online resources, including Healthcare.gov and state-based exchange websites, both surveys show that the internet was by no means the only way people shopped for, and purchased, health plans.  Nationally, throughout the shopping and enrollment process about two-thirds of people who reported buying coverage through the exchanges said they spent any time online, half said they spent time on the phone, and about 3 in 10 said they spent time in person with someone helping them.

Figure 1

Of those Californians who were uninsured prior to the first open enrollment period, 58 percent reported gaining health insurance, including 25 percent through Medi-Cal and 9 percent through Covered California. Among these newly insured Californians, the largest share said they purchased or signed up for their coverage in person (38 percent), with smaller shares saying they signed up on the internet (23 percent) or on the phone (19 percent).3   However, within this group are some important differences, as newly insured Covered California and Medi-Cal enrollees tended to sign up for health insurance in different ways.  Most newly insured Covered California enrollees reported purchasing their plan through the internet (52 percent) or on the phone (29 percent), while newly insured Medi-Cal enrollees were more likely to say they signed up for insurance in person (52 percent) with smaller shares saying they enrolled in insurance through the internet, on the phone, or by mail.

Figure 2

Enrollment With A Personal Touch

However it was they enrolled in a health plan, they didn’t often do it on their own.  Many people shopping for individual health insurance plans said they got help navigating the process, including nearly half of exchange purchasers nationwide and about six in ten of California’s newly insured.  In California, the largest share of newly insured Medi-Cal enrollees reported getting help from an enrollment or community health worker while most newly insured Covered California enrollees said they got help from an exchange representative or from family or friends.  Exchange purchasers nationwide were somewhat more likely than California’s previously uninsured to complete the process on their own – possibly related to their increased familiarity with health insurance enrollment processes; about four in ten previously had some form of insurance – although still about a quarter reported getting help from exchange representatives.

Figure 3

A majority of exchange purchasers nationwide said they found it at least somewhat easy to compare plans’ monthly premiums (69 percent) and copays and deductibles (64 percent), figure out if their income qualifies them for financial assistance (64 percent), set up an account with the health insurance marketplace (59 percent) and compare the providers covered by the plans (58 percent).  Still, roughly 3 in 10 exchange enrollees said each of these things was difficult.

Outreach Matters

Outreach efforts that directly reached individuals were an important factor in getting people enrolled in health insurance plans, with those previously uninsured Californians who said they were personally contacted through a phone call, email, text, or door-to-door visit being more likely to report getting health insurance by the end of open enrollment.  This factor remained a significant predictor of getting insurance even after accounting for other things that influenced whether someone was more or less likely to enroll.

Figure 4

Cost Main Factor in Plan Choice

In choosing a health plan, non-group health insurance shoppers often faced a complicated field of choices and weighed a variety of factors in their health plan purchase, including the plan’s monthly premium, deductible and copayment, choice of doctors and hospitals, and the range of covered benefits, among other factors.  Among exchange purchasers who considered multiple plans, about eight in ten (79 percent) say the monthly premium was a “very” or “extremely” important factor in choosing their current plan over other choices available, and nearly three-quarters (73 percent) say the same about the plan’s copay and deductible. Somewhat fewer – though still sizeable shares– report placing a lot of importance on provider choice (63 percent) and covered benefits (62 percent), while far fewer say recommendations from friends or family were an important factor (26 percent). When asked to choose the MOST important factor, more cited premium costs than any other element as the single most important factor being considered.

Figure 5

The three-quarters of those newly insured through Covered California who said they had a choice in plans echoed the priorities of exchange purchasers nation-wide, saying that cost was the main factor in choosing their current health plan. One third said the monthly premium cost was the most important factor and an additional one in five (22 percent) said the deductible was most important.

Challenges Remain

While many exchange enrollees and newly insured Californians said they had a relatively easy time navigating the new health insurance landscape to shop for and ultimately purchase a plan, it’s important to consider the more than a third of uninsured Californians who remained without coverage at the end of open enrollment but reported trying to get health insurance.

Those uninsured in California who tried to get health insurance reported a number of challenges and a majority of them said the process was difficult.  They reported having a difficult time finding health insurance information (58 percent), substantially more than the 19 percent of those who said they successfully enrolled in a health plan.  When shopping for a plan, California’s remaining uninsured who tried to get Medi-Cal or non-group coverage reported having a difficult time finding a plan that fit their needs (76 percent).  Those remaining uninsured in California who report attempting to get non-group coverage also say it was difficult to compare the services covered by health plans (71 percent), the amount they would pay for health services (69 percent), and the monthly premium (67 percent).

Figure 6

Even some people that did successfully enroll in a health plan expressed that certain aspects of the process were difficult.  About four in ten newly insured Covered California enrollees said they experienced difficulties in the overall process of signing up for health insurance.  Substantial shares of newly insured Covered California enrollees said it was at least somewhat difficult to compare services across plans (44 percent), find a plan that met their needs (38 percent), or find someone to answer their questions or help with enrollment (38 percent).  When it came time to get coverage confirmation, about four in ten said that it was difficult to get confirmation that their coverage had started from Covered California and about three in ten said it was difficult to confirm enrollment in Medi-Cal.

The results from these surveys conducted right after the first open enrollment period ended indicate the role outreach, personal assistance, and different avenues for enrollment can play during this next open enrollment.  Cost remains the primary consideration for enrollees, and while most found it easy to compare plans, there are still those who reported having problems with one or more parts of the shopping experience.  The difficulty reported by the remaining uninsured who tried to get coverage in finding assistance, health insurance information, and a plan that fits their needs will likely be areas of focus for those helping people to enroll across the country during this next  open enrollment period.

  1. Kaiser Family Foundation, Survey of Non-Group Health Insurance Enrollees, June, 2014 ↩︎
  2. Kaiser Family Foundation, Where Are California’s Uninsured Now? Wave 2 of the Kaiser Family Foundation California Longitudinal Panel Survey, July, 2014.  The baseline survey, fielded July-August 2013, included only those Californians ages 19-64 who reported being without coverage for at least two months. After the open enrollment period came to a close, a second survey followed up with the same group of individuals who participated in the baseline to find out whether they obtained coverage or remained uninsured and to explore the coverage choices people made, their experiences with open enrollment and their new insurance. ↩︎
  3. Excludes the 12% of previously uninsured Californians who say they got coverage through an employer. ↩︎
News Release

Analysis Finds Donor Government International Funding for Family Planning Increased By 19 Percent From 2012

Published: Nov 2, 2014

A new Kaiser Family Foundation report finds that donor governments provided US$1.3 billion in bilateral funding for family planning programs in low- and middle-income countries in 2013 – a 19 percent increase from 2012. Donor governments also gave an additional $454 million in core contributions to the United Nations Population Fund (UNFPA), the primary multilateral organization addressing family planning. Funding has risen since the London Summit on Family Planning in 2012, although most of the increase was driven by a small number of donors.

The United States provided almost half of bilateral funding for family planning programs in 2013 (US$585 million), followed by the U.K. (US$305 million), the Netherlands (US$154 million), Sweden (US$50 million), and Canada (US$46 million). Preliminary data indicate that donors are making progress toward commitments made at the London summit.

The full analysis, released at the same time as Family Planning 2020’s annual report detailing progress made on commitments from the 2012 London Summit on Family Planning, is available on the Kaiser Family Foundation’s website. Related Kaiser Family Foundation resources include the Global Health Budget Tracker.

Donor Government Assistance for Family Planning in 2013

Authors: Jennifer Kates, Adam Wexler, and Eric Lief
Published: Nov 2, 2014

Executive Summary

In the time since the London Summit on Family Planning (FP2020) convened in 2012, donor governments have increased their support for family planning efforts. In 2013, the most recent year for which data are available, donor governments provided $1.3 billion to support bilateral family planning programs in low- and middle-income countries, an increase of more than $200 million (19%) above 2012 levels. This growth was largely due to increased funding from the U.S., the U.K., and the Netherlands, already the three largest donors to bilateral family planning programs. Donor governments also provided US$454 million in core contributions to the United Nations Population Fund (UNFPA) – the primary multilateral organization addressing family planning – an increase of US$22 million (5%) above 2012 levels. In addition, preliminary data indicate that donors are making progress toward commitments made at FP2020.

The Kaiser Family Foundation initiated a family planning resource tracking project last year, adapting the methodology it has long used to monitor donor government spending on HIV.1  Data for the project were first provided for 2012, establishing a baseline for monitoring FP2020 commitments. This year’s report is based on 2013 funding data from 26 governments who were members of the Organisation for Economic Co-operation and Development (OECD), Development Assistance Committee (DAC) in 2013 and had reported Official Development Assistance (ODA) to the DAC.2  Data were collected directly from ten donors, who represent approximately 98% of bilateral family planning funding, and are profiled in this report: Australia, Canada, Denmark, France, Germany, Netherlands, Norway, Sweden, the U.K., and the U.S. Data for the remaining DAC members was obtained from the OECD Creditor Reporting System (CRS).

Key findings include:

  • In 2013, donor governments provided US$1.3 billion for bilateral family planning programs, representing a 19% increase (+$211.4 million) compared to 2012 (US$1.1 billion), and an additional US$454 million in core contributions to UNFPA, representing a US$22 million (5%) increase over 2012 (US$432.2 million)3  (see Table and Appendix 1).
  • Seven donors (Canada, Denmark, Netherlands, Norway, Sweden, U.S., and U.K.) increased bilateral funding in 2013 (after exchange rate fluctuations are taken into account), while one (Australia) remained essentially flat and two decreased (France and Germany).
  • Most of the bilateral increase was driven by the U.S., followed by the U.K. and the Netherlands.
  • The U.S. was the single largest bilateral donor in 2013, providing US$585 million and accounting for almost half (45%) of total bilateral funding. The U.K. (US$305.2 million, 23%) was the second largest bilateral donor, accounting for nearly a quarter of all funding, followed by the Netherlands (US$153.7 million, 12%), Sweden (US$50.4 million, 4%), and Canada (US$45.6 million, 3%).
  • Among the donor governments profiled, Norway provided the largest core contribution to UNFPA in 2013 (US$70.6 million), and drove most of the increase, followed by Sweden (US$65.8 million), the Netherlands (US$52.4 million), and Denmark (US$40.4).[endnote 132809-4]
  • Eight of the ten donors profiled made specific commitments during the 2012 London Summit on Family Planning to increase their spending on family planning over a multi-year period: Australia, Denmark, France, Germany, the Netherlands, Norway, Sweden, and the U.K.[endnote 132809-5] Based on analysis of their 2012 and 2013 expenditures, these eight donors have made progress towards fulfillment of their stated commitments (see Appendix 2).
Table: Donor Government Family Planning Disbursements, 2012-2013 (US$ millions)
Country20122013
Bilateral DisbursementsUNFPA – Core ContributionsBilateral DisbursementsUNFPA – Core Contributions
Australia$43.2$14.9$39.5$15.6
Canada$41.5$17.4$45.6$16.0
Denmark$13.0$44.0$18.8$40.4
France$49.6$0.5$37.2$0.0
Germany$47.6$20.7$38.2$24.0
Netherlands$105.4$49.0$153.7$52.4
Norway$3.3$59.4$20.4$70.6
Sweden$41.2$66.3$50.4$65.8
U.K.$252.8$31.8$305.2$31.5
U.S.$485.0$30.2$585.0$28.9
Other DAC Countries$13.8$98.0$13.8$108.8
Total$1,096.4$432.2$1,307.8$454.0


Report

Introduction

Access to family planning (FP) services has a significant impact on the health and wellbeing of women and girls, and on global health and development more broadly. Family planning – the ability of individuals and couples to determine their desired number of children as well as the timing of and spacing between births – can help prevent pregnancy-related health risks, reduce infant mortality, and help in the prevention of sexually transmitted diseases such as HIV/AIDS.4  Currently, it is estimated that more than 200 million women worldwide would like to delay or stop childbearing, but they do not have access to contraceptives.5 

In July 2012, the U.K. Government and the Bill & Melinda Gates Foundation, in partnership with UNFPA, civil society organizations, developing countries, donor governments, the private sector, and multilateral organizations met at the London Summit on Family Planning (FP2020) and made commitments aimed at providing voluntary family planning services to an additional 120 million women and girls in developing countries by 2020. The London Summit built on prior efforts, such as the International Conference on Population and Development (ICPD) in 1994 and inclusion of family planning related goals under Millennium Development Goal (MDG) 5, and brought renewed attention to international efforts to support family planning programs in low- and middle-income countries. Additionally, the London Summit resulted in stated commitments totaling $2.6 billion in additional funding for family planning activities from all sources (donor governments, non-governmental organizations, philanthropies, multilateral organizations, and domestic resources).

While funding from all sources – domestic public and private spending, donor government bilateral assistance, multilateral organizations and private philanthropic (see Box 1) – is needed to help fulfill international goals and commitments, donor governments provide a significant share of global funding for family planning services.6  Following the London Summit, the Kaiser Family Foundation conducted an analysis of donor government funding for family planning activities in 2012 to establish a FP funding baseline that could be used to track funding levels over time as well as specific donor government progress in meeting the London Summit on Family Planning commitments.

Box 1: Other Sources of Funding for FP in Low- & Middle-Income Countries

While this report focuses on donor governments, there are three other major funding streams for FP assistance: multilateral organizations, the private sector, and domestic resources.

Multilateral Organizations: Provide assistance for FP using pooled funds from member contributions and other means. The primary multilateral organization addressing FP is the United Nations Population Fund (UNFPA). Contributions to multilateral organizations are usually made by governments, but can be provided by private organizations and individuals, as in the case of UNFPA. Some multilateral organizations are designed to address specific issues (such as UNFPA, which also finances reproductive health and other population related activities); donor government contributions to UNFPA are highlighted as part of the donor government’s financing effort in this analysis. Donor government contributions to multilateral organizations that are not specifically designed to address population activities, but may include such activities within their broader portfolio (such as the World Bank), are not included in this analysis.

Private Sector: Foundations (charitable and corporate philanthropic organizations), corporations, faith-based organizations, and international non-governmental organizations (NGOs) provide support for FP activities in low- and middle-income countries not only in terms of funding, but through in-kind support; commodity donations; and co-investment strategies with government and other sectors.

Domestic Resources: Including both spending by country governments that also receive international assistance for FP and by households/individuals within these countries, represent a significant and critical part of the response.

This report provides donor government funding for family planning activities in 2013 compared to 2012 levels. It includes an analysis of funding provided by the 26 governments who were members of the OECD DAC in 2013 and had reported ODA totals to the DAC.[endnote 132849-5] Data were collected directly from ten donors, who represent approximately 98% of bilateral family planning funding, and are profiled in this report: Australia, Canada, Denmark, France, Germany, Netherlands, Norway, Sweden, the U.K., and the U.S. Data for the remaining DAC members was obtained from the OECD CRS. For purposes of this analysis, family planning services were defined to include the following activities as specified in the CRS: counseling; information, education and communication (IEC) activities; delivery of contraceptives; capacity building and training.7  Where bilateral family planning funding was included as part of broader reproductive and maternal health activities or other non-health-sector activities, we worked directly with donor governments to identify family planning specific amounts to the extent possible (see Methodology for more information).

Findings

Bilateral Assistance

In 2013, donor governments are estimated to have disbursed[endnote 132849-6] US$1,307.8 million in bilateral funding for family planning activities (see Table & Annex 1), an increase of $211.4 million (19%) above 2012 levels (US$1,096.4 million). This includes both actual funding amounts provided (e.g., cash transfers) as well as other types of transactions and activities (e.g., technical assistance) and products (e.g., commodities).

Table: Donor Government Family Planning Disbursements, 2012-2013 (US$ millions)
Country20122013
Bilateral DisbursementsUNFPA – Core ContributionsBilateral DisbursementsUNFPA – Core Contributions
Australia$43.2$14.9$39.5$15.6
Canada$41.5$17.4$45.6$16.0
Denmark$13.0$44.0$18.8$40.4
France$49.6$0.5$37.2$0.0
Germany$47.6$20.7$38.2$24.0
Netherlands$105.4$49.0$153.7$52.4
Norway$3.3$59.4$20.4$70.6
Sweden$41.2$66.3$50.4$65.8
U.K.$252.8$31.8$305.2$31.5
U.S.$485.0$30.2$585.0$28.9
Other DAC Countries$13.8$98.0$13.8$108.8
Total$1,096.4$432.2$1,307.8$454.0

Most donor governments profiled (7) (Canada, Denmark, Netherlands, Norway, Sweden, U.S., and U.K.) increased bilateral funding in 2013 (after exchange rate fluctuations are taken into account); one donor (Australia) remained essentially flat and two donors (France and Germany) decreased funding for family planning in 2013. Most of the overall increase was due to increases in funding by the U.S., the U.K., and the Netherlands.

The United States (US$585.0 million) was the largest bilateral donor in 2013 accounting for almost half (45%) of total bilateral assistance (see Figure 1). The U.K. (US$305.2 million, 23%) was the second largest bilateral donor followed by the Netherlands (US$153.7 million, 12%), Sweden (US$50.4 million, 4%), and Canada (US$45.6 million, 3%).

Figure 1: International Family Planning Assistance: Donor Governments as a Share of Bilateral Disbursements, 2013

Multilateral Assistance

While the majority of donor government assistance for family planning is provided bilaterally, donors also provide support for family planning activities through multilateral contributions to the United Nations Population Fund (UNFPA) (see Box 2).[endnote 132849-7]

Box 2: United Nations Population Fund (UNFPA) Mission, Goals, & London Summit on Family Planning Commitment

Created in 1969, UNFPA supports sexual and reproductive health activities in many low- and middle-income countries and was a key partner in the London Summit on Family PlanningUNFPA Mission: Deliver a world where every pregnancy is wanted, every birth is safe, every young person’s potential is fulfilled.UNFPA Goals:

  • Achieve universal access to sexual and reproductive health (including family planning)
  • Promoting reproductive rights;
  • Reducing maternal mortality; and
  • Accelerate progress on the ICPD agenda and MDG 5.

UNFPA London Summit on Family Planning Commitment: “UNFPA will double the proportion of its resources focused on family planning from 25% to 40 % based on current funding levels, bringing new funding of at least US $174 million per year from core and noncore funds. This will include a minimum of US $54 million per year, from 2013-2019, in increased funding for family planning from UNFPA’s core resources.”

In 2013, donor governments provided US$454.0 million in core contributions to UNFPA, an increase of US$21.8 million (5%) above 2012 levels (US$432.2 million).[endnote 132849-8] UNFPA uses core contributions to support a variety of activities including family planning, but also in support of maternal and child health, education, human rights, and capacity building efforts.

Norway was the largest donor to UNFPA (US$70.6 million, 16%) and drove most of the increase in 2013. Sweden was the second largest donor (US$65.8 million, 14%) followed by the Netherlands (US$52.4 million, 12%), Denmark (US$40.4 million, 9%), the U.K. (US$31.5 million, 7%), and the U.S. (US$28.9 million, 6%) (see Figure 2).[endnote 132849-9]

Figure 2: International Family Planning Assistance: Donor Governments as a Share of UNFPA Contributions, 2013

While it was not possible to calculate an adjusted “family planning share” of UNFPA’s 2013 budget and therefore to attribute a portion of each donor government’s UNFPA contribution to family planning-specific activities,[endnote 132849-10] it is important to note the relative balance between a donor’s core-contributions to UNFPA and its bilateral funding for family planning. For instance, three of the ten donor governments profiled provided a larger contribution to UNFPA than their bilateral disbursement: Denmark, Norway, & Sweden.

Progress Towards FP2020 Commitments

Eight of the donor governments surveyed directly made multi-year commitments at the FP2020 Summit in 2012 (see Appendix 2). While it is not possible to know what funding amounts would have been provided by donors in the absence of the Summit, data collected for 2012-2013 indicate that if current trends continue, all eight have made progress toward their stated commitments. Future analyses will continue to monitor funding disbursed towards these commitments.

Conclusion

Overall donor government funding for family planning activities increased in 2013, driven primarily by a subset of donors. In addition, preliminary data indicate that donors are making progress toward their FP2020 commitments. Looking ahead, however, it is not yet certain if these trends will continue, or if ongoing fiscal pressures will affect family planning budgets, as they have in some other sectors. It will therefore be important to continue tracking funding for family planning activities to assess progress towards addressing ongoing family planning needs in low- and middle-income countries.

Methodology

Bilateral and multilateral data on donor government assistance for FP in low- and middle-income countries were collected from multiple sources. The research team collected bilateral assistance data directly for 10 governments: Australia, Canada, Denmark, Germany, France, the Netherlands, Norway, Sweden, the United Kingdom, and the United States during the first half of 2013. Data represent the fiscal year 2013 period for all governments. Direct data collection from these donors was desirable because they represent the preponderance of donor government assistance for family planning and the latest official statistics – from the Organisation for Economic Co-operation and Development (OECD) Creditor Reporting System (CRS) (see: http://www.oecd.org/dac/stats/data) – are from 2012 and do not include all forms of international assistance (e.g., funding to countries such as Russia and the Baltic States that are no longer included in the CRS database). In addition, the CRS data may not include certain funding streams provided by donors, such as FP components of mixed-purpose grants to non-governmental organizations.   Where donor governments were members of the European Union (EU), the research team ensured that no double-counting of funds occurred between EU Member State reported amounts and EC reported amounts for international FP assistance. Data for all other OECD DAC member governments – Austria, Belgium, the European Commission, Finland, Greece, Ireland, Italy, Japan, Korea, Luxembourg, New Zealand, Portugal, Spain, and Switzerland – who collectively accounted for less than 2 percent of bilateral family planning disbursements, were obtained from the OECD CRS and are from calendar year 2012.

For purposes of this analysis, funding was counted as family planning if it met the OECD CRS purpose code definition: “Family planning services including counselling; information, education and communication (IEC) activities; delivery of contraceptives; capacity building and training.” In addition, family-planning-related activities funded in the context of other official development assistance sectors (e.g. education, civil society) are reflected in this analysis. Project-level data were reviewed for Canada, Denmark, France, Germany, the Netherlands, Norway, Sweden, and the United Kingdom to determine whether all or a portion of the funding could be counted as family planning. Family-planning-specific funding totals for Australia and the United States were obtained through direct communications with government representatives. Funding attributed to the United Kingdom represents budgeted disbursements. Funding totals presented in this analysis should be considered preliminary estimates based on data provided by representatives of the donor governments who were contacted directly.

It was difficult in some cases to disaggregate bilateral family planning funding from broader reproductive and maternal health totals, as the two are sometimes represented as integrated totals. In addition, family-planning-related activities funded in the context of other official development assistance sectors (e.g. education, civil society) have in the past remained largely unidentified. For purposes of this analysis, we worked closely with the largest donors to family planning to identify such family-planning-specific funding where possible (see Annex 1 for detailed data table).

Bilateral funding is defined as any earmarked (FP-designated) amount. U.S. bilateral “enacted” data, or “commitments”, correspond to amounts appropriated for the 2013 fiscal year. UNFPA contributions from all governments correspond to amounts received during the 2013 calendar year, regardless of which contributor’s fiscal year such disbursements pertain to.

With some exceptions, bilateral assistance data were collected for disbursements. A disbursement is the actual release of funds to, or the purchase of goods or services for, a recipient. Disbursements in any given year may include disbursements of funds committed in prior years and in some cases, not all funds committed during a government fiscal year are disbursed in that year. In addition, a disbursement by a government does not necessarily mean that the funds were provided to a country or other intended end-user. Enacted amounts represent budgetary decisions that funding will be provided, regardless of the time at which actual outlays, or disbursements, occur. In recent years, most governments have converted to cash accounting frameworks, and present budgets for legislative approval accordingly; in such cases, disbursements were used as a proxy for enacted amounts. In the U.S. case, both enacted and disbursement data were available for analysis.

UNFPA core contributions were obtained from United Nations Executive Board documents; however, we were unable to determine what share of these core contributions are attributable to family planning specifically (since such funding is also used to support broader reproductive health and related efforts). To date, UNFPA family planning activities have often been reported as part of broader categories, including reproductive health and maternal and child health, as well as part of larger multisectoral efforts, including those in education, human rights, and capacity building. It is expected that such disaggregation will be available in the future and UNFPA reports that it is currently working to develop such a methodology for doing so. Other than contributions provided by governments to UNFPA, un-earmarked general contributions to United Nations entities, most of which are membership contributions set by treaty or other formal agreement (e.g., the World Bank’s International Development Association or United Nations country membership assessments), are not identified as part of a donor government’s FP assistance even if the multilateral organization in turn directs some of these funds to FP. Rather, these would be considered as FP funding provided by the multilateral organization, as in the case of the World Bank’s efforts, and are not considered for purposes of this report.

The fiscal year period varies by country. The U.S. fiscal year runs from October 1-September 30. The Australian fiscal year runs from July 1-June 30. The fiscal years for Canada and the U.K. are April 1-March 31. Denmark, France, Germany, the Netherlands, Norway, and Sweden use the calendar year. The OECD uses the calendar year, so data collected from the CRS for other donor governments reflect January 1-December 31. Most UN agencies use the calendar year and their budgets are biennial.

All data are expressed in US dollars (USD). Where data were provided by governments in their currencies, they were adjusted by average daily exchange rates to obtain a USD equivalent, based on foreign exchange rate historical data available from the U.S. Federal Reserve (see: http://www.federalreserve.gov/). Data obtained from UNFPA were already adjusted by UNFPA to represent a USD equivalent based on date of receipts.

Appendix

Appendix 1: Donor Government Family Planning Disbursements, 2012-2013

For an enlarged version of the table, access the report PDF.

Appendix 2: Donor Government Progress Towards London Summit Commitments

For an enlarged version of the table, access the report PDF.

Endnotes

  1. Since 2002, the Joint United Nations Programme on HIV/AIDS (UNAIDS) and the Kaiser Family Foundation have been tracking donor government assistance for HIV in low- and middle-income countries by the donor government members of the Organization for Economic Co-operation and Development’s (OECD) Development Assistance Committee (DAC). For the methodological approach used to monitor donor government spending on HIV see: https://modern.kff.org/global-health-policy/report/financing-the-response-to-aids-in-low/. ↩︎
  2. Includes funding from 25 DAC member countries and the European Commission (EC); Poland, Slovenia, and the Slovak Republic became DAC members in 2013, but have yet to report Official Development Assistance (ODA) amounts. ↩︎
  3. Core contributions by donors to UNFPA are used to support a range of projects for family planning, reproductive health, maternal and newborn health, and HIV by UNFPA; data provided here could not be adjusted to represent an estimated family-planning specific share. ↩︎
  4. WHO, Family Planning Fact Sheet, updated May 2013. ↩︎
  5. Guttmacher Institute/UNFPA, Adding It Up: Costs and Benefits of Contraceptive Services Estimates for 2012, June 2012. ↩︎
  6. UNFPA, Financial Resource Flows for Population Activities Report 2011, 2013. ↩︎
  7. OECD, The List of CRS Purpose Codes, 2013. ↩︎
News Release

New Analysis Finds the Affordable Care Act Mentioned in 14% of This Year’s Political Ads

Published: Oct 30, 2014

Republican Ads Were Much More Likely to Mention ACA, Often in Spots that Also Hit Other Issues

About 14 percent of political ads in all races airing this year through October 15 mention the Affordable Care Act, Obamacare or any of the law’s specific provisions, mostly in a negative way, a new Kaiser Family Foundation study finds.

Overall, about a quarter (26%) of political spots airing so far this year mention health care issues, including Medicare, veterans’ health care and women’s health issues.  Nearly half of these political ad spots mentioning health do not mention the ACA or any of its provisions. Republicans include ACA messaging in 84 percent of their political ad spots that cover health issues, compared to 15 percent for Democrats.

Even when it is mentioned in political ads, the ACA is often not the sole focus.  About three quarters (74%) of political ads mention the ACA along with other issues, such as the economy or social issues.

Based on data from Kantar Media’s Campaign Media Analysis Group capturing television advertising in 210 media markets and national advertising across 10 broadcast and more than 80 cable networks, the analysis examined both political ad spots mentioning health care issues as well as health insurance spots promoting specific insurance products or encouraging enrollment.

The study finds that, between Jan. 1 and Oct. 15, more than 1.3 million health insurance and political ad spots that reference health care issues have aired.  This includes 742,988 insurance ads (56% of the total), such as health insurers advertising products as well as government, marketplace and advocacy groups encouraging enrollment, and 592,092 political ads (44%).  During the time period, total spending for airing health insurance ads is estimated to be more than 50 percent higher than the total spent airing political ads ($482 million vs. $303 million).

ACA Advertising in 2014 – Insurance and Political Ads is available online.

ACA Advertising in 2014 – Insurance and Political Ads

Authors: Bianca DiJulio, Mira Norton, Mollyann Brodie, Elizabeth Wilner, and Mitchell West
Published: Oct 30, 2014

ACA Advertising In 2014

Since the passage of the Affordable Care Act (ACA) in 2010, the law has been an often potent and divisive political issue, and has sparked an unprecedented amount of political and campaign advertising, particularly from candidates and groups that oppose the law. According to Kantar Media’s Campaign Media Analysis Group (CMAG), no other federal program or policy has resulted in the kind of advertising the ACA has caused, namely the combination of new insurance “product” advertising and sustained political advertising across multiple election cycles.

This year, Americans saw the launch of the ACA’s insurance market reforms, the implementation of the state and federal exchanges where people can shop for coverage and access subsidies, and the expansion of Medicaid in many states. Alongside these policy changes, new stakeholders began to advertise to encourage participation in the new coverage options, including state and federal governments, non-profit groups looking to boost enrollment, and health insurance companies seeking new customers. The mid-term elections have also brought a new collection of political advertising with ACA messaging. These two distinct types of advertising have different goals and aims; some encourage people to take advantage of new options under the ACA, while others encourage people to vote a certain way. With both of these types of advertising making their way into American living rooms in 2014, this analysis describes the full spectrum of ads that the American public is being exposed to regarding health care, both in the context of health insurance coverage, and as a political issue in the mid-term elections.

The analysis is based on data from Kantar Media’s Campaign Media Analysis Group and includes local television advertising in 210 media markets and national advertising across 10 broadcast and more than 80 cable networks (including Spanish-language networks) from January 1 through October 15, 2014. The data include campaign and political advertising mentioning the ACA as well as all health insurance advertising whether or not it explicitly mentions the law, such as ads from the U.S. Department of Health and Human Services (HHS), health insurance companies, and state exchanges. Unless otherwise noted, the analysis is based on the number of advertising “spots,” meaning each individual airing of an ad, rather than each unique ad. “Spots” reflect the amount of advertising that has aired and thus possibly viewed by the American public. At times, the report refers to “unique” ads, meaning individual ads about a candidate or a specific insurance product that may have aired many times. The report also includes public opinion survey results from Kaiser Health Tracking Polls, which provide insight into what types of ads and media messages people across the country report seeing.

Key Findings

In this unique year of both Congressional midterms and the first open enrollment periods under the Affordable Care Act, insurers, exchanges, HHS, political campaigns and issue groups have taken to the television airwaves to encourage people to enroll in coverage, market health insurance products, and suggest Americans vote certain ways. This report analyzes both health insurance ads and political ads referencing health care, particularly those that refer to the ACA, that aired between January 1 and October 15, and includes the following key findings:

  • During the first 9 and a half months of 2014, over 1.3 million health insurance and political ads that reference health care issues aired, about half of which reference the Affordable Care Act. Many of these ads do not mention the law by name, but rather refer to the law as “Obamacare” or talk about one or more of the law’s specific provisions.
  • Of all political ad spots in 2014 so far, 26 percent specifically mentioned health care issues, including 14 percent that specifically mention the ACA, most of which were negative in their reference to the law.
  • Republicans included ACA messaging in 84 percent of their political ad spots that cover health issues, compared to 15 percent for Democrats.
  • The ACA is rarely mentioned alone in political advertising; 74 percent of ACA political ad spots mention other issues, such as the economy or social issues.
  • Half of health insurance advertising does not mention the ACA, while 34 percent of spots mention the ACA in a neutral way, 15 percent in a positive way and 1 percent in a negative way.
  • Most health insurance ads were sponsored by insurance companies themselves (68 percent), but among health insurance spots that reference the ACA, advertising sponsorship spans insurers (39 percent), HHS (31 percent), and state exchanges (24 percent).

Ads Referencing The Affordable Care Act

There are two types of advertising described in this report that include messaging related to the Affordable Care Act – health insurance ads and political ads.

Health Insurance Ads: Health insurance advertising includes ads from health insurers promoting their products as well as advertising from the U.S. Department of Health and Human Resources, state exchanges, and enrollment advocacy groups encouraging people to get covered. Insurance ads are divided into the following two groups:

  • Insurance Ads That Use The ACA: These ads mention the law by name, cover topics directly related to the law, or refer to a specific provision. Many enrollment and coverage ads from exchanges or enrollment groups do not use the law by name, but are still considered ACA-ads because they refer to coverage available under the law. Within this category there are ads that are positive toward the ACA, those that are negative, and those that remain neutral. Pro-ACA Insurance Ads promote the law overall or champion certain aspects of the law. Anti-ACA Insurance Ads often point out problems people may have had trying to get information or enroll. Neutral ACA Insurance Ads are more tempered in their reference of the law or its provisions, often routing people to where they can find more information.
  • Insurance Ads That Do Not Use The ACA: These ads are primarily sponsored by insurers selling their products with no reference to the law or its provisions.

 Political Ads: Campaign or political advertising includes ads from candidates, political parties, political action committees, or issue groups advertising for upcoming elections. In order to be classified as an ad that used the ACA in its messaging, political ads do not necessarily have to mention the law by name. Many ads reference “Obamacare” or “Obama’s health care plan,” particularly Republican-affiliated ads, while others mention specific provisions of the law, something Democrats have been prone to do in their relatively limited ACA advertising. Anti-ACA Political Ads are decidedly negative toward the law and its effect on the American people or the nation. Pro-ACA Political Ads hold the law in a positive light, often referring to changes in how insurers do business and access to coverage for those with pre-existing conditions.

Aca Advertising In 2014: Key Findings

Big Picture: Health Insurance Spots Slightly Outweigh Political Spots Referencing Health Issues

To date in 2014, over 1.3 million health insurance and political ads that reference health care issues have aired, including those aimed at getting people to sign up for health insurance and those using the ACA as a political tool to engage and influence voters. A majority of these ad spots have been advertising insurance products or encouraging people to enroll in coverage (56 percent), including 28 percent that specifically mention the ACA. The other 44 percent have been political ads that mention health care issues, including 24 percent that specifically mention the ACA (Figure 1). As insurers embraced this unique opportunity to access a new customer base and governments and non-profits engaged in outreach, spending on health insurance advertising is approaching half a billion dollars (about $482 million) and spending on political ads mentioning health care is at about $303 million as of mid-October.

Figure 1

Were TV Viewers Getting Mixed Messages During Open Enrollment?

With the combination of the two open enrollment periods and the mid-term elections in 2014, are Americans getting mixed messages when it comes to TV advertising about the ACA? On one hand, insurers and advocates of the law are appealing to Americans to enroll in coverage, while on the other, politicians are largely using the ACA in a negative light to relate to voters with a mutual dislike of the law or to persuade them to oust incumbents who supported it.

During the second part of the first open enrollment period (January 1 – March 31, 2014), there was a mountain of health insurance advertising spots that specifically mentioned the ACA as well as numerous other insurance ads (Figure 2). Because the open enrollment period came before most primary races began to heat up, there were fewer ACA-political ads during this time, although it is notable there were any this early in the election cycle. About this same time, according to the Kaiser Health Tracking Poll, about 6 in 10 Americans reported seeing an ad that provided information about how to get insurance under the law and about half said they saw an ad for an insurance company promoting health insurance products (see Appendix). Although political ads referencing the ACA were airing much less frequently during this time, about 6 in 10 Americans said they had recently seen ads that were opposed to the law, in support of the law, or were trying to influence their vote for a political candidate based on their stance on the law.1  After April 1st, insurance advertising mostly returned to normal; insurance ads that referred to the ACA dropped off to nearly nothing, while television viewers continued to see more general health insurance advertisements along with an increasing number of campaign ads. Now, as the general election and the next open enrollment period are approaching, there has been an uptick in the amount of spots airing. Insurance ads that do not reference the ACA have recently begun to keep pace with ACA-political ads at least in part due to Medicare’s open enrollment period.

Figure 2
The ACA Advertising and Latinos

As both the mid-term elections and the launch of the second open enrollment approach, Latinos around the country are likely seeing ads from insurers and political campaigns. Targeting potential health insurance enrollees, about one in ten (10 percent) of all health insurance ad spots so far this year were in Spanish. Most of these Spanish language ads were sponsored by insurance companies (58 percent), with fewer sponsored by state exchanges (25 percent) and HHS (6 percent). These ad spots were geographically concentrated in states with large Spanish-speaking Latino populations, with most airing in California (30 percent), Texas (24 percent), Florida (11 percent), New Mexico (8 percent). Although political candidates may be reaching this politically important group in a variety of other ways, so far this year, no Spanish language political television ads mentioning the ACA have been identified.

Political Ads & Health Care

Political advertisements in 2014 include both primary and general mid-term election campaign ads, of which 26 percent specifically mentioned health care issues, including 14 percent that specifically mention the Affordable Care Act (Figure 3).

About Half Of Health Care Political Ad Spots Mention The ACA

As a share of all health care political advertising spots, about half (53 percent) reference the ACA, “Obamacare,” or a specific provision available under the law. Most of these ads are sponsored by Republicans and are negative towards the law (48 percent) while just a few (5 percent) are sponsored by Democrats (Figure 3), including 4 percent that include pro-ACA content and 1 percent with anti-ACA content.

Figure 3

In a recent Kaiser Health Tracking Poll2  voters are more likely to report seeing more ads in opposition to the ACA than in support (23 percent vs. 6 percent), while the majority say they’ve seen an equal share or that they haven’t seen any ads (see Appendix). Kaiser Tracking also finds that similar shares of people identifying as Democrats and Republicans say the health care law is the most important to their vote even though political advertising about the ACA in particular has been dominated by Republicans.

Democrats and Republicans highlight different issues in their healthcare-related advertising. Republicans included ACA messaging in 84 percent of their ad spots that cover health issues, compared to 15 percent for Democrats (Figure 4). Democrats have been steering away from the ACA this election cycle, preferring to talk about other health care issues, including Medicare, health benefits for veterans, women, and undocumented immigrants. Nearly half (46 percent) of Democrat-affiliated health ad spots mention Medicare (Figure 5) with messaging, for example, that includes concern about Republicans restructuring Medicare or requiring seniors to pay more for prescription drugs.

Figure 4

Figure 5: Percent Of Total Political Health Care Spots Mentioning The Following Issue…

TotalDemocratsRepublicans
…Anti-insurance 5% 10% 2%
 …Medicare 26% 46% 16%
 …Anti-ACA 50% 4% 84%
 …Pro-ACA4% 11% 0%
 Note: Each advertising spot may be categorized with more than one of these issues.
Unique Anti-ACA Ads

Since the beginning of the year, there have been 849 unique political ads that reference the ACA. Of these ads, the vast majority of them (746 unique ads) were affiliated with Republican candidates, and all were anti-ACA. Democrats, on the other hand, were not entirely united in their position on the ACA; 22 percent of their 83 unique ads contained anti-ACA messaging while the majority (78 percent) were pro-ACA.

During primary election season, most anti-ACA ads had a positive tone, highlighting a candidate’s consistent record in opposition to the law, or like Arizona Gubernatorial candidate Doug Ducey, promising to “stand up to the Obama Administration”. However, general election campaign ads that mention the ACA had turned mostly negative, like an attack ad in Arkansas’s Senatorial race, which criticizes incumbent Mark Pryor for being “the deciding vote for Obamacare, which will cut Medicare Advantage benefits for our seniors”.

Anti-ACA political ads were sponsored by over 300 different candidates or issue groups with most accounting for less than 1 percent of unique anti-ACA political spots. Notably, however, Americans For Prosperity sponsored 7 percent of unique anti-ACA spots, far higher than any other individual group. Two individual ads stand out for having a total cost of more than $2 million each. Both were attack ads sponsored by the Florida Republican Party against Charlie Crist in the hotly contested race for Florida Governor. The overall cost for each ad is estimated to be over $2.3 million and $2.7 million and together the ads were aired about 9,000 times.

ACA Political Messages Vary

As noted by media outlets and others, the messaging about the ACA within these ads also varies by party. Republican ads are straightforward about their negative view of the law while Democratic ads in support of the law often avoid mentioning it by name and instead often focus on specific provisions put in place under the law. For example, an anti-ACA ad from Florida Republican Party mentions “Obamacare” five times and attests that the law has harmed doctors, patients, and job creation. On the other hand, Democratic ads tend to be much more tempered in their use of the ACA. For example, an ad from House Majority PAC in West Virginia’s race for the third congressional district seat doesn’t mention the law by name, but instead references the provision of the law that prohibits insurance companies from charging women more than men for their health coverage.

Unique Pro-ACA Ads

The vast majority of political advertising about the Affordable Care Act was negative. Of the 849 unique political ads aired to date that reference the ACA, only 65 were messages in support of the law, including 24 primary election ads, 40 general election ads, and one special election ad. Most of these ads were for US House seats (32 unique ads), US Senate seats (21 unique ads) or gubernatorial races (9 unique ads), plus three state congressional races; unsurprisingly, all were sponsored by Democrats.

So far this year, the most-aired and most expensive pro-ACA ad campaigns were for primary election battles. The most-aired pro-ACA ad was an attack ad that aired over 1,200 times in North Carolina by sponsor Patriot Majority USA against Republican senatorial candidate Thom Tillis. Like other “ pro-ACA” ads, the ad did not refer to the ACA directly, but rather talked around it by mentioning certain provisions, including those that protect individuals with pre-existing conditions and lower cost sharing for preventive care services.

Of the 40 pro-ACA ads of the general election, the most expensive pro-ACA ad so far is an ad from Joe Garcia, Democratic incumbent in the hotly contested FL-26 House seat, criticizing his Republican challenger Carlos Curbelo for his opinion on a number of health-related issues, including his position against key ACA provisions. The estimated total cost of the ad is $753,090 and was aired 1,087 times in Florida. An ad from Mark Udall, Colorado’s incumbent Senator, also ranked among the most expensive, costing an estimated $621,780 total and airing 1,043 times.

These two ads cost a substantial amount more than any other pro-ACA general election ad, with the runner-up Planned Parenthood Votes spending an estimated $371,800 on an ad against the North Carolina Senate candidate Thom Tillis that aired 434 times.

ACA Political Ads Over Time

At each point during this election year, Republican political ad spots mentioning the ACA far outnumbered Democratic spots. There were several bumps in the amount of Republican spots using the ACA during primary season and the number of ad spots is now peaking as the general election approaches (Figure 6). Democratic political spots with ACA messaging have also ebbed and flowed over the course of the year, but remain far below the level of ACA advertising sponsored by Republicans.

Figure 6

For ACA Political Ad Spots, The Law Is One Of Many Issues Mentioned

About three-quarters of ACA political ad spots mention the ACA along with at least one other political issue, such as the economy or government spending (Figure 7). A fifth (21 percent) of ACA political ads focus exclusively on the ACA and don’t mention any other issue while another 5 percent mention the ACA along with other health issues, such as prescription drugs, Medicare, or objections to insurance company practices. Both Democrats and Republicans are mostly talking about the ACA along with other issues, rather than airing ads focused on the ACA exclusively.

Figure 7

The other issues mentioned in these ACA ads largely follow somewhat typical partisan rhetoric with Democrats being more likely to pair the ACA with social issues and government assistance while Republicans are more likely to raise the issue along with messages of government intrusion and fiscal irresponsibility. Along with the ACA (or Obamacare, as it is often referred to in these ads) about four in ten (41 percent) Republican ad spots also mentioned the federal budget or government spending, followed by the economy and jobs (27 percent) and taxes (22 percent) (Figure 8). About a third of Democratic ACA spots (35 percent) include messaging about social issues, such as abortion, gay rights, and women’s rights. The next most commonly referenced issues in Democratic ACA ads are the budget (28 percent) and the economy and jobs (17 percent).

Figure 8

Competitive Senate Races

So far this year, a third of ACA political ad spots have been for competitive Senate races, defined as those races designated by the Cook Political Report as “Toss Up” or “Lean” races (Figure 9).3  In the general election ad campaign, over 4 in 10 ACA political ad spots (44 percent) have been for competitive Senate races, whereas primary election spots were more scattered across a variety of races. The people living in these competitive states are more likely to say they’ve seen campaign ads related to the ACA than others, including more ads with anti-ACA messaging (see Appendix).

Figure 9

Overall Health Insurance Advertising Landscape

In addition to the political ads mentioning the ACA, health insurers, state and federal governments, and non-profit organizations are advertising about health insurance in order to encourage people to enroll and buy health insurance coverage. Half of all health insurance ad spots did not mention the ACA at all (50 percent) (Figure 10). Another 34 percent of health insurance ad spots mention the ACA in a neutral way, while 15 percent are positive toward the law and just 1 percent are negative towards it. Ads that are positive about the law point out specific ways people may benefit, for example, access to quality coverage, getting financial assistance and ease in shopping and comparing plans. Health insurance ads that are negative toward the law refer to people having trouble using the government website, or refer to the rising cost of medical care. Neutral ACA health insurance ads often allude to the ACA’s effect on the changing health insurance landscape and offer to be a source of information on healthcare reform, or refer to an element of the law, such as a state exchange, open enrollment, or financial assistance.

Most (71 percent) insurance company ads did not mention the ACA, while almost all ads from the US Department of Health and Human Services (HHS) and state exchanges did refer to the law. HHS ads tended to be more positive toward the law, with six in ten ad spots containing pro-ACA messages (Figure 10). State exchanges, on the other hand, were almost entirely neutral on the topic; just 10 percent of state exchange ad spots had a pro-ACA message.

Figure 10
Unique Health Insurance Ads

Out of the total 1,900 unique insurance ads, about six in 10 did not mention the ACA at all. Those that did mention the ACA specifically were mostly neutral (621 unique ads), with a few that were pro-ACA (123 unique ads), and only a handful that were anti-ACA (11 unique ads). Insurance ads that mentioned the ACA aired an average of 487 times and had an average total cost of about $195,000. Many ads, including those aired across several states, had significant overall costs. Five unique ads that mentioned the ACA had an estimated overall cost of more than $3 million each for total airtime between January 1st and October 15th. Three of these ads were sponsored by insurance companies – two from Humana and one from Anthem Blue Cross/Blue Shield – and two were sponsored by HHS. Humana spent far more on a single unique ad than any other health insurance advertiser, with an estimated total cost of over $45 million. The ad was aired 4,475 times across 146 local media markets as well as a national television and cable networks. One of the HHS ads promoting healthcare.gov featured Magic Johnson and is estimated to have cost nearly $4 million for 3,094 airings.

Among health insurance ads, most (68 percent) ad spots were sponsored by insurance companies themselves, 15 percent were sponsored by HHS, and state exchanges made up 12 percent of total ad spot sponsorship (Figure 11). Looking only at health insurance advertising that refers to the ACA, sponsorship spans across health insurance companies (39 percent), HHS (31 percent) and state exchanges (24 percent). Advertising from state exchanges was concentrated in three states – California, Illinois and New Mexico – accounting for three-quarters of what exchanges aired.

Figure 11

The primary message included in health insurance advertising changed over the first three months of the year. As the end of open enrollment neared, the number of health insurance ads focusing on price and accessibility increased (Figure 12). Health insurance ads focusing on the cost of coverage tracked with ads focusing on quality during the first month and a half of the year, but in early March, ads focusing on price spiked. The attention to the cost of coverage in the advertising reflects the barrier affordability can play in expanding coverage. For example, in Kaiser’s January Health Tracking Poll nearly half (45 percent) of the uninsured said that the main reason they didn’t have insurance was because they felt it was too expensive. 4 


Figure 12

Conclusion

This analysis of political advertising referencing the ACA and health insurance ads promoting enrollment in new coverage options or advertising specific insurance products shows that, over the course of the year, American TV viewers have been exposed to a variety of messages related to the ACA. These messages may often be conflicting with most of the political ads portraying the ACA in a negative way while insurance ads, even if they are not referencing the ACA directly, are promoting health insurance more generally, something that the law made available to more people. This balance of advertising may be playing out differently across the country due to the presence of competitive elections and the variations in how the ACA is being implemented in various states.

This analysis also shows that the ACA has become a standard reference in partisan discourse – routinely being weaved into the fabric of any partisan’s list of issues used to distinguish one party from another. Relatively few spots aired that exclusively talk about the ACA as a standalone issue, rather the vast majority of the political advertising referencing the ACA includes mentions of other issues, including the federal budget, the economy and jobs, and social issues.

With the midterm election next week and the next open enrollment period beginning just 11 days after that, Americans are surely seeing more health insurance and political advertising that references the ACA. As of October 15, there has been a recent uptick in both political ad spots referring to the ACA as campaigns make their final pitch to voters, and an increasing number of health insurance ad spots that are most often tied to the Medicare open enrollment period. Health insurance spots using the ACA in their content have yet to increase substantially, but will likely do so as the November 15 start date for open enrollment approaches.

The Kaiser Health Tracking Poll periodically measures the visibility of health insurance advertising and political advertising related to the ACA among the general public. Most recently, about 6 in 10 say they had seen an ad opposed to the law, in support of the law, or that tried to influence their vote for a particular candidate due to their position on the law. Substantial shares also say they have seen ads from insurance companies (44 percent) or ads that provided information about how to get coverage under the law (33 percent). These levels have remained substantial over the course of 2014, but are higher than reported advertising visibility in early 2013 (Figure A-1).5 In the last tracking poll prior to the midterm elections, a larger share of those who report seeing political advertising related to the law say they have seen more advertising opposed to the law than in support of it, particularly those in states with competitive Senate races (Figure A-2).

Figure A-1
Figure A-2


Endnotes

  1. Kaiser Health Tracking Poll (conducted February 11-17, 2014). Available at https://modern.kff.org/health-reform/poll-finding/kaiser-health-tracking-poll-february-2014/ Kaiser Health Tracking Poll (conducted March 11-17, 2014). Available at https://modern.kff.org/health-reform/poll-finding/kaiser-health-tracking-poll-march-2014/ ↩︎
  2. Kaiser Health Tracking Poll (conducted October 8-14, 2014). Available at https://modern.kff.org/health-reform/poll-finding/kaiser-health-tracking-poll-october-2014/ ↩︎
  3. As of October 17, 2014, “toss up” states were AK, AR, CO, IA, LA, NC, NH, GA, KS, KY and states leaning Democratic or Republican were MI and SD (see http://cookpolitical.com/senate/charts/race-ratings). ↩︎
  4. Kaiser Health Tracking Poll (conducted January 14-21, 2014). Available at https://modern.kff.org/health-reform/poll-finding/kaiser-health-tracking-poll-january-2014/ ↩︎
  5. Kaiser Health Tracking Poll (conducted October 8-14, 2014). Available at https://modern.kff.org/health-reform/poll-finding/kaiser-health-tracking-poll-october-2014/ ↩︎

Ad From National Republican Senatorial Committee (NRSC) in IA Senator Race

Published: Oct 29, 2014