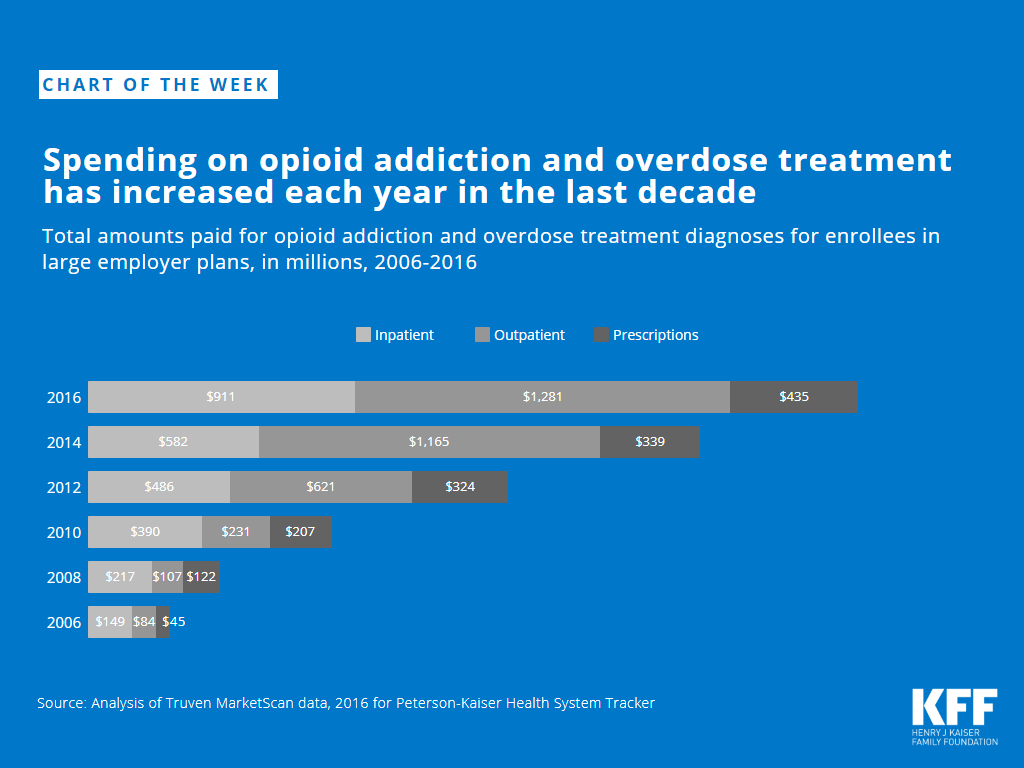
Spending on opioid addiction and overdose treatment has increased each year in the last decade
Source
Analysis of Truven MarketScan data, 2016 for Peterson-Kaiser Health System Tracker
The independent source for health policy research, polling, and news.
Analysis of Truven MarketScan data, 2016 for Peterson-Kaiser Health System Tracker
Among the 1.9 million nonelderly adults with opioid addiction, those with Medicaid were twice as likely as those with private insurance or no insurance to have received treatment in 2016, according to a new analysis by the Kaiser Family Foundation.
The role of Medicaid in combating the opioid epidemic has received renewed attention lately as the Trump Administration has declared addressing the epidemic a key priority and states have sought additional federal help. Forty-three percent of nonelderly adults with opioid addiction who were covered by Medicaid received inpatient and/or outpatient opioid addiction treatment services in 2016, compared with 21 percent of those with private insurance and 23 percent of those who were uninsured, based on analysis of data from the National Survey on Drug Use and Health.
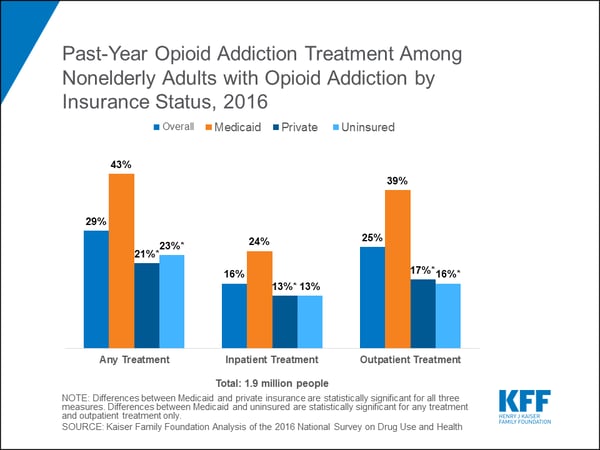
Of the 1.9 million nonelderly adults with an opioid addiction in 2016, Medicaid covered nearly 4 in 10 (38%), in part through Medicaid expansion in 33 states. It provides access to a range of treatment services, including medication-assisted treatment, which combines medication with counseling and other support services. Opioid addiction treatment can be delivered in an inpatient or outpatient setting and can be provided in numerous types of facilities, including hospitals, drug or alcohol rehabilitation facilities, mental health centers, or private doctors’ offices.
This issue brief provides Medicaid highlights from governors’ proposed budgets for state fiscal year (FY) 2019 (July 1, 2018 through June 30, 2019 in most states).1 Proposed budgets reflect the priorities of the governor and are often blueprints for the legislature to consider. In total, we reviewed 39 proposed state budgets2 and text from 46 state of the state speeches.3 This review revealed that while state revenue collections improved in 2017 compared to 2016, considerable economic and regional variation persists, many states are facing significant budget challenges unrelated to Medicaid such as unfunded pension liabilities or falling oil prices, and the outlook for 2018 remains uncertain due, in part, to the impacts of the 2017 Federal Tax Reform Act.
Key health findings include:
Medicaid now provides health insurance coverage to one in five Americans, and accounts for nearly one-sixth of all U.S. health care expenditures.6 Medicaid is jointly financed by the states and the federal government. In FY 2016, Medicaid accounted for 28.7 percent of total state spending (including state and federal funding) for all items in the state budget, but 15.6 percent of state general and other fund spending, a far second to state spending on K-12 education (25.3%).7 Medicaid is the largest single source of federal funds for states, accounting for more than half (56.8%) of all federally supported spending by states in FY 2016, according to data from the National Association of State Budget Officers.8
Since 2014, increases in Medicaid as a share of overall state budgets have been driven, to a large extent, by coverage expansions resulting from the Affordable Care Act (ACA), especially for the 32 states (including DC) that have thus far implemented of the ACA Medicaid expansion for adults up to 138 percent of the Federalhan their legislaturesPoverty Level (FPL).9 While the federal government initially funded the entire cost of the ACA Medicaid expansion, expansion states began to pay 5 percent of the cost in calendar year (CY) 2017, halfway through FY 2017 in most expansion states. Expansion states will pay 6 percent of the cost throughout CY 2018 and 7 percent in CY 2019. Thus, expansion state budgets for FY 2019 will reflect a blended, enhanced federal match rate (known as the federal medical assistance percentage, or “FMAP”) for expansion populations falling between 93 percent and 94 percent, well above traditional FMAP rates in every state.
In many states, relatively weak state revenue growth complicated the process of building and adopting a budget for FY 2018 (July 2017-June 2018 in most states): a number of states called special sessions in 2017 to complete their FY 2018 budgets and 11 states started FY 2018 without a fully enacted budget.10 As governors in a majority of states prepared state budget proposals for FY 2019, many benefited from improved revenue collections that made the budget building process easier. Nevertheless, a number of states continue to face budget challenges due to structural deficits or revenue shortfalls, and many face continued uncertainty regarding the implications of the recent federal Tax Cuts and Jobs Act of 201711 (the “2017 Federal Tax Reform Act”) for state budgets. Also, while efforts to restructure Medicaid through the legislation to repeal and replace the ACA failed in 2017, some Republican leaders may again consider proposals to cut and restructure federal Medicaid financing.
As of the 2018 legislative session, 33 governors are from the same party as their legislatures (25 Republican and 8 Democratic states) and 16 governors are from different parties than their legislatures.12 ,13 In total, 33 states will enact a new budget for FY 2019 including three states (Kentucky, Virginia, and Wyoming) that will pass a two-year budget covering both FY 2019 and FY 2020. In addition, governors in six states have proposed revised or supplemental budgets for FY 2019. We reviewed 39 proposed state budgets (including proposed supplemental changes to the 2019 budgets for Arkansas, Connecticut, Hawaii, Minnesota, Nebraska, and Washington).
This report provides Medicaid highlights from governors’ proposed budgets for state fiscal year (FY) 2019, which runs from July 1, 2018 through June 30, 2019 in most states.14 The analysis is based on a review of state budget documents, the text of state of the state addresses, news reports, and other relevant documents. Links to proposed budget documents can be found in Appendix Table 2. In total, 33 states will enact a new budget for FY 2019 including three states (Kentucky, Virginia, and Wyoming) that will pass a two-year budget covering both FY 2019 and FY 2020. In addition, governors in six states have proposed revised or supplemental budgets for FY 2019. We reviewed 39 proposed state budgets (including proposed supplemental changes to the 2019 budgets for Arkansas, Connecticut, Hawaii, Minnesota, Nebraska, and Washington) and text from 46 state of the state speeches.15 Generally, proposed budgets were released late in 2017 and early in 2018. Also, the District of Columbia had not released a proposed budget for FY 2019 at the time of this analysis (DC’s budget year does not begin until October 1, 2018).
This analysis is not comprehensive but is designed to capture major new proposals and changes included in the proposed budgets (also see Appendix Table 1 for health-related proposal counts in key areas by state). The level of detail presented in governors’ proposed budget documents varies significantly and in most cases does not capture all of the activity in a given state. Governors’ budgets commonly include both funding for state initiatives that are already in place or approved by the state legislature as well as proposals for new policies or initiatives that have not yet been adopted. Proposed budgets are often very different than what is ultimately approved by the state legislature. In addition, some proposed budgets include proposals that would also need to be approved by the Centers for Medicare and Medicaid Services (CMS) before a state could implement the policy. In the summer of 2018, the Kaiser Program on Medicaid and the Uninsured with Health Management Associates will conduct a more comprehensive review of Medicaid changes that were adopted in state budgets for FY 2019. As in previous years, this annual 50-state Medicaid budget survey report should be available in the fall.
While state revenue collections improved in 2017 compared to 2016, considerable regional variation persisted and the outlook for 2018 remains uncertain due to the impacts of the 2017 Federal Tax Reform Act. Overall, states experienced stronger revenue growth through the first three quarters of CY 2017 compared to CY 2016, although significant regional variation persisted. While preliminary estimates for 2017 fourth quarter collections show stronger growth, this improvement could be temporary resulting at least in part to some high-income taxpayers prepaying their state taxes to take advantage of their full deductibility before the 2017 Federal Tax Reform Act takes effect for CY 2018. The outlook for 2018 collections also remains uncertain due to the impact of this law.16
A few states are also dealing with significant budget gaps or structural imbalances, while others reported an improved outlook. Examples include the following:
Although at least eight governors are proposing broad-based state budget cuts for FY 2019, a number of governors reported on improving economic conditions leading to improved state budget outlooks. In Nebraska, the Governor is proposing across the board reductions of 4 percent for FY 2019, and in Tennessee, recurring, base budget reductions throughout state government average 1.3 percent. In Wyoming, nearly every agency has experienced a significant budget reduction since the 2016 legislative session resulting in a proposed standard budget that is $400 million less than the standard budget adopted for the 2009-2010 biennium. In contrast, Arizona’s governor noted that the state had come a long way – “from a billion dollar shortfall three years ago, to a discussion today over where to spend the additional dollars.”21 Indiana’s governor also highlighted the state’s balanced budget, a state savings account balance of nearly $2 billion, and a positive business climate.22 New Mexico’s Governor announced that the state had emerged from fiscal and economic adversity and was now projecting a state surplus,23 and Rhode Island’s governor indicated that the state was stronger than it had been in decades with declining unemployment and a state budget deficit that had been cut in half.24
Proposed budgets prioritize K-12 education funding and workforce training. Education accounts for the largest share of state General Fund budgets and was the most common focus area of governors’ state of the state addresses. This year, a majority of governors also used their addresses to propose new or expanded workforce training initiatives to increase the pool of qualified workers and spur economic growth; over one-third of the governors proposed a wide variety of new or expanded infrastructure initiatives (including transportation projects and broadband internet expansions to rural areas); and many governors also offered proposals to streamline or otherwise improve state government services, operations, and governance, including proposals to reduce unnecessary regulations, promote early voting or voting by mail, impose term limits, address ethics issues related to lobbying, and improve the state budgeting process.25
An equal number of governors proposed tax cuts and tax increases. Proposed budgets in at least 14 states included a variety of modest tax cut proposals (although three of these states, Minnesota, New Jersey, and Rhode Island, also proposed increases in other areas). Three states (Arizona, South Carolina, and Vermont) would establish or increase a tax exemption for military pensions, and six states would make other personal income tax reductions or reforms (Illinois, Iowa, Idaho, Minnesota, New Jersey, and Wisconsin).26 Governors in 14 states proposed a wide variety of tax increases.27 ,28 States with governors proposing significant increases include Alaska (urging a limited, broad-based payroll tax), Connecticut (proposing higher gas taxes, highway tolling, and repeal of previously approved personal income tax exclusions and other tax credits), New Jersey (recommending a “millionaire’s” tax, a fee on carried interest, corporate tax reforms that close loopholes, and restoration of the state sales tax to 7%), Oklahoma (tax increases proposed for tobacco, oil and gas production, motor fuel, wind production, and various individual income reforms), and Louisiana (where the governor urged reinstatement of approximately $1 billion in temporary taxes set to expire at the end of FY 2018).29
Only a few governors addressed the impact of the recently passed 2017 Federal Tax Reform Act in proposed budgets or state of the state speeches. According to the National Association of State Budget Officers, changes in federal taxable income, adjusted gross income, exemptions and deductions under the 2017 Federal Tax Reform Act will impact state taxable income – and therefore, state revenues – depending on how a state’s tax laws conform to the federal tax code. For example, the six states that use federal taxable income as a starting point for their state taxable income calculations, as well as the 30 states that use federal adjusted gross income or federal gross income as a starting point for their state taxable income calculations, may see rises in state taxable income under the new law.30 The governor in New York proposed a multi-part response to the new tax law including challenging constitutionality of the law, exploring a plan to restructure the current income and payroll tax system, and creating new opportunities for charitable contributions to support public programs. Governors in Connecticut, Maine and Minnesota proposed changes to “decouple” the state’s tax laws from the federal law to prevent mute revenue losses or gains. In contrast, Idaho’s governor proposed $94.7 million in tax relief that includes returning revenue generated from conforming to tax changes at the federal level.
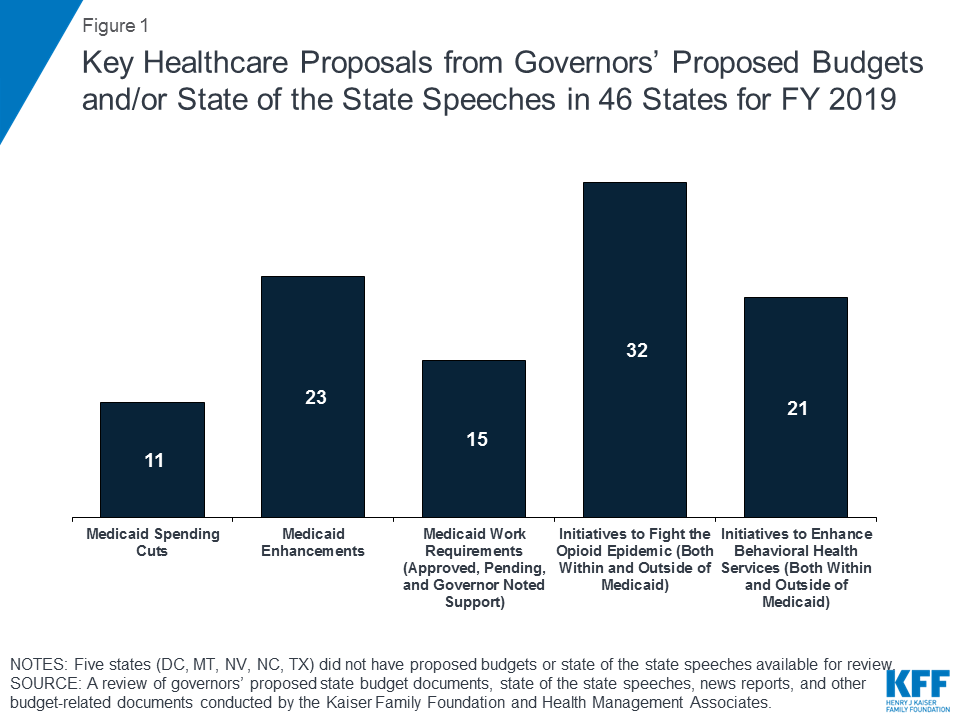
The most recent data reported by the Centers for Disease Control and Prevention indicate that drug overdose deaths and opioid-involved deaths continue to increase in the United States.31 Responding to this ongoing crisis, at least 32 governors are proposing new or enhanced Medicaid and non-Medicaid efforts to combat the opioid epidemic. The most common type of initiative, proposed by governors in 21 states, was expanding treatment, prevention and recovery services and supports (Table 1). For example, Delaware is proposing funding for infants born with a substance addiction, Iowa is proposing to enhance substance use disorder (SUD) treatment, particularly medication assisted treatment (MAT) for opioid use disorder, and on March 1, New Hampshire will launch Recovery Friendly Workplaces to help businesses address addiction in the workplace.
Proposals in nine states would expand education and outreach including: tribal engagement efforts (North Dakota and Washington); a public awareness campaign targeted at teenagers (Wyoming), and a home visiting program for families affected by opioid use disorder (Pennsylvania). Governors in eight states are proposing initiatives to enhance Prescription Drug Monitoring Programs (PDMPs) including imposing new requirements for physicians to check PDMP systems before prescribing (Indiana), integrating electronic medical records systems with the PDMP (Washington), and implementing a new PDMP (Missouri). Proposals in six states include public safety or law enforcement initiatives such as increased efforts to target traffickers (Alaska), providing highway patrol officers with handheld narcotic analyzers (Florida), and expanded access to accredited specialty drugs courts (Pennsylvania).
Four states are proposing improvements in data collection including overdose reporting, three states are proposing to increase access to naloxone (an opioid overdose antidote) to first responders or others, and two states propose to improve reimbursement for SUD services. Proposals in 11 states included a number of other approaches including increasing the number of treatment professionals (Vermont and Wisconsin), helping those at-risk or in recovery with workforce training or transitioning to work (New Jersey and Vermont), initiatives to reduce opioid prescribing (Iowa) and dispensing (Utah), general calls for action to the legislature (Arizona, and Colorado) or to implement task force recommendations (Mississippi), expanding Opioid Operational Command Center staff (Maryland), funding for supportive housing (New Jersey and Virginia), and adding staff to enforce existing state law that prohibits pharmacies from dispensing controlled substances for cash to Medicaid enrollees (Minnesota). Finally, while not advocating new or expanded initiatives, governors in at least four states (Arkansas, Michigan, Ohio and Oregon) addressed the opioid epidemic challenge in their state of the state addresses.
| Table 1: Governors’ Proposals to Fight the Opioid Epidemic | ||
| Approach | No. of States | States |
| Expanded treatment, prevention and recovery services and supports | 21 | DE, GA, IA, IL, IN, KS, KY, MA, MD, MN, MO, NH, NJ, NY, PA, RI, SC, TN, VA, WA, WI |
| Education, outreach and/or public awareness initiatives | 9 | FL, HI, MA, ND, NY, PA, SC, WA, WY |
| Prescription Drug Monitoring Program initiative | 8 | FL, GA, IA, IL, IN, MN, MO, WA |
| Public safety or law enforcement initiative | 6 | AK, FL, IN, MA, PA, TN |
| Improvements to data collection and reporting | 4 | IL, IN, NJ, WA |
| Increasing access to naloxone | 3 | FL, MO, WA |
| Rate increase for SUD providers | 2 | ID, WA |
| Other | 11 | AZ, CO, IA, MD, MN, MS, NJ, UT, VA, VT, WI |
In addition to the significant number of proposals to implement or expand initiatives to tackle the opioid epidemic described above, proposals in over one-third of the states (at least 21 states) would enhance or improve the delivery of behavioral health (BH) services, continuing a trend in recent years driven in large part by ACA coverage expansions. Examples are included in Table 2, below.
| Table 2: Examples of Proposed Initiatives to Enhance Behavioral Health Services | |
| Colorado | Funding expansion for court ordered referrals for competency evaluations and restorations |
| Florida | Expanded funding for community-based BH services |
| Idaho | Adding three regional BH crisis centers and increasing funding for youth suicide prevention |
| Iowa | Proposal to: train new doctors on how to identify and treat a patient with a mental health (MH) challenge; remove cap on sub-acute MH beds, and initiate a planning process for funding MH crisis centers |
| Maryland | Expanded funding for court-ordered BH and proposal to expand in-state residential capacity for children’s BH services |
| Minnesota | Proposals to provide mental health services for farmers facing financial and emotional stress in today’s agricultural economy and to expand school-linked mental health grants |
| New Hampshire | Health and Human Services agency charges with developing a comprehensive 10 year plan for the mental health system to address the state’s mental health crisis |
| Rhode Island | Proposal to require health insurance companies to cover addiction and MH treatment to the same extent as coverage for chronic conditions |
| Virginia | Proposed Budget would increase funding to: complete implementation of same day access to screening and assessment services at all 40 Community Service Boards and expand supportive housing for persons with serious mental illness |
Many states have Medicaid waivers under development at the state level or pending at the Centers for Medicare and Medicaid Services; that information may or may not be captured in governors’ state budget proposals and this brief on governors’ proposed budgets. For more comprehensive information on approved and pending Section 1115 Medicaid waivers, see the KFF Section 1115 Waiver Tracker.
Proposed budgets for twice as many states (23 states) include Medicaid enhancements compared to states with proposed reductions (11 governors; proposals to add work requirements to Medicaid are not included in this count but are counted separately in a later section). Louisiana was notable, however, in the size and scope of its proposed reductions. Due to the expiration of over $1 billion in temporary taxes in July 2018, the Governor’s proposed budget includes deep and broad cuts to optional benefits, eligibility, and provider reimbursement totaling $2.3 billion in state and federal funds – cuts the Governor hopes to avoid by reinstatement or replacement of the expiring revenues. Also, the proposed budget in one state (Missouri) referred to Medicaid cost containment initiatives but did not provide detail on what those initiatives are. Other proposed Medicaid program enhancements and reductions are described below.
For the 23 states proposing Medicaid enhancements, the most frequently proposed type of enhancement was increasing LTSS provided in a community setting, continuing a long-term trend to rebalance services away from institutional care towards care in home and community-based settings. Sixteen states proposed enhancements, most often to expand home and community-based services (HCBS) to persons with intellectual and developmental disabilities (I/DD) but also HCBS expansions for seniors and persons with disabilities (Table 3). For example, the governor of Maine is proposing to eliminate the waiting list for the state’s I/DD HCBS waiver program and Wisconsin’s governor is proposing to end the waiting list for the HCBS waiver for children needing LTSS.32
| Table 3: Governors Proposing Actions to Expand Community-Based LTSS | |
| Expand home and community-based services (HCBS) for persons with intellectual and developmental disabilities (IDD) | FL, GA, ME, MD, MO, NJ, PA, TN, VA, WA |
| Expand the number of seniors and persons with disabilities receiving HCBS | CA, FL, MO, WI, WY |
| Additional funding for Money Follows the Person initiatives | CO, CT |
| Expand Assisted Living | NY |
In contrast, only four governors proposed LTSS-related reductions: Colorado proposed to increase trust recoveries; New York would require legally responsible spouses/relatives to support the cost of caring for an institutionalized family member receiving Medicaid; Rhode Island proposed to tighten LTSS eligibility by eliminating retroactive coverage and closing resource test loopholes; and Louisiana proposed more severe LTSS reductions as part of an attempt to spur legislative action on expiring temporary taxes. The proposed reductions in Louisiana include elimination of several programs and services such as Special Income Rule eligibility that expands LTSS income eligibility to 300 percent of the Supplemental Security Income (SSI) income eligibility limit, the Long-Term Personal Care Services program, and the Children’s Choice HCBS waiver and Supports Waiver.33
The second most common type of enhancement (14 states) was a provider rate increase. As shown in Table 4, three states proposed broad based increases across most provider types while 11 states proposed more targeted increases. The most common increase proposed (5 states) was a wage increase for long-term services and supports (LTSS) direct care workers. In contrast, only five states proposed provider rate cuts or freezes with hospital payments the most frequent target for cuts (4 states).
| Table 4: Governors Proposing Selected Provider Rate Changes | ||
| Provider payment increases | Provider payment freezes/cuts | |
| Across the board rate changes for most providers | CO, MD, SD | IL |
| Hospital payment changes | GA, KS | CT, LA, RI, VT |
| Nursing facility payment changes | GA, KS | LA, RI |
| Wage changes or overtime for home care workers or nursing home staff | CA, CT, MD, MN, VA | |
| Physician payments | MD, MO | CT |
| Managed care organization rate changes | LA, UT | RI |
| Other | NY (emergency transportation)SC (autism services) | LA (HCBS support coordination rate) |
Only a small number or states proposed non-LTSS benefit, premium, or cost-sharing restrictions (5 states) or non-LTSS benefit enhancements (4 states). Given that Medicaid serves low-income populations, copayments and premiums in the program are generally limited. States may charge premiums for enrollees with incomes above 150 percent FPL.34 States also may charge cost sharing, but allowable charges vary by income.35 Except for Louisiana, proposed benefit, premium, or cost-sharing restrictions were narrowly targeted:
Proposed benefit enhancements included:
The Trump administration’s willingness to allow states to use Section 1115 waiver authority to require Medicaid beneficiaries to work as a condition of eligibility37 has led a number of governors to request or consider requesting this authority. Medicaid work requirement proposals generally would require beneficiaries to verify their participation in approved activities, such as employment, job search, or job training programs, for a certain number of hours per week in order to receive health coverage. The proposals typically would also exempt certain populations, such as the aged and disabled, students, and caregivers.38 As of March 2018, 15 states either have work requirement waivers approved or pending at CMS, or have governors that have noted support for pursuing a work requirement waiver either in their proposed budgets, state of the state speeches, or other public statements (Table 5). States pursuing Medicaid work requirements include both states that have and have not expanded Medicaid under the ACA, however, no non-expansion states have received approval from CMS for work requirement waivers as of the date of this publication.
| Table 5: Governors Proposing to Impose Medicaid Work Requirements | |
| States with approved waivers | AR, IN, KY |
| States with pending waivers | AZ, KS, ME, MS, NH, UT, WI |
| Other states where governors have proposed a work requirement | AL, OH, OK, SC, SD |
| NOTES: The Louisiana governor expressed some support for the concept of a Medicaid work requirement in early 2018, but this was not included in his proposed budget or state of the state address. The version of a bill passed by the state House on March 2 that originally included a Medicaid work requirement was altered before passage to promote (but not condition Medicaid eligibility on) work. The Virginia governor’s proposed budget includes a “clean” ACA Medicaid expansion without a work requirement, but the governor has expressed some openness to adding a work requirement if necessary as a compromise in order to adopt expansion (as proposed in the budget plan passed by the VA House of Delegates in late February 2018. | |
Managed care has become the predominant delivery system for Medicaid in most states, as Medicaid programs have increasingly turned to managed care as a means to help ensure access, improve quality, and achieve budget certainty. In recent years, a growing number of states are focusing on integration of physical health, behavioral health, and LTSS under the umbrella of managed care. States are also adopting other payment and delivery reforms including patient-centered medical homes, health homes accountable care organizations among others.
At least five states are proposing new or expanded delivery system or managed care reforms. Two of these states propose to continue and/or expand ongoing initiatives:
Four states are proposing new initiatives:
All state budget proposals must necessarily account for the ongoing funding needed to administer the Medicaid program, including staffing needs and the cost to maintain and upgrade claims, eligibility, and other information systems. A number of budget proposals, for example, included funding to implement Electronic Visit Verification systems that are now required under federal law (as a result of the 21st Century Cures Act, Pub. L. 114-255). Listed below are a few other examples of the wide array of initiatives in proposed budgets to improve or enhance the administration of the Medicaid program:
In 2017, efforts to pass legislation to repeal and replace or reform the ACA fell short in Congress, leading a few governors to propose or urge action at the state level to expand or stabilize health insurance coverage in their states. A few states proposed Medicaid expansions. For example, the governor’s proposed budget in Virginia includes adoption of the ACA Medicaid expansion, and the expansion question has stalled budget negotiations and prompted the governor to call a special session in April to resolve differences between the Senate- and House-passed budget proposals and come to final agreement (the House’s plan includes expansion while the Senate’s plan does not). In addition, the Utah governor encouraged the exploration of a “financially prudent” Medicaid expansion39 and the Idaho governor proposed that the state apply for a Section 1115 waiver to allow Medicaid to cover individuals with specifically diagnosed medical conditions who were originally covered on the individual insurance marketplace. In Maine, however, the governor’s state of the state Address challenged the legislature to find a way to pay for the ACA Medicaid expansion (approved in a November 2017 voter referendum) that does not include new taxes or one-time funding sources, and that does not reduce funding for nursing facilities or for services for persons with disabilities. He also indicated that before implementing the ACA Medicaid expansion, the state must first eliminate HCBS waiting list for persons with I/DD.
Governors in seven states proposed action impacting non-Medicaid coverage, including a proposal to pass a state-level individual mandate in Connecticut, a proposal to seek Section 1332 waiver approval to offer premium subsidies to people below poverty (in addition to the Section 1115 proposal described above) in Idaho, a proposal to allow Minnesotans the option to purchase their health insurance through the MinnesotaCare state health care program, a proposal to pass a state law guaranteeing coverage of pre-existing conditions in Wisconsin, a proposal to pass legislation giving farmers, small business owners and their workers affordable insurance in Iowa, and various proposals around health insurance market and rate stabilization in Maryland and Washington.
State of the state addresses and proposed state budgets also included other health-related proposals, a few of which are described in Table 6 below.
| Table 6: Examples of Other Non-Medicaid Health-Related Initiatives | |
| Women’s Health | Connecticut: Governor urged passage of a law that would ensure cost-free birth control regardless of actions at the federal levelMassachusetts: Governor pledged to preserve women’s access to reproductive health careMinnesota: Governor proposed legislation to guarantee women’s access to contraception by requiring health insurers to provide coverage for all FDA-approved methodsNebraska: Proposed to end Title X funding for clinics that perform abortionsNew York: Governor proposes to codify Roe v. Wade, protect access to contraception, and create a board to review maternal deathsNew Jersey: Proposed budget reflects recent restoration of funding for women’s health care centers and expanded access to family planning servicesSouth Carolina: Governor directed state agencies last August to stop providing funds to abortion clinicsVirginia: Governor proposed repeal of limitations on a woman’s right to make her own health care choices and proposed expanding access to long-acting reversible contraceptivesWashington: Proposed ensuring full access to contraception including long-acting reversible contraception and reproductive parity |
| Children’s Health | Indiana: Governor proposed steps to reduce infant mortalityNew York: Measures proposed to reduce the risk of exposure to lead paint |
| Pharmacy Proposals | Delaware: Proposed $2 million for prescription assistance for seniorsMassachusetts: Proposal for innovative drug transparency measures |
| Homelessness | Hawaii: Funding proposed for homeless outreach and counseling services for chronically homeless persons with a severe SUDNew Jersey: New funding proposed for veterans’ housing and support services (and also for grants geared to veterans’ access to health care) |
| Long-Term Services and Supports | Hawaii: Funding proposed for programs to support caregiversMinnesota: Increased funding proposed for the Long-Term Care Ombudsman and for the Office of Inspector General to enhance protections for seniors and vulnerable adultsOregon: Governor proposed to work to better align training and requirements for entry-level jobs in health care, in-home care, and community-based health to ensure that there is a ladder to a career for people gaining skills in caregiving |
| Provider Supply | Alabama: Loan repayment program proposed for physician assistants and dentists who agree to work in underserved areasIdaho: Medical education expansion proposedNew York: Would codify the Certified Registered Nurse Anesthetists scope of practice to allow practice at full extent of education and training |
| Other | New Jersey: Proposal to legalize and tax marijuana and to expand access to medical marijuana; proposal to establish the Center on Gun Violence Research to provide public health-related researchRhode Island: Propose to expand Medical Marijuana to persons with acute painWisconsin: Proposed enacting a state law to guarantee coverage of pre-existing conditions. |
As state policymakers in most states work on adopting a state budget for FY 2019, many are benefiting from improved state economic conditions and increased state revenue collections that have made the budget development process easier. A number of states are still struggling, however, with revenue shortfalls and structural deficits and many also face uncertainty regarding the future state revenue impacts of the 2017 Federal Tax Reform Act. Some governors have also expressed concerns that federal tariffs recently imposed on steel and aluminum could spark retaliatory actions by foreign governments that could hurt their state economies.
Uncertainty also remains for many states regarding the ongoing viability and affordability of individual health insurance coverage through the federally subsidized Marketplaces. While Congressional efforts in 2017 to repeal and replace the ACA and restructure Medicaid financing fell short, concerns remain that premiums could spike in the future due to recent federal policy changes that repealed the individual mandate (through the 2017 Federal Tax Reform Act), expanded the availability of association health plans, and eliminated the cost-sharing reduction payments for Marketplace health plans. Rising private sector health premiums could reverse much of the progress made in recent years to reduce the number of uninsured with ramifications for current state efforts to fight the opioid epidemic, enhance behavioral health services, and increase health quality outcomes through delivery system reforms.
At the same time, a number of states are moving forward, with the encouragement of CMS, on efforts to reshape the Medicaid through federal waivers, including proposals in at least 15 states to impose work requirements on Medicaid enrollees. States also continue to press ahead with efforts to rebalance LTSS services away from institutional settings and towards care in home and community-based settings and to address other non-Medicaid health issues of particular importance to their citizens such as assuring access to women’s health services, improving birth and early childhood health outcomes, addressing provider supply issues, and expanding access to medical marijuana.
| Appendix Table 1: Key Policy Proposals in Governors’ Proposed Budgets for FY 2019 | ||||||||||
| States | Medicaid Spending Cuts | Medicaid Spending Enhancements | Medicaid Work Requirements | Governor Proposed Initiatives to Fight the Opioid Epidemic (Within or Outside of Medicaid) | Governor Proposed Initiatives to Enhance Behavioral Health Services (Within or Outside of Medicaid) | |||||
| Alabama | X – Gov. Proposed | X | ||||||||
| Alaska | X | |||||||||
| Arizona | X – Pending | X | ||||||||
| Arkansas | X – Approved | |||||||||
| California | X | X | ||||||||
| Colorado | X | X | X | X | ||||||
| Connecticut | X | X | ||||||||
| Delaware | X | |||||||||
| DC^ | ||||||||||
| Florida | X | X | X | |||||||
| Georgia | X | X | X | |||||||
| Hawaii | X | X | ||||||||
| Idaho | X | X | X | |||||||
| Illinois | X | X | ||||||||
| Indiana* | X – Approved | X | ||||||||
| Iowa | X | X | X | |||||||
| Kansas** | X | X – Pending | X | X | ||||||
| Kentucky | X – Approved | X | ||||||||
| Louisiana | X | ◊ | ||||||||
| Maine* | X | X – Pending | ||||||||
| Maryland | X | X | X | |||||||
| Massachusetts | X | X | ||||||||
| Michigan | ||||||||||
| Minnesota | X | X | X | |||||||
| Mississippi | X | X – Pending | X | X | ||||||
| Missouri | X | X | X | X | ||||||
| Montana* | ||||||||||
| Nebraska | ||||||||||
| Nevada* | ||||||||||
| New Hampshire* | X – Pending | X | X | |||||||
| New Jersey** | X | X | ||||||||
| New Mexico | ||||||||||
| New York | X | X | X | X | ||||||
| North Carolina* | ||||||||||
| North Dakota* | X | |||||||||
| Ohio* | X – Gov. Proposed | |||||||||
| Oklahoma | X – Gov. Proposed | |||||||||
| Oregon* | ||||||||||
| Pennsylvania | X | X | ||||||||
| Rhode Island | X | X | X | |||||||
| South Carolina | X | X – Gov. Proposed | X | X | ||||||
| South Dakota | X | X – Gov. Proposed | ||||||||
| Tennessee | X | X | ||||||||
| Texas*** | ||||||||||
| Utah | X | X – Pending | X | X | ||||||
| Vermont | X | X | X | |||||||
| Virginia** | X | ◊ | X | X | ||||||
| Washington | X | X | X | |||||||
| West Virginia | X | |||||||||
| Wisconsin* | X | X – Pending | X | |||||||
| Wyoming | X | X | ||||||||
| Totals | 11 | 23 | 15 | 32 | 21 | |||||
| NOTES: The level of detail presented in governors’ proposed budget documents varies significantly and in most cases does not capture all of the activity in a given state. Medicaid work requirements column include states with approved Section 1115 work requirement waivers, states with work requirement waiver applications pending at CMS, and states where governors proposed seeking a work requirement waiver in their proposed budget, state-of-the-state speech, or other public statements. ◊The Louisiana governor expressed some support for the concept of a Medicaid work requirement in early 2018, but this was not included in his proposed budget or state of the state address. The version of a bill passed by the state House on March 2 that originally included a Medicaid work requirement was altered before passage to promote (but not condition Medicaid eligibility on) work. ◊The Virginia governor’s proposed budget includes a “clean” ACA Medicaid expansion without a work requirement, but the governor has expressed some openness to adding a work requirement if necessary as a compromise in order to adopt expansion (as proposed in the budget plan passed by the VA House of Delegates in late February 2018). ^The District of Columbia had not released a proposed budget for FY 2019 at the time of this analysis (DC’s budget year does not begin until October 1, 2018). *Governors in 11 states (including Texas) with 2-year budgets in place covering FY 2019 did not propose supplemental budgets for FY 2019. **In three states, legislative addresses by incoming governors were reviewed rather than the State of the State (SOS) addresses of outgoing governors. ***Texas had no SOS address in 2018 and the Governor did not propose a supplemental budget for the FY 2019 budget already in place. SOURCE: Kaiser Family Foundation and Health Management Associates analysis of governors’ proposed budgets for FY 2019, April 2018. | ||||||||||
A new Washington Post/Kaiser Family Foundation survey explores activism in today’s America, providing a detailed look at how the public engages in political and social causes, and the issues that are motivating them.
Among the most extensive studies of political rallygoers and protesters in more than a decade, the survey finds that one in five adults across the country say they have participated in political rallies or protests since the beginning of 2016; about half of that group say they attended an event to support or oppose President Trump or his Administration’s policies.
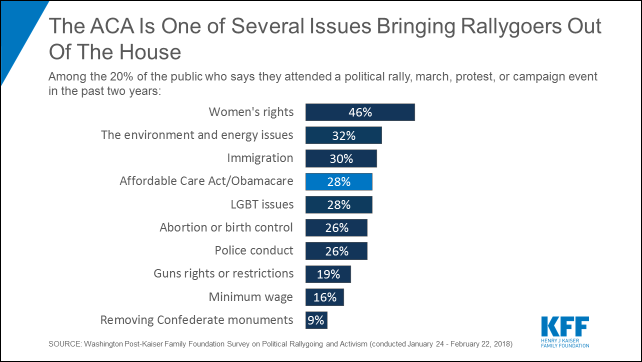
The Affordable Care Act is one of the most common causes bringing people out of their homes. About three in 10 (28%) rallygoers say they’ve gone to a rally or protest to express their views about the health reform law in the past two years, similar to the share who say the same about the environment and energy issues (32%) and immigration (30%), but behind events to support women’s rights (46%).
The survey also assesses the overall public’s views about contemporary activism, first amendment rights, and the 2018 midterm elections, as well as their confidence and trust in societal and political institutions.
This survey is the 32nd in a series of surveys dating back to 1995 that have been conducted as a part of The Washington Post/Kaiser Family Foundation Survey Project. All surveys in the series are designed and analyzed jointly by survey researchers at Kaiser and The Washington Post. Full survey results are available at kff.org. The Washington Post’s journalism drawing on the survey findings, including charts and video, is available at washingtonpost.com.
This partnership survey from The Washington Post and the Kaiser Family Foundation examines the public’s involvement in protests, rallies, marches, demonstrations, or campaign events with a focus on causes or issues that motivate the rallygoers to take action. The survey, one of the most extensive studies of political rallygoers and protesters in more than a decade, examines views of present-day activism, the public’s confidence and trust in societal and political institutions, and takes a prospective look at preference for and involvement in the 2018 midterm elections. This survey also assesses the public’s views on the limits of first amendment rights, as well as their views looking back on the political and social movements 50 years ago.
This survey is the 32nd in a series of surveys dating back to 1995 that have been conducted as a part of The Washington Post/Kaiser Family Foundation Survey Project.
Read The Washington Post’s reporting:
About half of Americans support single-payer health care
In hindsight, Americans are more critical of demonstrators today than protesters 50 years ago
Poll: 53 percent of Americans say it’s ‘never appropriate’ to kneel during the national anthem
The 2016 presidential campaign season and the first year of Donald Trump’s presidency brought increased attention to political activism with media images of large campaign rallies and protests and marches across the country. In order to understand the public’s views of activism and gauge how widespread this activity was, the Washington Post and the Kaiser Family Foundation conducted a representative survey of adults in the United States. The survey explored the public’s attitudes of protests and rallies, particularly in light of 2018 being 50 years after 1968 – a year fraught with protests over the Vietnam War and assassinations – and included a special focus on those who say they have attended a protest or rally in the past two years, exploring what’s driving them off the couch and out of the house. The Washington Post’s articles featuring the survey data can be found here. In addition, some of the key findings are summarized below.
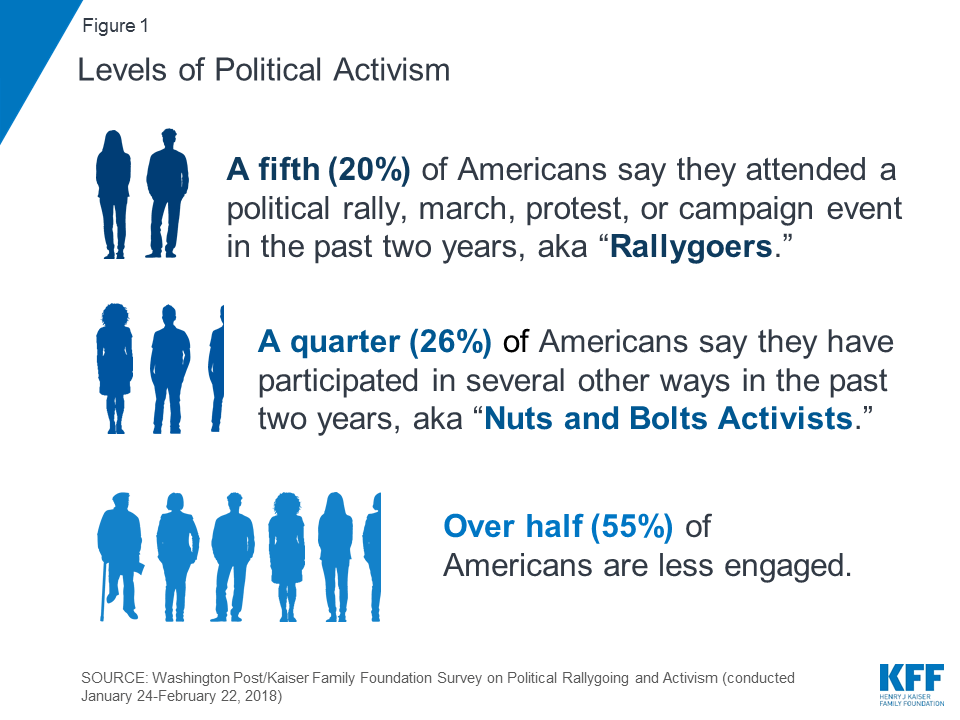
Overall, a fifth of the public say they have attended a political rally, speech, or campaign event or an organized protest, march, or demonstration since 2016, referred to here as rallygoers. Others have participated in different types of activism, including 26 percent – referred to here as “nuts and bolts activists” – who say that in the past two years they have worked or volunteered for a political party, candidate, or campaign, or a group that tries to influence government policy on issues they care about, or that they have done at least three of the following other types of activism: contacted an elected official, donated money, signed petitions, boycotted, or wore clothing about an issue or candidate they care about. Over half of the public (55 percent) are less engaged, either because they report participating only in one or two political activities in the past two years (26 percent) or because they’re not active in any of these specific ways (29 percent).
Looking more specifically at the types of political activities the public may have engaged in during the past two years, similar shares of rallygoers and nuts and bolts activists say they have signed petitions, contacted elected officials, and bought or boycotted a product or service. Those who are less engaged are less likely to have done each of these activities.
| Table 1: Types of Political Activities | |||
| Percent who say they participated in the following activities in the past two years: | Political rally-goers (20%) | Nuts and bolts activists (26%)* | Less Engaged (55%)* |
| Types of activities | |||
| Attended rally, speech, campaign event | 84% | 0% | 0% |
| Attended protest, march, demonstration | 60 | 0 | 0 |
| Signed petition | 81 | 82 | 24 |
| Contacted elected official | 75 | 73 | 12 |
| Poster/bumper sticker/clothing/button | 70 | 56 | 10 |
| Bought or boycotted product or service | 68 | 69 | 18 |
| Contributed money | 62 | 54 | 5 |
| Worked or volunteered for party/campaign | 38 | 13 | 0 |
| Worked or volunteered for group trying to influence government policy | 37 | 25 | 0 |
| *By definition, nuts and bolts activists and the less engaged have not attended a rally, speech, campaign event or protest, march or demonstration, and the less engaged have not worked or volunteered for a party or campaign or group | |||
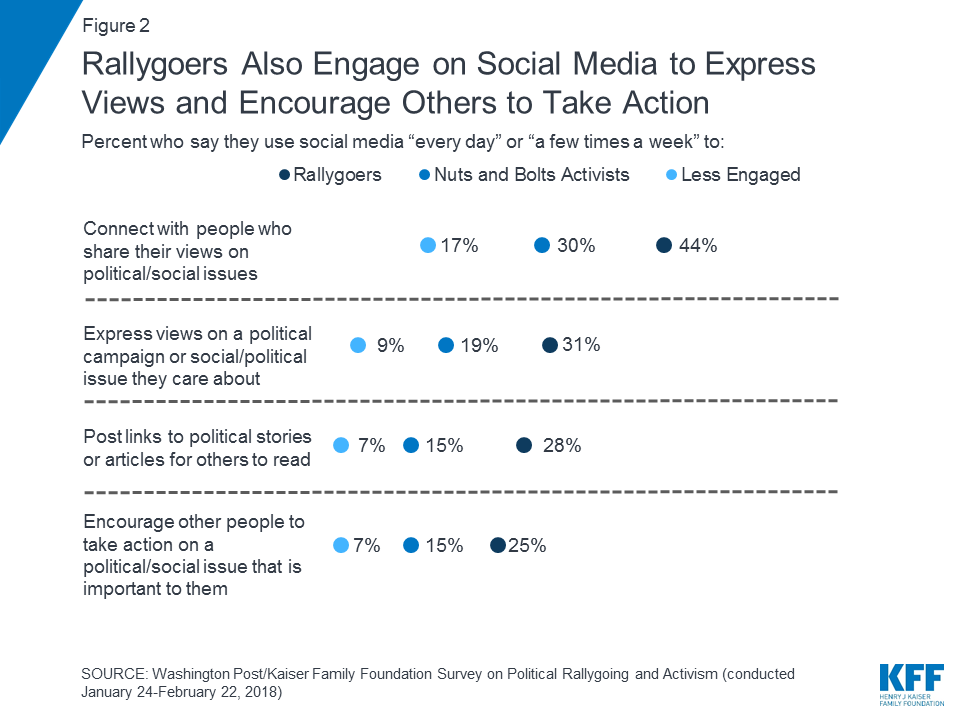
Social media is another way that the public engages in politics and policy. Rallygoers are more likely than nuts and bolts activists to say they are using social media at least a few times a week to connect with people who share their views on political or social issues, express their views on political campaigns or social issues, and post links to political stories or articles for other to read. To a lesser extent, nuts and bolts activists also report engaging in these activities, but still more than those who are less engaged.
Generally, people getting out of the house and those active in other ways are disproportionately more educated and report higher incomes than those who are less engaged. Rallygoers are slightly younger than nuts and bolts activists, but the share of younger adults is similar to those who are less engaged. There are no differences across rallygoers, nuts and bolts activists and the less engaged in the share who are male or female.

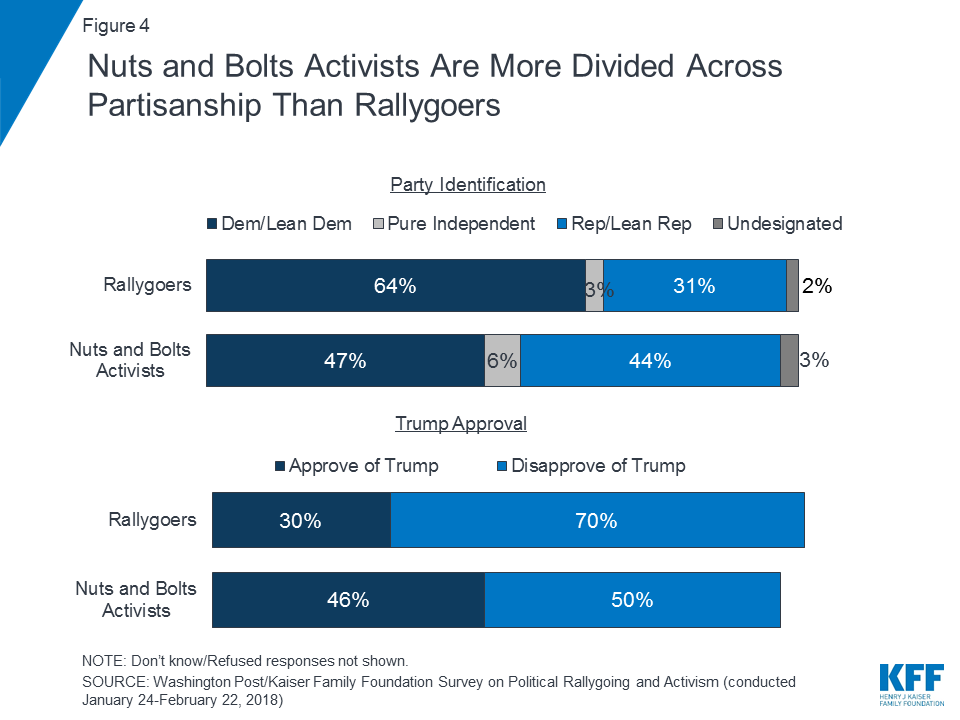
Rallygoers are much more likely to be Democratic and disapprove of President Trump than nuts and bolts activists. Overall, 64 percent of rallygoers identify as Democrats (40 percent) or lean Democratic (24 percent) and 70 percent disapprove of President Trump. Still, some rallygoers are Republican (20 percent) or lean Republican (11 percent) and approve of President Trump (30 percent). The nuts and bolts activists are a more politically divided group, with similar shares identifying as Democrats or Republicans and split in their views of President Trump.
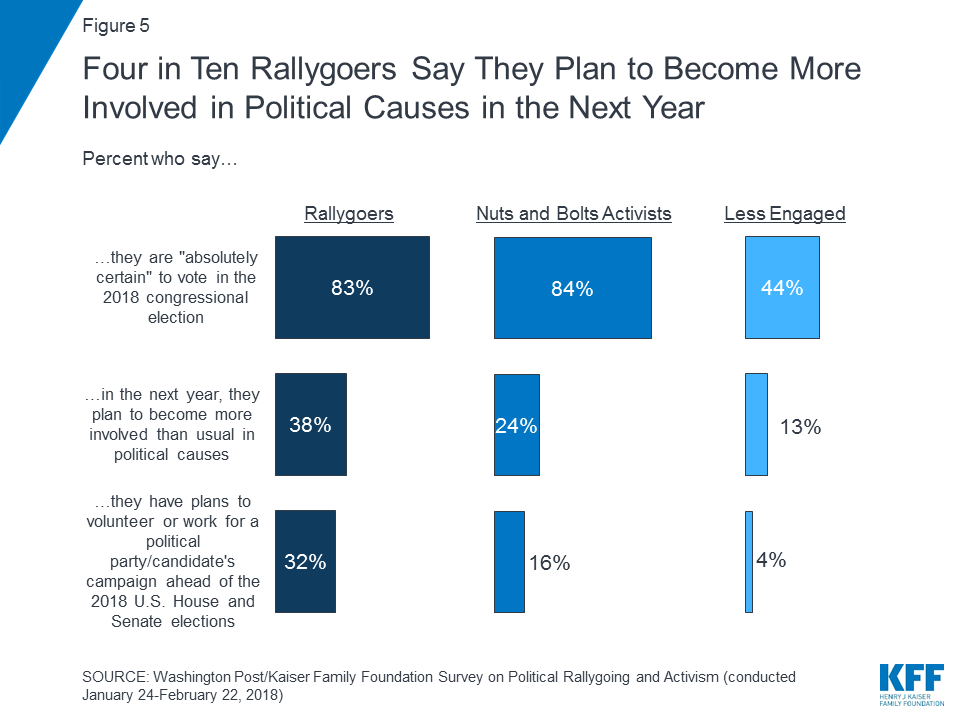
In terms of how this political activism will play into the 2018 midterm elections, similar shares of rallygoers (83 percent) and nuts and bolts activists (84 percent) say they are “absolutely certain” they will vote in the 2018 congressional election, while less than half of those less engaged (44 percent) say the same. But, rallygoers are more likely to say that they plan to become more involved in political causes or work or volunteer for a political campaign or candidate this year. For example, a third of rallygoers (32 percent) intend to volunteer or work for a political party or campaign ahead of the 2018 election – two times the share of nuts and bolts activists (16 percent).
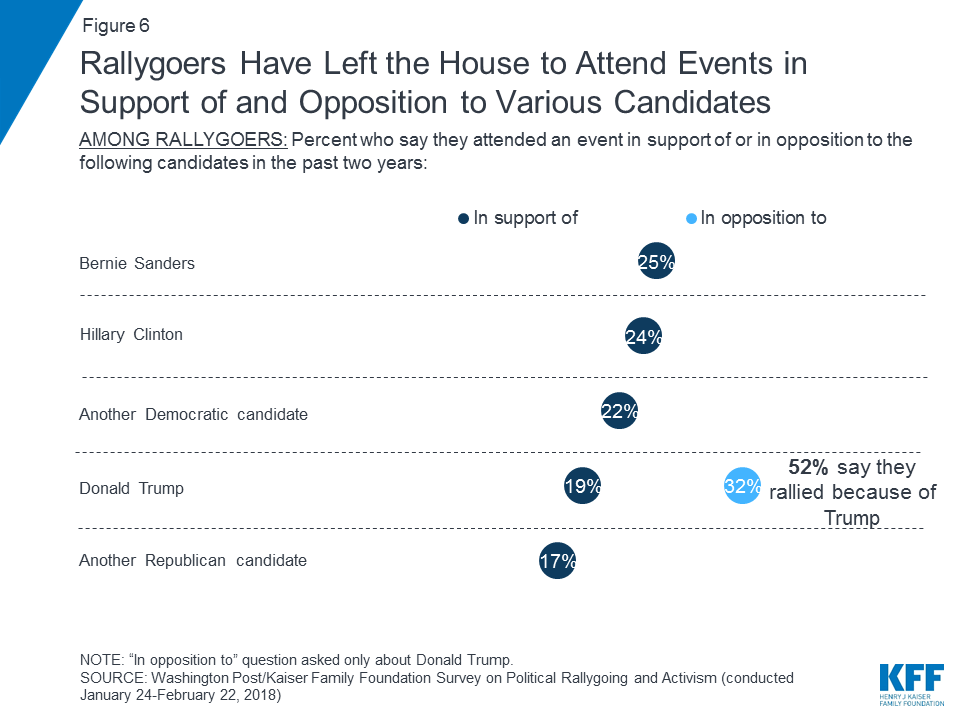
President Trump was a key motivator for many rallygoers. About half of rallygoers (52 percent), or 10 percent of the public overall, say they attended a rally or protest in support of Donald Trump (19 percent) or in opposition to him (32 percent).
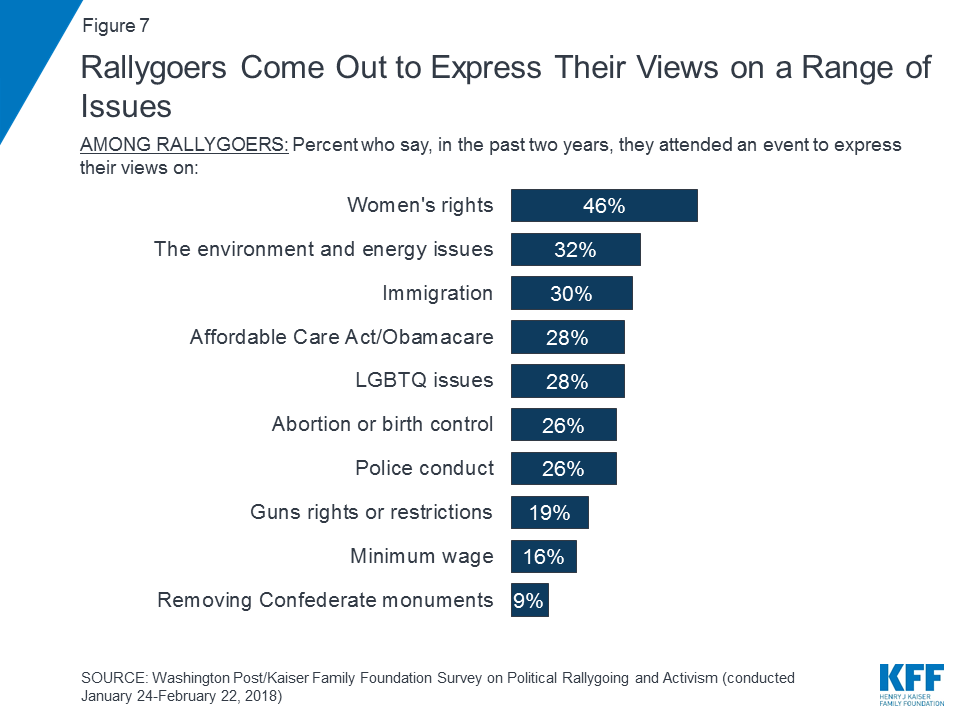
Another key motivator were social and political issues. For example, 46 percent of rallygoers say they came out to express their views in support of women’s rights. In addition, roughly 3 in 10 say issues like the environment or energy (32 percent), immigration (30 percent), the Affordable Care Act (28 percent), or LGBTQ issues (28 percent) brought them out to express their views. It’s important to note, the survey was conducted in January and February, before the marches on gun violence after the Parkland, Florida high school shooting and protests and rallies about increased U.S. border enforcement measures.
Overwhelmingly people came out on the liberal side of the issues asked about. More than half only came out on the liberal side of these issues or for liberal candidates, while about 2 in 10 only came out on the conservative side. In addition, rallygoers are not driven by just one issue: 95 percent of rallygoers report attending an event to express their views on at least two issues or campaigns.
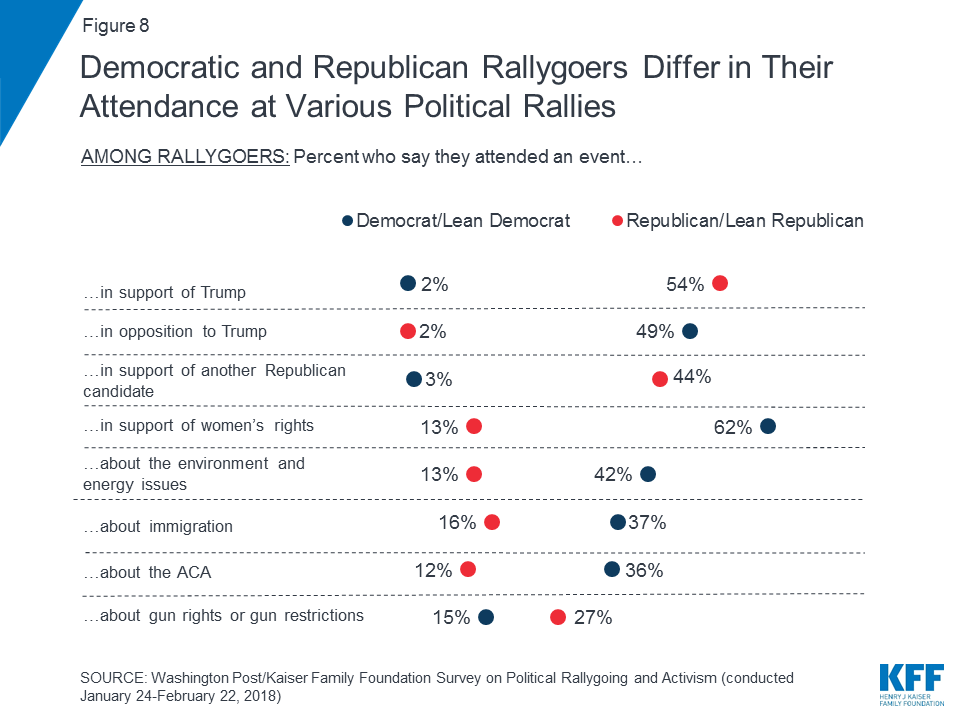
Not surprisingly, there are differences in the types of issues that are motivating rallygoers on opposite ends of the political spectrum. Republicans and Republican leaners turned out to support Trump (54 percent), while Democrats and Democratic leaners showed up to oppose him (49 percent). Republicans and Republican leaners were also motivated by other Republican candidates (44 percent). Democrats were more likely to show up for issues such as women’s rights, the environment, immigration, and the ACA, but Republicans and independents who lean Republican are more likely than Democrats or those that lean Democratic to have attended an event about gun issues in the past two years (27 percent vs. 15 percent).
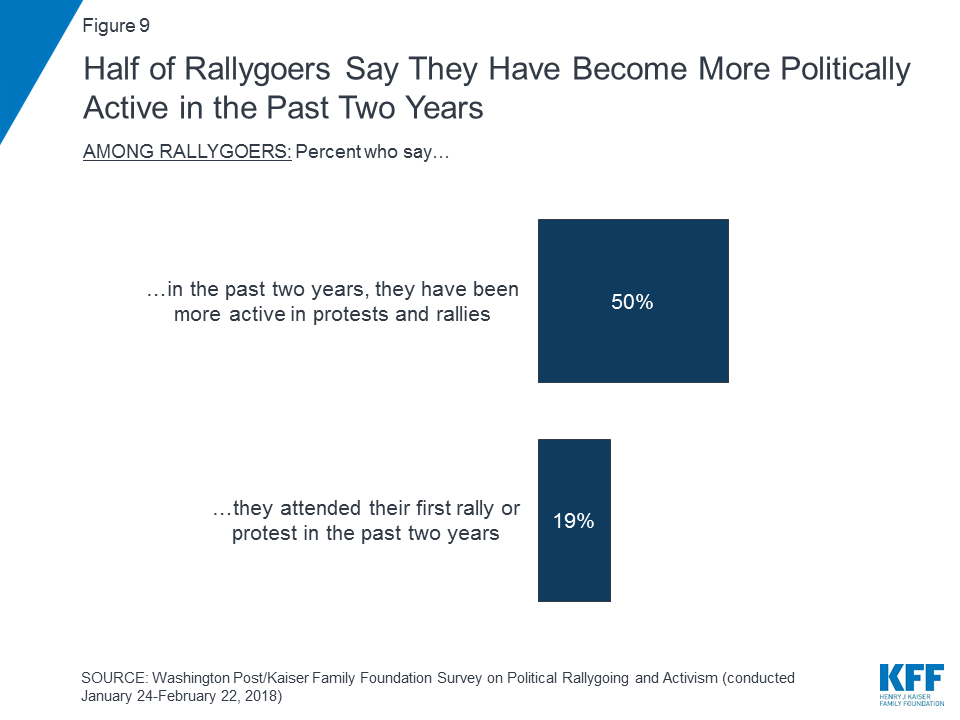
Half of all rallygoers say they have become more active in attending events in the past two years, compared with 17 percent who say they have become less active and 33 percent who say they have been just as active. Rallygoers who say they are more active recently are much more likely than others to say they went to an event opposing Trump in the past two years (47 percent vs. 18 percent). For 19 percent of rallygoers, their first protest or rally was in the past two years, reflecting an increase in activity during and after the 2016 election.
As noted above, the Affordable Care Act (ACA) was one of several issues bringing rallygoers out, with 28 percent of rallygoers saying they attended an event to express their views on the ACA, most of whom (24 percent) say they were expressing views in support of the law. Democratic rallygoers are more likely to say they came out about the ACA than Republican rallygoers (39 percent vs. 10 percent). Rallygoers turning out about the ACA are more likely than those turning out for other causes to identify as Democrats, be 50 or older, and are somewhat more likely to have higher incomes.
| Table 2: Demographic Characteristics of Rallygoers that Attended a Rally or Event to Express Views on The ACA | ||
| Among Rallygoers | ||
| Attended rally or event to express views on the ACA | Attended rally or event to express views on other issues | |
| Party | ||
| Democrat | 56% | 33% |
| Independent | 33 | 37 |
| Republican | 7 | 25 |
| Age | ||
| 18-29 | 15 | 28 |
| 30-49 | 31 | 33 |
| 50-64 | 33 | 22 |
| 65+ | 22 | 17 |
| Income | ||
| <$50,000 | 32 | 37 |
| $50,000- <$75,000 | 14 | 17 |
| $75,000 or more | 52 | 42 |
Those coming out to express their views on the ACA are a particularly motivated group of rallygoers.1 They are much more likely than rallygoers who came out to express their views on other topics to say they will be active in the midterms. For example, 54 percent say they plan to become more involved than usual in political causes in the next year and 53 percent say they plan to volunteer or work for a political party or a candidate’s campaign ahead of the 2018 midterm election.

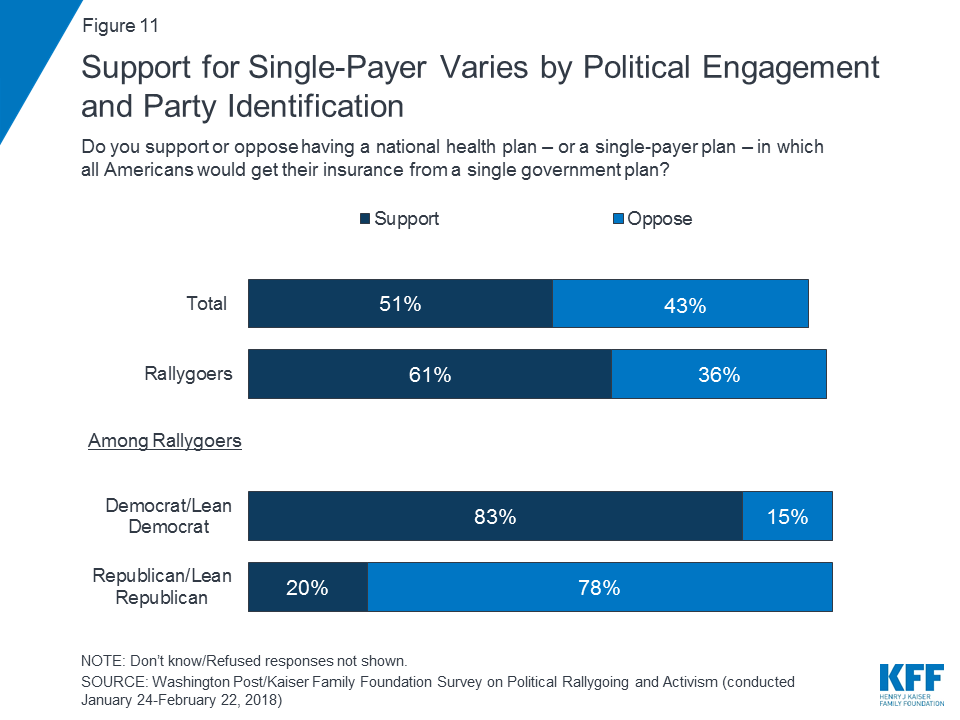
Much of the activism around health in 2016 and 2017 focused on the ACA due to the debate about the future of the law throughout the 2016 election and the 2017 debate about repealing and replacing the law. However, now in the lead-up to the 2018 midterms, there has been more discussion in Democratic campaigns of a single-payer plan, in which all Americans would get their health insurance from a single government plan. Overall, about half of the public supports a single-payer plan, whereas 43 percent oppose it. More rallygoers are supportive of single-payer, due in part to their Democratic leanings, as 83 percent of Democratic or Democratic leaning rallygoers support a single-payer plan. While the public is open to the idea of single-payer, other Kaiser polling has shown that views can change once supporters are presented with counter arguments.2
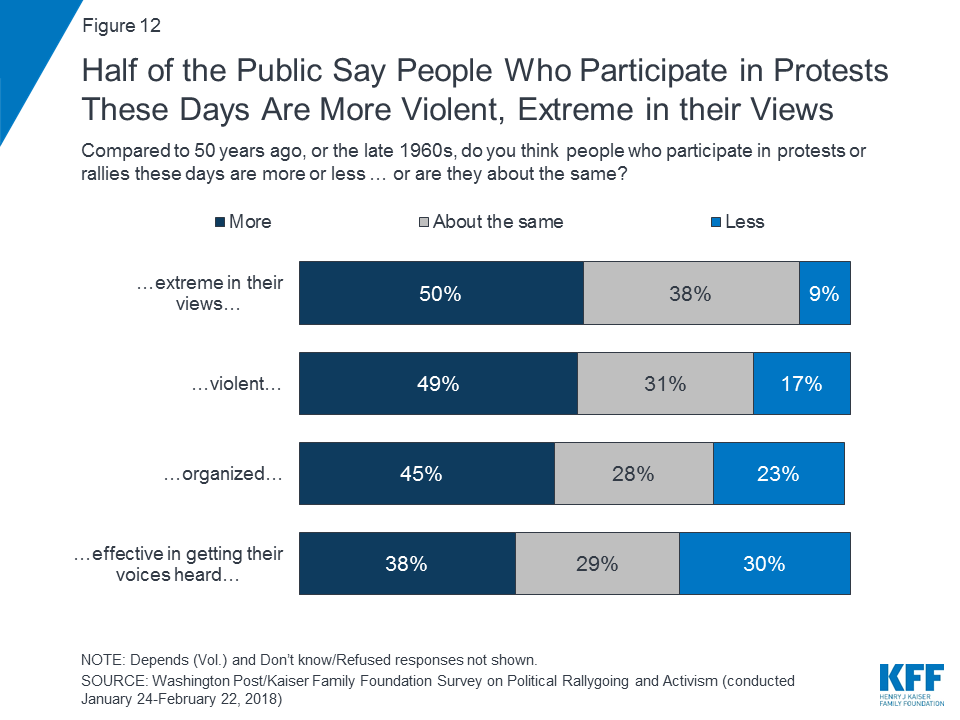
Fifty years after the tumultuous late 1960s, a time characterized by the civil rights movement, protests of the Vietnam War, and assassinations, the public more often feels that people who participate in rallies and protests today have become more extreme in their views, violent, organized, and effective in getting their voices heard, rather than less or about the same. For example, 49 percent of the public says that compared to the late 1960s, people who participate in protests or rallies these days are more violent, whereas 17 percent says they are less violent and 31 percent says they’re about the same.
Interestingly, older adults (65 or older) who lived through the 1960s are somewhat more likely to say things are more violent now (64 percent) and that protesters now are more extreme in their views (56 percent).
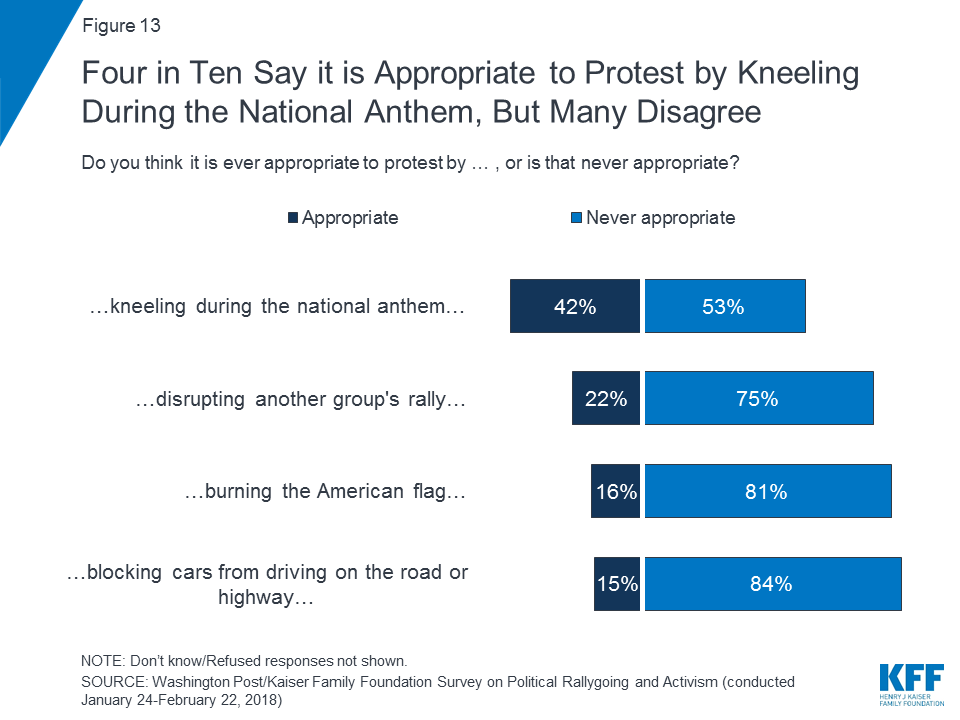
Majorities of the public feel it is never appropriate to protest by blocking cars from driving on the road or highway (84 percent), burning the American flag (81 percent), disrupting another group’s rally (75 percent), or kneeling during the national anthem (53 percent). Republicans are more likely to say various actions are never appropriate than Democrats, but still majorities of Democrats agree, with the exception of kneeling during the national anthem, where 66 percent of Democrats say it is appropriate.
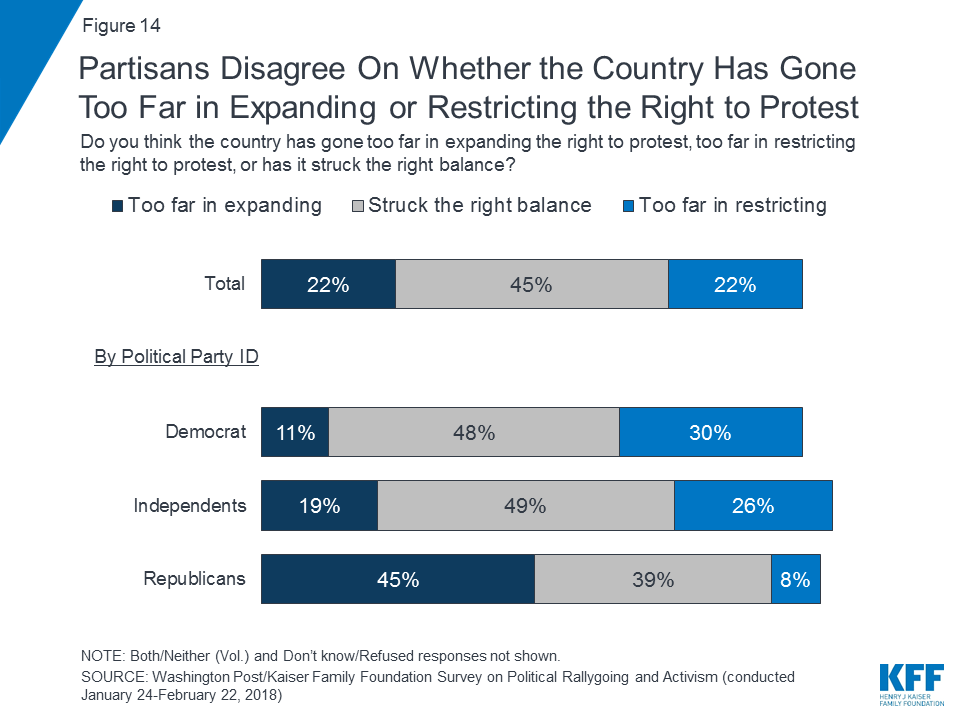
Much of the public feels the country has struck the right balance in terms of allowing or restricting protests, while 22 percent say it’s gone too far in expanding the right to protest and the same share (22 percent) say it has gone too far in restricting the right to protest. Rallygoers are more likely to think the country has gone too far in restricting the right to protest rather than too far in expanding the right to protest (29 percent vs. 13 percent), while most (51 percent) say the country has struck the right balance. Views vary by party with Republicans (45 percent) more likely to say the country has gone too far in expanding the right to protest than Democrats (11 percent) or independents (19 percent).
A slim majority of the public feels that even those they may disagree with have a right to protest peacefully: 54 percent say people should have the right to demonstrate peacefully in support of Nazis and white supremacy, compared to 42 percent who say this should be banned. Among rallygoers, 66 percent feel they should have a right to demonstrate peacefully. Most Democrats (54 percent) feel these types of demonstrations should be banned, while six in ten Republicans and independents feel they have the right to demonstrate peacefully.

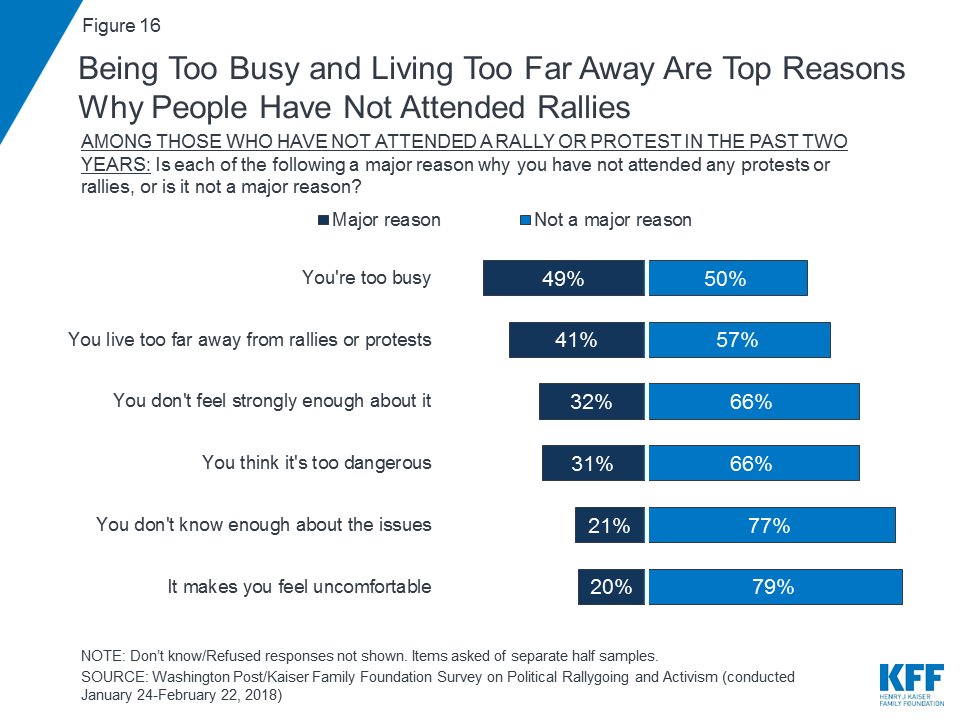
Many of those who aren’t getting out of the house to go to rallies and protests say it’s because they’re too busy (49 percent) or they live too far away (41 percent). Some report reasons such as they don’t feel strongly enough about it (32 percent) or they don’t know enough about the issues (21 percent), and those who are not engaged at all are much more likely to say those are major reasons they don’t participate.
The Washington Post/Kaiser Family Foundation Survey Project is a partnership combining survey research and reporting to better inform the public. The Post-Kaiser Survey on Political Rallygoing and Activism, the 32nd in this series, was conducted by telephone Jan. 24 – Feb. 22, 2018, among a random representative sample of 1,850 adults age 18 and older living in the United States. The survey includes an oversample of those who report that in the past two years they attended 1) a political rally, speech, or campaign event, or 2) an organized protest, march, or demonstration of any kind. This group is referred to here as “rallygoers.” Interviews were administered in English and Spanish, combining random samples of both landline (n=713) and cellular telephones (n=1,137).
Sampling, data collection, weighting and tabulation were managed by SSRS in close collaboration with The Washington Post and Kaiser Family Foundation researchers.
The sample plan consisted of two main elements:
A multi-stage weighting process was applied to ensure an accurate representation of the national adult population. The first stage of weighting involved corrections for sample design, including accounting for non-response for the re-contact sample. The second weighting stage was conducted separately for those who qualified as rallygoers and all other adults. There are no known administrative data available for creating demographic weighting parameters for rallygoers as defined by this survey. Therefore, demographic benchmarks were derived by compiling a sample of all respondents interviewed on the SSRS Omnibus survey between Nov. 21, 2017 and Feb. 2, 2018 (N=10,350). This sample was weighted to match the national adult population based on the 2017 U.S. Census Current Population Survey March Supplement and the early 2017 National Health Interview Survey parameters for age, gender, education, race/ethnicity, region, marital status, phone status, and population density. Then, this sample was filtered for respondents who qualify as rallygoers (N=2,152) and those who do not (8,198) and the weighted demographics of these groups were used as post-stratification weighting parameters for each group in the total sample (including age by gender, education, race/ethnicity, region, population density, marital status, phone status, rallygoer status. In the final weighting stage, each group (rallygoers and all others) was weighted to reflect its actual share in the U.S. adult population.
All sampling error margins and tests of statistical significance have been adjusted to account for the survey’s design effect, which is 1.8 for results based on the full sample. The design effect is a factor representing the survey’s deviation from a simple random sample, and takes into account decreases in precision due to sample design and weighting procedures. Sample sizes and margin of sampling errors for key groups are shown below; other subgroups are available by request. Note that sampling error is only one of many potential sources of error in this or any other public opinion poll. All statistical tests of significance account for the effect of weighting.
| Group | N (unweighted) | Margin of sampling error (percentage points) |
| Total | 1,850 | ±3 |
| Rallygoers | 832 | ±4 |
| Non-rallygoers (NET) | 1,018 | ±3.5 |
| Nuts and Bolts activists | 377 | ±6 |
| Pinch Hitters | 334 | ±6.5 |
| Not engaged | 307 | ±6.5 |
This questionnaire was administered with the exact questions in the exact order as appears in this document. If a question was asked of a reduced base of the sample, a parenthetical preceding the question identifies the group asked.
The Washington Post and the Kaiser Family Foundation each contributed financing for the survey, and representatives of each organization worked together to develop the survey questionnaire and analyze the results. Each organization bears the sole responsibility for the work that appears under its name. The project team from the Kaiser Family Foundation included: Mollyann Brodie, Ph.D., Bianca DiJulio, and Cailey Muñana. The project team from The Washington Post included: Scott Clement and Emily Guskin. Both The Washington Post and the Kaiser Family Foundation public opinion and survey research are charter members of the Transparency Initiative of the American Association for Public Opinion Research.
A new Kaiser Family Foundation analysis finds that while the use of prescription opioids among people with employer-based health coverage has declined to its lowest levels in over a decade, the cost of treating addiction and overdoses has increased sharply.
The annual cost of treating opioid addiction and overdose – stemming from both prescription and illicit use — has increased by more than eight-fold since 2004, from $0.3 billion dollars to $2.6 billion in 2016.
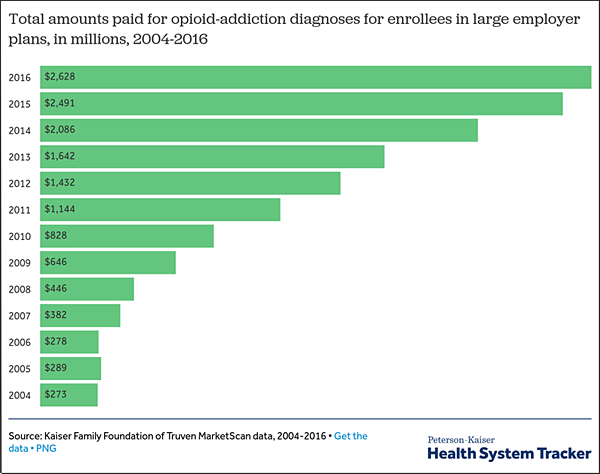
Among people with an inpatient episode, the average inpatient expenses for opioid addiction treatment totaled $16,104 per year in 2016, up from $5,809 in 2004.
A majority (53%) of spending paid for the treatment of enrollees’ dependent children.
In addition to providing data on opioid misuse spending, the brief highlights general trends in the use of opioids among people with employer-based coverage. It finds:
The issue brief and a related chart collection are available on the Peterson-Kaiser Health System Tracker, a partnership between the Peterson Center on Healthcare and the Kaiser Family Foundation that monitors the U.S. health system’s performance on key quality and cost measures.
METHODOLOGY
The analysis is based on a sample of health benefit claims from the Truven MarketScan Commercial Claims and Encounters Database to calculate the amounts paid by insurance and out-of-pocket on prescription drugs from 2004 to 2016. A sample of between 1.2 and 19.8 million enrollees per year was used to analyze the change from 2004 to 2016 in opioid-related spending and utilization.
A new Kaiser Family Foundation brief and chart collection tracks the impact of the opioid epidemic on people with employer-based health coverage.
While the use of prescription opioids among people with private insurance has declined to its lowest levels in over a decade, the cost of treating addiction and overdoses has increased by more than eight-fold since 2004, from $0.3 billion dollars to $2.6 billion in 2016. Among people with an inpatient episode, the average inpatient expenses for opioid addiction treatment totaled $16,104 per year in 2016, up from $5,809 in 2004.
The analysis draws on a sample of health benefit claims from the Truven MarketScan Commercial Claims and Encounters Database, and is part of the Peterson-Kaiser Health System Tracker, an online information hub dedicated to monitoring and assessing the performance of the U.S. health system.
Nursing facilities are one part of the long-term care delivery system that also includes home and community based services, but their relatively high cost has led them to be the focus of much attention from policymakers. Medicaid plays a major role in financing nursing facility care in the United States, and policy proposals to limit federal financing for Medicaid may lead to cuts in eligibility or scope of coverage for long-term care services. In addition, regulations effective November 2016 aimed to address longstanding challenges in quality and safety in nursing facilities. As the demand for long term care continues to increase and policy proposals and regulations unfold, the characteristics, capacity, and care quality of facilities remain subjects of concern among consumers and policy makers.
This report provides information on recent trends in nursing facilities in the United States, drawing on data from the federal On-line Survey, Certification, and Reporting system (OSCAR) and Certification and Survey Provider Enhanced Reports (CASPER), to provide information on nursing facility characteristics, resident characteristics, facility staffing, and deficiencies by state from 2009 through 2016. Additional detail on the survey and methods underlying the data in this report are provided in the Appendix at the end of the report. This information enables policymakers and the public to monitor and understand recent changes in nursing facility care in the United States and helps highlight areas of ongoing interest for policymaking.
#Medicaid is the primary payer source for most certified nursing facility residents, with more than six in ten (62%) residents—about 832,000 people—having Medicaid as their primary payer in 2016.
Facility characteristics provide a picture of who provides nursing facility care in the United States, including the number and capacity of facilities, certification and ownership, and revenue sources. Nationwide, the number of nursing facility beds has been fairly consistent since 2009, reaching 1.6 million certified beds in 2016 (with an average of 109 beds per facility). However, nursing facility occupancy rates declined slightly from 2009 to 2016, from 84 percent in 2009 to 81 percent in 2016. States vary in their average facility size and occupancy rates, with states in the East generally having larger facilities and higher occupancy rates.
Over the 2009 to 2016 period, share of nursing facilities that were for-profit increased slightly, from 67% in 2009 to 69% in 2016, while the share that were non-profit declined slightly from 26% in 2009 to 24% in 2016 (the remainder, about 7% over time, were government-owned). Ownership patterns vary widely across states, with states in the South and West having higher shares of facilities that are for-profit. In addition, more than half of facilities over this period were owned or leased by multi-facility organizations (chains that have two or more facilities), though the share of nursing facilities that are chain-owned varies by state.
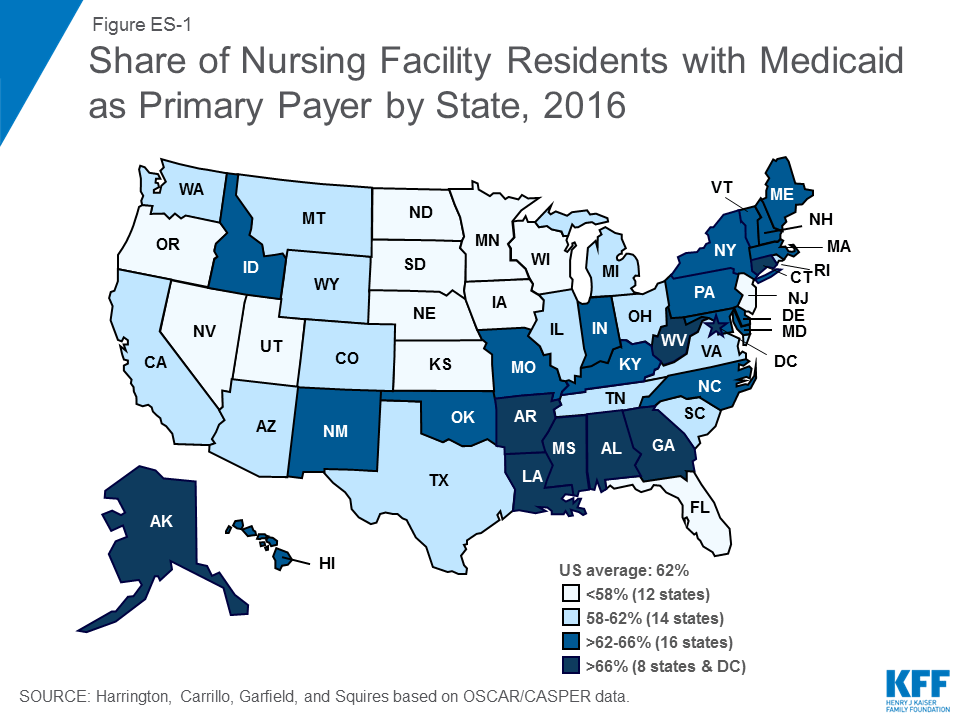
Medicaid is the primary payer source for most certified nursing facility residents, with more than six in ten (62%) residents—about 832,000 people—having Medicaid as their primary payer in 2016. States in the East, particularly the Southeast, have higher shares of residents with Medicaid as their primary payer than other states (Figure ES-1).
Resident characteristics affect the environment of the facility and also require different levels and types of staff resources. While nearly all residents in a nursing facility require some level of assistance, some facilities may have residents with a greater level of need. On average, in 2016, residents’ level of need for assistance with activities of daily living scored 5.8 on a scale from 3 to 9, and levels of need have been fairly stable since 2009. Residents commonly have mobility impairments, which range from difficulty walking to inability to get oneself out of bed. While relatively few (4%) residents were bed-bound in 2016, over six in ten (65%) of residents depend on a wheelchair for mobility or are unable to walk without extensive or constant support from others. Another common health care need of nursing facility residents is treatments related to bladder or bowel incontinence. However, there is still a notable discrepancy between the high percentage of residents with incontinence problems and the low percentage of residents in training programs to address these problems.
Cognitive and behavioral health is of particular concern for nursing facility residents. Nearly half (45%) of residents had a dementia diagnosis in 2016, and 32% had other psychiatric conditions such as schizophrenia, mood disorders, or other diagnoses. In addition, nearly two-thirds (63%) of residents received psychoactive medications, including anti-depressants, anti-anxiety drugs, sedatives and hypnotics, and anti-psychotics, in 2016. Over-use of anti-psychotic medications has been the focus of recent policy attention, particularly their use among residents with dementia, and is the subject of regulations for nursing facility care. Use of physical restraints is another area of concern for residents with cognitive problems. Federal law and ongoing education about the negative effects of restraints have led to a decline in their use over time, and the share of residents with physical restraints was under one percent in 2016.
Over the past 25 years, numerous research studies have documented a significant relationship between higher nurse staffing levels, particularly RN staffing, and the better outcomes of care. Though several recommendations for minimum staffing levels have been put forth, there are not federal requirements for specific nurse staffing levels (though some states do have their own minimum staffing requirements). In 2016, total nursing hours (including RNs, LPN/LVNs, and NAs) averaged 4.1 hours per resident day, an increase from 3.9 in 2009, but there was wide state variation in average nursing hours per resident day. Nationwide, many of these hours are accounted for by non-licensed nursing care (i.e., nursing assistants).
Nursing facilities provide care to prevent problems and to address the needs of residents, but sometimes care does not meet established standards. State surveyors assess both the process and the outcomes of nursing facility care for 175 individual requirements across eight major areas. Where a facility fails to meet a requirement, a deficiency or citation is given to the facility for that individual requirement. Between 2009 and 2013, the average number of deficiencies per facility declined from 9.33 to 7.28, though there was a slight increase between 2013 and 2016, with 8.76 deficiencies on average in 2016. The share of facilities with no deficiencies increased slightly from 2011 (6.88%) to 2013 (8.07%) then dropped to 6.5% in 2016. In 2016, the most common deficiencies were given for failures in infection control, accident environment, food sanitation, quality of care, and pharmacy consultation. Of particular concern are deficiencies that cause harm or immediate jeopardy to residents. In 2016, more than one in five facilities received a deficiency for actual harm or jeopardy. As with other outcomes, there was wide variation across states in these outcomes; however, some states had high rates across all top ten deficiencies.
Recent trends in facility characteristics can help policymakers spot potential areas of concern and plan for future system needs. For example, while nursing facility capacity has remained fairly flat from 2009 to 2016, occupancy rates have declined, perhaps reflecting a shift from institutional to community-based long-term care. Still, overall demand for long-term care services may increase in coming years as the “baby boom” generation ages, and states and policy makers can use this information to determine sufficient capacity to accommodate long-term care user choice in both institutional and community-based settings. In addition, continuing a trend that started before 2009, the share of nursing facilities that are for-profit or chain-owned continued to grow slightly from 2009 to 2016. These facility characteristics are important to policymakers and consumers because of their link to poorer quality of care, and continued monitoring of facility ownership by states can help to ensure that a high quality of care is provided at these facilities. With Medicaid as the primary payer for most nursing facility residents, policy and payment for nursing facility care is a priority policy area for state and federal governments that finance it. Changes to federal Medicaid financing could have repercussions for states’ ability to maintain Medicaid spending for long-term services and supports.
Notable shares of nursing facility residents have extensive behavioral or physical health needs, and facilities’ ability to meet these needs is the subject of ongoing policy attention. Nursing assistants who provide most of the care to these individuals often have limited training in working with this population. Some may interpret residents’ behavior as aggressive or have difficulty managing these residents’ needs. Despite regulations to limit the use of psychoactive medication, relatively high shares of residents still receive these medications, indicating an ongoing problem with chemical restraints. This pattern may be indicative of nursing facilities lacking systematic plans to address the needs of residents with dementia or other cognitive impairments. Regulations could implement ACA requirements to improve the quality of care for residents with cognitive impairments and further restrict the use of psychotropic agents.
Last, the data show that nursing facility deficiencies have declined between 2009 and 2016, though there is still much state variation in rates of deficiencies. While voluntary guidelines for compliance programs have been in place for many years, the ACA authorized new, mandatory compliance programs to improve quality of care. Regulations effective November 2016 implement these requirements, building on existing requirements for quality assessment and assurance programs to address quality deficiencies. Moving forward, it will be important to continue to monitor deficiency reports to understand whether and how new requirements are affecting care and outcomes and to identify additional areas of concern for future policy changes.
Nursing facilities are a major provider of long-term care services in the United States. These facilities provide medical, skilled nursing, and rehabilitative services on an inpatient basis to individuals who need assistance performing activities of daily living, such as bathing and dressing. Nursing facilities are one part of the long-term care delivery system that also includes home and community based services, but their relatively high cost has led them to be the focus of much attention from policymakers. Medicaid plays a major role in financing nursing facility care in the United States, and policy proposals to limit federal financing for Medicaid may lead to cuts in eligibility or scope of coverage for long-term care services. In addition, regulations effective November 2016 aimed to address longstanding challenges in quality and safety in nursing facilities. As the demand for long term care continues to increase and policy proposals and regulations unfold, the characteristics, capacity, and care quality of facilities remain subjects of concern among consumers and policy makers.
This report provides information on recent trends in nursing facilities in the United States, drawing on data from the federal On-line Survey, Certification, and Reporting system (OSCAR) and more recent Certification and Survey Provider Enhanced Reports (CASPER). We use these databases to provide information on nursing facility characteristics, resident characteristics, facility staffing, and deficiencies by state from 2009 through 2016. This information enables policymakers and the public to monitor and understand recent changes in nursing facility care in the United States and help highlight areas of ongoing interest for current and future policymaking.
Long-term care includes medical and personal care assistance that people may need – for weeks, months, or years – when they experience difficulty completing self-care tasks as a result of aging, chronic illness, or disability. While many people’s long-term care service needs can be met in the community, some may choose or require care in facilities. Nursing facility care is costly: a year of care typically costs over $82,000,1 and national spending on nursing facilities across all payers totaled $162.7 billion in 2016.2 Much of the cost of nursing facility care is publicly-financed through Medicaid, making it a high priority for state and federal policymakers.
In addition, a particular concern to consumers, professionals, and policy-makers is the quality of care provided in nursing facilities. In response to a request from Congress, the Institute of Medicine (IOM) completed a Study on Nursing Home Regulation in 19863 that reported widespread quality of care and oversight problems and recommended the strengthening of federal regulations for nursing homes.4 The IOM Committee recommendations and the active efforts of many consumer advocates resulted in Congress passing Nursing Home Reform Legislation as part of the Omnibus Budget Reconciliation Act (OBRA) in 1987.5
OBRA 1987, implemented by federal regulations in 1990 and in 1995, mandated a number of changes. The regulations eliminated the priority hierarchy of conditions, standards, and elements that were in the prior regulations. The merger of Medicare and Medicaid standards and processes raised standards for Medicaid-participating facilities. The Act also mandated more rigorous inspection procedures and the use of intermediate sanctions for regulatory violations and required surveyors to focus on quality outcomes.6 The federal law also required comprehensive assessments of all nursing facility residents to determine their care needs and to use this information in the care planning process.7 The law specifically required nursing facilities to provide sufficient nursing, medical, and psychosocial services to attain and maintain the highest possible mental and physical functional status of residents. The law focused on outcomes of care (such as incontinence, immobility, and pressure ulcers) as well as the protection of residents’ rights and the establishment of quality of life requirements. The provisions of the law were implemented by the Centers for Medicare & Medicaid Services (CMS) over a ten-year period.
The 2010 Affordable Care Act (ACA) further expanded quality of care requirements for nursing facilities that participate in Medicare and Medicaid.8 The ACA incorporates the Nursing Home Transparency and Improvement Act of 2009, introduced because complex ownership, management, and financing structures were inhibiting regulators’ ability to hold providers accountable for compliance with federal requirements. The ACA also incorporates the Elder Justice Act and the Patient Safety and Abuse Prevention Act, which include provisions to protect nursing facility residents from abuse and other crimes. Under these laws, nursing facilities face standards regarding disclosing financial relationships and costs; reporting requirements for nurse staffing; and improvements to compliance and ethics programs. There are also rules regarding monetary penalties for lack of compliance with federal regulations; notification requirements when a facility closes; additional staff training on dementia care; and provisions for background checks and reporting criminal activity. While implementation of many nursing facility provisions in the ACA was delayed, comprehensive regulations effective November 2016 implement these and other changes to both improve patient care and safety and reduce reporting and procedural burden on facilities.9
Since 1998, CMS has published limited information on nursing facilities through its Nursing Home Compare website. In 2008, CMS added the Nursing Home Five-Star Quality Rating System, which provides individual and composite ratings for nursing facilities based on health inspections, nurse staffing hours, and selected quality measures. ACA requirements led CMS to update and improve the Nursing Home Compare website, and over time, CMS has added new indicators and information about complaints and modified its star rating system to make it more difficult to achieve a better star rating.10 ,11
This report provides information on nursing facility characteristics, resident characteristics, facility staffing, and deficiencies by state from 2009 through 2016. The deficiency data include all deficiencies from the annual survey and any complaint surveys during each calendar year. The data source, originally the federal On-line Survey, Certification, and Reporting system (OSCAR), was converted to the Certification and Survey Provider Enhanced Reports (CASPER) in 2012.12 Because OSCAR/CASPER data changes frequently throughout the year as facilities add new data (and older ones are deleted), our analysis may have slightly different exact figures than those reported elsewhere. Additional details on the survey and methods underlying the data in this report are provided in the Appendix at the end of the report.
Facility characteristics provide a picture of who provides nursing facility care in the United States, including the number and capacity of facilities, certification and ownership, and revenue sources.
The number of beds that are certified for Medicare and Medicaid residents are an indication of nursing facility capacity in a state. There were 15,452 certified nursing facilities surveyed in 2016, out of approximately 15,640 certified facilities in the U.S.13 Not all facilities are surveyed by state agencies during a calendar year. In terms of number of beds, there were 1.644 million certified beds in nursing facilities that were surveyed in 2016 (uncertified beds are excluded), compared to 1.664 million in 2009 (state-by-state and trend data on number of facilities and number of beds is available in the Supplemental Tables). The number of certified nursing beds per facility is calculated by dividing the total number of certified beds in a state by the total number of certified facilities in the state. In 2016, the overall average facility size was 108.37 beds, almost the same as 2009 (108.42) (Figure 1 & Table 1). However, states vary in their average facility size, with states in the East generally having larger facilities and states in the Mid-West having the smallest facilities (Figure 2).
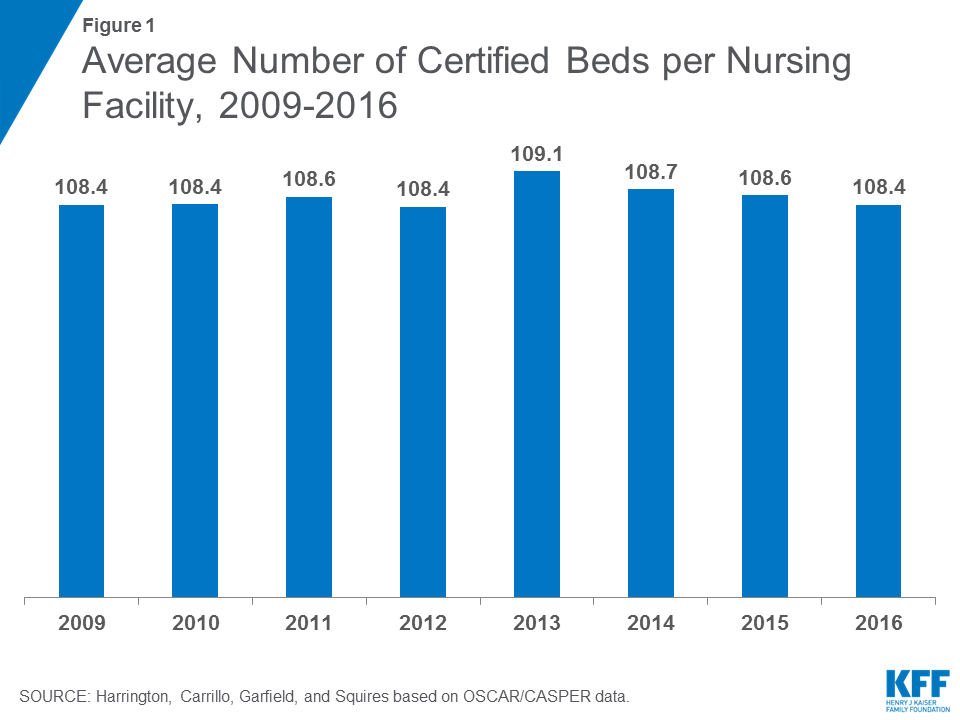
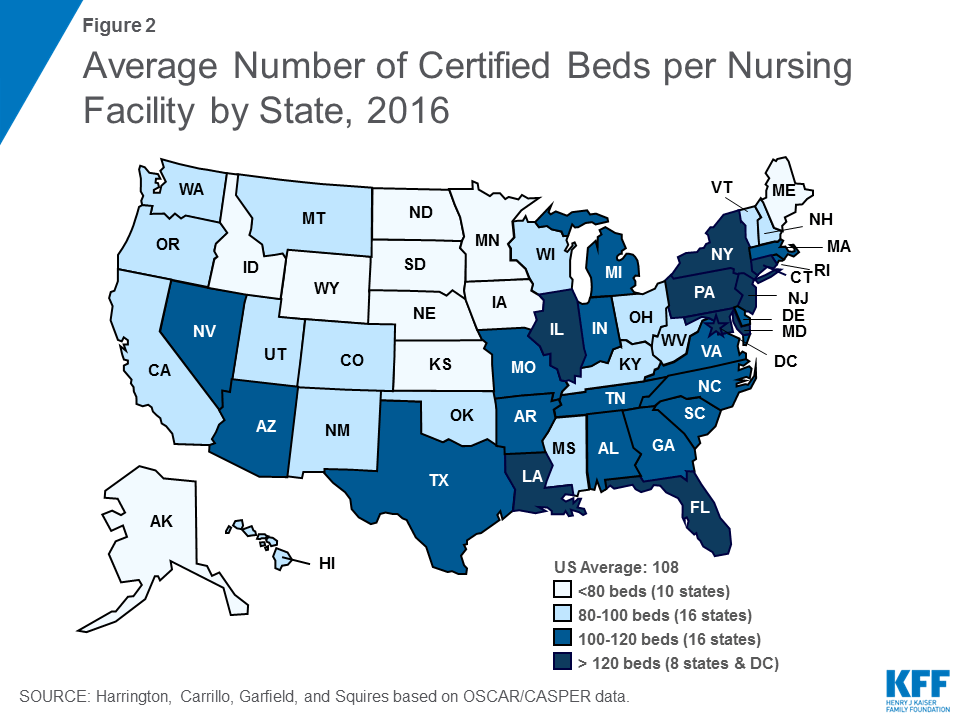
Occupancy rates also are important in showing the potential availability of beds; further, occupancy rates may influence the quality and financial status of the facility.14 Facility occupancy rates are calculated by dividing the number of nursing residents in a certified facility by the total number of certified beds (excluding all uncertified residents and beds). The total number of nursing facility residents in certified nursing facilities has been declining somewhat over time, from 1.393 million in 2009 to 1.329 million in 2016 (excluding residents in uncertified beds) (Figure 3 and Table 2). Correspondingly, the average certified nursing facility occupancy rate declined slightly from 2009 to 2016, from 83.7 percent in 2009 to 80.8 percent in 2016. States in the East generally have higher occupancy rates than other states (Figure 4). Occupancy rates have been declining over time even before this period, providing some evidence of an excess supply of nursing home beds in many areas.15
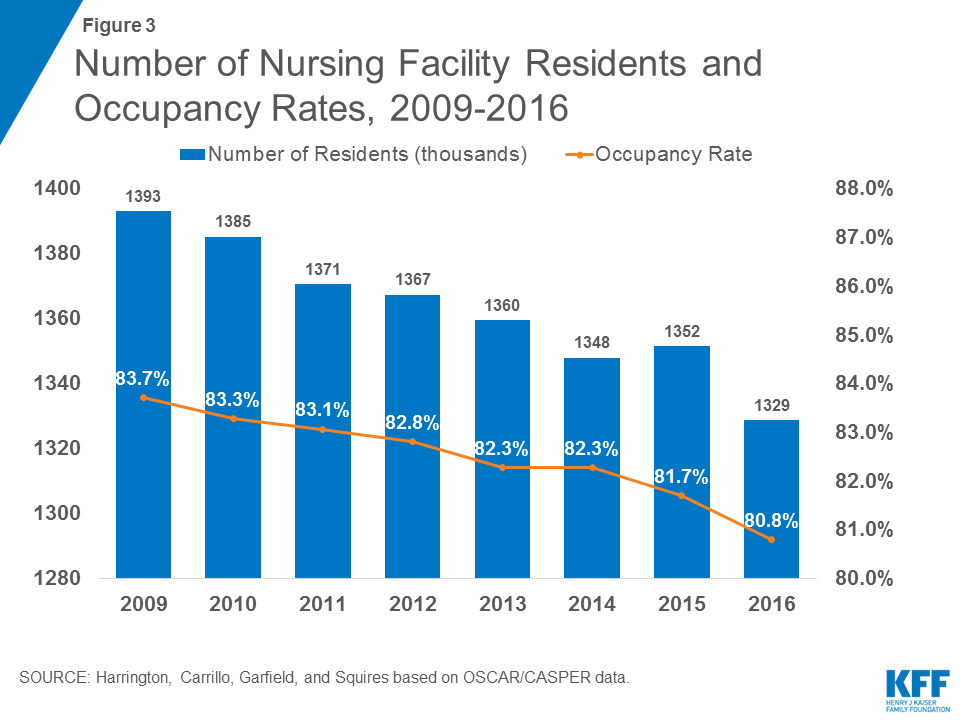
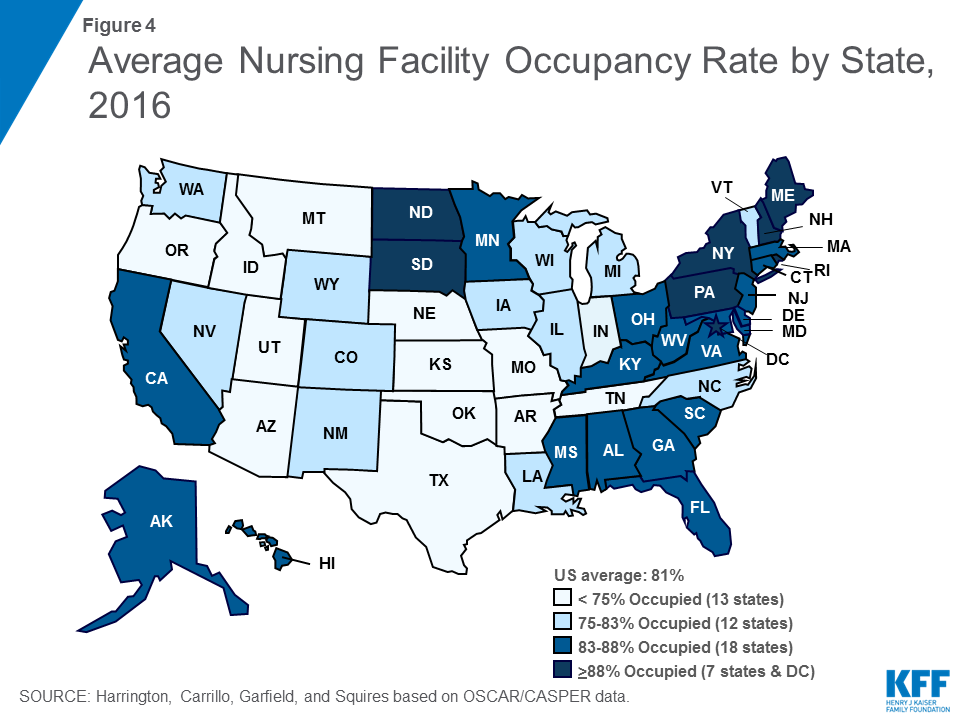
Licensed nursing facilities may apply to be certified for participation in the Medicare and/or Medicaid program on a voluntary basis. Facilities may apply to participate in: (1) only the Medicaid (Title XIX) program, (2) only the Medicare (Title XVIII) program, or (3) the Medicare/Medicaid dually certified (Titles XVIII and XIX) program. Since 1991, the Medicare program classified facilities as skilled nursing facilities (SNFs), while Medicaid-certified facilities are designated as “nursing facilities” (NFs). Certification requirements are detailed in federal regulations at 42 CFR Part 483. Federal Medicare rules allow for all or part of a facility to be certified.
The percentage of Medicare and Medicaid patients in a facility is an important factor in not only revenue sources but also other aspects of a facility. Nursing facilities have historically considered Medicaid reimbursement rates to be low and prefer Medicare and private pay patients.16 Higher Medicaid reimbursement rates have been associated with higher staffing and higher care quality.17 ,18 ,19
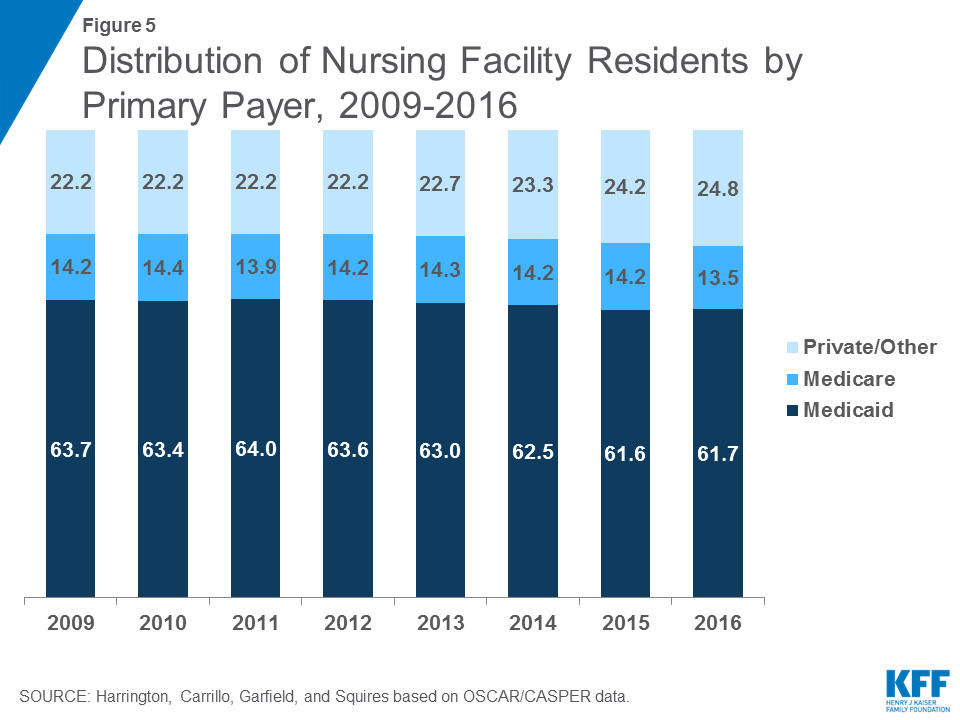
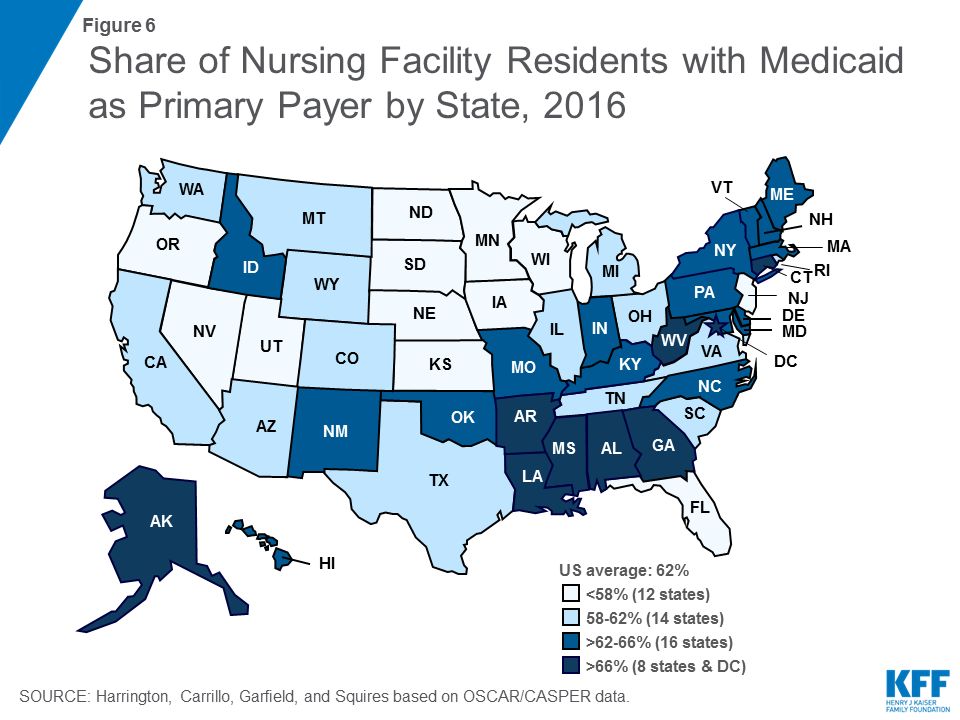
The vast majority (96.2%) of beds were dually certified by both Medicare and Medicaid in 2016, with very few certified for only Medicare (2.3%) or only Medicaid (1.6%) (See Supplemental Tables for additional detail). While most beds are dually certified, Medicaid is the primary payer source for most certified nursing facility residents (Figure 5 and Table 3). Medicaid may become the primary payer of nursing facility services once residents have exhausted or spent down personal assets paying for care. In 2016, 61.7 percent of total residents had Medicaid as their primary payer (down slightly from 63.7 in 2009), which equates to more than 832,000 people nationwide at any given time (Table 4). States in the East, particularly the Southeast, have higher shares of residents with Medicaid as their primary payer than other states (Figure 6). Medicare, which covers only short stays in nursing facilities, was primary payer for 13.5 percent of the total residents in 2016, compared to 14.2% in 2009. Private payers (primarily out-of-pocket payments from residents) and other sources are the primary payer for the remainder of residents (24.8% in 2016).
One of the major debates in research circles is whether the proprietary nature of the nursing facility industry affects process and outcomes in terms of quality of care. Research studies of ownership and quality show that for-profit facilities generally have lower overall quality of care.20 ,21 There are higher rates of deficiencies in for-profit facilities and chains than non-profit and government facilities.22 Thus, proprietary ownership and chains may be associated with lower staffing levels and poorer process and outcome measures.
Nursing facility ownership patterns show that the large majority of nursing facilities were proprietary in the 2009-2016 period. In 2016, 69.0 percent of surveyed facilities were for-profit facilities, while 23.5 were non-profit facilities and 6.9 were government owned (Figure 7 and Table 5). The share of nursing facilities that are for-profit has increased slightly over time, while the share that is non-profit has declined slightly over time.
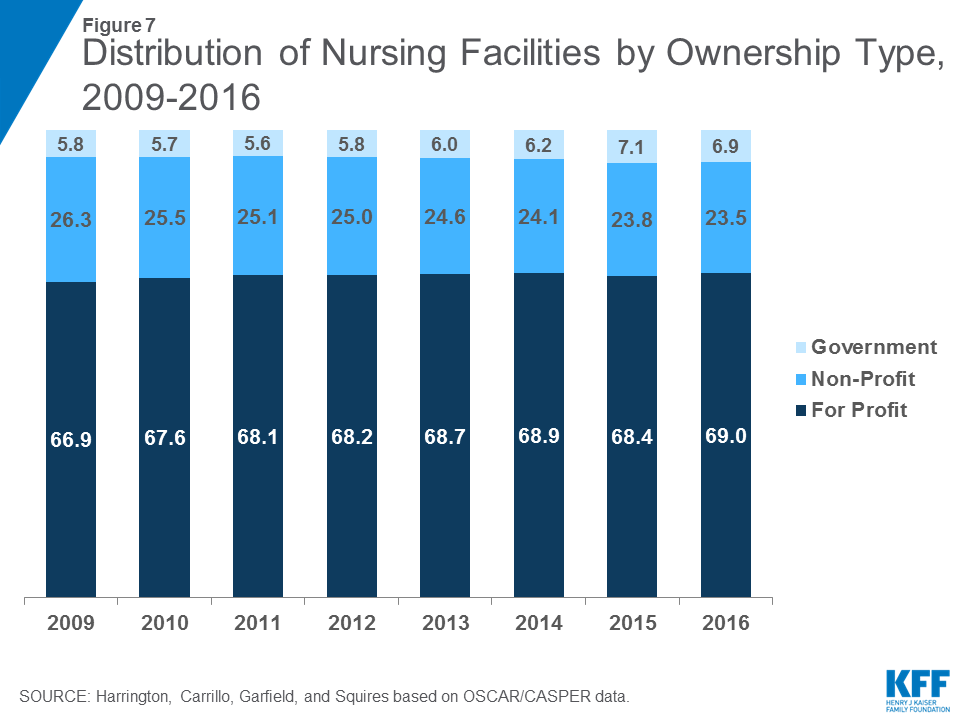
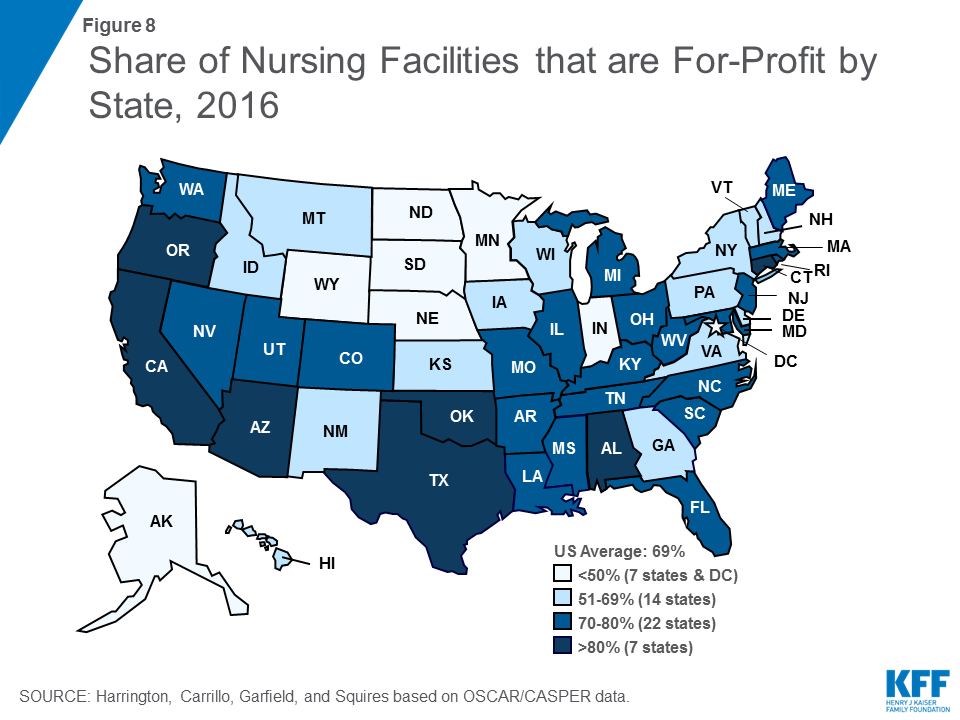
Ownership patterns vary widely across states (Figure 8). Alaska, Indiana, and Wyoming had relatively high shares (>33%) of facilities that were government owned in 2016. More than half of facilities in Alaska, the District of Columbia, Minnesota, North Dakota, and South Dakota were non-profit facilities in 2016. In Alabama, Arizona, California, Connecticut, Oklahoma, Oregon, and Texas, more than 80 percent of facilities were for-profit in 2016.
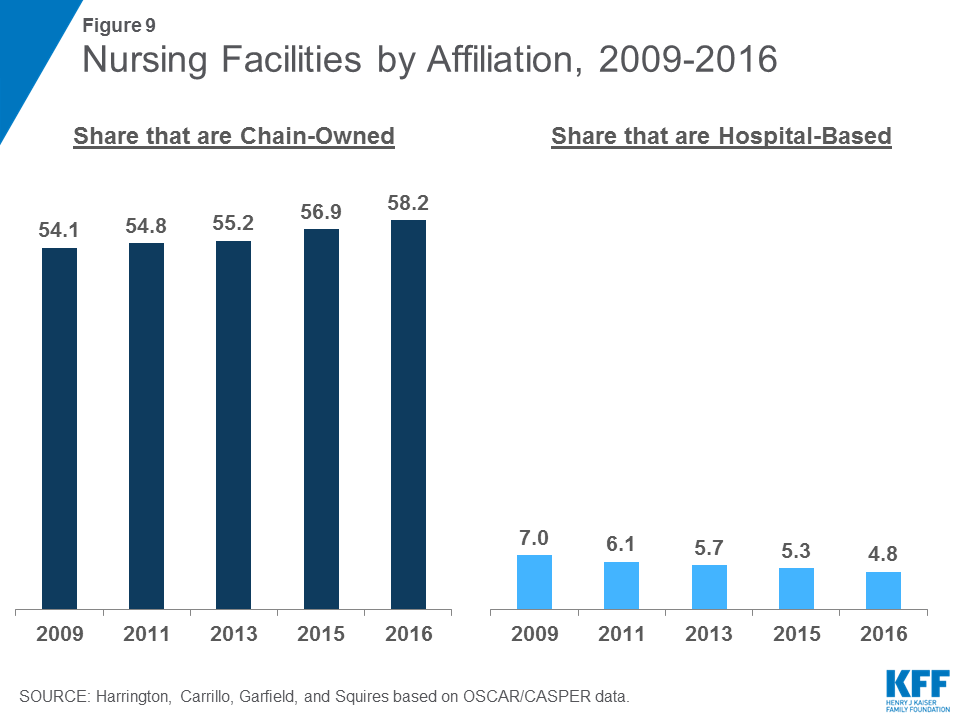
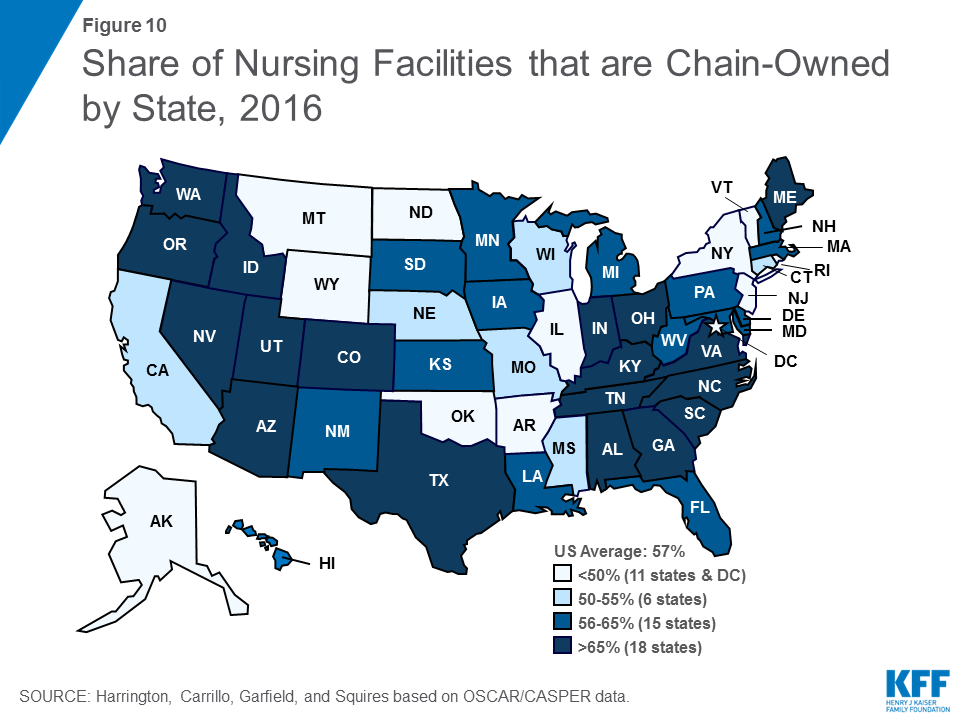
Hospital-based nursing facilities may have higher quality of care because they have more Medicare patients (with associated higher reimbursement rates) and higher staffing levels. The share of facilities that are certified as hospital-based has decreased slightly over time, from 7.0 percent in 2009 to 4.8 percent of all facilities in 2016 (Figure 9). This decline continues an earlier pattern that occurred after the introduction of the Medicare prospective payment system for nursing facilities in 1998. More than half (58.2 percent) of facilities in 2016 were owned or leased by multi-facility organizations (chains that have two or more facilities), a slight increase since 2009 (54.1%). The share of nursing facilities that are chain-owned varies by state (Figure 10).
It is important to note that other facility characteristics are also associated with quality. Having accreditation may be positively associated with higher staffing levels and with higher quality of care. The existence of dedicated special care units, such as those for persons with Alzheimer’s disease, may also be associated with higher quality of care because of higher staffing levels. Large size facilities have been associated with lower quality, although findings are mixed.23 Larger facilities tend to have lower staffing and perhaps have more difficulty in managing the quality of care.
Under federal regulations, nursing facility residents have the right to form organized resident groups, which meet regularly to discuss and offer suggestions about policies and procedures affecting residents’ care, treatment, and quality of life; to support each other; to plan resident and family activities; to participate in educational activities or for any other purposes. Facilities also may have organized groups of family members who meet regularly to discuss issues about residents’ care, treatment, and quality of life. In 2016, most facilities (96%) had resident groups (See Supplemental Tables for more detail), though a smaller share (22.6%) report having family groups. The share of facilities with family groups has declined over time. Those facilities with organized residents groups or organized family groups may have higher quality of care.24
Nursing facilities vary in the type of residents they serve. Resident characteristics affect the environment of the facility. Moreover, the special characteristics of nursing facility residents require different levels and types of staff resources and affect the facility’s success in providing high quality care. A number of nursing facility resident classification systems have been developed and are often referred to as “case mix” indicators (see Appendix for more detail on data sources on resident characteristics). Below, we summarize characteristics of residents using data available in the OSCAR/CASPER database.
While nearly all residents in a nursing facility require some level of assistance, some facilities may have residents with a greater level of need. Table 6 shows the average score for residents needing assistance with eating, toileting, and transferring from surfaces, such as to and from a bed, chair, or wheelchair, or to and from a standing position, in facilities by state. Each state has an average score from 1 to 3 in terms of residents’ need for assistance, where 1 indicates the lowest need and 3 the greatest need. The U.S. average resident need was 1.67 for eating assistance, 2.08 for toileting assistance, and 2.04 for transferring assistance in 2016. Each of these scores has been fairly consistent since 2009. Table 6 also shows the average summary scores for these three activities of daily living for all facilities in each state. The average resident need score for eating, toileting, and transferring for all facilities surveyed in the U.S. was 5.80 in 2016.
Mobility impairments range from difficulty walking to inability to get oneself out of bed and are another indication of the level of need among residents. As shown in Table A, on average 3.7 percent of residents were bed-bound in 2016, meaning they were in a bed or recliner for 22 or more hours per day in the week before the survey. The share of residents who are bed-bound declined slightly between 2009 and 2012 but has increased slightly since then. A larger share (65.3%) of residents are chairbound, meaning they depend on a wheelchair for mobility or are unable to walk without extensive or constant support from others. Contractures, which are restrictions in full range of motion of any joint due to deformity, disuse and pain, are common problems of nursing facility residents. In 2016, more than one in five (22.0%) residents was reported as having contractures.
Lack of mobility can lead to health problems for nursing facility residents. Pressure ulcers (or bedsores) are areas of the skin and underlying tissues that erode as a result of pressure or friction and/or lack of blood supply. The severity of the ulcer ranges from persistent skin redness (without a break in the skin) to large open lesions that can expose skin tissue and bone. The acquiring of pressure sores in a facility is considered an indicator of poor quality of care, as it reflects patients spending extended time in one position or location. Sometimes, residents receive special skin care, which is non-routine care according to a resident care plan or physician’s order, usually designed to prevent or reduce pressure ulcers of the skin. In 2016, more than three quarters (76.4%) of nursing facility residents received special skin care, while 6.2 percent of residents had pressure sores (Table A).
| Table A: Nursing Facility Resident Characteristics Related to Mobility Impairment and Physical Restraint, 2009-2016 | ||||||||
| Share of Residents | 2009 | 2010 | 2011 | 2012 | 2013 | 2014 | 2015 | 2016 |
| Bedfast | 3.9 | 3.6 | 3.6 | 3.5 | 3.6 | 3.7 | 3.7 | 3.7 |
| Chairbound | 56.8 | 56.6 | 50.6 | 48.1 | 61.4 | 64.3 | 64.8 | 65.3 |
| Contractures | 28.6 | 26.3 | 24.3 | 24.4 | 23.8 | 23.3 | 22.7 | 22.0 |
| Pressure Sores | 6.5 | 6.5 | 6.3 | 6.2 | 6.1 | 6.1 | 6.2 | 6.1 |
| Special Skin Care | 77.9 | 76.2 | 74.7 | 75.2 | 75.6 | 76.0 | 76.5 | 76.4 |
Some nursing facility residents need advanced care (beyond assistance with activities of daily living) for physical health problems. Rates of receipt of this type of care are an indication not only of the health needs of residents but also of the scope of services provided by facilities.
Among the most common special health care needs of nursing facility residents are treatments related to bladder or bowel incontinence (Table B). In 2016, more than six in ten (63.5%) nursing facility residents had bladder incontinence, and more than four in ten (44.8%) had bowel incontinence. Some residents receive services through bladder (23.5%) or bowel (14.9%) training programs, which are designed to assist residents to gain and maintain bladder control (such as by pelvic exercises or frequent toileting) or bowel control (through the use of diet, fluids, and regular schedules). Participation in both types of programs has increased substantially since 2009. However, there is still a notable discrepancy between the high percentage of residents with incontinence problems and the low percentage of training programs. Sometimes, indwelling catheters, tubes used to drain urine from the bladder, are used, although the use of catheters is considered an indicator of poor quality of care. In 2016, about 6 percent of facility residents were reported to be using catheters, a rate that has been fairly stable since 2009. Last, a small share of residents (less than 3 percent) receives ostomy care, which includes special care for a skin opening to the intestinal and/or urinary tract such as a colostomy (opening to the colon).
Rehabilitation services are provided under the direction of a rehabilitation professional (physical therapist, occupational therapist, etc.) to improve functional ability. In 2016, nearly 32 percent of residents in nursing facilities received such services, up slightly from 26 percent in 2009. Rates of rehabilitation services have been increasing over time, perhaps related to changes in the Medicare prospective payment system for nursing facilities.25
| Table B: Nursing Facility Resident Characteristics Related to Physical Health and Special Care Needs, 2009-2016 | ||||||||
| Share of Residents | 2009 | 2010 | 2011 | 2012 | 2013 | 2014 | 2015 | 2016 |
| Bladder Incontinence | 55.4 | 55.7 | 58.0 | 59.9 | 61.3 | 61.8 | 62.7 | 63.5 |
| Bowel Incontinence | 43.5 | 43.7 | 45.1 | 47.8 | 43.6 | 43.4 | 44.2 | 44.8 |
| Bladder Training | 6.5 | 7.4 | 9.1 | 10.9 | 23.7 | 24.2 | 23.9 | 23.5 |
| Bowel Training | 3.5 | 3.7 | 4.3 | 5.7 | 14.6 | 15.1 | 15.0 | 14.9 |
| Indwelling Catheter | 6.1 | 6.0 | 6.0 | 5.9 | 5.8 | 5.7 | 5.9 | 5.7 |
| Ostomy Care | 4.7 | 4.4 | 3.6 | 3.1 | 2.8 | 2.6 | 2.5 | 2.5 |
| Rehabilitation | 25.7 | 26.2 | 26.6 | 26.8 | 28.8 | 30.7 | 31.8 | 32.2 |
| Injections | 21.3 | 21.2 | 21.3 | 21.5 | 21.8 | 21.6 | 21.5 | 21.3 |
| Intravenous Therapy | 2.4 | 2.2 | 2.0 | 2.0 | 1.6 | 1.5 | 1.6 | 1.6 |
| Respiratory Treatment | 14.7 | 15.1 | 15.6 | 16.0 | 15.7 | 15.5 | 15.8 | 15.8 |
| Tube Feeding | 5.5 | 5.3 | 5.3 | 5.1 | 5.0 | 4.8 | 4.7 | 4.5 |
Other less common special health care services include injections to deliver medication and intravenous therapy and/or blood transfusions to provide fluid, medications, nutritional substances, and blood products for residents. In 2016, 21.3 percent of residents received injections and less than two percent received IV therapy. Respiratory treatment is provided through respirators/ventilators, oxygen, inhalation therapy, and other treatment, and in 2016, more than 15 percent of facility residents received respiratory therapy. Last, nearly 5 percent of residents required tube feedings to provide nutritional substances directly into the gastrointestinal system.
Cognitive and behavioral health is of particular concern for nursing facility residents. Federal regulations from OBRA 1987 require screening of all new residents to ensure that those who have intellectual, developmental, or cognitive disabilities are placed in appropriate facilities where they receive services designed to meet their needs. State officials are required to certify that those individuals with intellectual or developmental disabilities who are placed in nursing facilities are receiving appropriate services. In 2016, approximately 2 percent of nursing facility residents were reported to have a developmental disability (including mild to profound mental retardation), a slight decrease since 2009 (Table C). Other cognitive problems, often associated with aging, are more common among nursing facility residents. Nearly half (45.3 percent) of residents were reported by facilities and states as having a dementia diagnosis in 2016.
With respect to behavioral health problems, the percent of residents with other psychiatric conditions, such as schizophrenia, mood disorders, and other diagnoses, was 32% in 2016. Psychoactive medications, including anti-depressants, anti-anxiety drugs, sedatives and hypnotics, and anti-psychotics, are often used to treat behavioral health problems. In 2016, nearly two-thirds (63.1%) of residents in facilities in the U.S. were reported to be receiving such medications. Federal regulations prohibit the use of anti-psychotics and other psychoactive drugs unless such drugs are shown to be necessary for particular resident conditions. However, because depression is frequently under-diagnosed and anti-depressants may sometimes be under-prescribed, educational efforts are focused on the appropriate use of anti-depressants.26 As detailed in the discussion section of this report, over-use of anti-psychotic medications has been the focus of recent policy attention, particularly their use among residents with dementia. CMS is now reporting the use of anti-psychotic medications as a poor quality measure on the Nursing Home Compare website.27
Physical restraints include physical or mechanical devices, material or equipment that cannot be easily removed by residents to restrict freedom of movement or normal access to one’s own body. Physical restraints are used to prevent falls or other injury among residents, but research has found that there can be significant negative physical and psychosocial effects to use of restraints.28 Since 1987, federal law has limited the use of physical restraints to prohibit their use for discipline or staff convenience, and the use of restraints has declined significantly.29 However, research has also shown that restraints are more likely to be used for residents with cognitive impairment or mental illness.30 The share of residents with physical restraints has declined over time, reaching 0.9 percent in 2016. The reduction may have been related to regulations and ongoing training about the negative effects of restraints on residents.
| Table C: Nursing Facility Resident Characteristics Related to Cognitive and Behavioral Health, 2009-2016 | ||||||||
| Share of Residents: | 2009 | 2010 | 2011 | 2012 | 2013 | 2014 | 2015 | 2016 |
| Developmental Disability | 2.9 | 2.7 | 2.3 | 2.2 | 2.2 | 2.2 | 2.2 | 2.2 |
| Dementia | 46.2 | 46.4 | 47.2 | 47.6 | 47.4 | 46.4 | 45.7 | 45.3 |
| Other Psychological Diagnosis | 23.5 | 24.1 | 26.3 | 28.0 | 30.0 | 31.1 | 31.5 | 32.1 |
| Receive Psychoactive Medications | 65.4 | 65.3 | 65.7 | 64.0 | 64.4 | 64.2 | 63.5 | 63.1 |
| Physical Restraints | 3.5 | 3.0 | 2.9 | 2.6 | 2.2 | 1.7 | 1.4 | 0.9 |
Over the past 25 years, numerous research studies have documented a significant relationship between nurse staffing levels, particularly RN staffing, and the outcomes of care.31 The benefits of higher staffing levels, especially RNs, include lower mortality rates; improved physical functioning; less antibiotic use; fewer pressure ulcers, catheterized residents, and urinary tract infections; lower hospitalization rates; and less weight loss and dehydration.32 ,33 ,34 ,35 ,36 ,37 Moreover, in states that have introduced higher minimum staffing standards for nursing facilities, nurse staffing levels and quality outcomes have improved.38 ,39 ,40 ,41 The evidence from research studies led the Institute of Medicine to conclude that the preponderance of evidence from a number of studies with different types of quality measures shows a positive relationship between nursing staffing and quality of nursing facility care.42 ,43 ,44
Several recommendations for minimum staffing levels have been put forth. A CMS study in 2001 established the importance of having 1.3 hours per resident day (hprd) of licensed nursing care (including 0.75 registered nurse (RN) hprd) and 2.8 certified nursing assistant (CNA) hprd, for a total of 4.1 nursing hprd to prevent harm or jeopardy to residents. An expert panel recommended minimum staffing levels of 4.55 hours per resident day,45 including all RNs, LVNs, and nursing assistants. However, in spite of calls for mandatory minimum staffing standards, CMS and Congress have not implemented specific nurse staffing levels (IOM, 2003).46 ,47 ,48 The Nursing Home Reform Act of 1987 required nursing facilities to have sufficient nursing staff to provide nursing and related services to attain or maintain the highest practicable physical, mental, and psychosocial well-being of residents. Facilities must also have a registered nurse as a Director of Nursing for at least eight consecutive hours a day, seven days a week and licensed nurses on-site twenty-four hours a day. Some states also have their own minimum staffing requirements, although these are generally lower than the levels recommended by experts.49
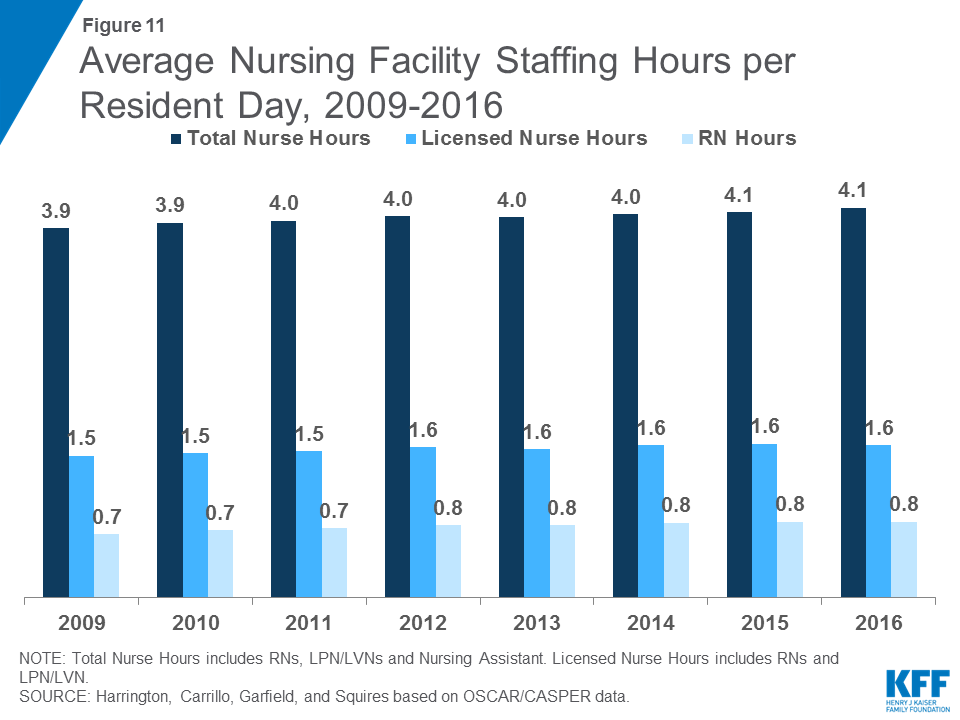

In 2016, total nursing hours (including RNs, LPN/LVNs, and NAs) averaged 4.1 hours per resident day, a small increase from 3.9 in 2009 (Figure 11 and Table 7). There was wide state variation in average nursing hours per resident day, ranging from 3.7 in South Dakota to 5.8 in Alaska. Nationwide, many of these hours are accounted for by non-licensed nursing care (i.e., nursing assistants): the average licensed nursing hours (only RNs and LPN/LVNs) per resident day was 1.6, up from 1.5 in 2009 (Figure 11). Within licensed nursing hours, about half on average are RN hours, which have increased slightly over time, from 0.7 in 2009 to 0.8 in 2016. Both LPN/LVN and NA hours were fairly flat over the period, reaching 0.8 and 2.4 hours per resident day in 2016, respectively (Table 8). Note that because not all facilities have usable staffing data, a small number of facilities are excluded from these estimates. Detail on the staffing measures included and underlying methods are provided in the Appendix at the end of the report.
Nursing facilities provide care to prevent problems and to address the needs of residents. However, sometimes care does not meet established standards. Policymakers and researchers have developed process indicators to measure the services or activities that a facility does or does not provide and outcome indicators to measure the impact of facility care on a resident. A number of process measures have been associated with poor patient outcomes. These include urethral catheterization, physical restraints, and tube feedings. Another common clinical problem in nursing homes is the improper use of psychotropic drugs.50 A number of outcome measures also have been linked to poor quality, such as: pressure ulcers, falls, weight loss, and infectious disease. Other negative outcomes are behavioral/emotional problems, cognitive problems, and deterioration in physical functioning.51
State surveyors assess both the process and the outcomes of nursing facility care in several major areas, each of which has specific requirements (see Appendix for more detail). In 2016, there were approximately 175 individual requirements. Where a facility fails to meet a requirement, a deficiency or citation is given to the facility for that individual requirement. The deficiencies are given for problems that can result in a negative impact on the health and safety of residents. Since 1995, surveyors also rate each deficiency based on scope and severity for purposes of enforcement. The deficiencies rated as causing actual harm or immediate jeopardy are the most serious.52
As shown in Table 9, the average number of deficiencies per facility decreased from 9.33 in 2009 to 7.28 in 2013, before rising again in 2016 to reach 8.76. Similarly, the share of facilities with no deficiencies increased from 6.11 in 2009 to 8.07 in 2013, then dropped to 6.50 in 2016. There was wide variation across states in the average number of deficiencies per facility, ranging from 2.56 in Rhode Island to 14.72 in Washington (Figure 13), as well as in the share of facilities with no deficiencies (ranging from 28.6 in Rhode Island to none in the District of Columbia, Delaware, Hawaii and Wyoming). Of particular concern are deficiencies that cause harm or immediate jeopardy to residents. In 2016, more than one in five (20.1%) facilities received a deficiency for actual harm or jeopardy. Again, this rate varied widely across states (Table 10).
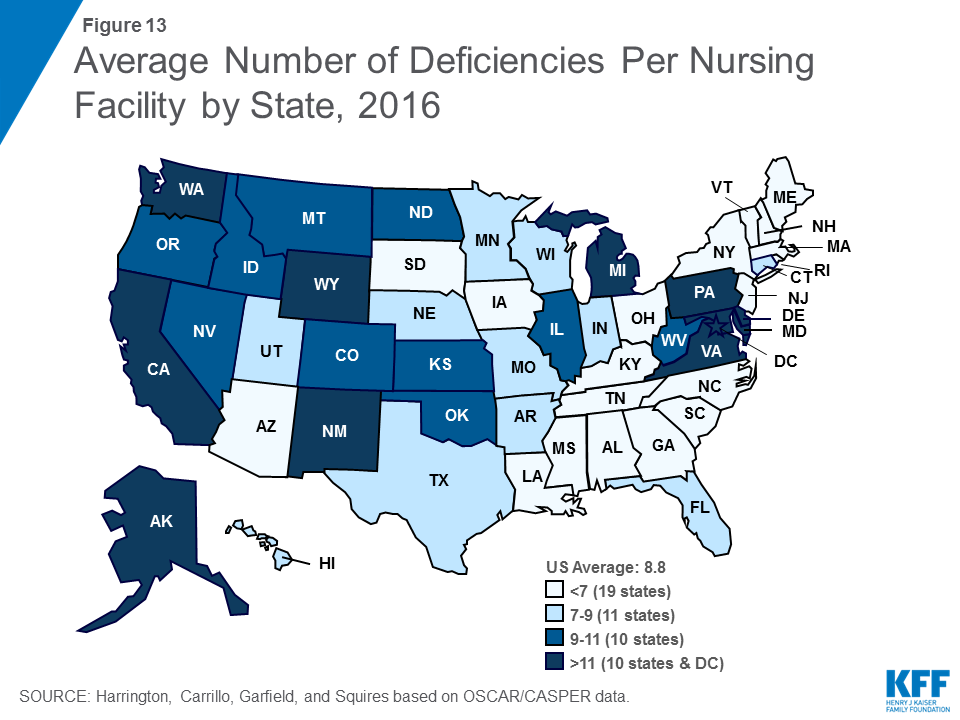
Some types of deficiency are more common than others. In 2016, the most common deficiencies were given for failures in infection control (45.4%); food sanitation (42.6%); accident environment (39.8%); quality of care (34.3%); and pharmacy consultation (26.8%) (Figure 14). (See Appendix for definitions of these types of deficiencies.) Again, there was variation across states in the share of facilities cited for different types of deficiencies (Table 11). However, some states had high rates across all top ten deficiencies, with the Alaska and Washington ranking in the top ten deficiency rate for eight deficiencies and California ranking in the top ten for seven. Additional detail on selected types of deficiencies by state over time is provided in the Supplemental Tables. In addition, the Supplemental Tables provide detailed data on all 175 deficiency types over time, grouped according to the eight categories established by CMS for the Medicare Nursing Home Compare 5-Star website Deficiency data: (1) quality of care; (2) mistreatment; (3) resident assessment; (4) resident rights; (5) environment; (6) nutrition; (7) pharmacy; and (8) administration.
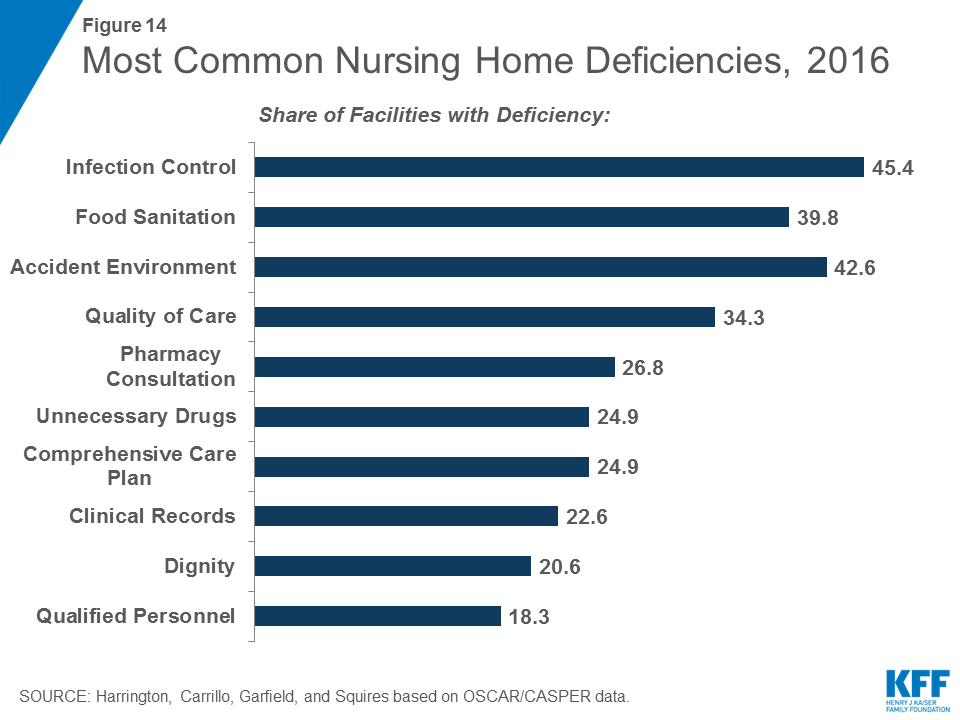
The federal OSCAR/CASPER system provides comprehensive information about nursing facility characteristics, resident characteristics and services provided, staffing, and deficiencies, which enables policymakers and the public to monitor and understand changes in nursing facility care in the United States. These survey findings are particularly important as policies are implemented to encourage improvements in the quality of nursing facility care.
Over the eight years included in this analysis, 2009 through 2016, nursing facility capacity has remained fairly flat, but occupancy rates have declined. This trend may reflect a shift from institutional to community-based long-term care. Home and community-based services have increased over the past decade due to the desire of long-term care users to stay in the community as well as the availability of new and expanded options for states to deliver these services through Medicaid, and this trend may continue in the future. However, overall demand for long-term care services may increase in coming years as the “baby boom” generation ages. The next few decades will require states and policy makers to determine sufficient capacity to accommodate long-term care user choice in both institutional and community-based settings.
As in the past, Medicaid remains the primary payer for most nursing facility residents. Medicare, the primary source of health coverage for the elderly, only covers short-stay nursing facility care following hospitalization, and few people have the personal resources to afford extended nursing facility care (which typically costs over $82,000 per year53 ) on their own. As the only major payer that covers this care, Medicaid is the long-term care safety net for millions of people who need such assistance. Medicaid’s large role in financing nursing facility care has made this service a priority policy area for state and federal governments that finance it. It is also one of the mechanisms that enables the federal government to enforce quality standards and accountability in nursing homes. Proposals to limit federal financing for Medicaid could have repercussions for states’ ability to maintain Medicaid spending for long-term services and supports. Given that nursing facility care is one of the costliest services in Medicaid, it is likely that spending in this sector would be subject to cuts if states faced more limited federal financing. For example, proposals that limit federal per enrollee spending growth for seniors to inflation (or an amount indexed to inflation) could lead states to limit eligibility for nursing facility care in an effort to keep Medicaid costs within federal limits.54
Continuing a trend that started before 2009, the share of nursing facilities that are for-profit or chain-owned continued to grow slightly from 2009 to 2016. These facility characteristics are important to policy makers and consumers because of their link to poorer quality of care. States vary in the distribution of facilities by ownership, so continued monitoring of facility ownership by states can help to ensure that a high quality of care is provided at these facilities.
As expected, many nursing facility residents need assistance with basic activities of daily living; however, notable shares have more extensive behavioral or physical health needs. In particular, nearly half of residents have dementia, and nearly a third have a psychological diagnosis. This pattern likely reflects the high need for care among people with these illnesses. However, nursing assistants who provide most of the care to these individuals often have limited training in working with this population. Some may interpret residents’ behavior as aggressive or have difficulty managing these residents’ needs. Despite regulations to limit the use of psychoactive medication unless such drugs are shown to be necessary for particular resident problems, a higher share of residents receives these medications than has a psychological illness, confirming several studies finding that some use is among residents with other cognitive problems such as dementia. This pattern may be indicative of nursing facilities lacking systematic plans to address the needs of residents with dementia or other cognitive impairments. The November 2016 regulations implement an ACA requirement that dementia management and resident abuse prevention training be a part of 12 hours per year in-service training for nurse aides. In addition, the regulations expand requirements limiting the use of anti-psychotic drugs to also include other psychotropic agents (such as antidepressants or antianxiety medication).
Despite a large body of research demonstrating a link between staffing levels and quality and outcomes of care, overall staffing levels are below some recommendations55 and are primarily filled by non-licensed nurses. The data in this report also show substantial state variation in staffing levels. Several factors could explain this state variation. Variation could reflect different Medicaid reimbursement rates across states, since some research has shown that low Medicaid rates are related to low staffing levels.56 ,57 ,58 However, other research points to state variation in staffing regulations as a key factor. For example, Harrington and colleagues59 found that although higher Medicaid reimbursement rates were related to higher staffing levels, minimum state staffing standards were a stronger predictor of higher staffing levels than reimbursement rates.
Last, the data show that nursing facility deficiencies have declined between 2009 and 2016, though there is still much state variation in rates of deficiencies. While voluntary guidelines for compliance programs have been in place for many years, the ACA authorized new, mandatory compliance programs to improve quality of care. Under the Quality Assurance and Performance Improvement (QAPI) program, the federal government will establish standards for such programs and provide technical assistance to meet these standards. All facilities (including chains) must submit a plan for how they will meet these standards. The regulations outlined standards for QAPI programs, building on existing requirements for quality assessment and assurance programs to address quality deficiencies. They also establish new requirements for food services and residents’ rights in nursing facilities, in part to address common deficiencies in these areas.
Moving forward, it will be important to continue to monitor nursing facility characteristics, residents’ needs, and staffing and deficiency reports to understand whether and how new requirements are affecting care and outcomes and to identify additional areas of concern for future policy changes.
Charlene Harrington and Helen Carrillo are with The University of California San Francisco and Rachel Garfield, MaryBeth Musumeci, and Ellen Squires are with the Kaiser Family Foundation.
Download Tables 1-11 (.pdf)
Table 1: Average Number Of Certified Beds Per Facility By State And Calendar Year
Table 2: Total Number Of Residents And Facility Occupancy Rates For Certified Nursing Facilities By State And Calendar Year
Table 3: Percent Of Certified Nursing Facility Residents By Primary Payer Source, By State And Calendar Year
Table 4: Number Of Certified Nursing Facility Residents With Medicaid As Primary Payer Source, By State And Calendar Year
Table 5: Percent Distribution Of Certified Nursing Facilities By Ownership Type, By State And Calendar Year
Table 6: Average Facility Scores* For Activities Of Daily Living In Certified Nursing Facilities By State And Calendar Year
Table 7: Average Licensed And Total Nurse Hours Per Resident Day In Certified Nursing Facilities By State And Calendar Year
Table 8: Average RN, LPN/LVN, & Assistant Hours Per Resident Day In Certified Nursing Facilities By State And Calendar Year
Table 9: Average Number Of Deficiencies Per Certified Nursing Facility And Percent Of Facilities With No Deficiencies By State And Calendar Year
Table 10: Percent Of Certified Nursing Facilities Receiving A Deficiency For Actual Harm Or Jeopardy Of Residents By State And Calendar Year
Table 11: Top Ten Deficiencies Nationwide For Certified Nursing Facilities By State In Calendar Year 2014
OSCAR/CASPER is an on-line data system from the Centers for Medicare and Medicaid Services (CMS). The OSCAR data for this report are for 2009-2011, and these data were converted to CASPER data in 2012-2016 for all facilities. The OSCAR/CASPER systems include data for all certified nursing facilities in the U.S. The data are collected in separate sets of files: (1) provider information, staffing data and health information on residents; and the (2) survey deficiencies. To create this report, the OSCAR/CASPER data from the annual surveys were combined with data from complaint surveys.
All nursing facilities federally certified for Medicare (skilled nursing care) and Medicaid (nursing facilities) and surveyed during the calendar year were included (about 15,400 to 15,600 facilities) in these data. Intermediate care facilities for people with intellectual and developmental disabilities (ICF-I/DD) were excluded because they use different federal certification forms and have different standards of care. Facilities located in the U.S. territories and Puerto Rico were excluded.
OSCAR/CASPER is a set of administrative databases that allow users to add, change, and delete data almost continually. These databases store no more than four standard surveys per provider. The system automatically deletes older surveys as new ones are entered. For these reasons, analysis of the same data elements may yield slightly different results depending upon the date the data are retrieved. Although facilities are surveyed every 9-15 months, this report used data during the calendar year only from both annual surveys and complaint surveys.60 Because data are overwritten in the database, OSCAR/CASPER data were retrieved twice a year and then merged to create the most complete file for each facility for each calendar year. This report uses deficiency data that were obtained from the annual surveys and all complaint surveys. This approach gives a complete picture of all deficiencies throughout the year rather than at the time of the annual survey. This report does not include the life safety code violations. Therefore, this report varies from the CMS Nursing Home Compendium, which only uses data from the annual surveys.61
This report presents calendar year data on nursing facilities, staffing, resident characteristics, and surveyor reports of quality deficiencies by state.
Every facility must have an initial survey to verify compliance with all federal regulatory requirements in order to be certified. Certified facilities are resurveyed no less often than every 15 months. Follow-up surveys may be conducted to ensure that facilities correct identified deficiencies. In addition, surveys are required when there are substantial changes in a facility’s organization and management. Finally, surveys may be conducted to investigate complaints about violations and poor care.
Nursing facility data are collected in two different ways. First, the facility characteristics, resident characteristics, and staffing levels are completed on standardized forms by individual nursing homes at the beginning of each survey and are certified by the facility as being accurate. State staff enters the data into a computerized OSCAR/CASPER system data.
Second, state surveyors make decisions regarding whether the facility has met or not met each standard after the facility survey has been completed. If a facility is judged to not meet a standard, the facility is given a deficiency indicating that the regulation was not met. Surveyors are also required to determine the scope and severity of each deficiency, and these are recorded as part of the process.
The survey evaluations are based upon data from a combination of sources including, but not limited to, the assessment of a selected sample of individual residents; interviews with a sample of residents, family members and staff; a review of the resident records and facility documents; and other data. After these judgments are made, state surveyors record and enter the data for each item into OSCAR/CASPER. Thus, determinations of deficiencies are made by state surveyors independent of the facility, with standard forms, sampling and survey procedures to ensure accuracy. Team members and state supervisors subsequently review state surveyor deficiencies. Facilities have the option to challenge and appeal deficiency decisions through administrative review procedures.
Because of these checks in the system, the likelihood of false positive deficiencies is low, and errors tend to be in under-reporting of failures to meet standards.63 ,64 ,65 ,66 ,67 ,68 ,69 ,70 ,71 ,72 Thus, a note of caution is needed that under-reporting of deficiencies is more likely to be a problem than over-reporting.
The Centers for Medicare & Medicaid Services (CMS) uses “front-end” edit screens to ensure the accuracy of the OSCAR/CASPER data. State staff enter the data for each survey item into the OSCAR/CASPER data set within 45 days of each survey, leading to time delays in obtaining the data.
One concern about the OSCAR/CASPER data has been with survey reliability (both across and within states) in judging the quality of facilities.73 These issues have been addressed over time by CMS with its survey process. First, the procedures require some accuracy checks by surveyors.74 CMS provides federal training for new state surveyors. Recently, CMS has been testing ways to improve the efficiency and effectiveness of the process using a new Quality Indicator Survey (QIS) in comparison to the traditional procedures that are used.75 In addition, CMS uses federal survey teams from the regional offices to conduct periodic oversight surveys of state agencies. States that fall below the concurrence standards established by CMS are critiqued and monitored by CMS.
Even though CMS has made efforts to standardize the reporting of deficiencies by state survey staff, regional variations in issuing deficiencies continue and enforcement procedures have been inconsistent and ineffective.76 ,77 ,78 ,79 ,80 ,81 ,82 ,83 ,84 ,85 ,86 ,87 ,88 Problems have also been found with the complaint investigation process, 89 ,90 ,91 ,92 and quality of care problems continue to exist in nursing facilities.93 ,94 In spite of the improvements that have been made, there is a need to further improve both the state survey process and the enforcement system. Staff turnover and recruitment problems and fiscal problems at the state agency level may hamper survey and enforcement efforts.95 ,96 ,97
In preparing the data for this report, discussions were held with CMS officials as necessary to discuss data acquisition, formatting, and cleaning issues. Frequency distributions were developed for all the indicators on the data set and a series of cleaning activities undertaken.
The first step in cleaning was to eliminate any duplicate provider records. Duplicate records were considered generally to be the result of changes in certification for Medicare and Medicaid (Title VIII/XIX) facilities or Medicare only (Title XVIII) facilities. Since 1990, because of the OBRA 1987 legislation, Medicaid only (Title XIX) SNF and ICF facilities are certified together as nursing facilities (NFs). With this change, some problems with duplicate SNF and ICF reporting were essentially eliminated.
To correct the duplicate problems, we identified all those facilities showing identical values for the following areas: state, city, facility name, and facility address. Where duplicate records were identified, a decision-making procedure was invoked as follows:
(1) The most recent record within a calendar year was selected over earlier records; and
(2) A record reporting a category of either: (01) skilled nursing facility (SNF) — Medicare participation; (02) nursing facility (NF) — Medicaid participation; or (03) SNF/ICF — Medicare/Medicaid participation was selected over facilities reporting as (10) hospital based.
For those remaining facilities with the same name and/or address, data on telephone numbers and survey data were then examined. Where there appeared to be two facilities at one site with different data, neither facility was eliminated. This overall process resulted in dropping about 100 facilities annually prior to 2012. Fewer duplicates were found among the CASPER records each year since 2011.
The data were examined for missing values and gross errors. Means and standard deviations of the data were computed and examined. Logic checks confirming the reasonableness of data were conducted. Preliminary work identified some missing data and errors, primarily in reporting the beds, staffing and the number of residents. Each problem area and the cleaning procedures are discussed below.
During the preliminary work, the total number of beds in each state reported on OSCAR/CASPER was compared to the total licensed bed supply for each state from an independent survey of states. The total number of beds reported by facilities was significantly higher than the total licensed beds in the U.S. An analysis of this discrepancy found that some hospital-based facilities had reported the total number of acute care beds rather than the total number of skilled nursing beds for their facility. To correct this error, the maximum number of beds for a hospital-based facility was set to equal the maximum number of certified skilled nursing beds in the facility. This process made the total certified nursing facility beds more comparable to the total state licensed nursing facility beds in each state.
Several problems concerning resident data were detected. First, some facilities had missing data for their total number of residents. These facilities were left in the data set, but where resident data were not available, these facilities were not included in the tables reported.
Second, some facilities reported extremely low numbers of residents. In order to identify facilities with possible errors in reporting residents, occupancy rates were computed for all nursing facilities. Free-standing (non-hospital based) facilities reporting 50 or fewer residents than total beds were considered to have erroneous data and were eliminated from the staffing and resident characteristics’ analysis.
Third, some facilities reported more residents than beds, suggesting more than 100 percent occupancy. Hospital-based facilities may have had approval for swing beds, which would allow the hospital to use an acute care bed for a nursing facility resident. Therefore, hospital-based facilities with more residents than beds were left in the data set, but the maximum occupancy rate for such facilities was reported to be 100 percent. Finally, facilities with numbers of residents reported at greater than 100 percent of total beds, which were not hospital-based, were dropped from the analysis.
Minimum Data Set (MDS) assessments are required for all residents in nursing facilities on a periodic basis and are used to describe resident characteristics. The first MDS assessments were developed and implemented and sent to CMS electronically.98 Over time the MDS was improved using the revised MDS 2.0.99 In 2011, CMS implemented an improved MDS 3.0 version.100 ,101 These data are used by nursing facilities for quality improvement and by CMS to create quality measures.
The MDS is also used by Medicare and many state Medicaid programs to take resident casemix into account in reimbursement rates.102 The Medicare developed resource utilization groups (RUGS) to measure case mix and to estimate the amount of staffing time needed to care for residents in each RUG category.103 ,104 ,105 The MDS and RUGs data are separate from the OSCAR/CASPER data and not shown in this report.
This OSCAR/CASPER report has summary data on residents at the facility level describing the residents’ need for assistance with activities of daily living (ADL). Two types of summary data are presented. First, a simple summary of three major activities of daily living (ADLs) was compiled. The facilities were asked to rate each resident’s ADLs on a scale of 1 to 3 from “needs little or no assistance” to “needs extensive assistance.” The three ADL scores were for those residents who needed assistance in: (1) eating, (2) toileting, and (3) transferring. A score of 1 was assigned to residents who were independent. A score of 2 was assigned to those that needed some supervision. A score of 3 was assigned to those who were dependent.
Each ADL score was multiplied by the number of residents in that category for each facility. An average composite score was developed by adding each of the three scores together and dividing by the total number of residents in the facility to compute each facility’s index score. Thus, a summary case mix score ranging from 3-9 was compiled for each facility based on resident ADL characteristics. Individual facility scores were then summarized for each state.
Finally, the report shows resident needs for more advanced care including the: percent of clients receiving special treatments (injections, ostomy care, IV feedings, tube feedings, or suctioning), and percentage with organic psychiatric or other psychiatric conditions. Other characteristics included are the percentage who receive psychotropic drugs and who have pressure ulcers, contractures, incontinence, or catheters.
Nursing personnel in nursing facilities were of particular interest for this report. Nursing personnel included: registered nurses (RNs); licensed practical/ vocational nurses (LPN/LVNs), and nursing aides/orderlies/ assistants (NAs). Staffing hours (including full-time, part-time, and contract staff) are reported by facilities as total hours worked in a fourteen-day period. The staff time includes all administrative and direct care time. To compute the staffing ratios for this report, the total number of staffing payroll hours reported in a two-week period was divided by the total number of residents and by the 14 days in the reporting period. For this report, the total hours of staffing per resident day were examined for all dually certified facilities (Title XVIII/XIX), for Medicare-only facilities (Title XVIII), and for Medicaid-only facilities (Title XIX). It should be noted that the reported staffing ratios reflect reported hours per resident day and not the actual hours of care delivered directly to residents. In the future, CMS plans to require payroll data for reporting staffing in nursing facilities, which should increase the accuracy for staffing data.106
There were a number of problems identified with the facility staffing data. Some facilities reported extremely high staff hours per resident day while others reported no registered nurses or no nursing staff hours. Where a facility reported nurse staffing hours per resident day that did not fall within a reasonable range, the data for that item were considered invalid. The following uniform decision-making rules were created for eliminating facility staffing data which clearly appeared to be too high or too low:
First, facilities with average nursing hours per resident day that were greater than 24 hours of nursing per resident were considered erroneous and eliminated from the analysis. Distributions of the nursing hours per resident were then examined.
To correct further for staffing levels that were unreasonably high, facilities reporting staffing hours per resident day in the upper 2 percent by type of facility (separately for Medicaid only and for Medicare only/dually certified) and by type of staff (RN, LVN/LPN, and nursing assistants) were eliminated from the staffing analysis.
Facilities reporting extremely low staffing hours per resident day were identified. Since some Title XIX facilities and Title XVIII/XIX facilities were given federal waivers from the staffing requirements, these facilities may have few or no RN staff.
Since all facilities are required to have some licensed nurses, nursing facilities with no licensed staff (RNs and/or LVN/LPNs) and/or no nursing staff were eliminated from these analyses. In addition, facilities with computed staffing levels lower than 1 percent for licensed or combined nursing personnel for each type of facility (separately for Medicaid only and for Medicare only and/or dually certified) were removed from the staffing report because some of these may have been erroneous.
Other reporting errors in staffing data may occur. For example, facility errors in the reporting of time periods may have occurred or rounding errors may have occurred. These types of errors cannot be detected in the data set. Thus, because further accuracy checks could not be conducted, only the high and low outlier facilities were removed from the tables on staff.
RNs, LPN/LVNs, and Aides are presented separately. Total licensed nurses are also presented; these include RNs and LPN/LVNs added together. Total combined nursing personnel are included as combined RNs, LPN/LVNs, and nursing aide hours.
State surveyors assess both the process and the outcomes of nursing home care in 8 categories: administration, environment, mistreatment, nutrition, pharmacy, quality of care, resident assessment, and resident rights. Each of these categories has specific regulations that state surveyors review to determine whether or not facilities have met the standards. Each of the specific requirements that goes into a deficiency area has a measurement and an identifying number (F-tag). In July 1995, the federal government consolidated the 325 measures of quality to about 185 measures, and additional standards have been consolidated over time, so this report includes data for about 175 F-tags. Some of the definitions of requirements have changed over time. A detailed list of all the F-tags and longer descriptions are shown in the Supplemental Tables. Detailed definitions of deficiencies are given in the CMS State Operations Manual.107
Where a facility fails to meet a requirement, a deficiency or citation is given to the facility for that individual requirement. The deficiencies are given for problems that can result in a negative impact on the health and safety of residents. Since 1995, surveyors have rated each deficiency based on scope and severity for purposes of enforcement. The deficiencies rated as causing actual harm or immediate jeopardy are the most serious (rated at a G level or higher).108
The tables in this report and in the Supplemental Tables include information for the following deficiencies:
Nursing facilities are one part of the long-term care delivery system that also includes home and community based services, but their relatively high cost has led them to be the focus of much attention from policymakers. Medicaid plays a major role in financing nursing facility care in the United States, and policy proposals to limit federal financing for Medicaid may lead to cuts in eligibility or scope of coverage for long-term care services. In addition, regulations effective November 2016 aimed to address longstanding challenges in quality and safety in nursing facilities. As the demand for long term care continues to increase and policy proposals and regulations unfold, the characteristics, capacity, and care quality of facilities remain subjects of concern among consumers and policy makers.
These tables provide information on recent trends in nursing facilities in the United States, drawing on data from the federal On-line Survey, Certification, and Reporting system (OSCAR) and Certification and Survey Provider Enhanced Reports (CASPER), to provide information on nursing facility characteristics, resident characteristics, facility staffing, and deficiencies by state from 2009 through 2016. The accompanying report, Nursing Facilities, Staffing, Residents and Facility Deficiencies, 2009 Through 2016, analyzes recent trends and discusses findings in light of recent policy debates and developments. These tables provide additional detail on the information presented in the report. For more information on the surveys and methods underlying the data in this report, see the Appendix at the end of the main report.
Supplemental Tables (.pdf)
Table 1: Total Number of Certified Nursing Facilities by State and Calendar Year
Table 2: Total Number of Certified Nursing Facility Beds by State and Calendar Year
Table 3: Average Number of Certified Beds Per Facility by State and Calendar Year
Table 4: Total Number of Residents and Facility Occupancy Rates for Certified Nursing Facilities by State and Calendar Year
Table 5: Percent of Nursing Facility Beds by Certification Category, by State and Calendar Year
Table 6: Percent of Certified Nursing Facility Residents by Primary Payer Source, by State and Calendar Year
Table 7: Percent Distribution of Certified Nursing Facilities by Ownership Type, by State and Calendar Year
Table 8: Percent Distribution of Certified Nursing Facilities by Affiliation, by State and Calendar Year
Table 9: Percent of Certified Nursing Facilities with Resident Groups and Family Groups by State and Calendar Year
Resident Characteristics
Table 10: Average Facility Scores for Activities of Daily Living in Certified Nursing Facilities by State and Calendar Year
Table 11: Percent of Residents in Certified Nursing Facilities who are Bedfast or Chairbound by State and Calendar Year
Table 12: Percent of Residents in Certified Nursing Facilities with Contractures or Physical Restraints by State and Calendar Year
Table 13: Percent of Residents in Certified Nursing Facilities Receiving Psychoactive Medication or Having Mental Retardation by State and Calendar Year
Table 14: Percent of Residents in Certified Nursing Facilities with Dementia or Other Psychological Diagnoses by State and Calendar Year
Table 15: Percent of Residents in Certified Nursing Facilities with Pressure Sores or Receiving Special Skin Care by State and Calendar Year
Table 16: Percent of Residents in Certified Nursing Facilities Receiving Rehabilitation or Ostomy Care by State and Calendar Year
Table 17: Percent of Residents in Certified Nursing Facilities Receiving Injections or Intravenous Therapy by State and Calendar Year
Table 18: Percent of Residents in Certified Nursing Facilities Receiving Tube Feeding or Respiratory Treatment by State and Calendar Year
Table 19: Percent of Residents in Certified Nursing Facilities with Bladder Incontinence or in Bladder Training Program by State and Calendar Year
Table 20: Percent of Residents in Certified Nursing Facilities with Bowel Incontinence or in Bowel Training Program by State and Calendar Year
Table 21: Percent of Residents in Certified Nursing Facilities with Indwelling Catheters by State and Calendar Year
Facility Staffing
Table 22: Average RN, LPN/LVN, & Assistant Hours Per Resident Day in Certified Nursing Facilities by State and Calendar Year
Table 23: Average Licensed and Total Nurse Hours Per Resident Day in Certified Nursing Facilities by State and Calendar Year
Deficiencies
Table 24: Average Number of Deficiencies Per Certified Nursing Facility and Percent of Facilities with No Deficiencies by State and Calendar Year
Table 25: Percent of Certified Nursing Facilities Receiving a Deficiency for Actual Harm or Jeopardy of Residents by State and Calendar Year
Table 26: Top Ten Deficiencies Nationwide for Certified Nursing Facilities by State in Calendar Year 2014
Table 27: Deficiency Group Mistreatment: Physical Restraints (F221) by State and Calendar Year
Table 28: Deficiency Group Resident Rights: Dignity (F241) by State and Calendar Year
Table 29: Deficiency Group Quality of Care: Activities Program (F248) by State and Calendar Year
Table 30: Deficiency Group Environment: Housekeeping (F263) by State and Calendar Year
Table 31: Deficiency Group Quality of Care: Activities of Daily Living Services (F312) by State and Calendar Year
Table 32: Deficiency Group Quality of Care: Pressure Sores (F221) by State and Calendar Year
Table 33: Deficiency Group Quality of Care: Urinary/Incontinence Care (F315) by State and Calendar Year
Table 34: Deficiency Group Quality of Care: Limited Range of Motion Services (F318) by State and Calendar Year
Table 35: Deficiency Group Environment: Accident Environment (F323) by State and Calendar Year
Table 36: Deficiency Group Quality of Care: Nutrition (F325) by State and Calendar Year
Table 37: Deficiency Group Quality of Care: Sufficient Nursing Staff (F353) by State and Calendar Year
Table 38: Deficiency Group Nutrition: Food Sanitation (F371) by State and Calendar Year
Table 39: Percent of Certified Nursing Facilities in the U.S. with Deficiencies for Quality of Care by Calendar Year
Table 40: Percent of Certified Nursing Facilities in the U.S. with Deficiencies for Mistreatment and Resident Assessment by Calendar Year
Table 41: Percent of Certified Nursing Facilities in the U.S. with Deficiencies for Resident Rights by Calendar Year
Table 42: Percent of Certified Nursing Facilities in the U.S. with Deficiencies for Environment by Calendar Year
Table 43: Percent of Certified Nursing Facilities in the U.S. with Deficiencies for Nutrition and Pharmacy by Calendar Year
Table 44: Percent of Certified Nursing Facilities in the U.S. with Deficiencies for Administration by Calendar Year
Nine in 10 enrollees in the non-group market say they intend to continue buying their own insurance even after being told that Congress has repealed the individual mandate penalty for not having coverage as of 2019, according to a new survey by the Kaiser Family Foundation. The survey finds the mandate, part of the Affordable Care Act, ranks low among the reasons people give for buying their own insurance in 2018.
The survey also finds a lack of awareness about the status of the mandate penalty, with 1 in 5 non-group enrollees (19%) saying they are aware the penalty has been repealed but is still in effect for this year. The mandate continues to rank far down on a list of “major reasons” people give for buying their own insurance, below reasons such as protecting against high medical bills (75%), peace of mind (66%), or because they or a family member has an ongoing health condition (41%).
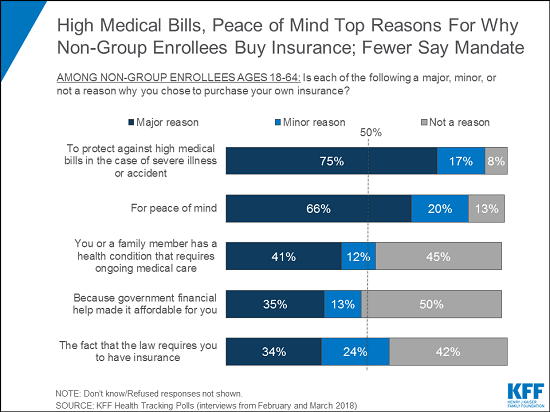
At a time when the ACA is often labeled as “failing” by its critics in Congress and the Trump administration, the survey also finds that about half of the public say they believe the ACA marketplaces are “collapsing” (53%, up from 42% in January) — including 6 in 10 who purchase insurance through the marketplaces. Across party identification and insurance type, more say the marketplaces are collapsing than say the marketplaces are not collapsing. Recent figures show that insurers in the marketplaces are now turning a profit, but repeal of the individual mandate penalty and other policy changes put forth by the Trump administration would create greater volatility next year.
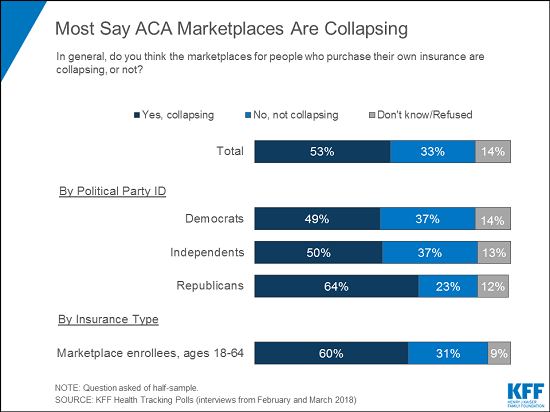
In addition, the poll finds at least half of non-group enrollees in general and marketplace enrollees specifically are worried about the future of health insurance availability and costs in their areas. Fifty-one percent of all non-group enrollees and 58 percent of marketplace enrollees say they are “very worried” or “somewhat worried” there will be no insurance companies left selling plans in their area in the future, and similar shares worry that their current insurance company will stop selling plans in their area (49% and 58%, respectively).
Despite Overall Pessimism About The Future of the ACA Marketplaces Generally, Most Say Their Premiums Have Not Increased and Are Satisfied with Available Options
When asked about their own experience, however, most marketplace enrollees say their premiums have not gone up in 2018. One-third (34%) say their premiums are “about the same” as last year and a fourth (23%) say their premiums went down, while four in ten (42%) say their premiums have increased. These breakdowns are similar to the share of the overall non-group market who say their premiums have increased (46%), stayed the same (35%), or decreased (18%).
In the marketplaces, this is likely attributable to the federal tax credits most enrollees receive to help cover premium costs and protect against steep increases. It also may reflect a “silver loading” strategy in which many states, concerned about the possibility of large premium hikes due to the loss of federal cost-sharing reduction payments, concentrated insurers’ premium increases on the silver benchmark plans that help determine the level of federal financial assistance available to enrollees.
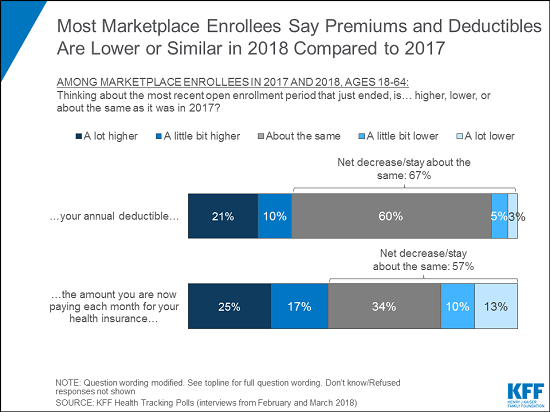
The majority of marketplace enrollees (60%) say their deductibles are about the same as last year. Three in ten saw an increase in their deductibles and few (8%) say they experienced a decrease.
In addition, a majority of marketplace enrollees (61%) say they were satisfied with their insurance options for 2018 and most (68%) said they did not experience problems during the open enrollment period.
Few Non-Group Enrollees Say They Would Prefer Short-Term Insurance Plans
The survey also finds little appetite among current marketplace enrollees for the non-renewable short-term insurance plans that President Trump has recently sought to expand access to through an executive order and newly proposed regulations. Such plans tend to cost less than ACA plans but provide fewer benefits, and are exempt from ACA requirements that insurers accept all applicants and cover pre-existing conditions.
When asked whether they would want to purchase such a plan or keep the plan they have now, the vast majority of non-group enrollees (84%) say they would keep the plan they have now, while 12 percent would want to purchase a short-term plan. Responses were similar among individuals living in households both with and without pre-existing conditions.
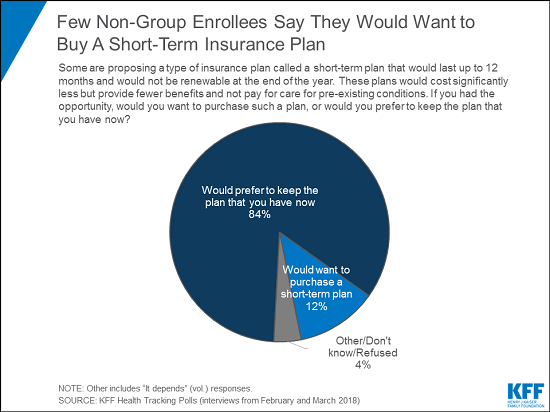
The new survey examines people’s experiences with the current health insurance market focusing on individuals who have health insurance they purchased themselves in the non-group market. It also compares the experiences of these individuals to those people who get their insurance through their employer as well as those who do not have health insurance coverage.
The survey was designed and analyzed by researchers at KFF. Telephone interviews were conducted from February 15-20 and March 8-13 among a nationally representative random sample of 2,534 adult U.S. residents (882 via landline and 1652 via cell phone), including an oversample of respondents who purchase their own insurance (Non-Group Enrollees). The margin of sampling error is plus or minus 2 percentage points for the full sample, plus or minus 7 percentage points for all non-group enrollees, and plus or minus 9 percentage points for marketplace enrollees. For other subgroups, the margin of sampling error may be higher.