Views and Experiences with End-of-Life Medical Care in the U.S.
Overview
In partnership with The Economist, the Kaiser Family Foundation conducted a cross-country survey of adults in the United States, Italy, Japan, and Brazil about people’s views and experiences related to aging and end-of-life medical care. These four countries are each at different stages of population aging, and have different cultural and institutional considerations when it comes to preparing and providing care for those near the end of life.
This report gives an overview of the survey results for the U.S. A summary report comparing themes across the four countries and highlighting specific findings in Japan, Italy, and Brazil is available here.
Coverage from The Economist
Findings
Key Findings
Views on the Aging Population
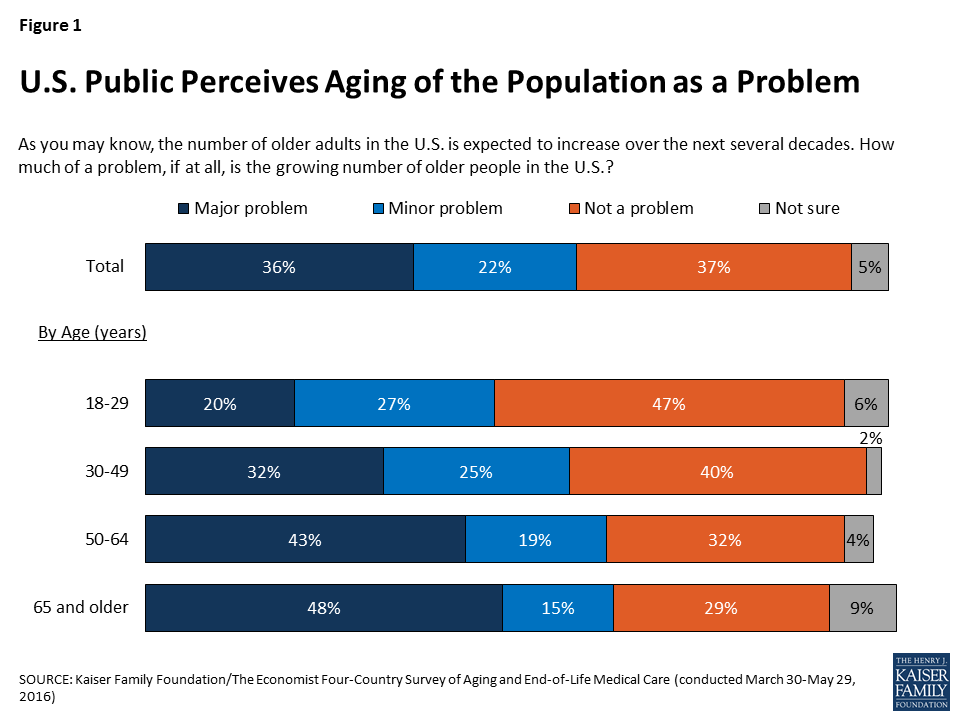
In 2014, Americans ages 65 and older made up 15 percent of the total U.S. population; by 2060, that share is projected to grow to 24 percent.1 A majority of Americans (57 percent) believe the growing number of older people in the U.S. is a problem for the country, including a third (36 percent) who see it as a major problem. Older Americans themselves are more likely to see the aging of the population as a problem; six in ten (62 percent) of those ages 65 and over see it as a problem, including half (48 percent) who believe it is a major problem.
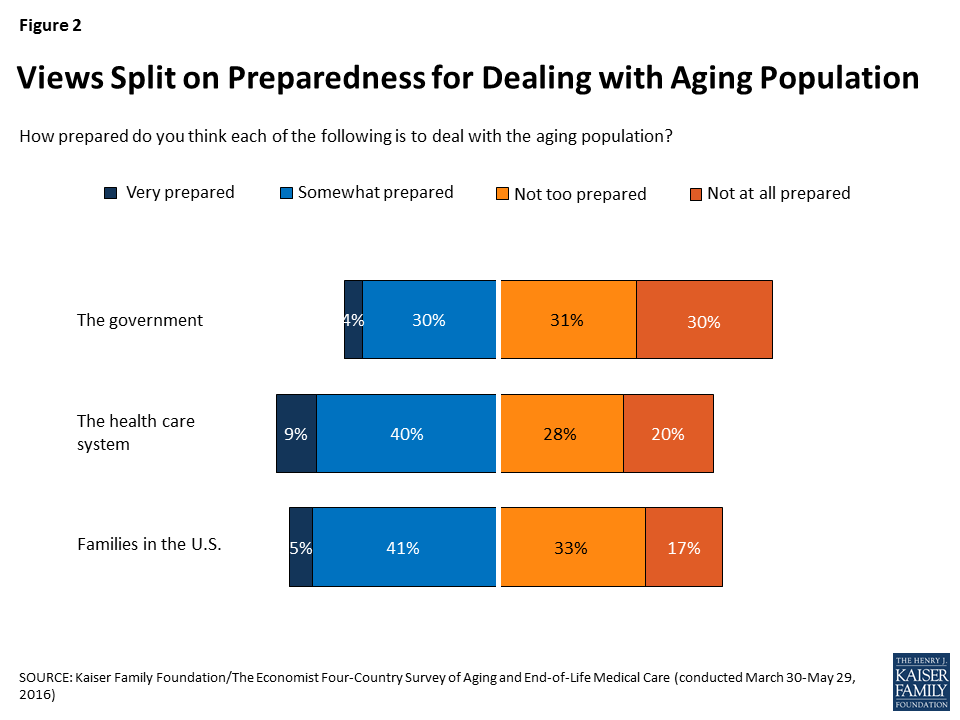
A majority (62 percent) of U.S. adults say the government is “not too prepared” or “not at all prepared” to deal with the aging population, while a third (35 percent) say it is “very” or “somewhat” prepared. Americans are more split on whether the health care system and families in the U.S. are prepared to deal with the aging population, with about half saying each is prepared and the other half saying they are not.
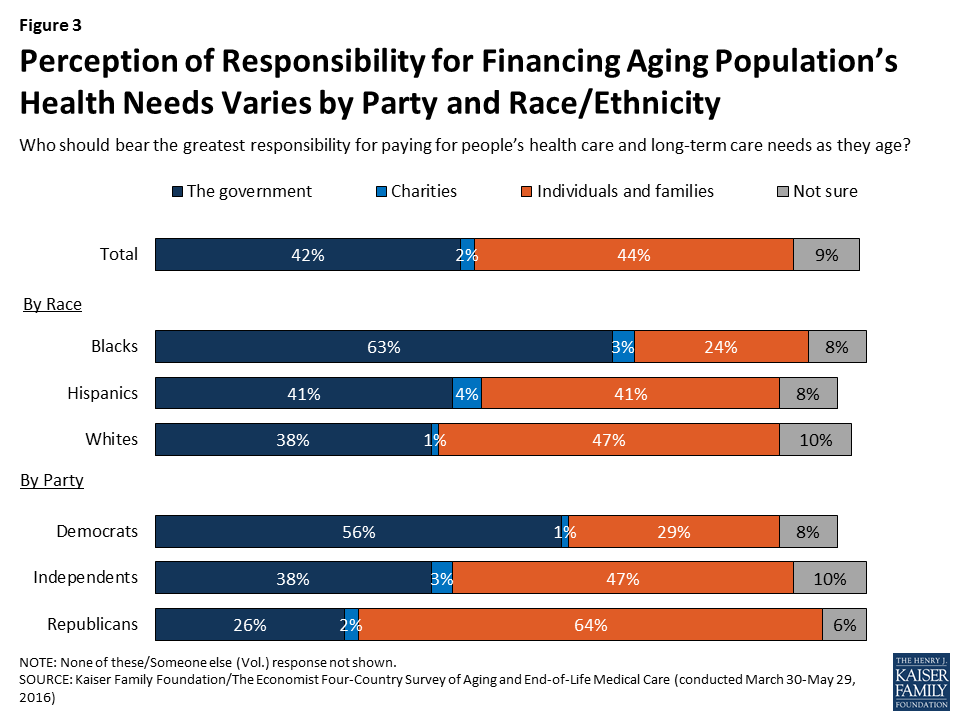
When asked who should bear the greatest responsibility for paying for people’s health care and long-term care needs as they age, Americans are fairly evenly divided between those who believe individuals and families should bear the biggest burden (44 percent) and those who place this responsibility on the government (42 percent). This stands in sharp contrast to other countries surveyed (Italy, Japan, and Brazil), where majorities place the responsibility squarely on the government. Reflecting usual partisan preferences and demographic differences within the U.S., Democrats and African Americans are more likely to believe the government should have the main responsibility to pay for care for the aging population’s health, while Republicans and whites are more likely to see it as a responsibility for individuals and families.
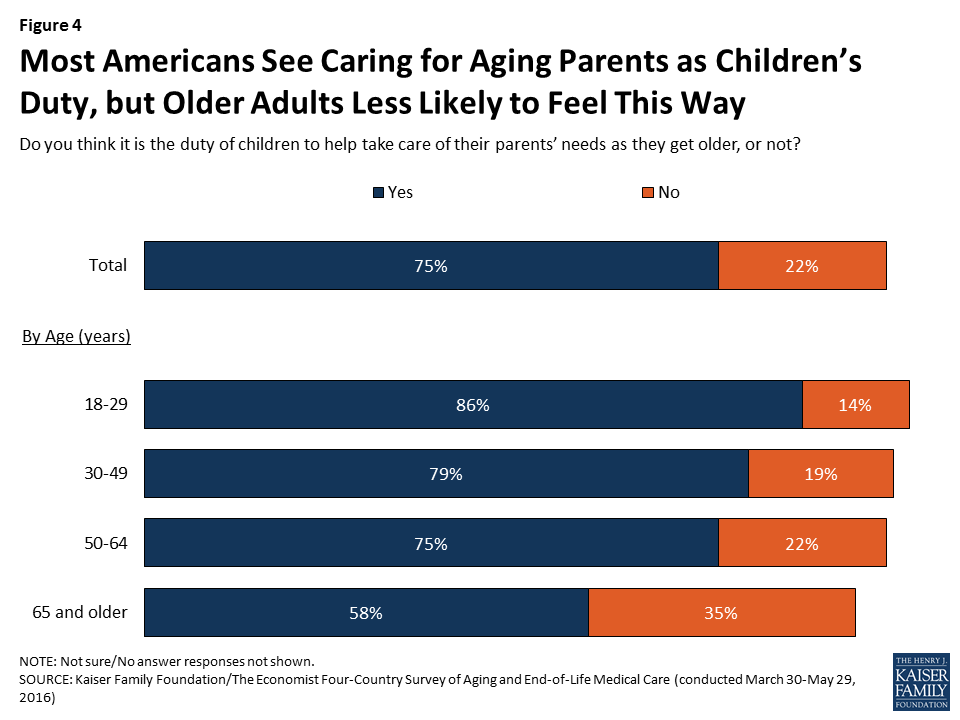
Outside of the financial responsibility, families are seen as having a major role to play in helping older adults. Three-quarters of Americans say it is the duty of children to help take care of their parents’ needs as they get older. Older adults themselves are somewhat less likely to feel this way compared with younger Americans (58 percent of those ages 65 and over, compared with at least three-quarters in younger age groups).
Rating the Current System for End-of-Life Care
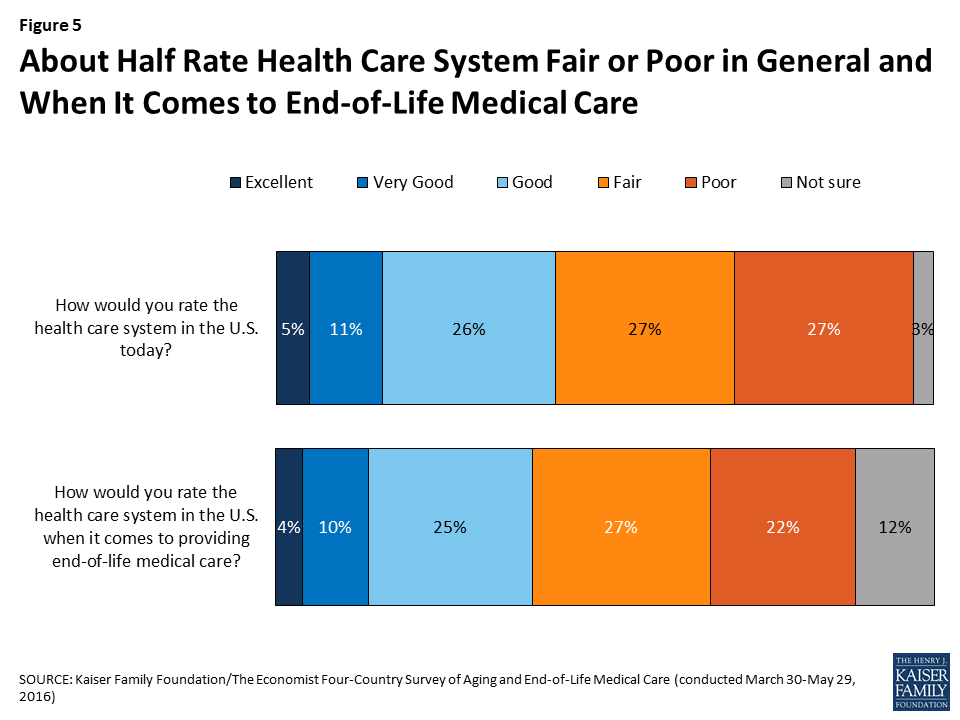
Americans do not give their health care system high marks in general, or when it comes to providing end-of-life care. About half (54 percent) give the U.S. health care system a rating of “fair” or “poor” overall, while a quarter (26 percent) rate it as “good” and 16 percent say it is “excellent” or “very good.” Responses are similar when the public is asked to rate the health care system specifically when it comes to providing end-of-life medical care (49 percent say it is fair or poor, and just 14 percent say it is excellent or very good).
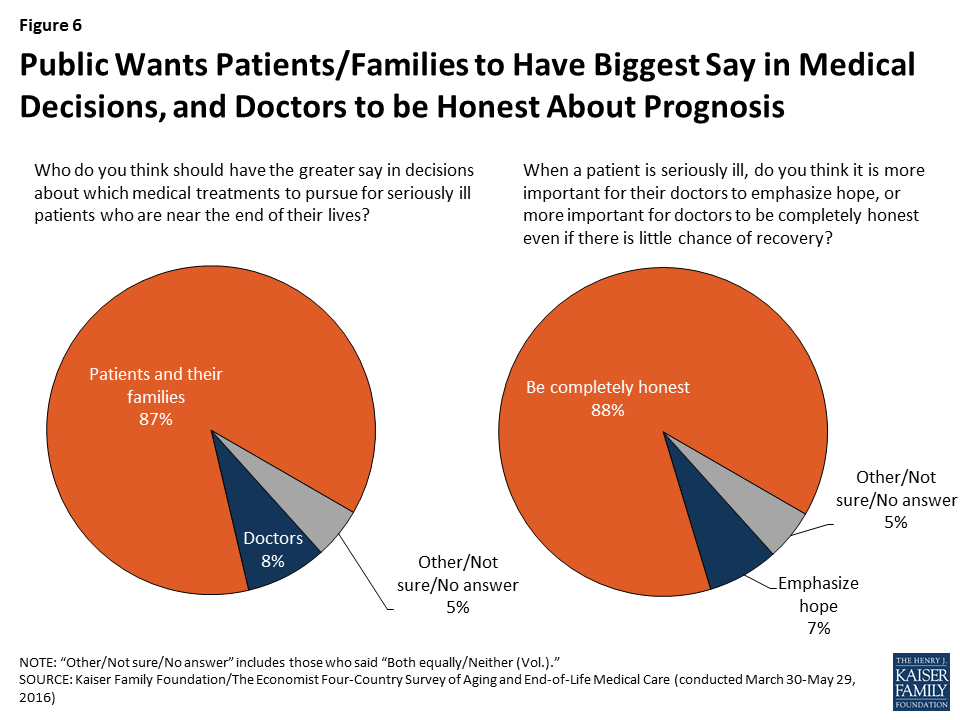
A large majority (87 percent) believe that patients and their families should have the greater say in which treatment options to pursue for patients who are seriously ill and nearing the end of life, while just 8 percent believe doctors should have the greater say. Americans also prefer honesty from their health care providers, no matter what the prognosis. Just 7 percent say that when a patient is seriously ill, it is more important for their doctors to emphasize hope, while the vast majority (88 percent) say it is more important for doctors to be completely honest even if there is little chance of recovery.
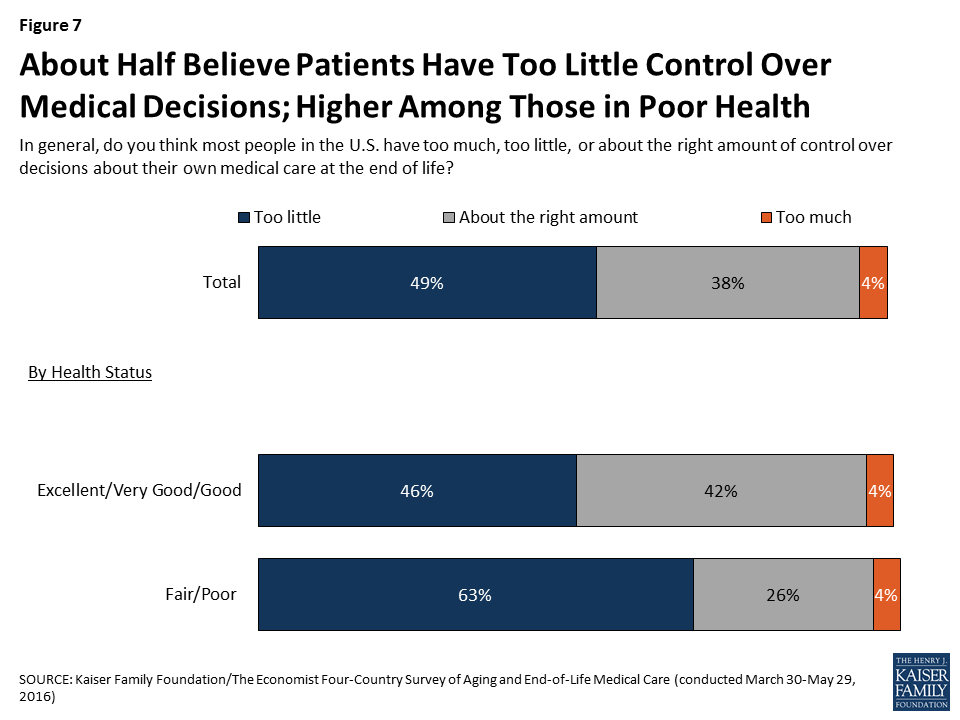
However, the public sees room for improvement when it comes to giving patients control over end-of-life medical decisions. About half (49 percent) believe most people in the U.S. have too little control over decisions about their own medical care at the end of life, while four in ten (38 percent) feel patients have about the right amount of control and just 4 percent say they have too much. Among those who say their own health is only fair or poor, an even higher share (63 percent) say most people in the U.S. have too little control.
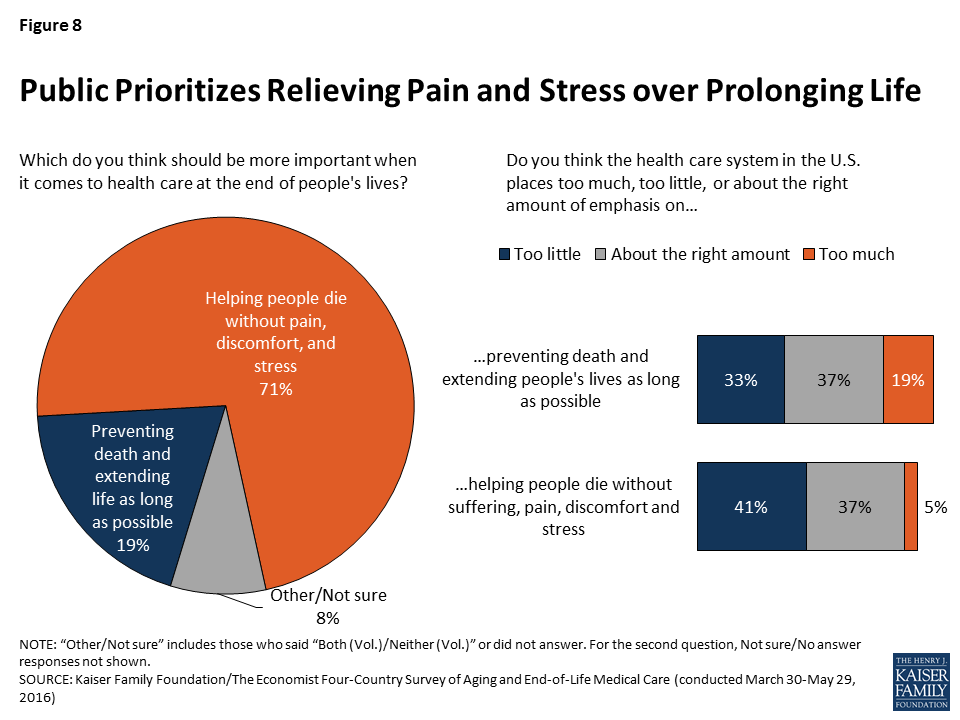
When asked which should be more important when it comes to health care at the end of people’s lives, seven in ten Americans (71 percent) choose “helping people die without pain, discomfort, and stress,” while one in five (19 percent) choose “preventing death and extending life as long as possible.” When asked to rate the U.S. health care system on each of these dimensions, about four in ten (37 percent each) say the current system places about the right amount of emphasis on each of these areas. However, four in ten (41 percent) say the system places too little emphasis on helping people die without pain, discomfort, and stress, and a third (33 percent) say it places too little emphasis on extending life. While very few (5 percent) say the system places too much emphasis on reducing pain and discomfort, roughly one in five (19 percent) say it places too much emphasis on extending life.
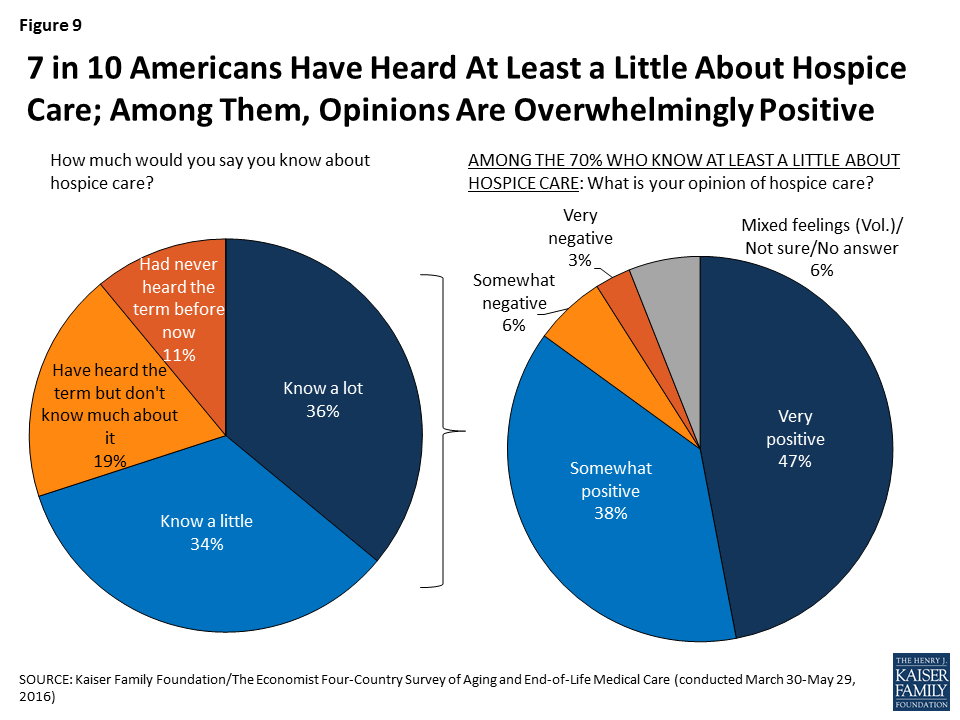
Hospice care is an option for many in the U.S. who are nearing the end of life and prefer a focus on relief of pain and suffering. Americans’ awareness of hospice care is fairly robust, and opinions of hospice care are overwhelmingly positive among those who have heard at least something about it. Seven in ten U.S. residents say they know at least a little about hospice care, including about a third (36 percent) who say they know “a lot.” About one in five (19 percent) say they’ve heard of hospice care but don’t know much about it, while one in nine say they had not heard the term before the survey. Among the 70 percent who say they know at least a little about hospice, a large majority (85 percent) say they have a positive opinion of hospice care, including almost half (47 percent) who say their opinion is very positive; just one in ten (9 percent) say they have a negative opinion of hospice care. One in five (20 percent) say that someone in their household has had an experience with hospice care in the past year, and among this group 87 percent say they have a positive opinion of hospice, including 58 percent who have a very positive opinion.
What People Want for Their Own Death
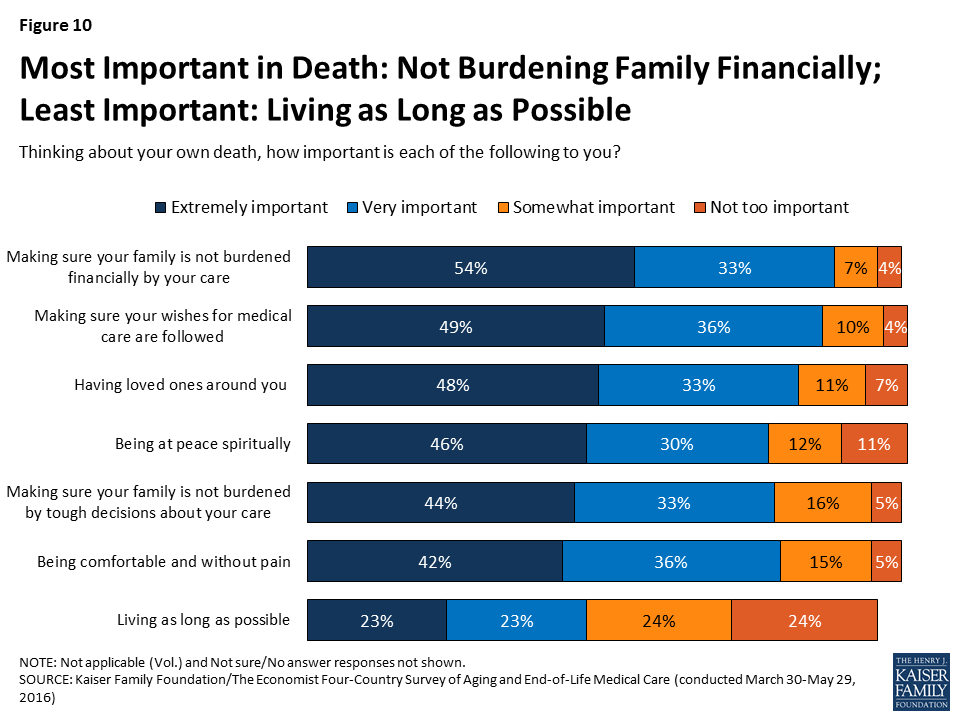
When asked what is most important in thinking about their own death, a variety of factors are rated as important by large shares of Americans. At the top of the list, just over half (54 percent) say that making sure their family is not burdened financially by their care is “extremely” important. About half also say making sure their wishes for medical care are followed (49 percent), having loved ones around them (48 percent), and being at peace spiritually (46 percent) are extremely important. Roughly four in ten say the same about making sure their family is not burdened by tough decisions about their care (44 percent) and being comfortable and without pain (42 percent). At the bottom of the list, a quarter (23 percent) say that living as long as possible is extremely important to them.
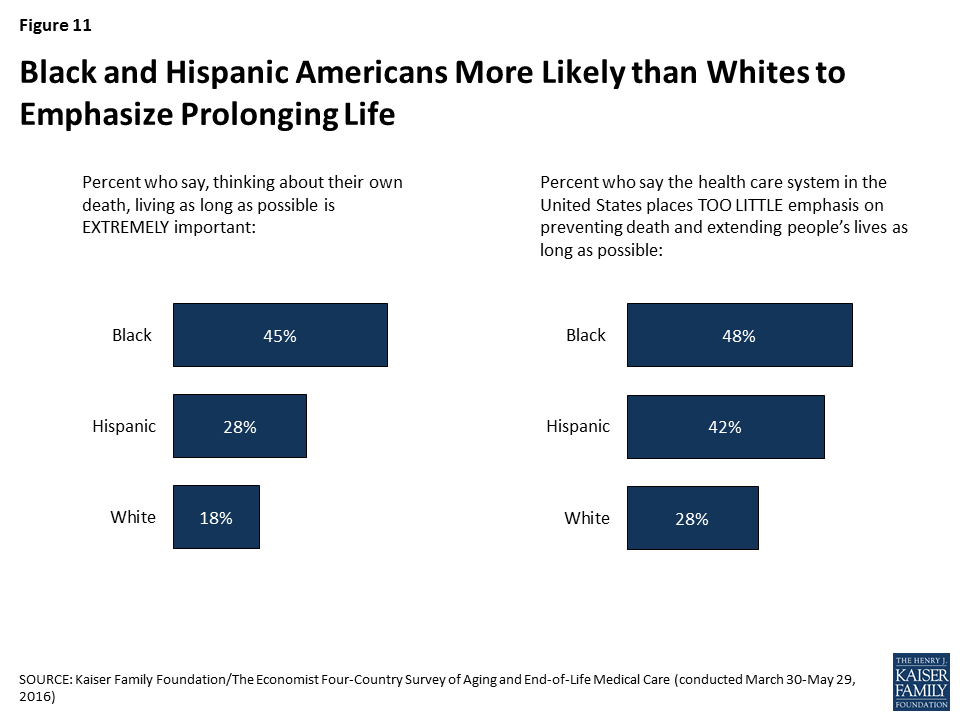
While the ranking of these factors is mostly similar across age and other demographic groups, some differences in the shares saying each factor is important emerge. For example, while living as long as possible ranks below other considerations across racial and ethnic groups, blacks and Hispanics are more likely than whites to say this is “extremely important” to them (45 percent, 28 percent, and 18 percent, respectively). Perhaps relatedly, blacks and Hispanics are also more likely than whites to say the health care system in the U.S. places too little emphasis on preventing death and extending life as long as possible.
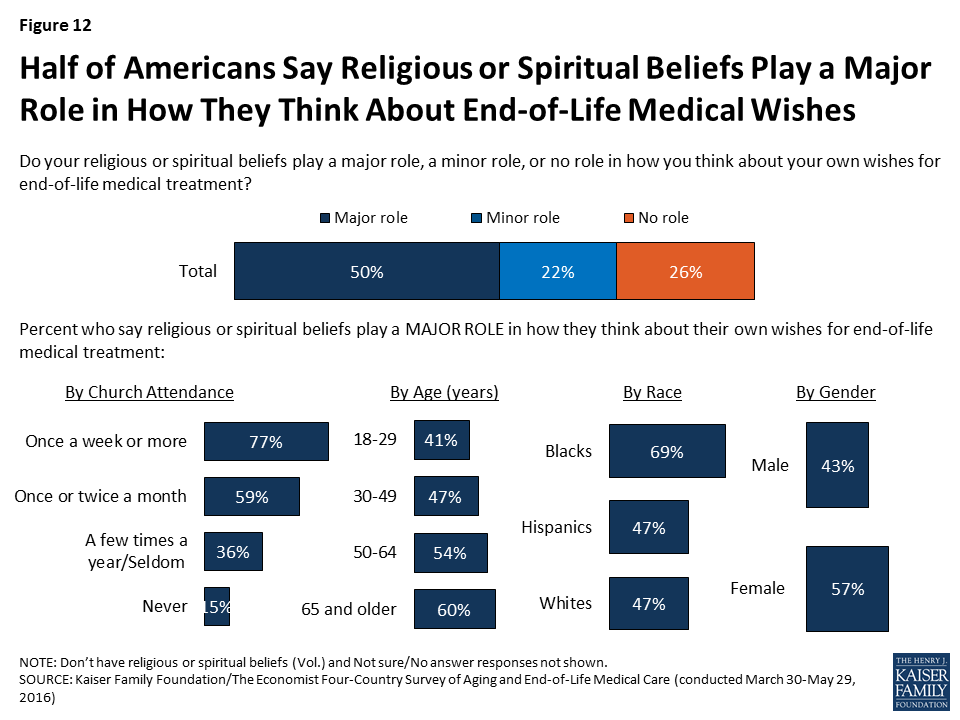
Groups of Americans also differ in the amount of influence that religion and spirituality play in their own end-of-life wishes. Overall, half of U.S. adults say that their religious and spiritual beliefs play a major role in how they think about their own wishes for end-of-life medical treatment, while 22 percent say these beliefs play a minor role and 26 percent say they play no role. Older Americans, women, Blacks, and those who attend religious services at least weekly are more likely than their counterparts to say their religious and spiritual beliefs play a major role in how they think about these matters.
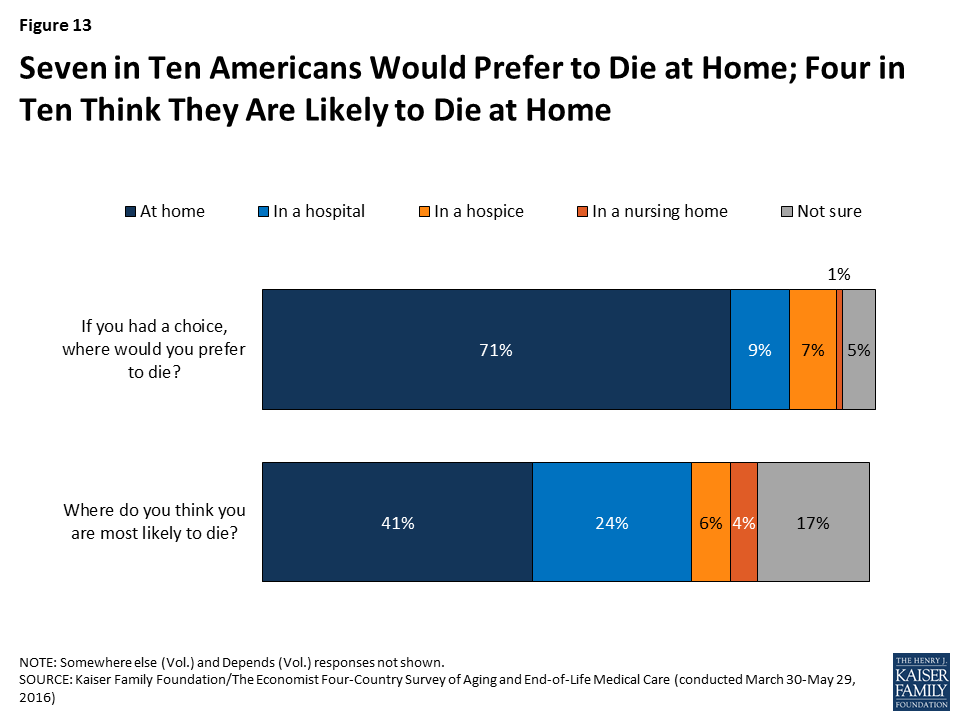
As other research has shown, most Americans (71 percent) say that given the choice, they would prefer to die at home, with few saying they would choose a hospital (9 percent), hospice (7 percent), or nursing home (1 percent). However, people’s expectations often don’t line up with their preferences. About four in ten (41 percent) think they are most likely to die at home, while about a quarter (24 percent) expect to die in a hospital, 6 percent expect to die in a hospice, 4 percent expect to die in a nursing home, and 17 percent say they aren’t sure.
Conversations and Preparations
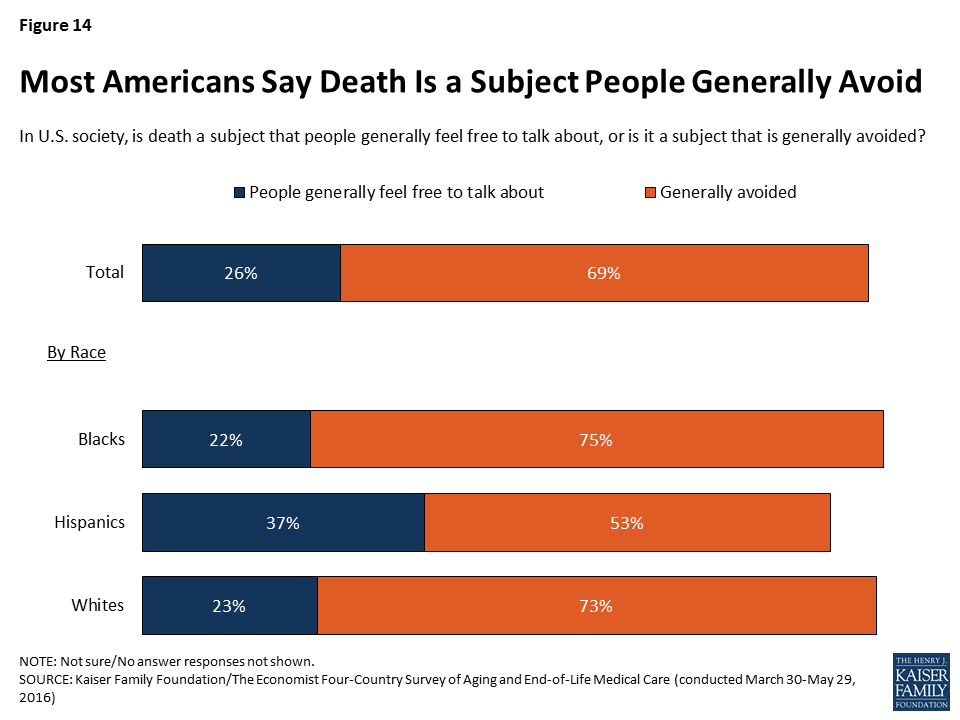
Like residents of each of the countries surveyed (Italy, Japan, and Brazil), a majority (69 percent) of Americans say that in U.S. society, death is a subject that is generally avoided. Perhaps reflecting cultural norms in different racial and ethnic communities, Hispanic Americans (37 percent) are more likely than Blacks (22 percent) or whites (23 percent) to say that death is a subject people generally feel free to talk about.
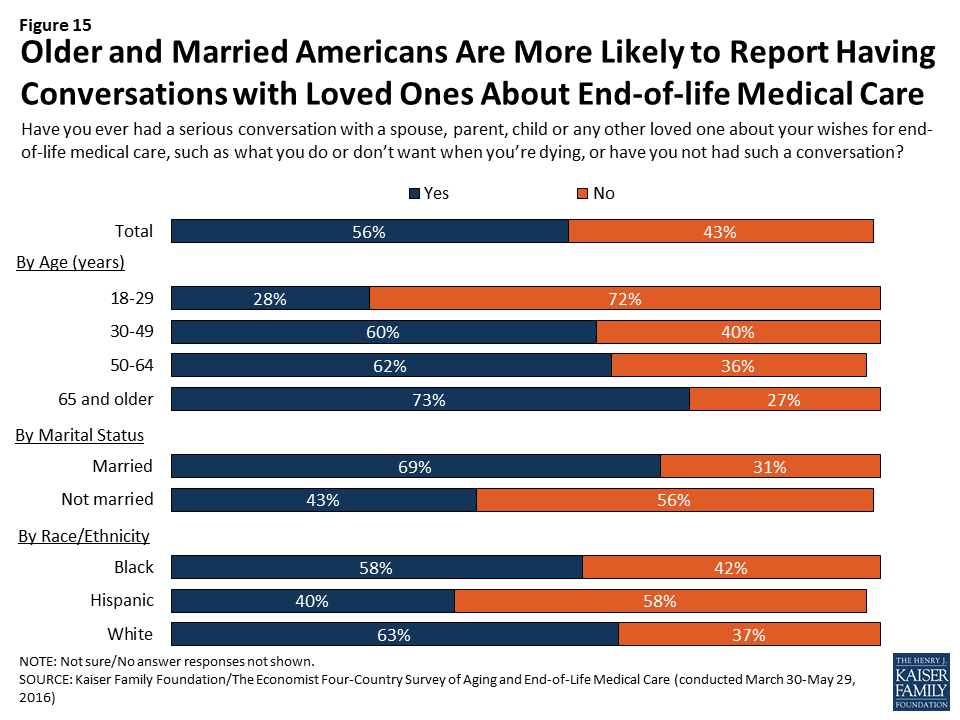
Despite this sense of cultural norms, over half (56 percent) of U.S. adults say they’ve had a serious conversation with a spouse, parent, child, or any other loved one about their own wishes for end-of-life medical care. The share who say they’ve had a serious conversation rises from 28 percent of adults under age 30 to 73 percent of those ages 65 and over. Those who are married (69 percent) are also much more likely than those who are not married (43 percent) to say they’ve had such a conversation. Interestingly, even though Hispanics are more likely than whites or Blacks to say that death is a subject that people generally feel free to talk about, Hispanics are less likely to say they’ve had a conversation with a loved one about their own wishes for end-of-life medical care. While Hispanics in the U.S. are younger on average than whites, this difference persists even after controlling for age and other demographic factors. Among people of all races/ethnicities, those who have not had this type of conversation with a loved one cite a variety of reasons, the most common being that they don’t think it’s necessary because they’re not sick yet (42 percent say this is a major reason).
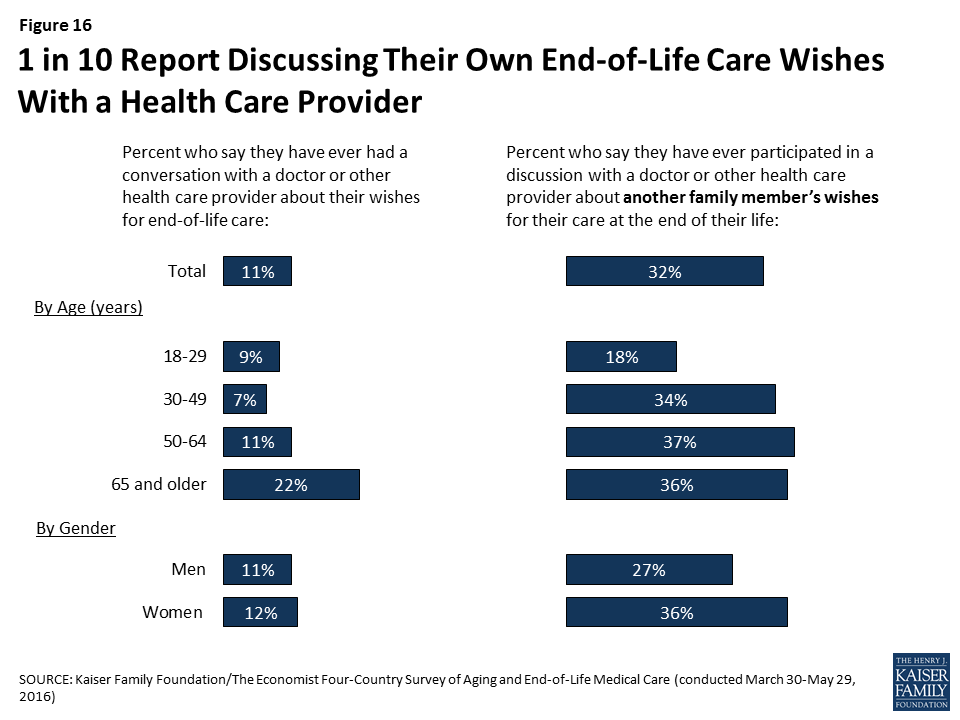
Americans are substantially less likely to say they’ve discussed their wishes for end-of-life medical care with a doctor than to say they’ve done so with a loved one. Overall, just one in nine (11 percent) say they’ve ever had such a conversation with a doctor or other health care provider, including 22 percent of those ages 65 and over. About a third (32 percent) say they’ve participated in a discussion with a doctor or other health care provider about another family member’s wishes for their care at the end of life, a share that is somewhat higher among those ages 30 and over, and also higher among women than men (36 percent versus 27 percent).
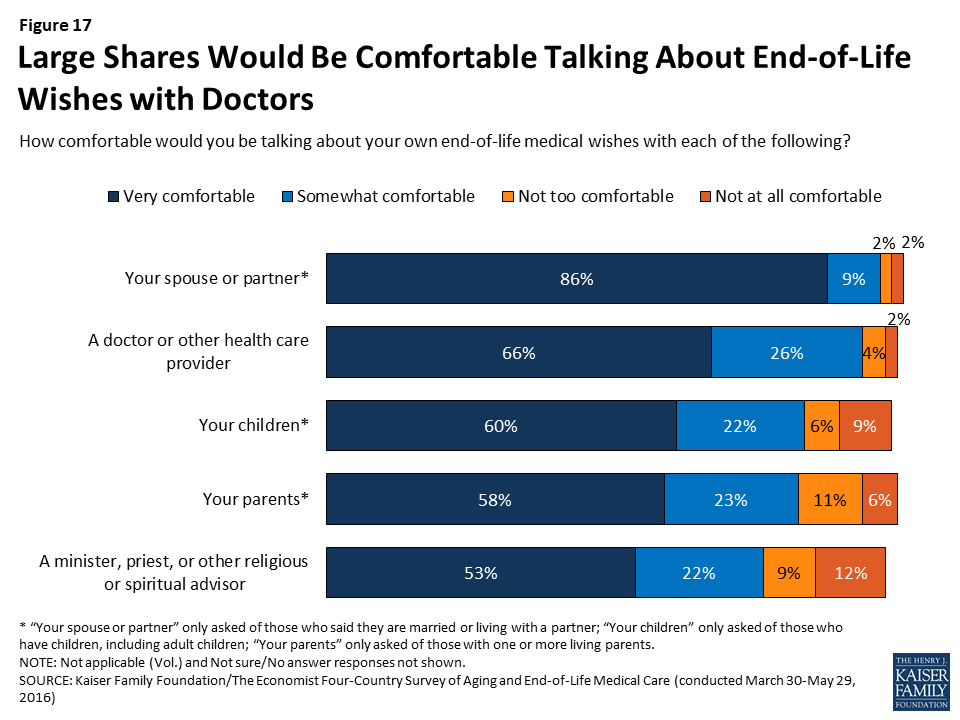
While few report having conversations with health care providers about their own wishes for end-of-life care, lack of comfort in discussing these issues with doctors does not seem to be a major barrier. The vast majority (92 percent) say they would be at least somewhat comfortable talking with a doctor or health care provider about their end-of-life medical wishes, including two-thirds (66 percent) who say they’d be very comfortable. This is similar to the share who say they’d be comfortable discussing end-of-life issues with their spouse or partner (94 percent), and higher than the share who would be comfortable having such discussions with their children (82 percent), their parents (81 percent), or a minister, priest, or other religious or spiritual advisor (75 percent). Further, there is broad support among the public for having Medicare cover discussions between doctors and patients about end-of-life treatment options (78 percent).
Discussions with health care providers about one’s wishes for end-of-life medical care are one part of what is often referred to as “advance care planning.”2 Another component of such planning is writing one’s wishes into a document, sometimes referred to as an “advance directive.” Overall, about a quarter (27 percent) of U.S. adults say they have their end-of-life wishes for medical treatment in a written document, ranging from just 8 percent of those under age 30 to about half (51 percent) of those ages 65 and over. Among the 72 percent who do not have their wishes written down, the most common reason is simply not having gotten around to it (49 percent), followed by never having considered it (27 percent). Few say they’re worried they might change their mind about what they want (5 percent) or that they don’t think it will be useful (4 percent).
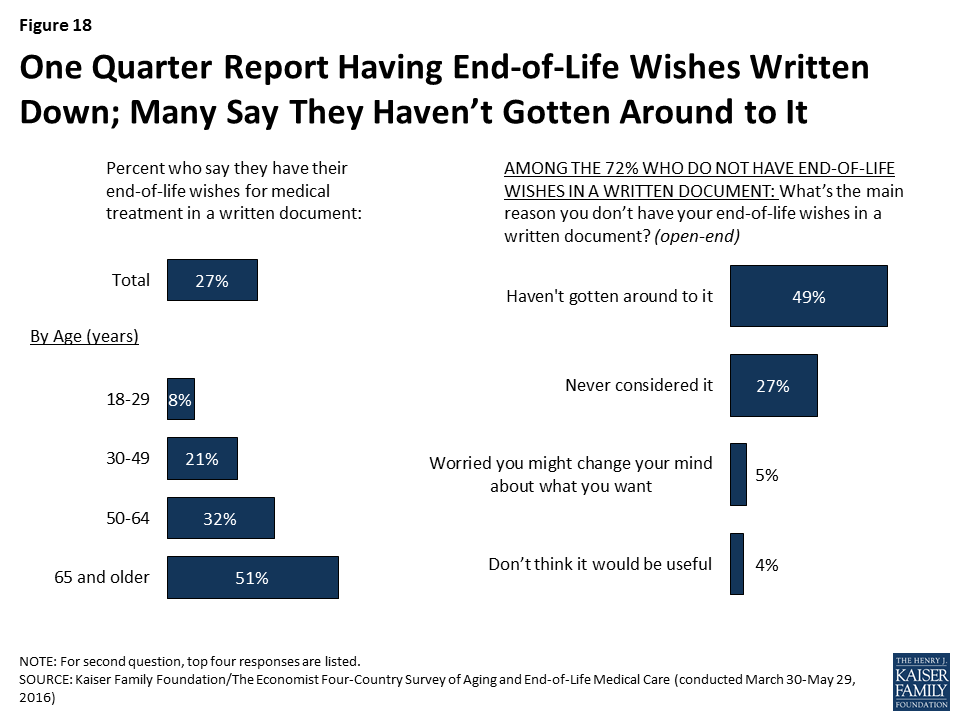
Besides the large difference by age, the survey also finds that members of racial and ethnic minority groups, and those with lower incomes and lower levels of education are less likely than whites and those with higher levels of income and education to say they have their wishes for end-of-life medical treatment in a written document. These differences also persist after controlling for age and other demographics.
| Table 1: Wishes for End-of-Life Care in a Written Document by Race and Socioeconomic Status | |||||||||
| Race/Ethnicity | Education | Household Income | |||||||
| Non-Hispanic Whites | Non-Hispanic Blacks | Hispanics | High school or less | Some college | College graduate | Less than $40K | $40K- $89.9K | Over $90K | |
| Percent who say they have their end-of-life wishes for medical treatment in a written document | 35% | 15% | 11% | 20% | 33% | 33% | 20% | 30% | 33% |
Experiences with the Death of a Loved One
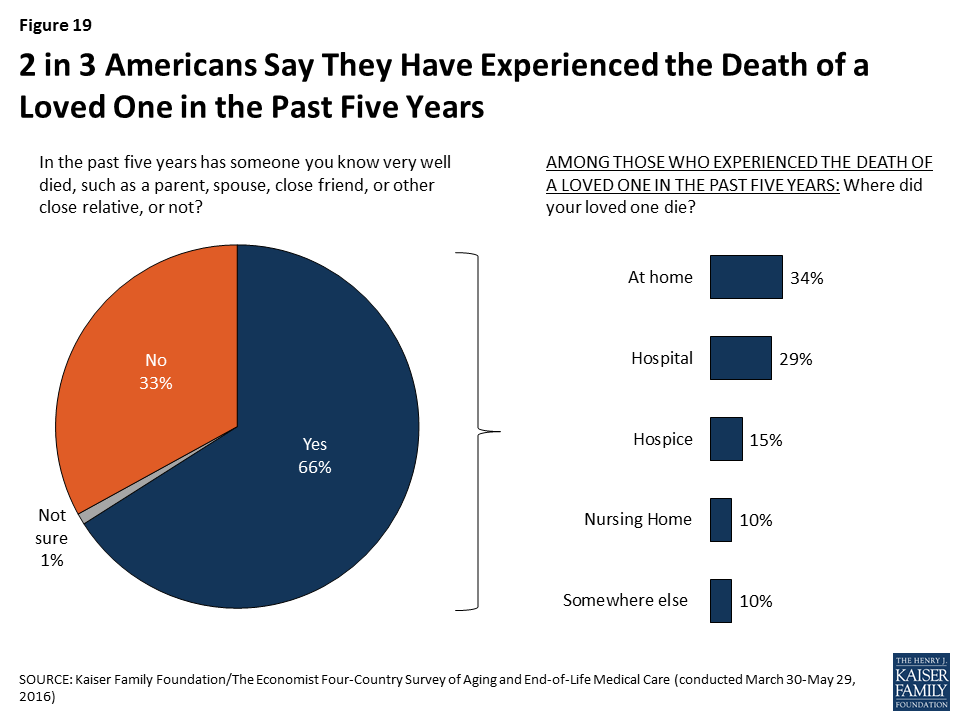
Roughly two-thirds (66 percent) of U.S. adults say they have experienced the death of someone close to them in the past five years. This includes 19 percent who experienced the death of a parent, 15 percent who experienced the death of a close friend, and 12 percent who experienced the death of a sibling. One in three (34 percent) say their loved one died at home, while a similar share (29 percent) say they died in a hospital, 15 percent say they died in a hospice, and 10 percent in a nursing home. Overall, about half (53 percent) of those who experienced the death of a loved one say that person either died in a hospice or received hospice care services before they died.
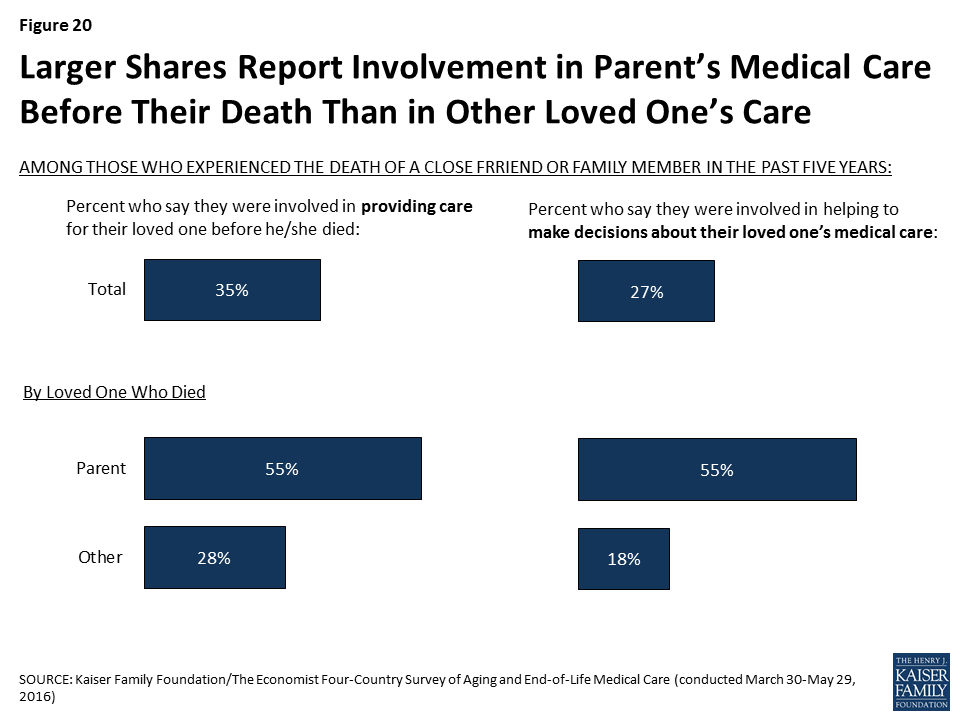
Family members often serve as caregivers or medical decision-makers when a loved one is ill and approaching the end of life. The survey finds that just over a third (35 percent) of those who experienced the death of a loved one in the past five years (accounting for 23 percent of the public overall) say that they were involved in providing care for the person before they died. Nearly as many (27 percent of those who experienced a death, or 18 percent of the public overall) report that they were involved in helping to make decisions about their loved one’s medical care. Those who experienced the death of a parent were much more likely than those who experienced the death of another type of loved one to say that they were involved in providing care (55 percent versus 28 percent) and making medical decisions (55 percent versus 18 percent).
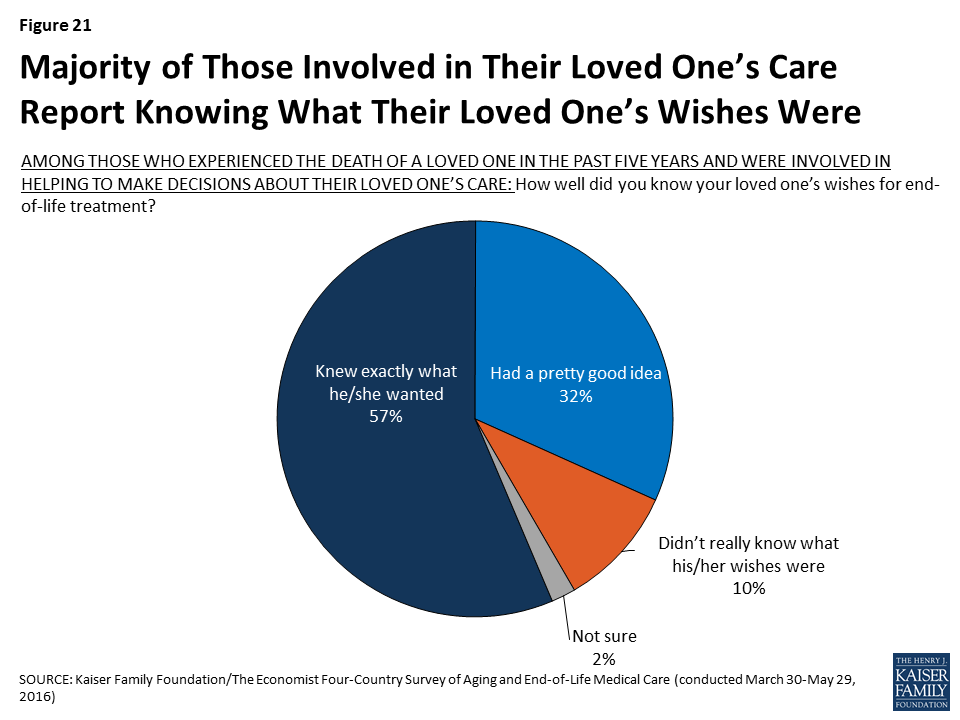
Most family members who were involved in making medical decisions for a loved one feel that they had a good understanding of their loved one’s wishes for end-of-life treatment. Among this group of decision-makers, about six in ten (57 percent) say they knew exactly what the person wanted, and about a third (32 percent) say they had a pretty good idea; one in ten (10 percent) report that they didn’t really know what the person’s wishes were. Furthermore, about three-quarters (73 percent) of this group reports that they have participated in a discussion with a doctor or other health care provider about another family member’s wishes for end-of-life medical care, a much higher share than among the public at large.
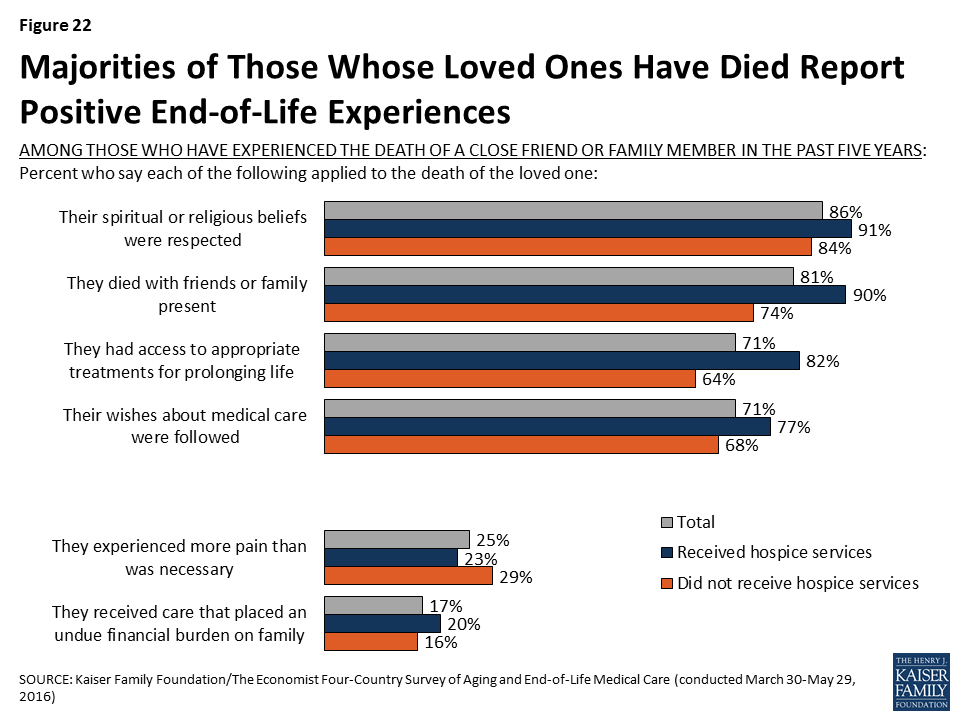
On the whole, few of those who experienced the death of a loved one describe negative experiences with end-of-life medical care. Large majorities say their loved one’s religious and spiritual beliefs were respected (86 percent), they died with friends or family present (81 percent), their wishes about medical care were followed (71 percent), and they had access to appropriate medical treatments for prolonging life (71 percent). Those who say their family member received hospice services before death are more likely than those who didn’t to say the person’s religious and spiritual beliefs were respected (91 percent versus 84 percent), they died with friends or family present (90 percent versus 74 percent), their wishes about medical care were followed (77 percent versus 68 percent), and they had access to appropriate medical treatments for prolonging life (82 percent versus 64 percent).
Still, small but important shares report negative experiences related to a loved one’s death. A quarter (25 percent) say their loved one experienced more pain than was necessary, and 17 percent say the person received medical care that placed an undue financial burden on the patient’s family. These shares are not statistically different between those whose family member received hospice services and those who did not.
Methodology
The Kaiser Family Foundation/The Economist Four-Country Survey on Aging and End-of-Life Medical Care was conducted among nationally representative random digit dial (RDD) telephone (landline and cell phone) samples of adults ages 18 and older, living in the United States (including Alaska and Hawaii), Brazil, Italy, and Japan (Note: persons without a telephone could not be included in the random selection process). SSRS carried out the sampling and weighting for all countries, and conducted computer-assisted telephone interviews for the U.S. sample. Interviews in Brazil were carried out by Cido International, and interviews in Japan and Italy were carried out by European Field Group, under the direction of SSRS. RDD landline and cell phone samples were provided by Marketing Systems Group (MSG) for the U.S., Sample Answers for Brazil, and Sample Solutions Europe (SSE) for Japan and Italy. Interview languages, field dates, and sample sizes for each country are shown in the table below. Teams from The Economist and the Kaiser Family Foundation worked together to develop the survey questionnaire and analyze the data. The Kaiser Family Foundation paid for the fieldwork costs associated with the survey. Each organization is responsible for its content.
Due to the multi-national design, the questionnaire was tested and translated in multiple stages. The first step involved a live-interview telephone pretest of the English questionnaire with U.S. respondents. Revisions to the English questionnaire were made following the pretest in order to shorten the survey instrument and improve respondent comprehension of questions. Following the English pretest, the questionnaire was translated into Spanish (for interviewing in the U.S.), Italian, Japanese, and Portuguese. Translations were reviewed by a team of professional translators and by regional experts at The Economist. A second pretest was conducted in Italy, Japan, and Brazil, after which further revisions were made to the non-English versions of the questionnaire.
In each country, to randomly select a household member for the landline samples, respondents were selected by asking for the adult male or female currently at home who had the most recent birthday based on a random rotation. If no one of that gender was available, interviewers asked to speak with the adult of the opposite gender who had the most recent birthday. For the cell phone samples, interviews were conducted with the adult who answered the phone.
Multi-stage weighting processes were applied separately for each country to ensure an accurate representation of each country’s national adult population. The first stage of weighting involved corrections to account for the fact that respondents with both a landline and cell phone have a higher probability of selection. The second weighting stage was designed to make demographic adjustments to the sample to match national population estimates. In the U.S., the sample was balanced to match known adult-population parameters using data from the Census Bureau’s 2015 March supplement of the Current Population Survey (CPS) and phone use parameters from the July-December 2015 early release estimates for the National Health Interview Survey. The weighting parameters used for the U.S. were age, gender, education, race/ethnicity, marital status, census region, and telephone use. In Italy, the sample was balanced using estimates from Instituto Nazionale di Statistica’s population projections based on 2010-2011 Census reports, with weighting parameters for age, education, region, and region by density. In Japan, the sample was balanced to match population parameters from Japan’s Statistical Yearbook 2015, based on age, education, and region by prefecture. In Brazil, the sample was balanced using the 2010 Population Census conducted by Instituto Brasileiro de Geografia de Estatística, based on age, education, region, and rural status. All statistical tests of significance account for the effect of weighting.
At the end of the field period, SSRS completed several data validation processes on the international data that included: internal validity checks, testing for straightlining, and analyzing paradata (interviewer workload, interview length, interview time, and overlap of interviews). The Kaiser Family Foundation, along with SSRS, also conducted a percent-match procedure to identify cases that share a high-percentage of identical responses to a large set of questions. This extra validation measure allows for detection of possible duplicate data, whether as a result of intentional falsification, or due to errors in data-processing.
The margin of sampling error including the design effect for each country sample is plus or minus 4 percentage points. For results based on subgroups, the margin of sampling error will be higher; sample sizes and margins of sampling error for subgroups are available by request. Note that sampling error is only one of many potential sources of error in this or any other public opinion poll. Kaiser Family Foundation public opinion and survey research is a charter member of the Transparency Initiative of the American Association for Public Opinion Research.
| Country | Field dates | Language(s) | Total sample size (unweighted) | Cell phone sample | Landline sample | M.O.S.E |
| U.S | March 30-May 29 | English and Spanish | 1,006 | 739 | 268 | ±4 percentage points |
| Italy | September 15-October 3 | Italian | 1,000 | 600 | 400 | ±4 percentage points |
| Japan | September 10-October 20 | Japanese | 1,000 | 500 | 500 | ±4 percentage points |
| Brazil | August 26-November 12 | Portuguese | 1,233 | 714 | 519 | ±4 percentage points |
Endnotes
- U.S. Census Bureau, Projections of the Size and Composition of the U.S. Population: 2014 to 2060, March 2015. http://www.census.gov/content/dam/Census/library/publications/2015/demo/p25-1143.pdf ↩︎
- National Institute on Aging, Advance Care Planning, February 2012. https://www.nia.nih.gov/health/publication/advance-care-planning ↩︎