New Orleans Ten Years After The Storm: The Kaiser Family Foundation Katrina Survey Project
Overview
Ten years after Hurricane Katrina battered the Gulf Coast and the subsequent levee failure led to unprecedented destruction in New Orleans, the Kaiser Family Foundation teamed up with NPR to conduct a survey of the city’s current residents. This work builds on three previous surveys conducted by the Foundation in 2006, 2008, and 2010, as well as a survey of Katrina evacuees in Houston shelters conducted in partnership with the Washington Post in September 2005.
The new survey examines how those who are currently living in Orleans Parish feel about the progress the city has made and the lingering challenges it faces, including those brought about by Katrina and those that pre-date the storm.
- News Release
- Report: New Orleans Ten Years After the Storm: The Kaiser Family Foundation Katrina Survey Project
- Drew Altman: What Post-Katrina New Orleans Shows About Urban and Race Issues
Read/Listen to NPR’s Coverage
- New Orleanians See Remarkable Progress, A Decade After Hurricane Katrina, August 10, 2015
- New Orleans’ Overall Crime Rate Has Fallen. Why Are People So Frustrated? August 11, 2015
- Katrina’s Emotional Legacy Includes Pain, Grief And Resilience, August 14, 2015
- New Orleans Schools, 10 Years After Katrina: Beacon Or Warning? August 15, 2015
- In Measuring Post-Katrina Recovery, A Racial Gap Emerges, August 15, 2015
- Katrina Shut Down Charity Hospital But Led To More Primary Care, August 19, 2015
- New Orleans Neighborhoods Scrabble For Hope In Abandoned Ruins, August 22, 2015
- More NPR coverage of the Hurricane Katrina anniversary
Executive Summary
Ten years after Hurricane Katrina battered the Gulf Coast and the subsequent levee failure led to unprecedented destruction in New Orleans, the Kaiser Family Foundation teamed up with NPR to conduct a survey of the city’s current residents. This work builds on three previous surveys conducted by the Foundation in 2006, 2008, and 2010, as well as a survey of Katrina evacuees in Houston shelters conducted in partnership with the Washington Post in September 2005. The new survey examines how those who are currently living in Orleans Parish feel about the progress the city has made and the lingering challenges it faces, including those brought about by Katrina and those that pre-date the storm.
Overall, the survey paints a portrait of a city whose residents are remarkably optimistic, resilient, and proud of their city’s culture. On many fronts, residents’ reports of conditions in their own neighborhoods and their evaluations of the city’s progress in recovery have improved steadily over the 10-year period since the storm. But in this city where racial disparities in income and employment existed long before Katrina, the survey finds that most of these improvements have been unevenly distributed by race. African Americans continue to lag far behind whites, both in their perceptions of how much progress has been made and in the rates at which they report continuing struggles. In some areas – notably the perception of New Orleans as a good place for young people – the racial gap has widened over time. Further, despite the fact that federal statistics show a decline in rates of violent and property crime in New Orleans compared to pre-Katrina levels1 , the survey finds that crime remains residents’ top concern and that several measures of feelings of personal safety have declined since 2010. Among those who were living in New Orleans at the time Katrina hit and are still living there today, most say their overall quality of life is the same as or better than before the storm, though of potential concern for the city’s future, more than a quarter of current residents – and almost half of those under age 30 – say they are considering moving away.
Key Findings: Section 1: New Orleans Residents Are Optimistic And Rate Recovery Efforts Positively
New Orleans Remains Optimistic And Proud Of Its Culture
True to the city’s reputation, the people of New Orleans maintain a remarkably positive attitude. Nearly eight in ten residents (78 percent) say they are optimistic about the future of the greater New Orleans area, a share that has been high since Katrina hit, but has increased somewhat since 2006 (70 percent). Optimism is the prevailing view across all groups of residents, including African Americans (75 percent) and whites (85 percent), and those with lower and higher incomes (75 percent of those with incomes below 200 percent of the federal level and 82 percent of those with higher incomes).

Residents are also unshaken in their pride for their city’s culture. As was the case in 2010, culture – including food, music, and nightlife – tops the list of responses to an open-ended question about the best thing that New Orleans has to offer (53 percent), followed by other factors such as tourism (13 percent) and the people (7 percent).

Most Say Recovery Is Going In Right Direction
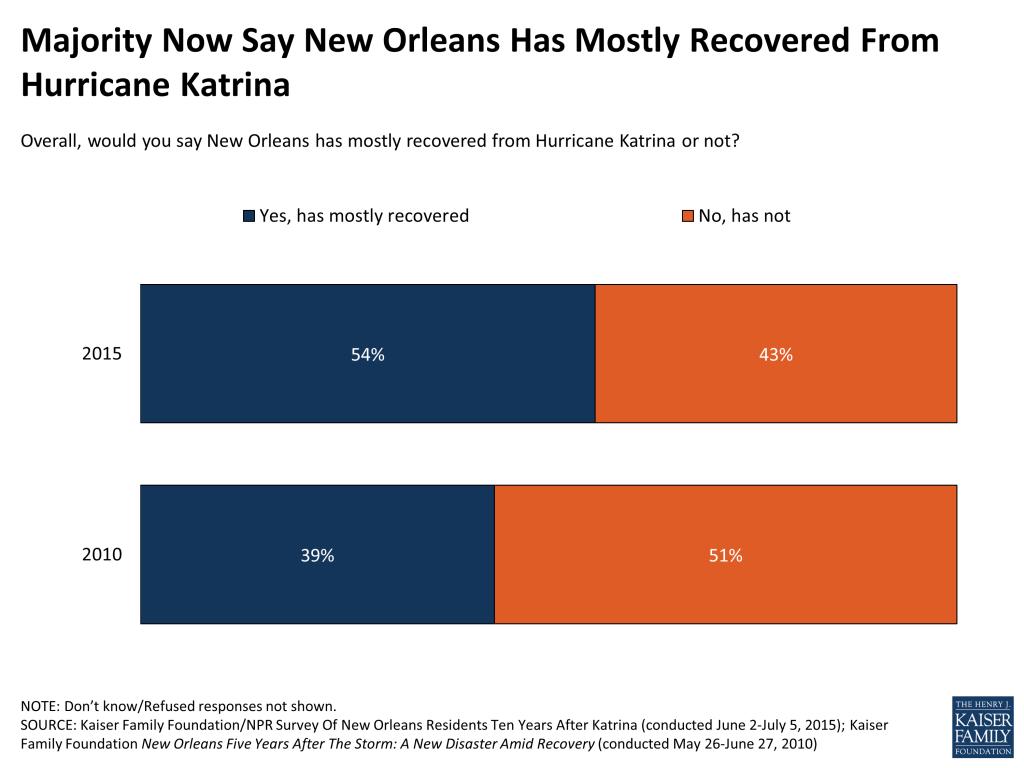
New Orleanians also take a generally positive view of the city’s efforts to recover from Hurricane Katrina. Nearly three-quarters (73 percent) now say the recovery and rebuilding effort is going in the right direction, similar to the share who said the same in 2010, but higher than the shares in 2006 and 2008. In fact, a majority of residents (54 percent) now say the city has mostly recovered from Hurricane Katrina, an increase from about four in ten (39 percent) who said the same five years ago.
| TABLE 1: Recovery Effort Increasingly Viewed As Going In The Right Direction | ||||
| Would you say that in general the recovery and rebuilding effort since Hurricane Katrina in the greater New Orleans area is going in the right direction or going in the wrong direction? | ||||
| 2015 | 2010 | 2008 | 2006 | |
| Right direction | 73% | 70% | 56% | 58% |
| Wrong direction | 21% | 24% | 35% | 33% |
| Don’t know/ Refused | 6% | 7% | 9% | 9% |
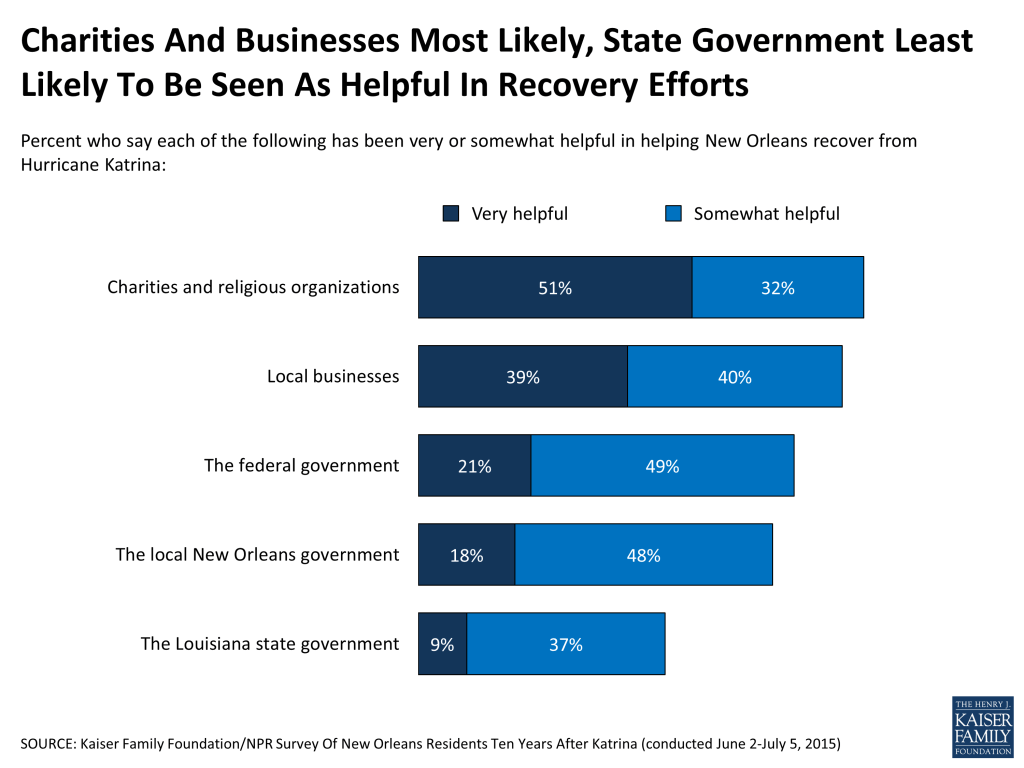
The people of New Orleans are quick to acknowledge the efforts made by many groups and organizations that have bolstered the rebuilding efforts. Large majorities say that charities and religious organizations (83 percent), local businesses (79 percent), and the federal and local governments (70 percent and 66 percent, respectively) have been at least somewhat helpful in city’s recovery. Fewer (46 percent) say the Louisiana state government has been helpful, perhaps reflecting New Orleans’ mainly Democratic allegiance in a state whose government is led by Republicans.
Who Has The Recovery Effort Helped Most?
Although most New Orleanians think the recovery effort is on the right track, many also believe that some have reaped the benefits more than others. Over four in ten say that the efforts to rebuild New Orleans have done “a lot” to help wealthy people (43 percent) and whites (42 percent), while smaller shares say the efforts have done “a lot” to help Hispanics (28 percent), African Americans (21 percent), middle class people (19 percent) and poor people (17 percent).

These results hold true at the personal level, where African Americans and those with lower incomes are more likely to feel left behind by the recovery efforts. About half of African Americans (47 percent) and those with incomes below 200 percent of the federal poverty level (46 percent) say that the recovery efforts have not done much, if anything at all, to help “people like you.” In contrast, about two-thirds of whites (67 percent) and those with higher incomes (66 percent) say the efforts have helped people like them “a lot” or “some.”
| Table 2: African Americans And People With Lower Incomes Less Likely To Feel Helped By Recovery | |||||
| RACE | INCOME | ||||
| How much do you think the efforts to rebuild New Orleans after Hurricane Katrina have done to help people like you? | TOTAL | African American | White | Less Than 200% FPL | 200% FPLOr More |
| A LOT/SOME (NET) | 58% | 53% | 67% | 52% | 66% |
| A lot | 20 | 20 | 19 | 20 | 19 |
| Some | 38 | 33 | 48 | 32 | 47 |
| NOT TOO MUCH/NOTHING AT ALL (NET) | 40 | 47 | 28 | 46 | 31 |
| Not too much | 24 | 29 | 15 | 29 | 19 |
| Nothing at all | 16 | 18 | 13 | 17 | 12 |
| NOTE: Don’t know/ Refused responses not shown. | |||||
Key Findings: Section 2: Racial Disparities
Disparities In Economic Circumstances
The sense that New Orleans’ African American residents have been left behind by the recovery efforts may be exacerbated by the fact that these residents were living substantially different economic realities from their white counterparts long before Hurricane Katrina hit, and continue to do so today. A recent report found that the median household income for African Americans in New Orleans was 54 percent lower than for area whites, and 20 percent lower than for African Americans nationwide. Similarly, while employment rates for white men in New Orleans were on par with other fast-growing Southern metro areas, the employment rate for black men – at 57 percent in 2013 – lagged behind similar cities.2
Those differing circumstances are reflected in the survey findings when it comes to reports of specific financial troubles. For example, African Americans are more likely than whites to say that in the past year, they have had problems with credit card debt or other personal debt (32 percent, compared to 16 percent), had hours cut back at work (31 percent, compared to 18 percent), fallen behind in rent or mortgage payments (27 percent, compared to 8 percent), been laid off or lost a job (26 percent, compared to 13 percent), or given up looking for work because of a lack of good jobs (22 percent, compared to 10 percent).

Uneven Progress In Perceptions Of Recovery
As noted above, the share of New Orleans residents overall who say the city has mostly recovered from Hurricane Katrina has increased substantially since 2010. However, a large racial gap underlies this overall positive trend. While fully seven in ten whites now say the city has mostly recovered, just 44 percent of African Americans say the same, leaving a majority of African Americans (54 percent) saying that the city has not yet fully recovered.
African Americans are also more likely than whites to think that if Hurricane Katrina were to hit the Gulf Coast today, the levees would be breached again (41 percent, compared to 28 percent). This concern may reflect the fact that African Americans are more likely to live in neighborhoods that are at the highest risk for flooding if another big storm hits, including New Orleans East, Gentilly, and Algiers.
| Table 3: African Americans Less Likely To Say New Orleans Has Recovered From Katrina, More Likely To Worry About Future Levee Breaches | |||
| Total | African Americans | Whites | |
| Overall, would you say New Orleans has mostly recovered from Hurricane Katrina or not? | |||
| Yes, has recovered | 54% | 44% | 70% |
| No, has not recovered | 43 | 54 | 28 |
| Don’t know/Refused | 2 | 2 | 1 |
| If Hurricane Katrina were to hit the Gulf Coast today, do you think the New Orleans levees would hold, or do you think they would be breached again? | |||
| Levees would hold | 53 | 49 | 62 |
| Levees would be breached | 36 | 41 | 28 |
| Don’t know/Refused | 11 | 10 | 10 |
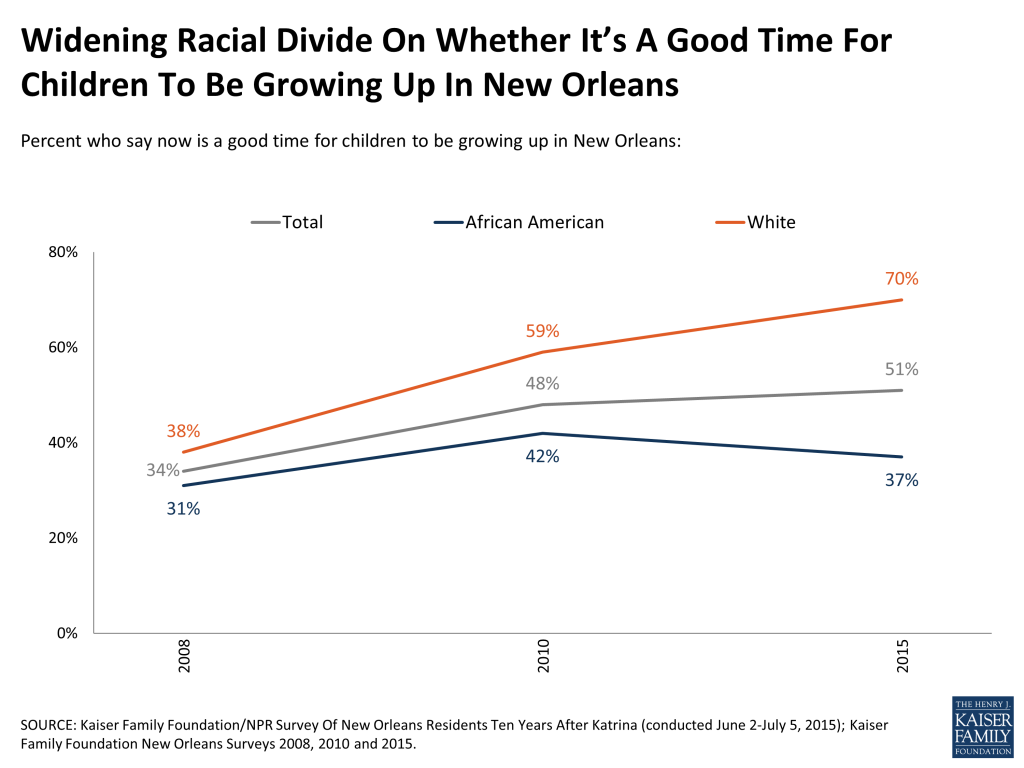
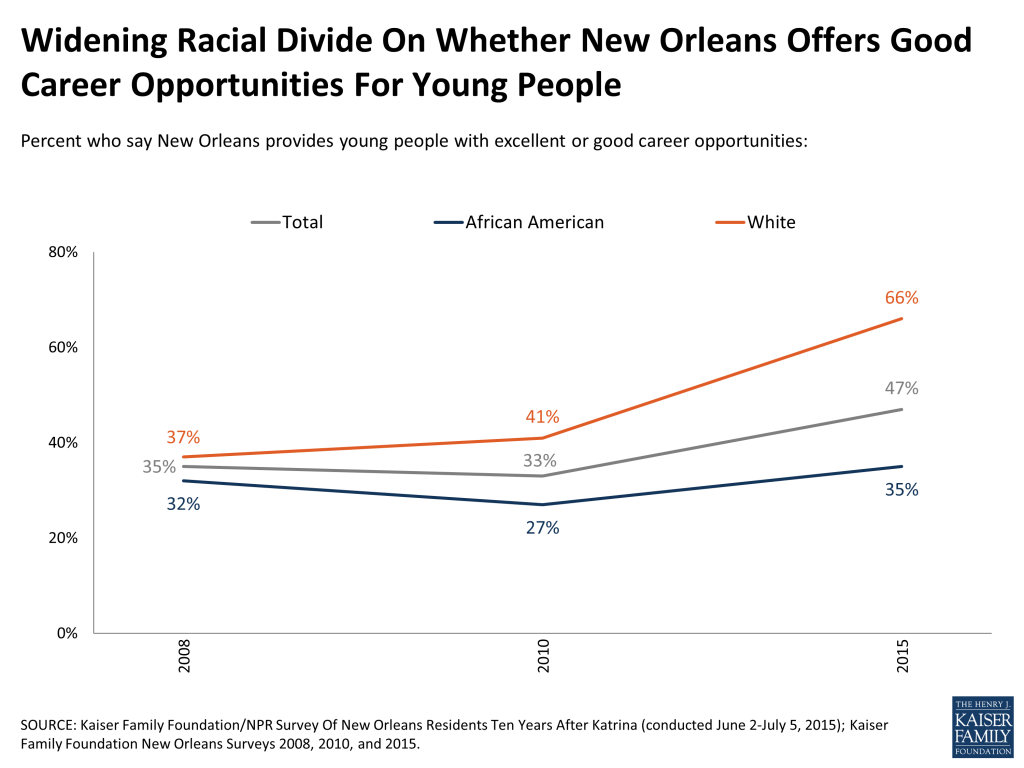
Widening Racial Gaps On New Orleans As A Good Place For Young People
One of the more troubling trends identified by the survey is a widening of the racial gap in perceptions of New Orleans as a good place for young people. Seven in ten whites (70 percent) now say it’s a good time for children to be growing up in New Orleans, a proportion that has risen steadily since 2008. By contrast, fewer than four in ten African Americans agree, while a majority (57 percent) of African Americans say now is a bad time for children to be growing up in the city. This negative view is even higher among African American parents, 68 percent of whom say it’s a bad time for children to be growing up in New Orleans.
Similarly, while the share of residents overall who say New Orleans provides excellent or good career opportunities for young people has increased over time, this trend is driven mainly by the increasingly positive views of whites. Two-thirds (66 percent) of whites now hold this view, up 29 percentage points since 2008, while just 35 percent of African Americans agree, about the same proportion who felt this way 7 years ago.
Despite these widening racial gaps in attitudes and continuing economic disparities, and despite the fact that other polls have found a recent worsening in perceptions of race relations nationally3 , a majority (56 percent) of residents who’ve lived in New Orleans since before the storm say race relations in the city are about the same as they were pre-Katrina. This view is held by a majority of both African Americans and whites. However, for those who see a change in race relations, whites are more likely to say things are better today than before the storm (27 percent better versus 13 percent worse), while Africans Americans are more divided (19 percent better, 23 percent worse).

Key Findings: Section 3: Progress In Specific Areas
Most See Progress In Many Areas, With Crime The Glaring Exception
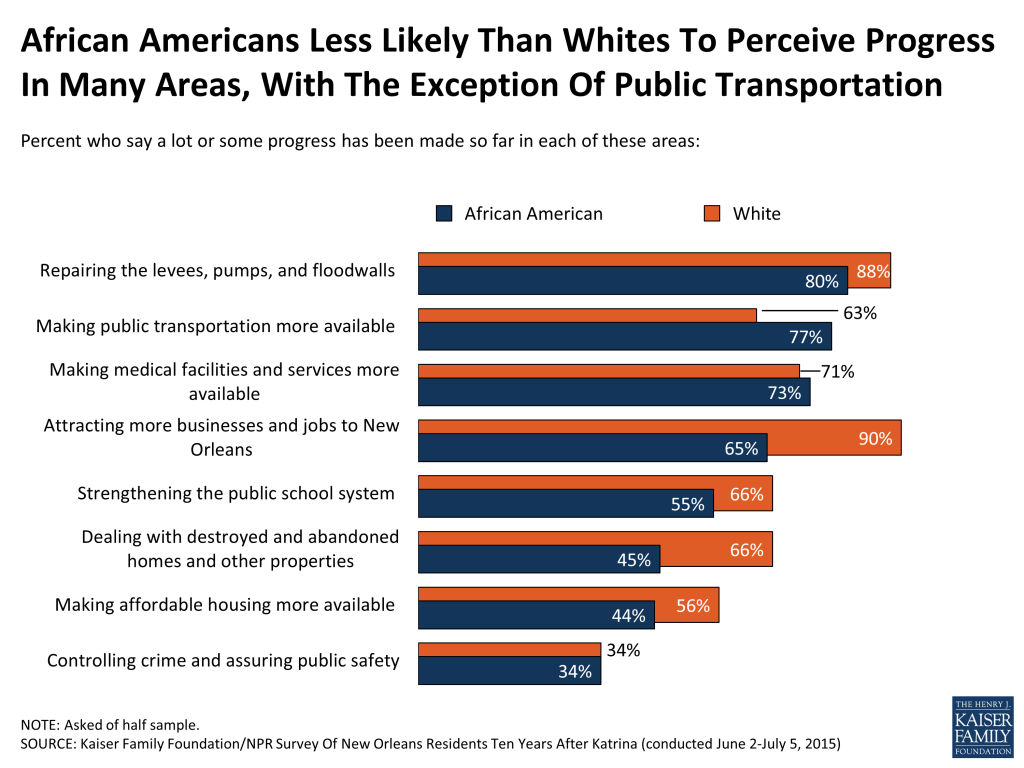
Most New Orleans residents believe that at least some progress has been made on eight of nine key issues facing the city. Most notably, residents seems to recognize the nearly $14 billion dollars spent to repair the city’s storm protection infrastructure after Katrina, as over eight in ten (82 percent) say at least “some” progress has been made in repairing the levees, pumps and floodwalls, including 50 percent who say there has been “a lot” of progress. More than seven in ten say progress has been made in attracting more businesses and jobs to New Orleans (75 percent), making medical facilities and services more available (72 percent), and making public transportation more available (71 percent), and at least half perceive progress in strengthening the public school system (59 percent), dealing with destroyed or abandoned buildings (53 percent), and making affordable housing more available (50 percent). By contrast, just about a third (35 percent) say at least some progress has been made in controlling crime and assuring public safety, while two-thirds (64 percent) say there has been little to no progress in this area.

All in all, this progress report highlights increasingly positive public attitudes over the past five years on many of these key issues. When it comes to strengthening flood protection infrastructure, attracting jobs and business, and making medical facilities and public transportation more available, larger shares of residents now believe progress has been made than said the same in 2010. By contrast, when it comes to public schools, affordable housing, and crime, public perceptions of progress appear to be stagnant, with similar shares saying progress has been made today as said so 5 years ago.
Further, a large majority of residents (84 percent) continue to see political corruption as a serious problem, similar to the share who held this view in 2010 (86 percent).

For the most part, whites are more likely than African Americans to say progress has been made in specific areas, most notably attracting jobs (90 percent versus 65 percent), strengthening public schools (66 percent versus 55 percent), making affordable housing available (56 percent versus 44 percent), and dealing with abandoned properties (66 percent versus 45 percent). This last point may be related to the fact that African Americans are more likely than whites to say their own neighborhood has a major problem with abandoned and destroyed buildings (35 percent versus 10 percent).
One of the few exceptions where the survey finds African Americans more likely than whites to express positive views is on public transportation. Over three-quarters (77 percent) of African Americans believe the city has made progress in this area compared to 63 percent of whites. African Americans may be in a better position to judge the city’s progress in this area, as they are about twice as likely as whites to say they rely on public transportation (34 percent versus 16 percent).
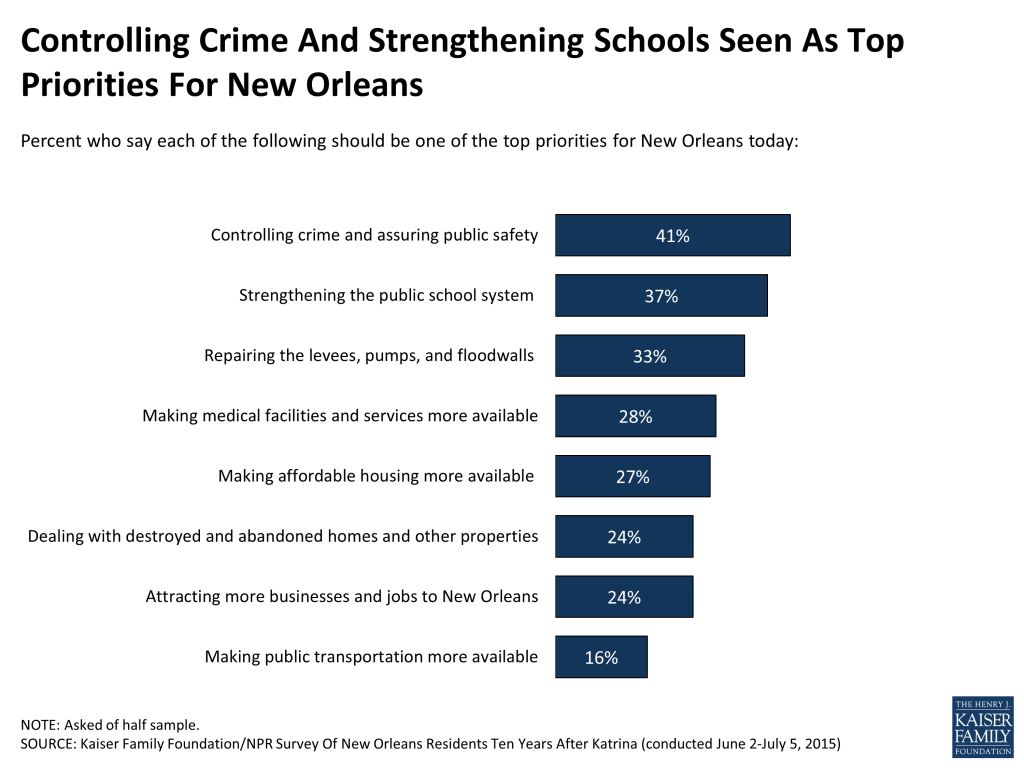
Reflecting the fact that crime is the area where residents are least likely to perceive progress, it is also at the top of the list of residents’ priorities for the city going forward. Four in ten (41 percent) say controlling crime and assuring public safety should be “one of the top priorities” for New Orleans today, followed by strengthening the public school system (37 percent). Though the vast majority believe progress has been made in repairing the levees, pumps, and floodwalls, one-third (33 percent) say this should continue to be a top priority, ranking third on the list. About a quarter each would place a top priority on medical facilities (28 percent), affordable housing (27 percent), dealing with abandoned properties (24 percent) and attracting more jobs to the area (24 percent), while fewer (16 percent) prioritize improvements to public transportation.
Amenities In Their Own Neighborhoods
Consistent with other survey findings, New Orleanians’ reports of amenities in their own neighborhoods have improved significantly over the past several years, though large racial disparities remain. Compared with 2008 and 2010, more residents overall now say their neighborhood has enough places to buy fresh groceries (68 percent, up from 50 percent in 2008), sufficient public transportation (67 percent, up from 43 percent), and enough restaurants (65 percent, up from 56 percent). While fewer than half (46 percent) now say their neighborhood has enough places for children to play outside, this is also a significant increase from prior years.
While reports of neighborhood services have improved since 2008 across racial groups, African Americans remain less likely than whites to say their neighborhood has sufficient places to buy groceries (63 percent, compared to 78 percent of whites), restaurants (55 percent versus 83 percent), and places for children to play outside (36 percent versus 63 percent). Once again, public transportation is the exception to this pattern. About two-thirds of both African Americans (67 percent) and whites (68 percent) say their neighborhood has enough public transportation.
| Table 4: Increasingly Positive Ratings Of Neighborhood Services, But Racial Gaps Remain | |||||||||
| TOTAL | African American | White | |||||||
| Percent who say their neighborhood has enough… | 2015 | 2010 | 2008 | 2015 | 2010 | 2008 | 2015 | 2010 | 2008 |
| …places where you can buy groceries including fresh produce | 68% | 54% | 50% | 63% | 44% | 43% | 78% | 73% | 59% |
| …public transportation* | 67 | 59 | 43 | 67 | 56 | 36 | 68 | 66 | 56 |
| …restaurants | 65 | 57 | 56 | 55 | 45 | 39 | 83 | 77 | 81 |
| …places where children can play outside | 46 | 38 | 32 | 36 | 28 | 22 | 63 | 55 | 45 |
| *2010 and 2008 wording was “bus service” | |||||||||
Crime And Police Presence
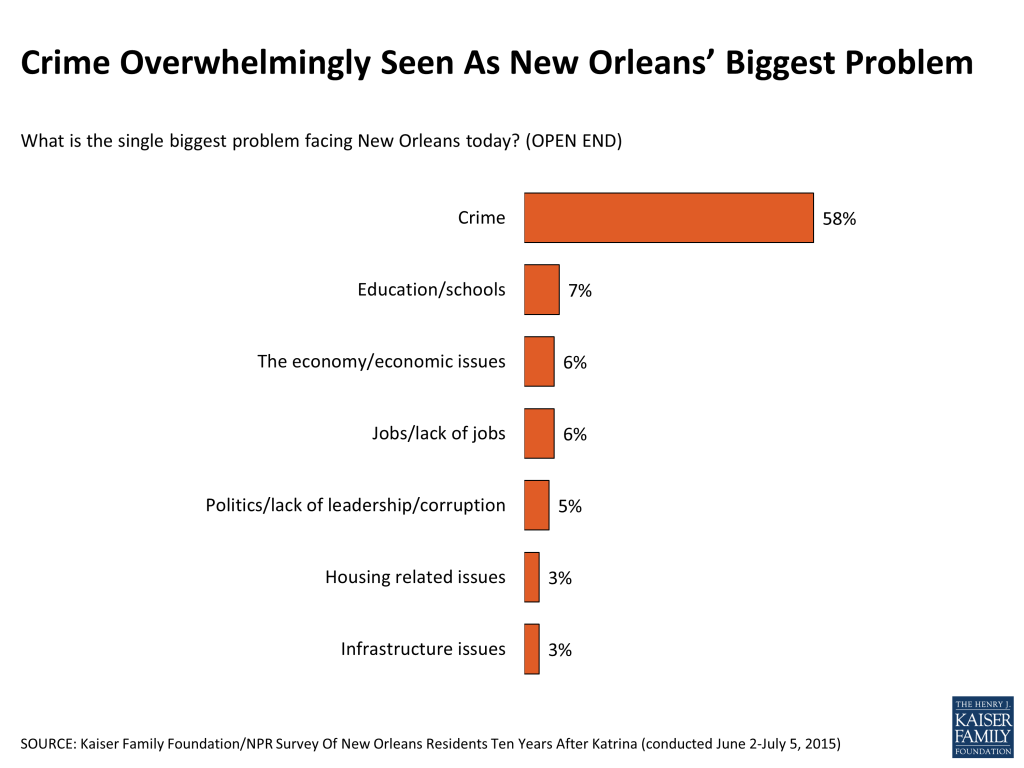
As noted above, New Orleanians rank controlling crime and assuring public safety as the top priority for the city and as the area where the least progress has been made. They also overwhelmingly see crime as the city’s biggest problem; nearly six in ten residents (58 percent) name crime in an open-ended question about the biggest problem facing New Orleans, a response that has topped the list since this question was first asked in 2008. While rates of violent and property crime in New Orleans have declined in recent years, they remain significantly higher than the national average.4 Louisiana continues to have the highest incarceration rate in the country5 , and the city’s criminal justice system has been the subject of much public scrutiny over the past 10 years.6
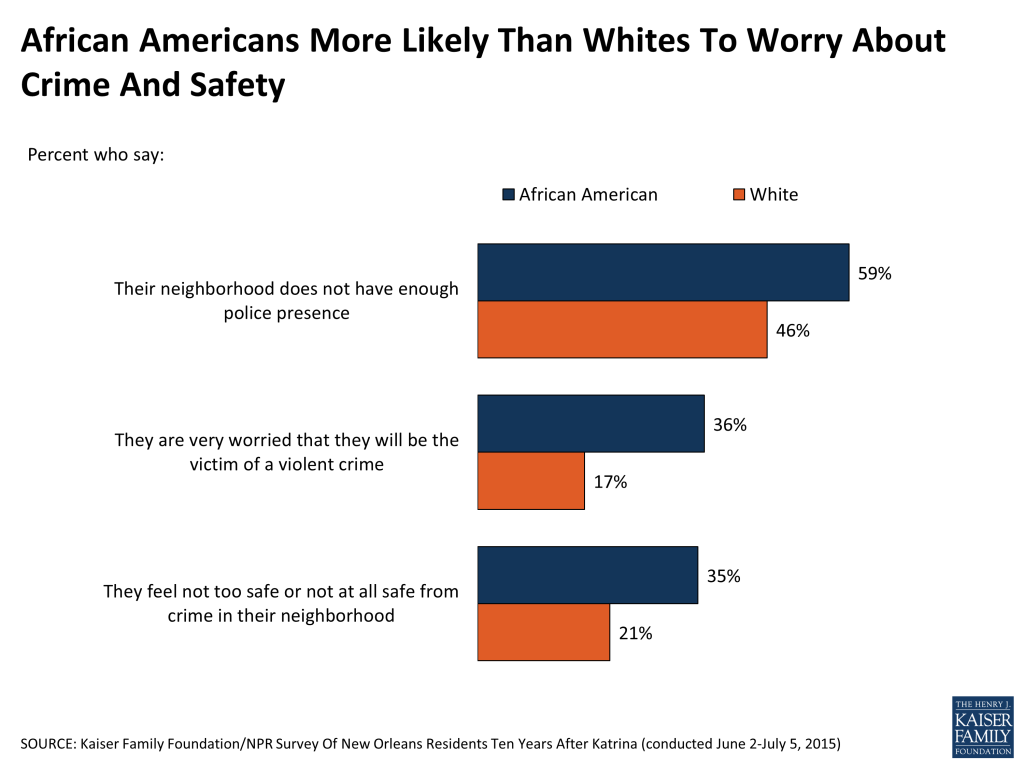
The survey finds that residents’ personal worries about crime have increased somewhat over the past five years, returning closer to 2008 levels. About three in ten (29 percent) now say they are “very” worried they will be the victim of a violent crime, up from 23 percent in 2010. Furthermore, while most residents say they feel at least somewhat safe from crime in their neighborhood, the share who say they feel “not too safe” or “not safe at all” has increased since 2010 (from 23 percent to 30 percent). In contrast with reported improvements in other neighborhood services, there has been a decline since 2010 in the share who say their neighborhood has enough police presence (44 percent, down from 58 percent).
| Table 5: Measures Of Personal Safety Declined Since 2010 | |||
| 2015 | 2010 | 2008 | |
| How worried are you, if at all, that you will be the victim of a violent crime? | |||
| Very worried | 29% | 23% | 31% |
| Somewhat worried | 33 | 31 | 35 |
| Not too worried | 23 | 29 | 22 |
| Not at all worried | 15 | 18 | 12 |
| These days, how safe from crime do you feel in your neighborhood? | |||
| Very safe | 18 | 22 | 17 |
| Somewhat safe | 52 | 54 | 54 |
| Not too safe | 19 | 13 | 19 |
| Not safe at all | 11 | 10 | 10 |
| Would you say your neighborhood does or does not have enough police presence? | |||
| Does have enough | 44 | 58 | 52 |
| Does NOT have enough | 54 | 41 | 47 |
| Note: Don’t know/Refused responses not shown. | |||
Racial disparities exist on all these measures, with African Americans more likely than whites to say that they are very worried about being a victim of violent crime (36 percent versus 17 percent), that they don’t feel safe from crime in their neighborhood (35 percent versus 21 percent) and that their neighborhood does not have enough police presence (59 percent versus 46 percent).
Despite recent efforts to reform New Orleans’ policing and criminal justice system7 , the police force continues to suffer from a distinct lack of public trust, particularly among African Americans. While most whites (59 percent) say they trust the police to do what is right for their community “almost always” or “most of the time,” a majority (58 percent) of African Americans say they trust the police “only some of the time” or “almost never.” This racial divide in police trust is not specific to New Orleans and may be part of a broader national trend that has been exacerbated by widespread attention to recent events in cities such as Ferguson, Missouri and Charleston, South Carolina. However, in New Orleans the gap in trust between African Americans and whites does not appear to have widened over the past 5 years, and in fact the share of African Americans who say they mostly trust the police has increased slightly, from 34 percent in 2010 to 42 percent today.
| Table 6: African Americans Less Likely Than Whites To Trust Police, But Racial Gap Has Not Widened Since 2010 | ||||||
| 2015 | 2010 | |||||
| How much of the time do you think you can trust the police to do what is right for you or your community? | Total | African American | White | Total | African American | White |
| Almost always/Most of the time (NET) | 48% | 42% | 59% | 44% | 34% | 59% |
| Almost always | 14 | 10 | 21 | 13 | 9 | 18 |
| Most of the time | 34 | 32 | 38 | 31 | 25 | 41 |
| Only some of the time/Almost never (NET) | 50 | 58 | 38 | 55 | 64 | 40 |
| Only some of the time | 34 | 38 | 28 | 40 | 45 | 31 |
| Almost never | 16 | 20 | 10 | 15 | 19 | 9 |
Public Schools
As noted above, Parish residents rank strengthening the public school system as the second-highest priority for the city, after controlling crime and assuring public safety. While nearly six in ten residents (59 percent) believe that at least some progress has been made in this area, 42 percent of parents with children under age 19 say they are “very” worried that their children won’t be able to get a good education (albeit down somewhat from 51 percent in 2010). This worry is concentrated among African American parents, over half (53 percent) of whom say they are very worried, compared to just 17 percent of white parents.
The public school system in New Orleans today looks nothing like it did prior to Hurricane Katrina. In May 2014, the Recovery School District, a state control board that had been overseeing most of the city’s public schools since 2005, shut down the last of its five traditional public schools, making New Orleans the first school district in the nation to be made up entirely of charter schools.8 The survey finds a majority (60 percent) of parents believe the increase in charter schools is a good thing for New Orleans, while a quarter (24 percent) say it hasn’t made much difference and 12 percent say it is a bad thing. Statistics show the student body of public schools, including charters, is 85 percent African American.9 Thus, it is notable that African American parents are somewhat more ambivalent about the increase in charter schools; though a slim majority (53 percent) of this group views the trend as a good thing, 14 percent see it is a bad thing and 30 percent say it hasn’t made much difference.

Health Care
When Charity Hospital closed its doors due to Hurricane Katrina, many of the city’s poor and uninsured were left without a place to go for care. In the intervening 10 years, dozens of new community clinics have opened, providing residents with more opportunities to access health care outside the hospital setting. In August 2015, a new hospital – University Medical Center New Orleans – opened, aiming to replace Charity as the city’s main trauma and safety-net hospital while also providing high-end specialty care to privately insured patients.10
Many survey trends reflect an improvement in residents’ perceptions of access to health care in the city. Nearly four in ten (37 percent) now say there has been “a lot” of progress in making medical facilities and services more available, up from just 14 percent five years ago. Further, a large majority (88 percent) says their own health needs are being met at least “somewhat” well, and the share saying they are being met “very well” is up 19 percentage points since 2006.
| Table 7: Increasingly Positive Ratings Of Progress On Medical Facilities | |||
| 2015 | 2010 | 2008 | |
| Please tell me how much progress you think has been made so far in making medical facilities and services more available? | |||
| A lot | 37 | 14 | 5 |
| Some | 35 | 35 | 33 |
| Not too much | 17 | 32 | 40 |
| None at all | 9 | 17 | 19 |
| NOTE: Don’t know/ Refused responses not shown. | |||
| Table 8: Majority Say Health Needs Are Being Met Very Well | ||||
| 2015 | 2010 | 2008 | 2006 | |
| Overall, how well would you say your health needs are being met today? | ||||
| Very well | 55 | 55 | 42 | 36 |
| Somewhat well | 33 | 29 | 44 | 53 |
| Not too well | 7 | 10 | 10 | 9 |
| Not at all well | 4 | 5 | 4 | 2 |
| NOTE: Don’t know/ Refused responses not shown. | ||||
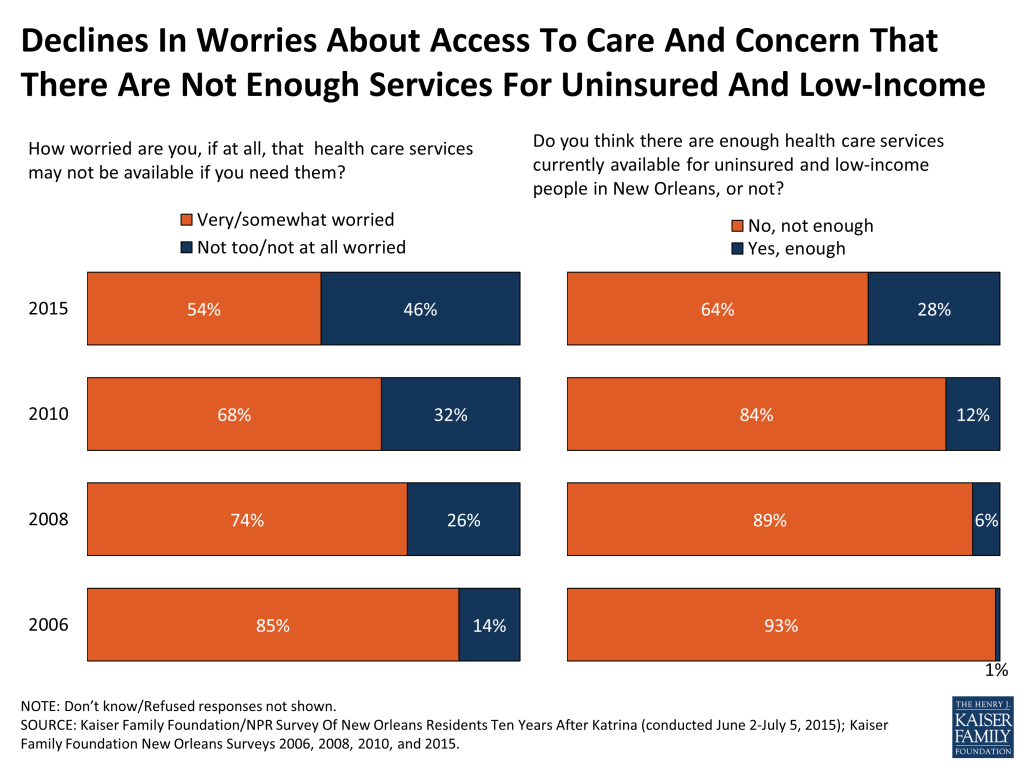
Worries about access to care have also dissipated: just over half (54 percent) of residents now say they are “very” or “somewhat” worried that health care services might not be available if they need them, down from 85 percent in 2006. And while nearly two-thirds (64 percent) say there are not enough health care services available for uninsured and low-income people in the city, this is down from a near-unanimous 93 percent in 2006.
Despite these improvements, it comes as no surprise that the city’s more vulnerable populations – including those with lower incomes and those without health insurance – report problems accessing and affording health care at higher rates than their counterparts. Overall, about a quarter of residents (23 percent) say that in the past 6 months they have skipped or postponed needed medical care, and about one in five (19 percent) say they have not filled a prescription or skipped doses of a medicine. These proportions are even higher among those with incomes below 200 percent of the poverty level (32 percent and 26 percent, respectively) and among the uninsured (47 percent and 33 percent). Similarly, about a quarter (27 percent) of residents overall say they had problems paying medical bills in the past 6 months, with much higher rates among the uninsured (51 percent), those with lower incomes (41 percent), and African Americans (34 percent).
| Table 9: Uninsured, Lower-Income, And African Americans More Likely To Report Problems With Health Care Access And Affordability | |||||||
| INSURANCE STATUS | INCOME | RACE | |||||
| Percent who say, in the past 6 months, they… | TOTAL | Uninsured, ages 18-64 | Insured, ages 18-64 | Less Than 200% FPL | 200% FPL Or More | African American | White |
| …did NOT get, or postponed medical care when they needed it | 23% | 47% | 21% | 32% | 17% | 25% | 21% |
| …did NOT fill a prescription, skipped doses, or took less than the prescribed dose of a medication | 19 | 33 | 19 | 26 | 13 | 22 | 15 |
| …had problems paying for medical bills | 27 | 51 | 26 | 41 | 14 | 34 | 16 |
Key Findings: Section 4: Quality Of Life And Mental Health
Changes In Quality Of Life Since Katrina
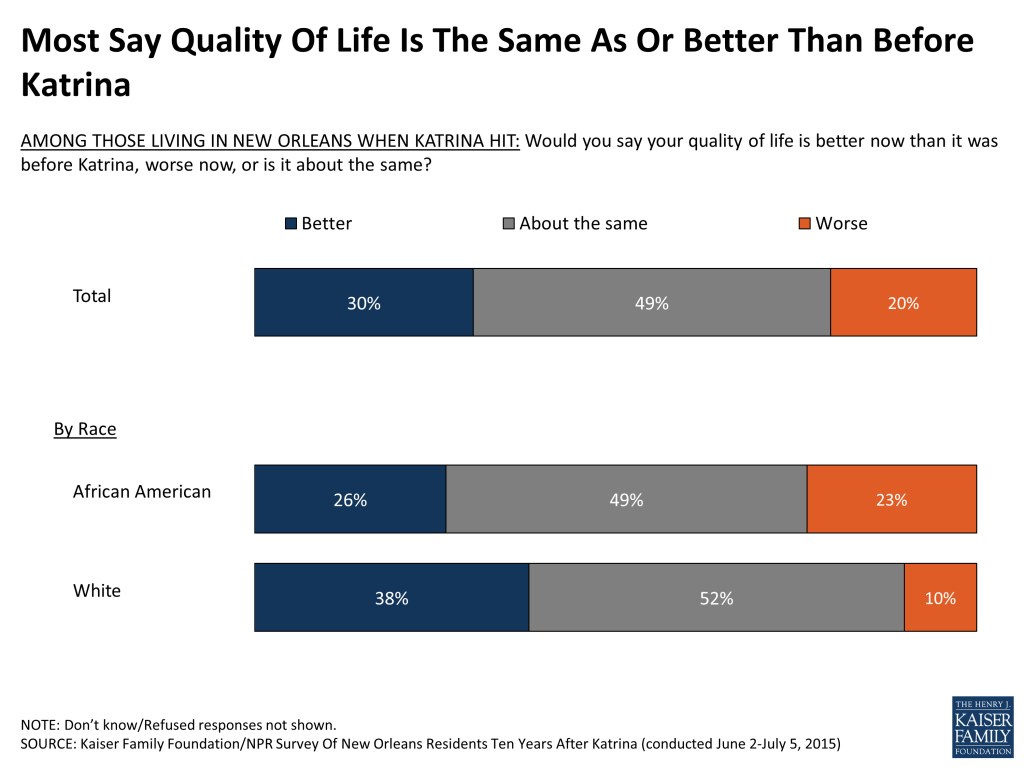
Overall, about half (49 percent) of those who were living in New Orleans at the time Katrina hit say their own quality of life is about the same as it was before the storm, while 30 percent say it is better and 20 percent say it’s worse. Of those who report a change, African Americans are split between saying their quality of life is better and worse (26 percent and 23 percent, respectively), while more whites say things have gotten better than say things have gotten worse (38 percent and 10 percent).
Similarly, half (50 percent) of those living in New Orleans when Katrina hit say their personal support network of relatives and friends is about the same as it was before the storm, while 31 percent say it’s better and 19 percent say it’s worse. African Americans whose residency pre-dates Katrina are somewhat more likely than whites to say their support network has gotten worse (24 percent versus 10 percent), and also more likely to say someone close to them died as a result of the storm (36 percent of African Americans versus 19 percent of whites).
Lingering Personal Impacts Of Katrina
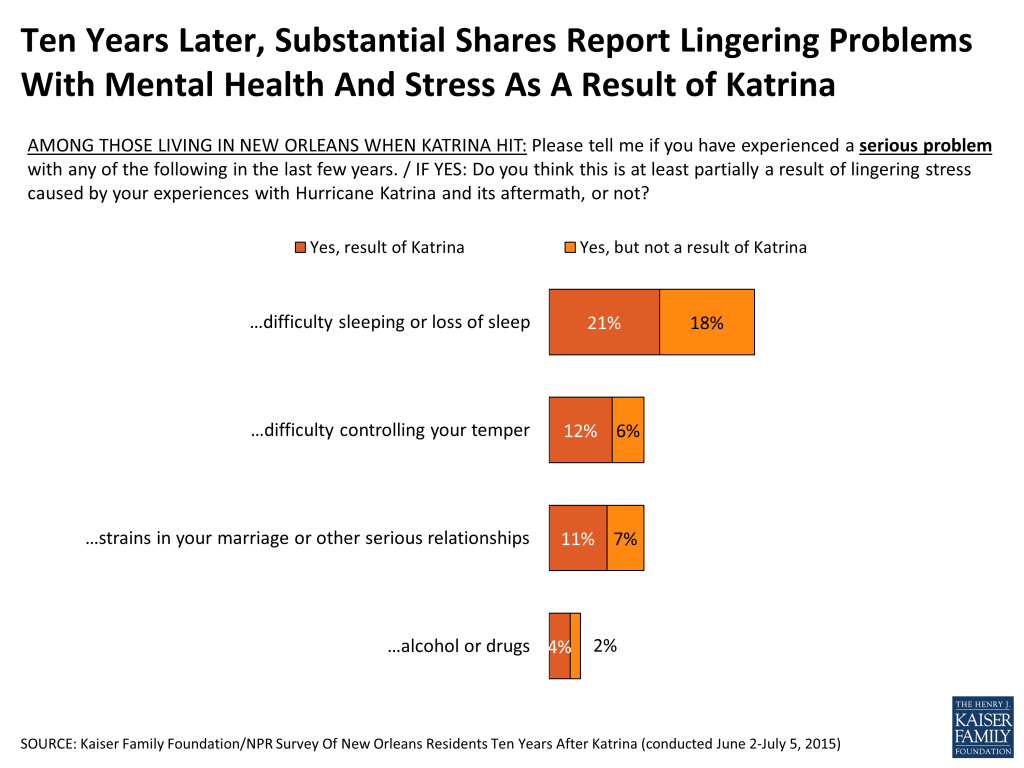
While most report a similar or improved quality of life, some residents who lived in New Orleans during Katrina report lingering mental health effects from their experience with the storm. Two in ten (21 percent) say they have had a serious problem with sleep loss in the past few years that is at least partially attributable to their experiences with Katrina. Smaller shares say they have had serious problems with controlling their temper (12 percent), strains in their marriage (11 percent), and alcohol or drug use (4 percent) and attribute these problems to their experiences during and after the storm.
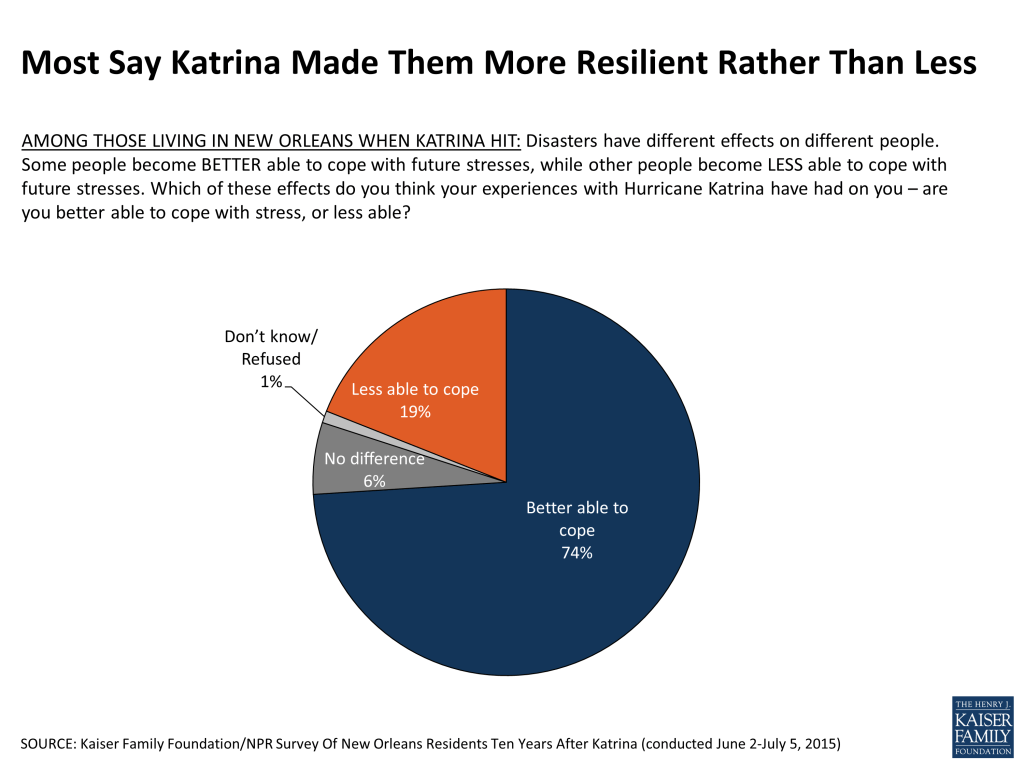
Despite these lingering problems for some, most of those who lived through Katrina and remain in New Orleans say the experience made them more resilient rather than less. Roughly three-quarters (74 percent) of residents who were living in New Orleans at the time of the storm say they are better able to cope with stress as a result, while one in five (19 percent) say the experience made them less able to cope. Perhaps reflecting other disparities noted in this report, African Americans are about twice as likely as whites to say their experiences with the storm made them less able to cope with stress (23 percent versus 11 percent).
It is worth noting that this survey can only represent the views of the city’s current residents, meaning those New Orleanians who remain or have returned to the city 10 years after the storm. If this question were asked of those who were displaced and have not been able to return, it’s quite possible a different picture of the impact of Katrina on people’s ability to cope might emerge.
Self-Assessments of Mental Health Similar to National
For the most part, residents’ assessments of their own mental health status and how well their mental health needs are being met are similar regardless of whether they lived through Katrina in New Orleans or moved there more recently, and are also similar to adults nationwide. About two-thirds (68 percent) of residents say their mental health is excellent or very good, similar to the share of adults nationally who said so in a Kaiser Family Foundation survey (70 percent).11 Seventeen percent – including equal shares of those living in New Orleans when Katrina hit and those who moved there after the storm – say they have taken medication for their emotions, nerves, or mental health in the past 6 months, similar to the 15 percent of adults nationally who reported doing so.12 And overall, the vast majority of residents (84 percent) say their mental health needs are being met “very” or “somewhat” well, again similar to 87 percent in the same national survey.
Key Findings: Section 5: Coming And Going
Newcomers Mostly Viewed Positively By Longer-Term Residents
The vast majority (85 percent) of current residents of Orleans Parish were also living in the New Orleans area when Hurricane Katrina hit. Compared to these longer-term residents, those who moved to the city in the past 10 years are more likely to be white (48 percent versus 31 percent), under the age of 50 (83 percent versus 55 percent), and have a college degree (45 percent versus 31 percent). Among the newcomers, most say they moved to New Orleans to be with family (31 percent) or for work (2o percent). Smaller shares say they moved to the city for school (12 percent), that they were born or raised in New Orleans or lived in the city previously and were returning (11 percent), or to volunteer (6 percent).
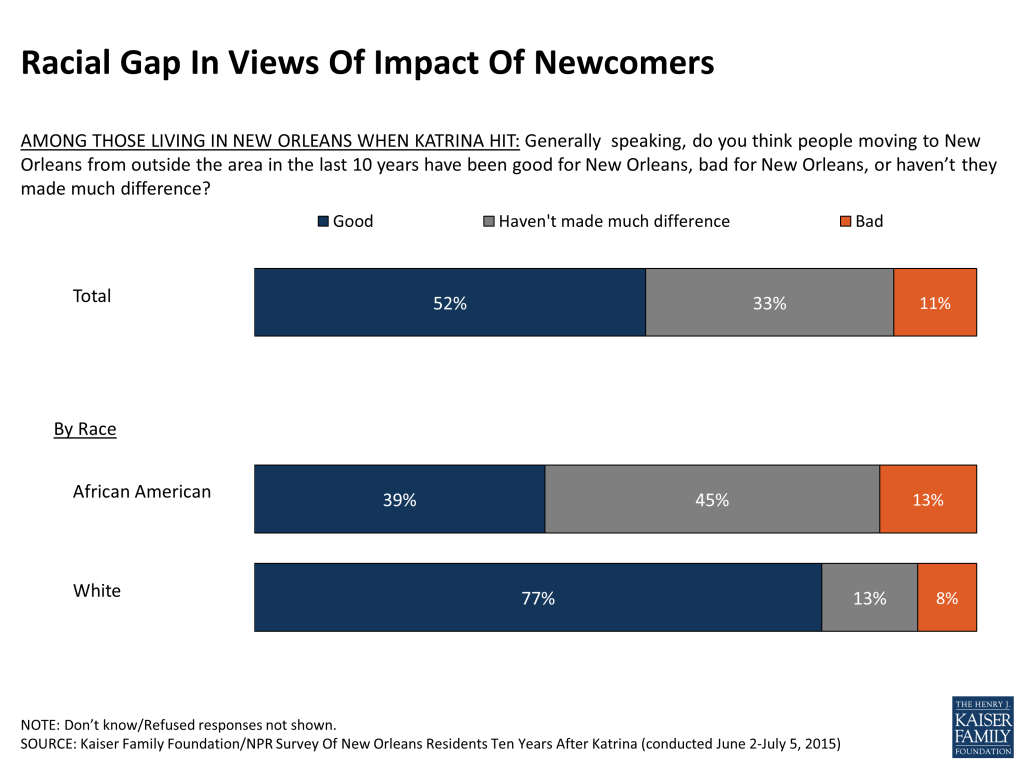
For the most part, longer-term New Orleans residents think that these newcomers have been good for New Orleans (52 percent), while a third (33 percent) say they haven’t made much difference and just one in ten (11 percent) say they have been bad for the city. Among longer-term residents, whites overwhelmingly see the newcomers as having a positive impact on the area (77 percent), while African Americans are more divided between saying they have been good for the city (39 percent) and haven’t made much difference (45 percent).
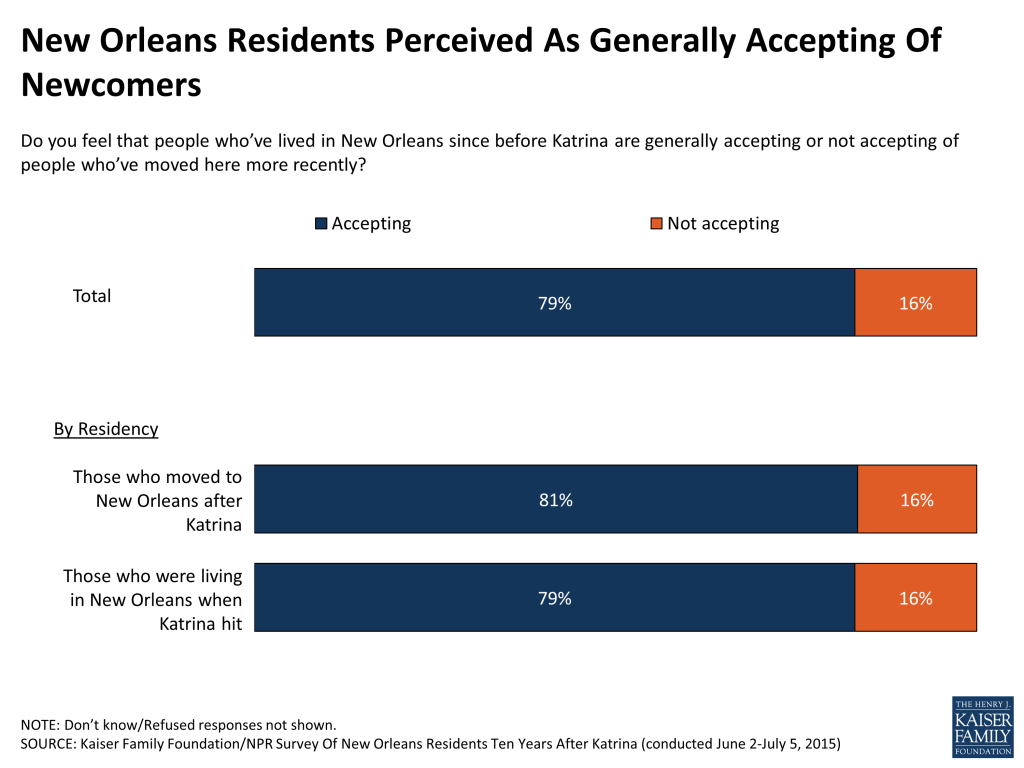
Regardless of their feelings about newcomers, New Orleanians’ reputation for being friendly and welcoming extends to all comers. Eight in ten residents overall (79 percent), including 81 percent of those who are newer to the city, say that the people who’ve lived in New Orleans since before Katrina are generally accepting of people who moved to the area more recently.
Moving Away
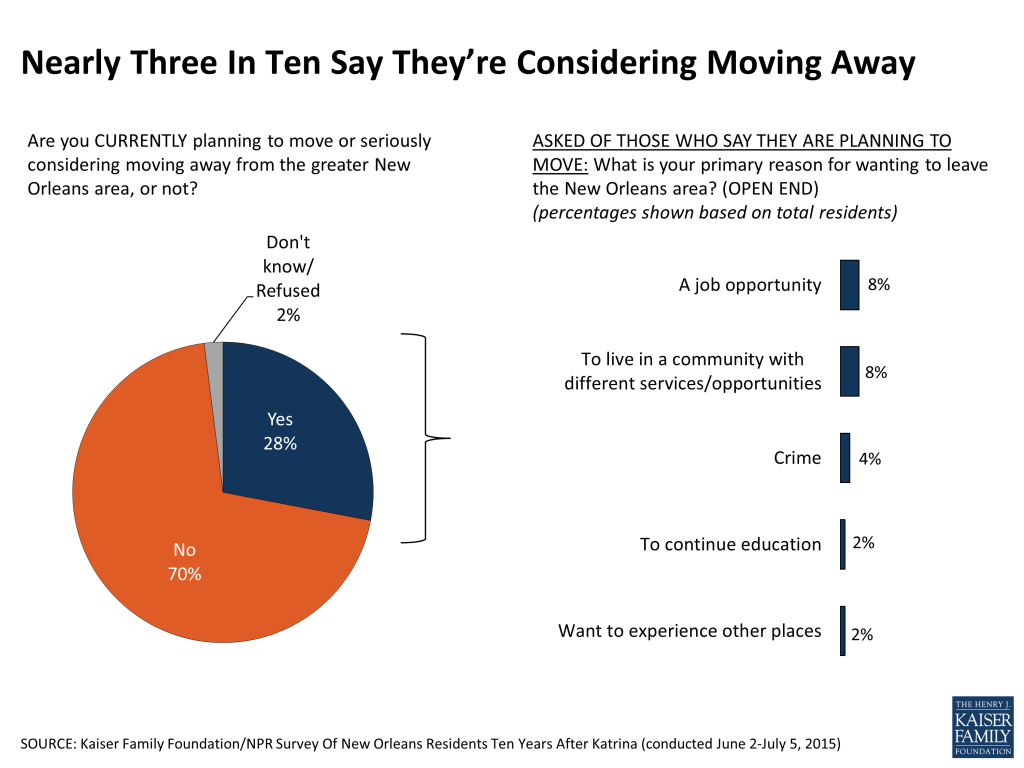
Among all current New Orleans residents, almost three in ten (28 percent) say they are currently planning to move away from the area or are seriously considering it, up slightly from 24 percent of residents who said the same five years ago. About twice as many African Americans as whites say this is their intention (35 percent, compared to 17 percent). The intention to move is mainly driven by those under age 30, 47 percent of whom say they are planning to leave (up from 37 percent of 18-29 year-olds in 2010).
Of those who say they are planning to move, most cite job opportunities elsewhere and the desire to live in a community with different services and opportunities as their main reasons (each reason accounts for about a quarter of those who are planning to move, or 8 percent of all residents). Others name crime (4 percent of all residents), educational opportunities (2 percent), and the desire to experience other places (2 percent) as their primary reason for wanting to leave.
Conclusion
Taken together, the survey findings highlight both the remarkable progress New Orleans has made in the 10 years since Katrina, as well as the stark challenges that remain. Perhaps the biggest of these challenges is one that was not brought about by the storm, but may have been exacerbated by it: the vast differences in the living circumstances of the city’s African American and white residents. These gaps are reflected not only in the rates at which African Americans and whites report ongoing financial problems and a lack of neighborhood services, but also in their feelings about how far New Orleans has come in its recovery and their views of the city as a good place for young people. Racial disparities in income and living conditions are not uncommon in urban areas across the U.S., and what we cannot tell from this survey is the degree to which any of the gaps identified are unique to New Orleans and its residents’ experiences with Katrina, or whether other cities would differ on these same dimensions. While a majority of both blacks and whites remain optimistic about New Orleans’ future, the fact that about a third of African Americans and nearly half of young adults are considering moving away is a potentially troubling sign for the city’s ability to maintain the vibrant and diverse community for which it has long been famous.
Methodology
The Kaiser Family Foundation/NPR Survey Of New Orleans Residents Ten Years After Katrina was conducted as part of a survey partnership between NPR and the Kaiser Family Foundation. Representatives of the two organizations worked together to develop the survey questionnaire, with NPR maintaining editorial control over its broadcasts and online reporting relating to the survey results. The Kaiser Family Foundation paid for all fieldwork costs associated with the survey. The 2015 survey builds on a series of three prior surveys conducted solely by the Kaiser Family Foundation in 2006, 2008, and 2010.
The survey was conducted June 2 – July 5, 2015, among 1,517 randomly selected adults ages 18 and older residing in Orleans Parish, Louisiana (the city of New Orleans). SSRS collaborated with Kaiser Family Foundation researchers on sample design and weighting, and supervised all phases of the fieldwork. Computer-assisted interviews conducted via landline telephone (705) and cell phone (812) were carried out in English and Spanish.
The survey is based on an overlapping dual-frame, random digit dial (RDD) design. The landline component consisted of randomly generated phone numbers in Orleans Parish, and the cell phone sampling frame consisted of all cell phone exchanges with the greater New Orleans area code. Marketing System Group (MSG) provided both the landline and cell phone samples. Respondents were asked to provide basic address information which was used to determine geographic eligibility. For the landline sample, respondents were selected by asking for the adult male or female living in the household who had the most recent birthday, based on a random rotation.
Efforts were made to maximize survey response, including: pre-testing the survey instrument to ensure it was working smoothly; completing at least 7 call attempts to any non-responsive numbers; varying the time of day and day of week for callbacks; and permitting respondents to schedule a callback at their convenience. Respondents concerned with the cost of their cell phone minutes were offered a $20 incentive to complete the survey.
The combined landline and cell phone sample was weighted to balance the sample demographics to match estimates for the adult population of Orleans Parish using data from the Census Bureau’s 2013 American Community Survey (ACS) for age-by-gender, race-by-gender, and education, as well as current patterns of telephone usage based on estimates from the CDC’s National Health Interview Survey (NHIS). The weight takes into account the fact that respondents with both a landline and cell phone have a higher probability of selection in the combined sample and also adjusts for the household size for the landline sample. All statistical tests of significance account for the effect of weighting.
The margin of sampling error including the design effect for the full sample is plus or minus 3 percentage points. Note that the survey included Orleans Parish residents in all their racial and ethnic diversity – including whites, African Americans, Hispanics, Asian Americans and those of other backgrounds – but because groups are represented based on their actual share of the total population, the only two groups large enough to be analyzed separately are African Americans and whites. The table below shows the number of respondents and margin of sampling error for the total sample and for these two key subgroups. Margins of sampling error for other subgroups may be higher, and are available by request. Note that sampling error is only one of many potential sources of error in this or any other public opinion poll.
| Number of Respondents | M.O.S.E | |
| Total 2015 | 1,517 | ±3 percentage points |
| African American 2015 | 764 | ±4 percentage points |
| White 2015 | 574 | ±5 percentage points |
| Total 2010 | 1,528 | ±3 percentage points |
| Total 2008 | 1,294 | ±3 percentage points |
| Total Orleans Parish 2006 | 901 | ±5 percentage points |
Kaiser Family Foundation public opinion and survey research is a charter member of the Transparency Initiative of the American Association for Public Opinion Research.
METHODOLOGY FOR PREVIOUS WAVES: NEW ORLEANS 2006, 2008 AND 2010
The methodology of the four surveys in this series has developed and adapted according to changing conditions on the ground in New Orleans. The 2006 survey was conducted at a time when New Orleans residents were still experiencing significant Katrina-related dislocation, a situation not conducive to a telephone-centered methodology. Instead, the 2006 survey employed an address based sample and all interviews were conducted face-to-face. By 2008, the situation had stabilized and we employed a mixed mode methodology, conducting roughly half the interviews via telephone, and the rest either in-person or via the Internet, again using an address-based sample. As the 2008 survey results suggested that only a very small proportion of the target population (2 percent or less) was without either landline or cell phone service, we switched to a dual-frame telephone methodology in 2010, similar to the methodology used for the current survey.
See full methodological information for the surveys in 2006, 2008 and 2010.
Endnotes
- The New Orleans Index at Ten: Measuring Greater New Orleans’ Progress toward Prosperity, The Data Center, July 2015. http://www.datacenterresearch.org/reports_analysis/new-orleans-index-at-ten ↩︎
- The New Orleans Index at Ten: Measuring Greater New Orleans’ Progress toward Prosperity, The Data Center, July 2015. http://www.datacenterresearch.org/reports_analysis/new-orleans-index-at-ten ↩︎
- “Poll Finds Most in U.S. Hold Dim View of Race Relations,” The New York Times, July 23, 2015. http://www.nytimes.com/2015/07/24/us/poll-shows-most-americans-think-race-relations-are-bad.html ↩︎
- The New Orleans Index at Ten: Measuring Greater New Orleans’ Progress toward Prosperity, The Data Center, July 2015. http://www.datacenterresearch.org/reports_analysis/new-orleans-index-at-ten ↩︎
- Tracking State Prison Growth in 50 States, Prison Policy Initiative, May 2014. http://www.prisonpolicy.org/reports/overtime.html ↩︎
- Criminal Justice: Changing Course on Incarceration, The Data Center, June 2015. http://www.datacenterresearch.org/reports_analysis/criminal-justice-changing-course-on-incarceration/ ↩︎
- Criminal Justice: Changing Course on Incarceration, The Data Center, June 2015. http://www.datacenterresearch.org/reports_analysis/criminal-justice-changing-course-on-incarceration/ ↩︎
- “New Orleans District Moves To An All-Charter System,” NPR, May 30, 2014. http://www.npr.org/sections/ed/2014/05/30/317374739/new-orleans-district-moves-to-an-all-charter-system ↩︎
- The State of Public Education in New Orleans 2014 Report, The Cowen Institute for Public Education Initiatives at Tulane University, July 2014. http://www.speno2014.com/wp-content/uploads/2014/08/SPENO-HQ.pdf ↩︎
- “New Orleans Hospital Is Replaced, With Hope of Preserving Its Mission,” The New York Times, August 1, 2015. http://www.nytimes.com/2015/08/02/us/new-orleans-hospital-is-replaced-with-hope-of-preserving-its-mission.html ↩︎
- National results from Kaiser Health Tracking Poll, Kaiser Family Foundation, June 2015. https://modern.kff.org/health-costs/poll-finding/kaiser-health-tracking-poll-june-2015/ ↩︎
- National results from Kaiser Health Tracking Poll, Kaiser Family Foundation, June 2015. https://modern.kff.org/health-costs/poll-finding/kaiser-health-tracking-poll-june-2015/ ↩︎