Kaiser Family Foundation/New York Times/CBS News Non-Employed Poll
Findings
To help shed light on recent trends in the U.S. employment market, the Kaiser Family Foundation partnered with The New York Times and CBS News to conduct a survey of adults between the ages of 25-54 (generally considered to be prime working age) who are not currently employed. Rather than focusing only on those who meet the official government definition of unemployment, this survey takes a broad look at all prime-age adults who are not working, regardless of their desire for work or job-seeking activities. While the official U.S. unemployment rate has declined since the start of the recession in late 20071 , the total share of adults who are not employed has risen in recent years. Economists consider this “labor force participation rate” at least as important as the official unemployment rate as a measure of the current and future health of the U.S. economy. This survey examines the views and experiences of this broad group of prime-age workers who are not employed, including how they get by financially, the factors to which they attribute their lack of employment, what it would take to get them working, and – for those who used to work – how being out of work has changed their lives.
Overall, the survey paints a portrait of a diverse group of Americans who are out of the workforce. This report focus on three main categories within the non-employed: those who say they have a disability that prevents them from working, those who are able to work and consider themselves unemployed, and those who are able to work and call themselves homemakers. (In a few places, it draws on data from the Kaiser Health Tracking Poll for comparisons to full-time workers in the same age range.) While most homemakers report that they are happy with their current situation, most of those who are disabled or unemployed say it is a source of stress, and that being out of work has been a hardship for them and their families. These latter two groups report a variety of negative impacts of being out of work in terms of health, relationships, and finances. The survey finds that most of those who are unemployed and looking for work would be willing to make a variety of sacrifices to find a new job, including in some cases taking significant pay cuts. In addition, it finds that most homemakers say they plan to go back to work in the future, and that many would be more likely to return to the workforce now for jobs that provide flexible hours, the ability to work from home, or an increase in pay over their most recent job.
See The New York Times and CBS News coverage of the poll:
The Vanishing Male Worker: How America Fell Behind, New York Times
The Rise of Men Who Don’t Work – and What They Do Instead, New York Times
America’s unemployed: Who are the Americans who aren’t working?, CBS News
Why U.S. Women Are Leaving Jobs Behind, New York Times
Key Differences in Being Out of Work for Men and Women, New York Times
As Robots Grow Smarter, American Workers Struggle to Keep Up, New York Times
Who Are The Non-Employed?
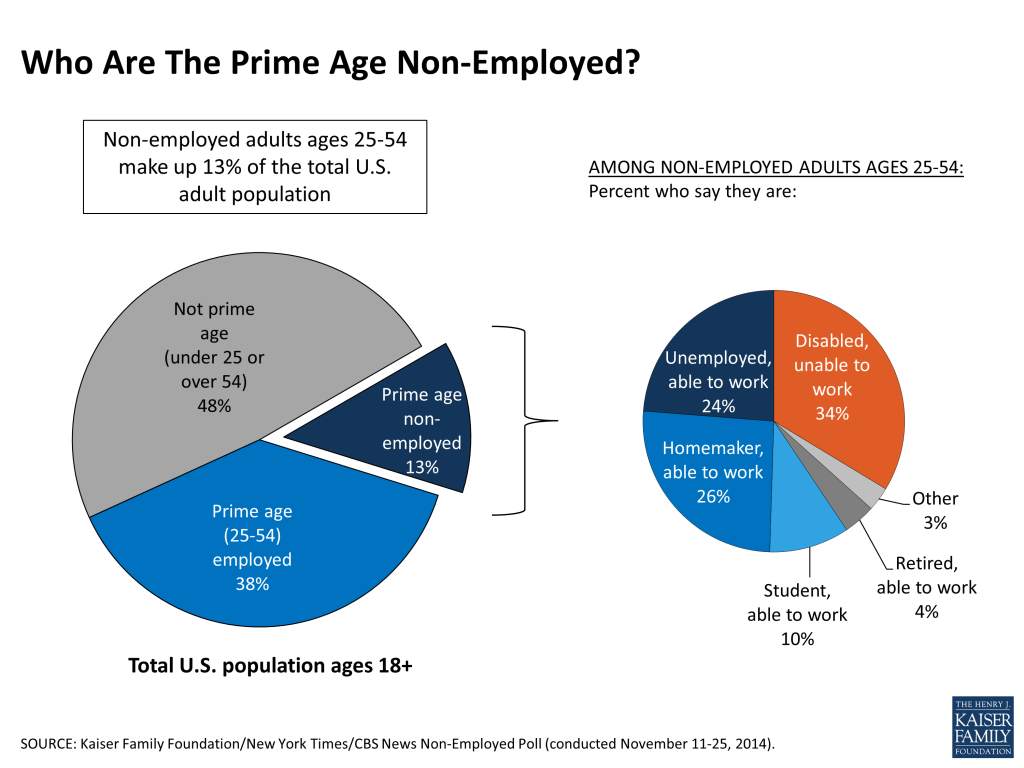
Americans ages 25-54 who are not currently working (a group we will refer to throughout this report as “the non-employed”)2 , make up 13 percent of the entire U.S. adult population. Among this group, about a third (34 percent) say they have a disability that prevents them from doing any kind of work for at least the next 6 months. The remainder say they are able to work, including about a quarter each who consider themselves unemployed (24 percent) and homemakers (26 percent), 10 percent who call themselves students and 4 percent who say they are retired.
Most of the non-employed (61 percent) say their last job ended after the start of the recession in December 2007, while a quarter (25 percent) say they have not worked since before the start of the recession and 13 percent have never had a full-time job.
Two-thirds (67 percent) of the non-employed are women, while six in ten full-time workers in the same age range are men3 . Compared with full-time workers, the non-employed are more likely to be African American (14 percent versus 10 percent) or Hispanic (20 percent versus 15 percent). More than half (54 percent) have only a high school education or less, and one in five (20 percent) have graduated from a 4-year college (compared with 39 percent of full-time workers).
The non-employed report being in significantly poorer health than their full-time working counterparts. Nearly four in ten (37 percent) say their health is “only fair” or “poor,” compared with just 11 percent of full-time workers. This difference in health status is driven largely (but not entirely) by those who say they have a disability that prevents them from working.
Three-quarters (74 percent) of the non-employed report having health insurance coverage. Compared with full-time workers, the non-employed are much less likely to get coverage through an employer (27 percent versus 77 percent), and are more likely to buy it on their own (12 percent) or get it through Medicaid (22 percent) or Medicare (9 percent). One-quarter of the non-employed are uninsured, about 10 percentage points higher than among full-time workers (14 percent).
| FIGURE 2: Demographics Of Non-Employed Versus Full-Time Workers | |||
| Non-Employed Ages 25-54 | Full-Time Workers Ages 25-544 | ||
| Gender | Male | 33% | 60% |
| Female | 67 | 40 | |
| Race/ethnicity | White, non-Hispanic | 57 | 66 |
| Black, non-Hispanic | 14 | 10 | |
| Hispanic | 20 | 15 | |
| Other/mixed | 7 | 8 | |
| Education | High school or less | 54 | 33 |
| Some college | 26 | 28 | |
| College graduate | 20 | 39 | |
| Health status | Excellent | 13 | 25 |
| Very good | 21 | 37 | |
| Good | 28 | 25 | |
| Only fair | 22 | 10 | |
| Poor | 15 | 1 | |
| Health insurance | Insured | 74 | 86 |
| Employer coverage | 27 | 77 | |
| Self-purchased | 12 | 5 | |
| Medicare | 9 | <1 | |
| Medicaid | 22 | 2 | |
| Other coverage | 4 | 1 | |
| Uninsured | 25 | 14 | |
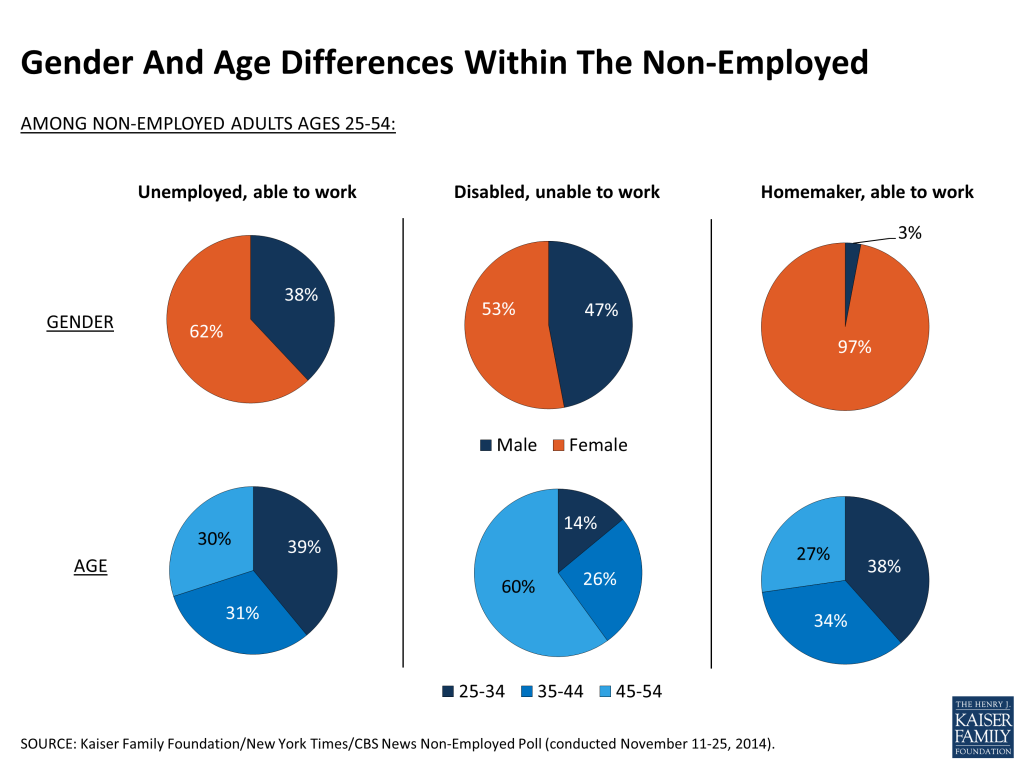
There are demographic differences within subgroups of the non-employed as well. The vast majority (97 percent) of those who call themselves homemakers are women, as are six in ten (62 percent) of those who say they are unemployed and able to work. Those who have a disability that prevents them from working are more evenly split between women (53 percent) and men (47 percent). Within the prime-age non-employed, those with a disability are also much older on average than those who say they are able to work – six in ten of them are between the ages of 45-54, compared with about three in ten among those without a disability.
These groups also differ greatly in terms of likeliness to have health insurance and sources of coverage. Eighty-five percent of those with a disability say they have coverage, mostly through public programs (61 percent). Three-quarters (74 percent) of homemakers report getting coverage, most commonly through a spouse’s employer (54 percent). Those who are unemployed and able to work are much less likely to report being insured, with four in ten (43 percent) saying they have no health insurance coverage at all.

Job-Wanting And Job-Seeking
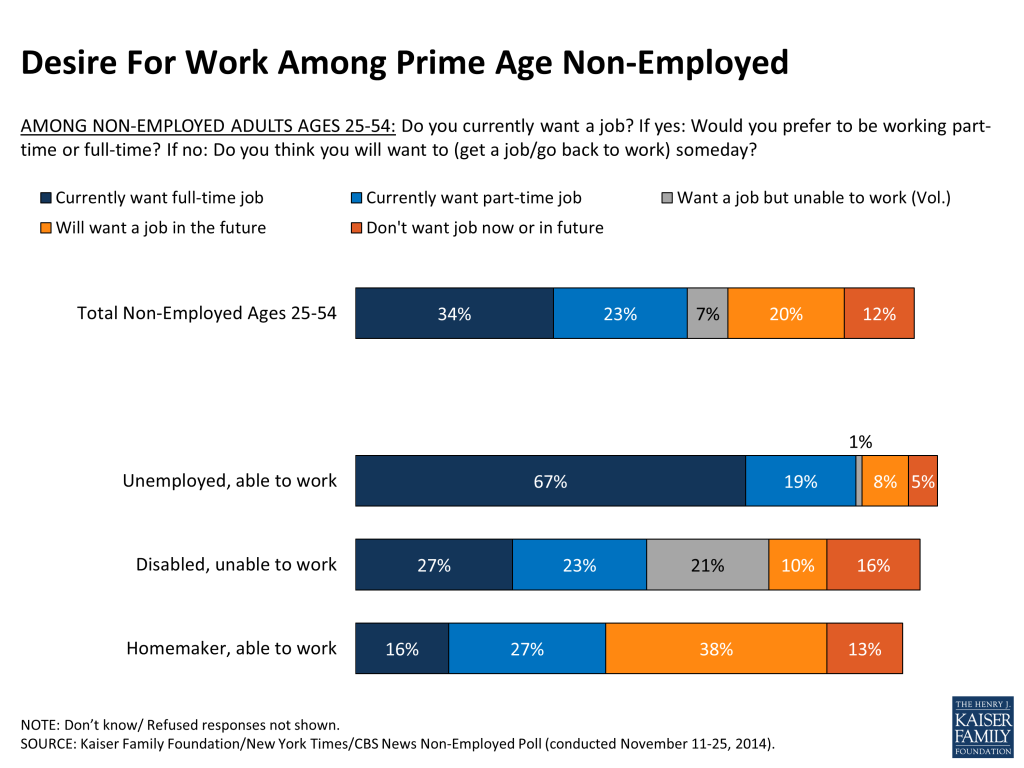
Nearly six in ten (57 percent) of the non-employed say they currently want a job, including 34 percent who say they want to be working full-time and 23 percent who part-time work. Among those who consider themselves unemployed and are able to work, the vast majority (87 percent) say they want a job, including 67 percent who want a full-time job. Even among those who say they have a disability that prevents them from working, fully half say they currently want a job, suggesting that many would prefer to return to work if their disability were not a factor.
About four in ten (43 percent) of those who call themselves homemakers and are not disabled say they currently want a job, though more would prefer part-time rather than full-time work (27 percent versus 16 percent). Overall, most homemakers say they either want a job now or will want to go back to work someday; just 13 percent of this group says they don’t want a job now and don’t think they’ll want one in the future.
Among those who consider themselves unemployed and able to work, most report that they have actively looked for work within the past year. Nearly eight in ten (78 percent) say they have contacted someone about finding a job or applied for a job within the past 12 months, including 57 percent who report having done so in the past 4 weeks. However, 14 percent say they haven’t done any active job-seeking in over a year, suggesting that they may have become discouraged and given up looking.

Factors Contributing To Being Out Of Work
The non-employed overall attribute their employment situation to a mix of personal and economic factors. Over half say family responsibilities (53 percent) and health problems (51 percent) are major or minor reasons why they’re not working, similar to the share who name lack of good jobs available (48 percent). Other reasons are cited by smaller shares, including lack of education and skills necessary for the jobs available (38 percent), not needing the income (38 percent), jobs being replaced by technology (30 percent), jobs going overseas (26 percent), and discrimination (22 percent).
This overall ranking of reasons masks some big differences between groups. For those who are able to work and consider themselves unemployed, the top reason is lack of good jobs available (66 percent), though about half name family responsibilities (52 percent) as well. Among homemakers, family responsibilities are far and away the top reason (84 percent), followed by not needing the income (50 percent). Still, a substantial share of homemakers (41 percent) say lack of good jobs available is a major or minor reason why they’re not working, suggesting that many of them might have continued working or returned to the job market if more attractive opportunities were available. For those with a disability, health problems are by far the most common reason given for being out of work (96 percent), though many cite other contributing factors as well, including lack of good jobs available (45 percent).
| FIGURE 7: Factors Contributing To Employment Situation Among Non-Employed | ||||
| All Non-Employed | Unemployed, Able To Work | Disabled, Unable To Work | Homemaker, Able To Work | |
| Percent who say each is a major or minor reason why they are not working | ||||
| Family responsibilities | 53% | 52% | 37% | 84% |
| Health problems or disability | 51 | 32 | 96 | 22 |
| Lack of good jobs available | 48 | 66 | 45 | 41 |
| Lack of education or skills necessary for the jobs available | 38 | 42 | 38 | 29 |
| You don’t need the income | 38 | 35 | 34 | 50 |
| Jobs being replaced by technology | 30 | 35 | 34 | 23 |
| Jobs going overseas | 26 | 32 | 30 | 19 |
| Discrimination | 22 | 28 | 26 | 15 |
General Impacts Of Not Working
Almost two-thirds of those with a disability who are unable to work (64 percent), and of those who consider themselves unemployed and are able to work (63 percent), say that their employment situation is a source of stress, including about four in ten who say it’s a major source of stress in their lives. Among full-time workers in the same age range, far fewer (42 percent) say their employment situation is a source of stress, including just 14 percent who say it’s a major source. By contrast, those who call themselves homemakers are far less likely to feel stressed about their employment situation, with over three-quarters (77 percent) saying it is not a source of stress at all.
| FIGURE 8: Employment-Related Stress Among Non-Employed And Full-Time Workers | |||||
| Non-Employed Ages 25-54 | Full-Time Workers Ages 25-545 | ||||
| Total | Unemployed, Able To Work | Disabled, Unable To Work | Homemaker, Able To Work | ||
| Percent who say their employment situation is: | |||||
| Source of stress (NET) | 49% | 63% | 64% | 22% | 42% |
| Major | 30 | 43 | 43 | 7 | 14 |
| Minor | 19 | 20 | 21 | 15 | 28 |
| Not a source of stress | 50 | 36 | 34 | 77 | 57 |
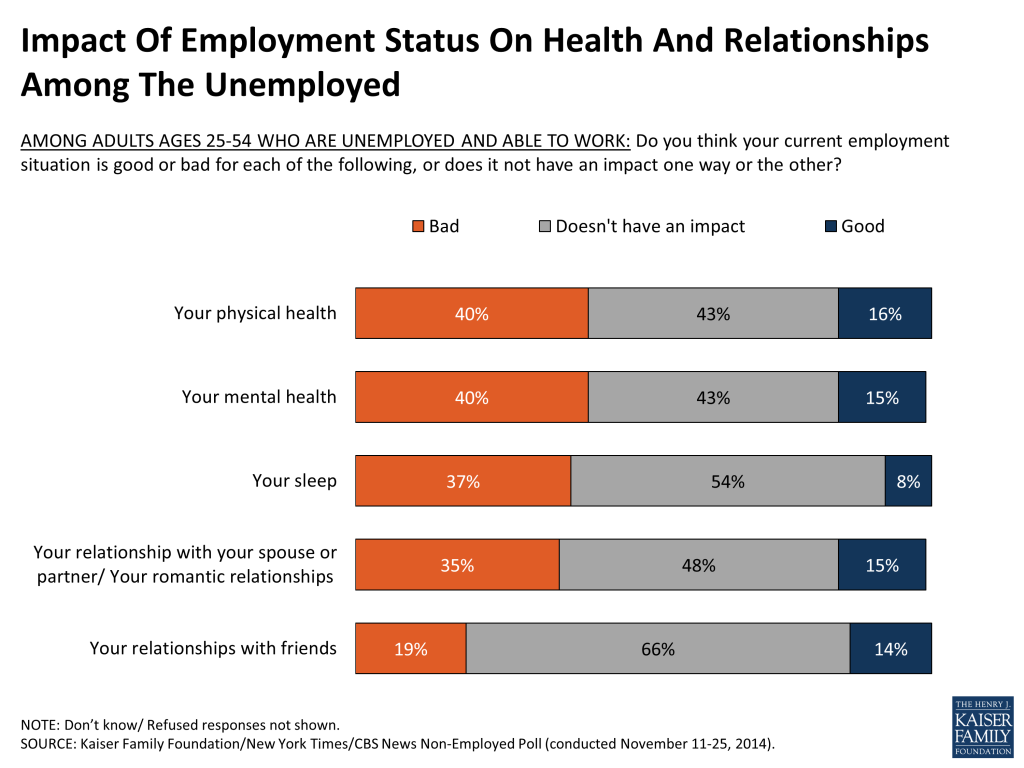
Many of those who are unemployed and able to work report feeling a negative impact on their health and relationships. This group is more likely to say their employment situation is bad rather than good for their physical health (40 percent versus 16 percent), their mental health (40 percent versus 15 percent), their sleep (37 percent versus 8 percent), and their romantic relationships (35 percent versus 15 percent). However, they are equally likely to see a positive as a negative impact on their relationships with friends, with most saying it hasn’t had much impact.
How Do The Non-Employed Make Ends Meet?
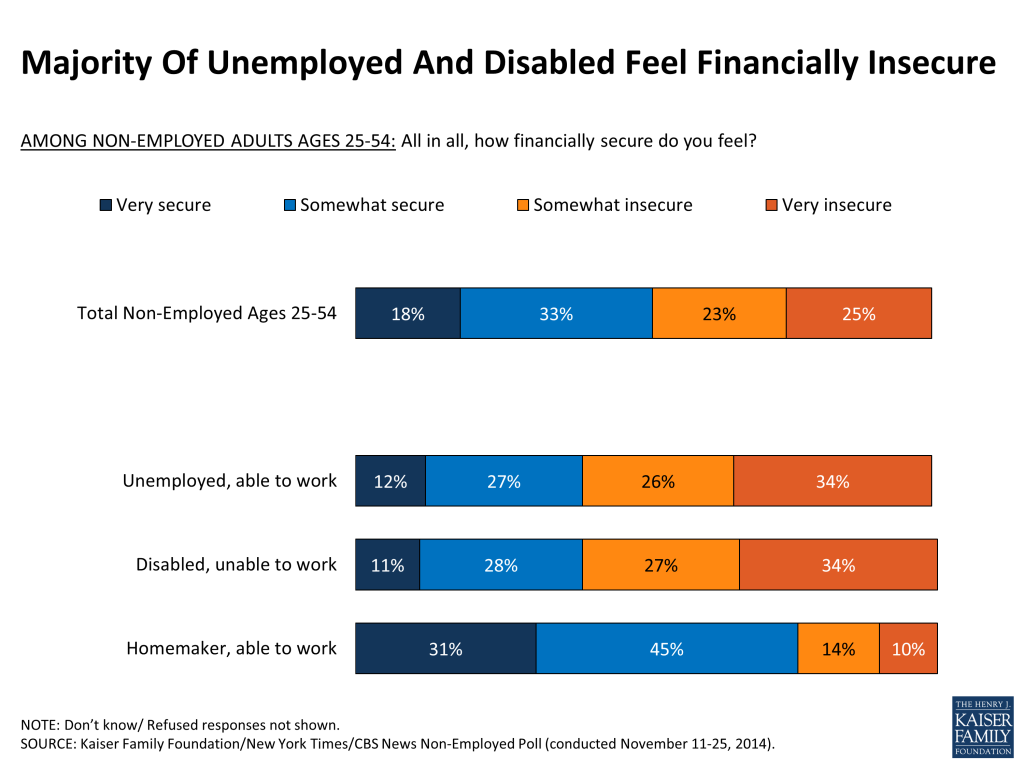
About half (51 percent) of the non-employed overall say they feel financially secure, including 18 percent who feel very secure and 33 percent who feel somewhat secure. The other half say they feel somewhat (23 percent) or very insecure (25 percent). While three-quarters (76 percent) of homemakers report feeling financially secure, about six in ten of those who are unemployed and disabled say the opposite (60 percent and 61 percent, respectively.
The non-employed report relying on a variety of sources of income and benefits. The most common is income from a spouse or another employed person in their household (42 percent), followed by Food Stamps (30 percent), disability benefits (28 percent), and money from family and friends (26 percent). Less common sources are income from temporary work or odd jobs (19 percent), money taken out of savings or retirement (17 percent), and spousal or child support (11 percent). Just 3 percent report getting unemployment benefits.
These sources of income vary greatly within the non-working population. Those who are unemployed and able to work report relying on a variety of sources, with about a third each saying they get income from a spouse or another employed person in their household (34 percent), money from family from friends (33 percent), Food Stamps (32 percent), and income from temporary work or odd jobs (31 percent). Those with a disability that prevents them from working are most likely to report getting disability benefits (69 percent) and Food Stamps (45 percent). By contrast, the main source of income for homemakers is income from a spouse or another employed person in the household (71 percent).
| FIGURE 11: Sources Of Income And Benefits Among The Non-Employed | ||||
| All Non-Employed | Unemployed, Able To Work | Disabled, Unable To Work | Homemaker, Able To Work | |
| Percent who say they get any income, money, or benefits from: | ||||
| Income from spouse or another employed person in household | 42% | 34% | 30% | 71% |
| Food Stamps | 30 | 32 | 45 | 14 |
| Disability benefits, SSI, or SSDI | 28 | 8 | 69 | 2 |
| Money from family and friends | 26 | 33 | 29 | 10 |
| Income from temporary work or odd jobs | 19 | 31 | 9 | 16 |
| Money taken out of savings or retirement | 17 | 24 | 12 | 11 |
| Spousal or child support | 11 | 12 | 6 | 19 |
| Unemployment benefits | 3 | 7 | 2 | 1 |
For Those Who Used To Work, How Has Being Out Of Work Changed Their Lives?
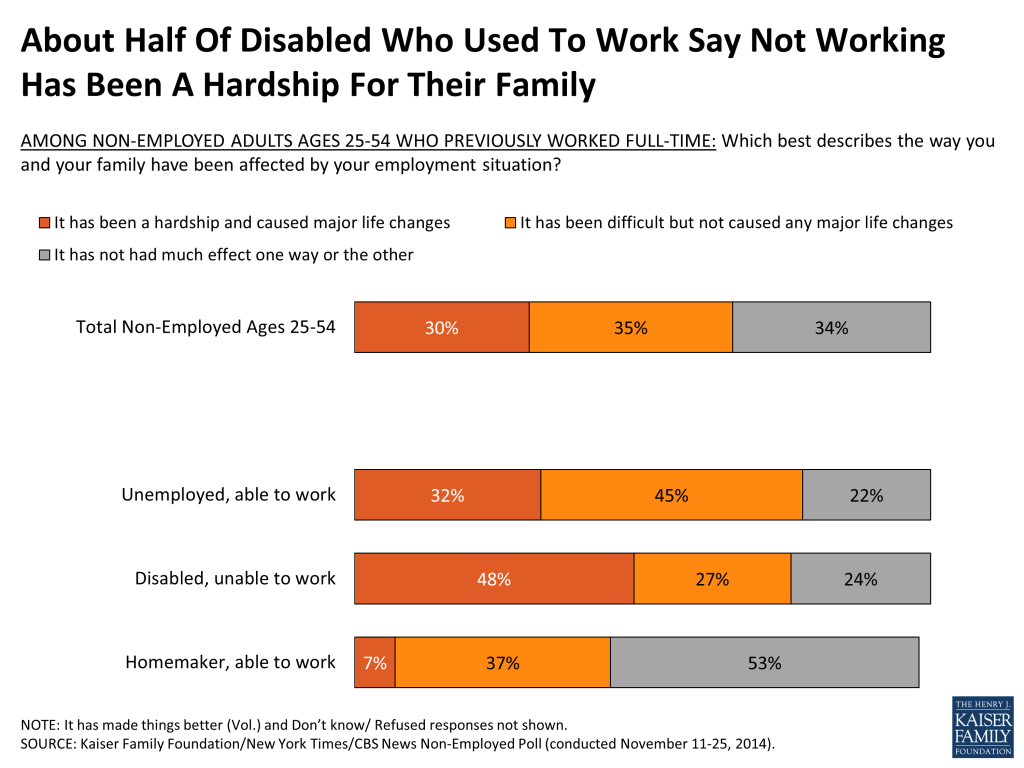
Among those who used to work full-time (who make up 87 percent of the prime-age non-employed), roughly equal shares say being out of work has been a hardship and caused major life changes (30 percent), that it’s been difficult but not caused major life changes (35 percent), and that it hasn’t had much of an impact one way or another (34 percent). Those who used to work but now have a disability that prevents them from working are the most likely to report experiencing major hardship as a result of being out of work (48 percent), followed by those who are unemployed (32 percent). Few previously employed homemakers (7 percent) say that not working has been a major hardship, though nearly four in ten (37 percent) say it has been difficult.
This may be related to the fact that two-thirds (67 percent) of previously employed homemakers say it was their own decision to leave their last job, while just three in ten (31 percent) of the unemployed and a quarter (25 percent) of those who are unable to work due to a disability say the same.
Those who were previously employed also report a variety of financial impacts as a result of not working. Not surprisingly, this is particularly true for those who are either disabled or able to work but unemployed, and less so for those who call themselves homemakers. Most commonly, about half of those who call themselves unemployed (50 percent) and disabled (54 percent) say they’ve borrowed money from family and friends as a result of being out of work. At least four in ten in each of these groups say they have put off health care they thought they needed because of the cost (47 percent and 41 percent, respectively) or taken money out of savings or retirement accounts to make ends meet (43 percent and 40 percent). A third (35 percent) of the unemployed and half (50 percent) of those with a disability and a say they’ve been contacted by a collection agency. A quarter (24 percent) of the unemployed and 45 percent of the disabled say they have received food from a non-profit or religious organization. Smaller, but still important shares of these groups say they have changed their living situation, such as moving in with a friend or relative to save money (35 percent and 28 percent), increased their credit card debt (27 percent and 26 percent), missed a rent or mortgage payment (24 percent and 28 percent), or had at least one of their utilities turned off (12 percent and 19 percent) as a result of being out of work.
| FIGURE 13: Financial Impacts Of Being Out Of Work Among Previously Employed | ||||
| All Non-Employed Who Ever Had A Full-Time Job | Unemployed, Able To Work | Disabled, Unable To Work | Homemaker, Able To Work | |
| Percent who say each of the following has happened as a result of not working | ||||
| Borrowed money from family or friends | 41% | 50% | 54% | 16% |
| Put off or postponed getting needed health care because of cost | 37 | 47 | 41 | 22 |
| Taken money out of savings or retirement | 37 | 43 | 40 | 27 |
| Been contacted by a collection agency | 35 | 35 | 50 | 21 |
| Received food from a non-profit or religious organization | 29 | 24 | 45 | 15 |
| Changed living situation to save money | 26 | 35 | 28 | 9 |
| Increased credit card debt to pay bills | 25 | 27 | 26 | 20 |
| Missed a rent or mortgage payment | 20 | 24 | 28 | 6 |
| Had any utilities turned off | 13 | 12 | 19 | 2 |
For those who used to work, being out of work has also changed their daily activities. Large shares of the previously employed say that since they stopped working, they spend more time doing household work or chores (57 percent), engaging in leisure activities like reading and watching TV (56 percent), and caring for family members who need assistance (45 percent). The vast majority of previously employed parents of minor children (88 percent) say they now spend more time on child care.
What Would It Take To Get The Non-Employed Working?
Among those who consider themselves unemployed and able to work, most are at least somewhat optimistic about their future job prospects. Half (50 percent) of this group says it’s very likely that they’ll be working 6 months from now, and another 35 percent think it somewhat likely. Among homemakers, most don’t think it’s likely that they’ll be working in the next 6 months, but over half (53 percent) say it’s very or somewhat likely that they’ll be working in one year, and over seven in ten (72 percent) think they’re likely to be working 5 years in the future. By contrast, a majority (57 percent) of those with a disability that prevents them from working now say it’s unlikely they’ll be working 5 years from now.
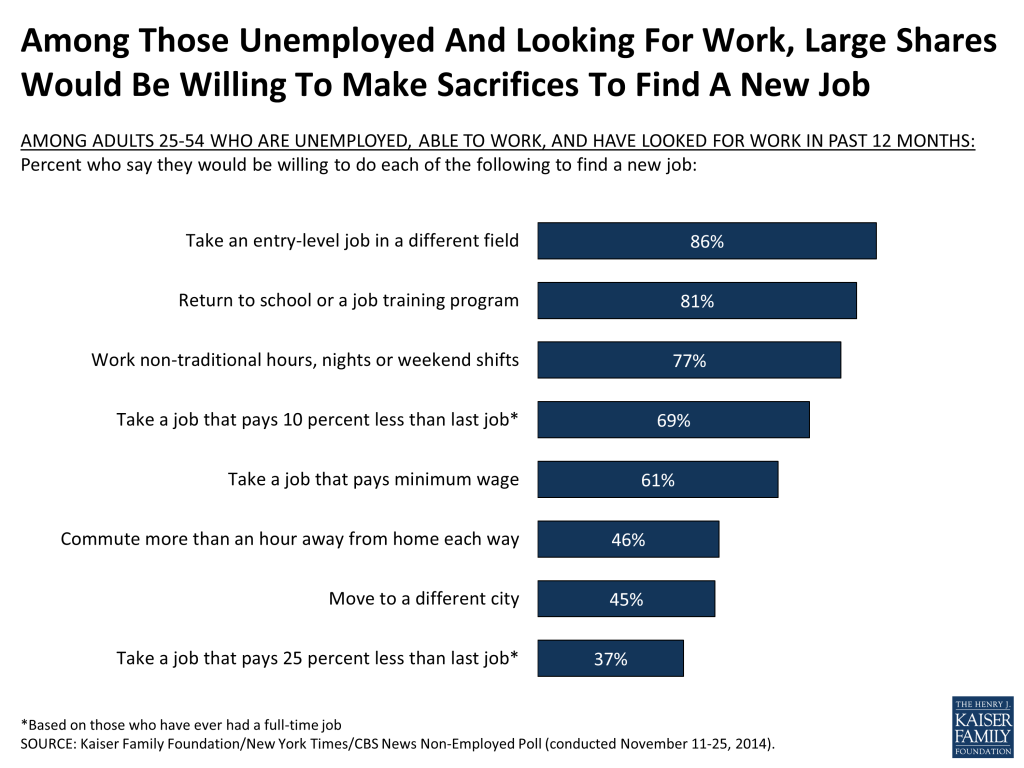
Among those who consider themselves unemployed, able to work, and have looked for a job in the past year (an approximation of those who are “in” the market for a job), large shares report being willing to make various sacrifices in order to find work. Over eight in ten say they would willingly take an entry-level job in a new field (86 percent) or return to school or a job training program (81 percent), and about three-quarters would be willing to work non-traditional hours such as night or weekend shifts (77 percent). Six in ten (61 percent) say they’d be willing to work for minimum wage. Among those who’ve worked previously, nearly seven in ten (69 percent) say they’d be willing to take a 10 percent pay cut from what they earned at their last job, though fewer (37 percent) would be willing to accept a 25 percent reduction. Nearly half also say they’d be willing to move to a different city (45 percent) or take a job that requires more than an hour commute each way (46 percent).
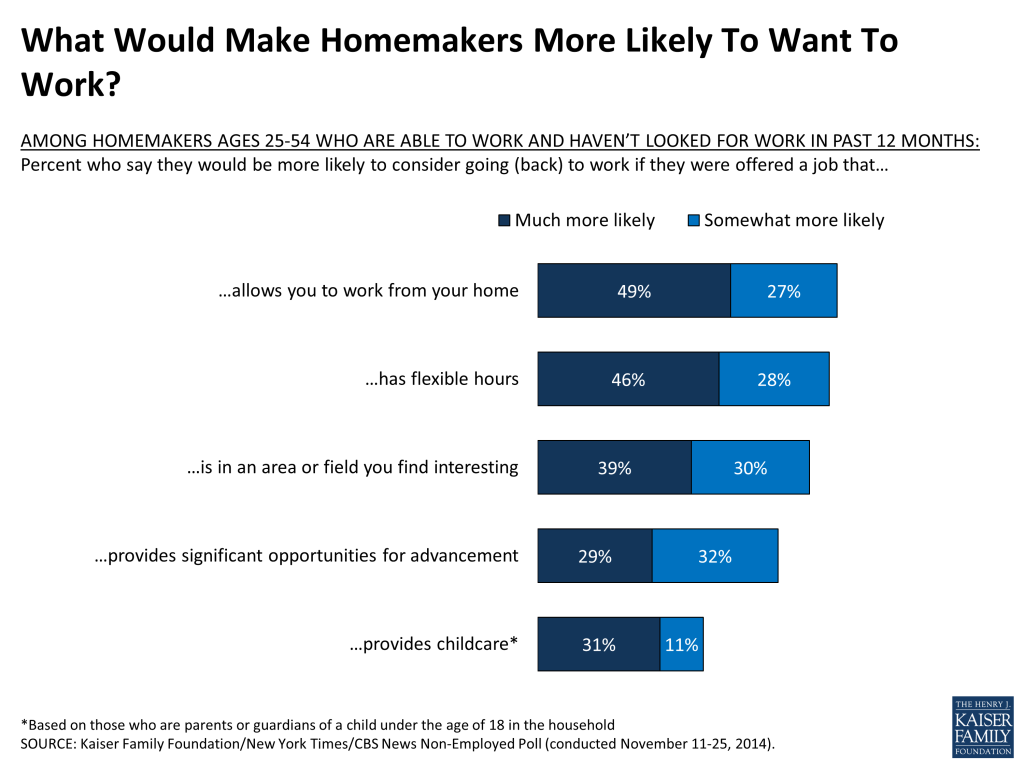
On the other side, many homemakers who say they are able to work but have not looked for a job in over a year (those who are “out” of the market for a job) say they’d be more likely to consider taking a job if it came with certain perks, including being allowed to work from home, having flexible hours, being in an interesting field, providing significant opportunities for advancement, and offering childcare.
The large majority (91 percent) of homemakers who are “out” of the market for a job say that they would be willing and able to take a job that pays 10 percent more than their previous job, suggesting that many of those who are not in the job market now could be enticed back to work for an increase in pay.
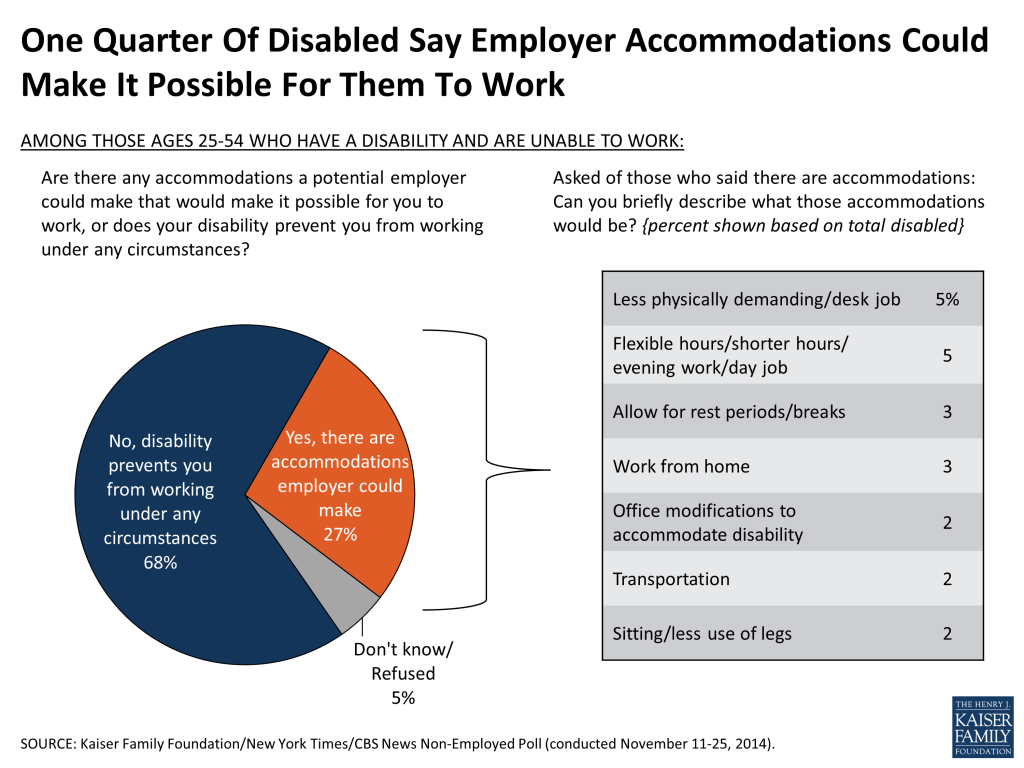
Among those who are disabled and unable to work, about two-thirds (68 percent) say their disability prevents them from working under any circumstances, while just over a quarter (27 percent) say there are accommodations an employer could make that would make it possible for them to work. These range from physical accommodations such as office modifications and limits on physical work, to scheduling accommodations such as flexible hours and rest periods, to other accommodations such as help with transportation and being allowed to work from home.
Conclusion
Americans of prime working age who are not currently working – including those who are counted in government statistics as officially unemployed and those who fall in the category of “outside the labor force” – represent a diverse and complicated group. Their reasons for not working are multiple and varied, with health problems, family responsibilities, and a sense that there are no good jobs available playing the most prominent roles.
Those who consider themselves unemployed and able to work (who make up about a quarter of the non-employed) report facing particular struggles as a result of their situation, and most say they’d be willing to make a variety of sacrifices in order to find a job. These individuals see a lack of good jobs available as the main factor contributing to their lack of employment, yet most are at least somewhat hopeful about finding work in the future. Those with a disability that prevents them from working (who make up a third of the non-employed) also report a variety of ill-effects of being out of work, and their future outlook is more pessimistic than it is for the able-bodied unemployed. Although many say they want to be working, most say their disability prevents them from working under any circumstances, and most do not expect to find work in the future. Still, about a quarter say they could return to work with certain accommodations, suggesting that a segment of this population may return to the workforce in the future. The survey also points out the role of government benefits in helping this group make ends meet, as many report relying on public programs for income, food assistance, and health care.
The experiences of those who call themselves homemakers (who make up a quarter of the non-employed) stand in sharp contrast to these previous two groups. Most say they are not working by their own choice, and most have the resources – such as income from a working spouse – to feel financially secure. Still, the survey suggests that at least some homemakers see a lack of good jobs as one reason they’re not currently working, and many say they could be enticed back into the job market for a job that paid more or offered perks such as flexible hours. There is a gender component underlying all of this, with nearly all homemakers and a majority of the able-bodied unemployed being women. These non-working women, who are more likely than their male counterparts to have children living at home, may place more of a premium on jobs that allow them the flexibility to help care for their children.
Methodology
The Kaiser Family Foundation/New York Times/CBS News Non-Employed Poll is based on telephone interviews conducted November 11 through November 25 with 1,002 respondents between the ages of 25 and 54 who are currently not employed either full-time or part-time. Interviews were administered in English and Spanish, combining random samples of both landline and cellular telephones.
The Foundation, The Times, and CBS News contributed financing for the survey, and teams from all three organizations worked together to develop the questionnaire and analyze the data. Each organization is solely responsible for its content.
SSRS of Media, Pennsylvania conducted sampling, interviewing, and tabulation for the survey. Respondents were reached in one of three ways:
- 350 interviews were completed with respondents reached through random-digit dialing to landline (N=151) and cell phones (N=199) specifically for the Non-Employed Poll;
- 157 interviews were completed with respondents reached via landline (N=78) and cell phone (N=79) as part of the weekly SSRS omnibus poll, which also utilizes random digit dialing to reach respondents;
- 495 interviews (261 landline and 199 cell phone) were completed by dialing numbers where interviews had been recently completed as part of the SSRS omnibus poll and respondents’ previous answers indicated they met inclusion criteria for the survey.
For each sample, landline telephone exchanges were randomly selected from a complete list of active phone exchanges. The samples were designed so that the selected exchanges amounted to a proportional geographic representation of the U.S. (including Alaska and Hawaii). Within each exchange, random digits were added to form complete telephone numbers. Cellular telephone numbers were generated using a similar procedure to the one described for landlines. Both the landline and cell phone samples were generated by Marketing Systems Group. Within each household reached by landline, one qualifying adult was designated by a random procedure to be the respondent for the survey. Cell phone interviews were completed with the qualifying adult answering the phone.
Interviewers made multiple attempts to reach every phone number in the survey, calling back unanswered numbers on different days at different times of both day and evening, and attempting to convert initial refusals.
The combined results have been weighted to adjust for the fact that not all survey respondents were selected with the same probability, to address the implications of sample design, and to account for systematic nonresponse along known population parameters. The first weighting stage was conducted separately for each of the 3 samples, and addressed differences in probability of selection stemming from respondents’ likelihood of owning multiple telephones, as well as the number of adults in each household. The callback sample was also adjusted for individual propensity to respond to a follow-up contact.
In the second weighting stage, the 3 samples were combined and adjusted to match known demographic distributions of the target population. Typically, researchers use demographic weighting parameters based on national administrative data sources such as the U.S. Census Bureau’s American Community Survey. However, the non-employed as defined for this poll are not equivalently captured by the Census Bureau employment definitions. Thus, to generate population parameters, SSRS calculated population weights for all interviews completed to date in 2014 on its omnibus poll with respondents 25 to 54 years old (N=19,269) by matching estimates from the Census Bureau’s Current Population Survey March 2014 Supplement based on age, gender, race/ethnicity, nativity (for Hispanics), education, marital status, Census region, and phone status. These interviews were then filtered to only include those ages 25 to 54 who are non-working (N=4,574). This created population parameters unique to the target population, which were used as targets for demographic weighting of the combined sample. Self-defined employment status (homemaker, student, retired, temporarily unemployed, other) was also added as a weighting target in the final stage.
The margin of sampling error including the design effect for the full sample is plus or minus 4 percentage points. Numbers of respondents and margin of sampling error for key subgroups are shown in the table below. For results based on other subgroups, the margin of sampling error may be higher. Sample sizes and margins of sampling error for other subgroups are available by request. Note that sampling error is only one of many potential sources of error in this or any other public opinion poll.
| Group | N (unweighted) | M.O.S.E. |
| Total Non-Employed Ages 25- 54 | 1,002 | ±4 percentage points |
| Disabled, unable to work | 406 | ±6 percentage points |
| Able to work, unemployed | 205 | ±8 percentage points |
| Able to work, homemaker | 239 | ±8 percentage points |
Kaiser Family Foundation public opinion and survey research is a charter member of the Transparency Initiative of the American Association for Public Opinion Research.
Endnotes
- Congressional Budget Office, Slack in the Labor Market in 2014, September 2014. https://www.cbo.gov/publication/45683 ↩︎
- For purposes of this report, “non-employed” or refers to adults between the ages of 25-54 who answer “not at all” to the question: “Are you currently employed full-time, part-time, or not at all?” ↩︎
- Comparisons to full-time workers ages 25-54 are based on the November Kaiser Health Tracking Poll, conducted Nov. 5-13, 2014. ↩︎
- Source: November Kaiser Health Tracking Poll, conducted Nov. 5-13, 2014. ↩︎
- Source: November Kaiser Health Tracking Poll, conducted Nov. 5-13, 2014. ↩︎