Medicare Advantage Quality Bonus Payments Will Total at Least $12.7 Billion in 2025
The House-passed reconciliation bill includes only a few provisions that directly affect Medicare spending. It includes no provisions related to Medicare Advantage, the private plan alternative to traditional Medicare, even though analysis by the Medicare Payment Advisory Commission (MedPAC) estimates payments to Medicare Advantage plans are $84 billion (or 20%) more than spending for similar beneficiaries in traditional Medicare. In contrast, the bill instead focuses on major changes to Medicaid and the Affordable Care Act (ACA), which would reduce federal spending by over $1 trillion and increase the number of uninsured people by an estimated 10.9 million. (When combined with the effects of allowing the ACA’s enhanced premium tax credits to expire, CBO estimates 16 million more people will be uninsured in 2034.) Despite some reports last week that Senate Republicans were considering including changes to how the federal government adjusts payments to Medicare Advantage plans based on the health status of their enrollees, those now appear unlikely to be included in the Senate version.
The Medicare Advantage quality bonus program, established by the Affordable Care Act, increases Medicare payments to Medicare Advantage plans based on a five-star rating system. Plans may, but are not required to, use the additional payments to cover the cost of supplemental benefits, including reduced cost sharing, extra benefits not covered by traditional Medicare (e.g., vision, hearing and dental), and lowering Part B and/or Part D premiums. The star ratings are intended to help consumers make informed decisions when choosing among Medicare Advantage plans and the bonus payments are intended to encourage plans to compete based on quality. However, MedPAC and others have observed that the star ratings incorporate too many measures, do not adequately account for social risk factors, and may not be a useful indicator of quality because star ratings are reported at the contract rather than the plan level. Medicare Advantage contracts typically include multiple plans, which may have different benefits, costs, networks, service areas, and enroll different populations (i.e., plans that are open for general enrollment and special needs plans that limit enrollment to dual-eligible individuals).
Critiques of the quality bonus program have led to calls to replace, reform or end the program. In 2018, the Congressional Budget Office estimated that eliminating the quality bonus program would lower federal spending by almost $100 billion over ten years. Given the sharp increase in both actual and projected Medicare Advantage enrollment since CBO’s analysis, the savings from eliminating bonuses could be substantially higher. For example, 33 million people were enrolled in Medicare Advantage in 2024, which was 5 million more than CBO projected at the time of the analysis, and CBO’s most recent projections for future Medicare Advantage enrollment are nearly 30% higher than previously projected. The degree to which changes to the quality bonus program would impact plan quality or the availability of supplemental benefits would depend on the specifics of any proposal and how insurers modified plan offerings in response. Though the proposal that had reportedly been under consideration by the Senate, the No UPCODE Act, does not directly address the quality bonus program, to the extent the changes in the legislation results in lower risk scores of Medicare Advantage enrollees, spending under the quality bonus program would also be lower.
This analysis examines trends in bonus payments to Medicare Advantage plans, enrollment in plans in bonus status (plans that qualify for a benchmark increase based on their quality star rating), and how these measures vary across plan types using publicly available information on Medicare Advantage enrollment, payment rates, and quality ratings.
Key Takeaways:
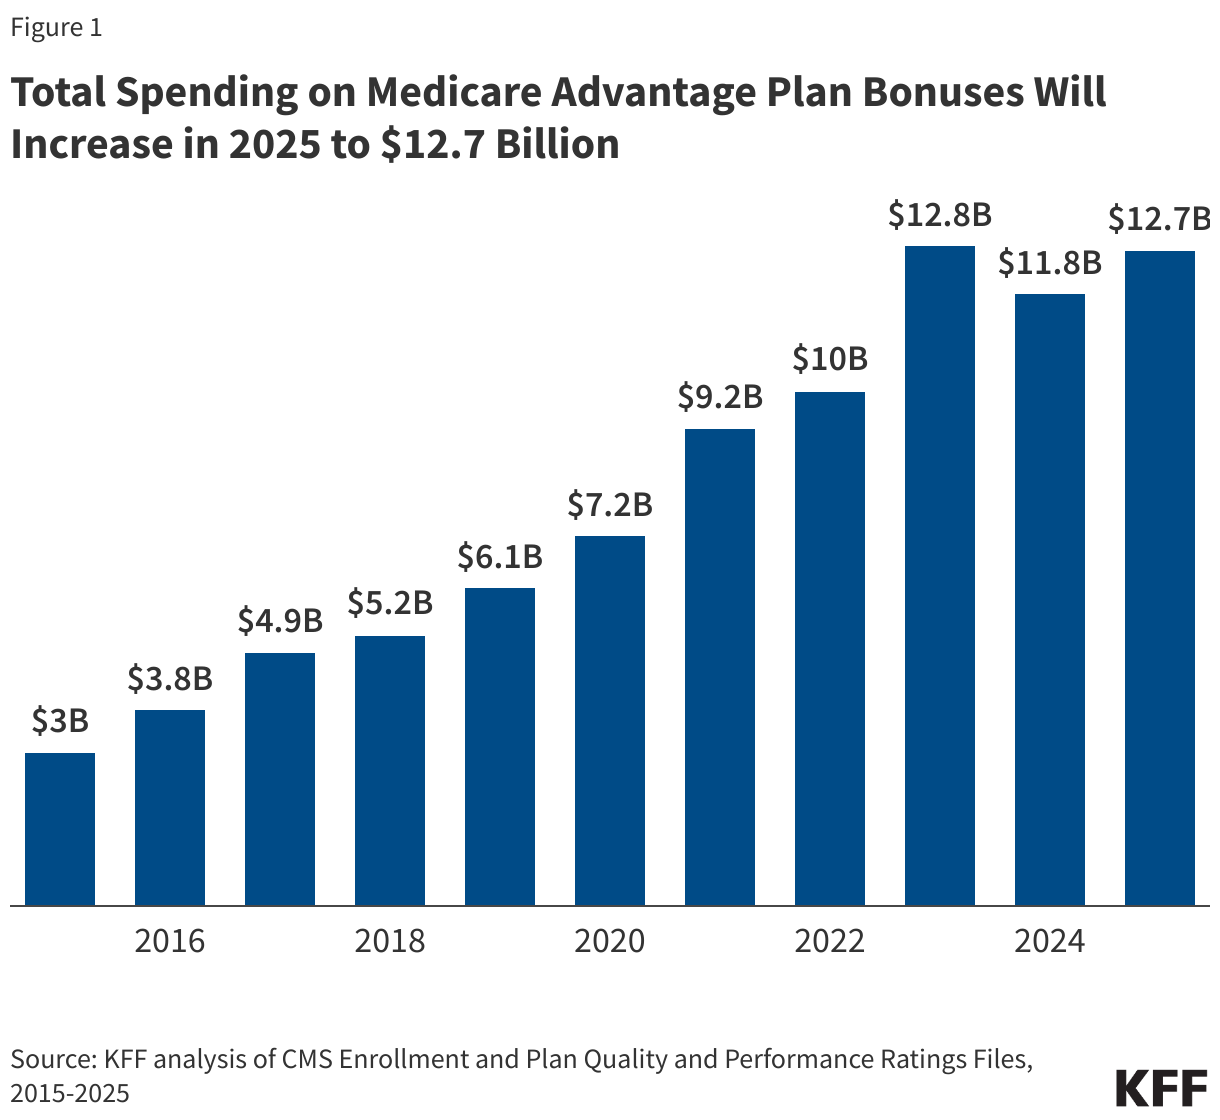
- Federal spending on Medicare Advantage bonus payments will total at least $12.7 billion in 2025, similar to spending in 2023, and more than four times higher than in 2015. Since 2015, Medicare has spent at least $87 billion on quality bonus program payments.
- Most Medicare Advantage enrollees (75%) are in plans that are receiving bonus payments in 2025. Since 2019, at least 7 in 10 Medicare Advantage enrollees have been in a plan receiving a bonus payment.
- The average bonus payment per enrollee is highest for employer- and union-sponsored Medicare Advantage plans ($438) and lowest for special needs plans ($332), raising questions about the implications of the quality bonus program for high-need beneficiaries.
Medicare Advantage plans will receive at least $12.7 billion in bonus payments in 2025.
Estimated bonus payments to Medicare Advantage plans will total at least $12.7 billion in 2025, similar to 2023. Bonus payment spending had decreased slightly in 2024 following a decline in star ratings after the expiration of COVID-19 pandemic-era policies. Those policies prevented individual measures that go into calculating the star ratings from declining between 2021 and 2022 and temporarily increased star ratings for certain plans. Bonus payments have increased sharply since the program started, more than quadrupling from $3.0 billion in 2015 to $12.7 billion in 2025 (Figure 1). The total spending on the quality bonus program is less than 2.5% of the projected payments to Medicare Advantage plans in 2025 ($540 billion).
Medicare spending on bonus payments has grown faster than enrollment in Medicare Advantage, which has doubled since 2015. This spending comes at a time when the Medicare program is facing growing fiscal pressures. Medicare Advantage benchmarks (and corresponding spending) have grown faster than traditional Medicare spending in part because of the increase in bonus payments.
These estimates are a lower bound because bonus payments are risk adjusted, which is likely to increase bonus payments. The estimates also do not include additional spending that results if plans increase their bids when their benchmark is higher because of being in bonus status. For example, a plan might increase its bid to increase payments to providers, add more expensive providers to its network, or retain a larger amount as profit, provided they meet medical loss ratio requirements.
The distribution of bonus spending across plan types is similar to the distribution of enrollment in 2025, though employer plans comprise a slightly larger share of bonus spending than enrollment. Individual plans account for 61% ($7.8 billion) of bonus spending and 62% of enrollment, employer plans account for 20% ($2.5 billion) of bonus spending and 17% of enrollment, and special needs plans account for 19% ($2.4 billion) of bonus spending and 21% of enrollment in 2025 (Appendix Table 1).
Most Medicare Advantage enrollees (75%) are in plans that receive bonus payments.
In 2025, nearly 26 million people, or 75% of Medicare Advantage enrollees, are in plans that are receiving bonuses. That compares to just under 9 million people (55%) in 2015 (Figure 2). The share of enrollees in plans that receive bonus payments in 2025 is slightly higher than the previous year (72%).

Average annual bonus payments are highest for enrollees in employer- and union-sponsored plans.
In 2025, Medicare Advantage plans receive an average annual bonus of $372 per enrollee, more than double the $184 average bonus per enrollee in 2015 (Appendix Table 2). Average bonuses in group employer- and union-sponsored plans have consistently been higher than for other plans. The average bonus per enrollee in a group employer- or union-sponsored Medicare Advantage plan is $438 in 2025, compared to $368 for individual plans and $332 for special needs plans (SNPs) (Figure 3).

Bonuses are higher per enrollee in employer plans because these plans have higher average star ratings, resulting in a larger share of enrollees receiving coverage from plans that qualify for bonuses. Across the entire period of 2015 to 2025, the share of all enrollees in employer- or union-sponsored plans that received a bonus never went below 80%. In contrast, at least 80% of enrollees in individual and special needs plans were in a plan that received a bonus in only one year – 2023 (Figure 4).

Relatively low bonus payments for special needs plans, raises questions about the implications for higher need beneficiaries, including people who are dually eligible for Medicare and Medicaid.
Box 1. Medicare Advantage Star Ratings
A key feature of the quality bonus program is the star rating system. Star ratings are used to determine two parts of a Medicare Advantage plan’s payment: (1) whether the plan is eligible for a bonus, and (2) the portion of the difference between the benchmark and the plan’s bid that is paid to the plan. The benchmark is the maximum amount the federal government will pay for a Medicare Advantage enrollee and is a percentage of estimated spending in traditional Medicare in the same county, ranging from 95 percent in high-cost counties to 115 percent is low-cost counties. The bid is the plan’s estimated cost for providing services covered under Medicare Parts A and B.
Since 2015, plans that receive at least four (out of five) stars have their benchmark increased. For most plans in bonus status, the benchmark is increased by five percentage points. Plans in “double bonus” counties – defined as urban counties with low traditional Medicare spending and historically high Medicare Advantage enrollment—have their benchmark increased by 10 percentage points. In addition, the benchmarks for plans without ratings due to low enrollment or being too new are increased by 3.5 percentage points. The benchmarks are capped and cannot be higher than they would have been prior to the ACA. This can result in plans that are eligible under the quality bonus program receiving a smaller increase to their benchmark, or in some cases, no increase at all.
This work was supported in part by Arnold Ventures. KFF maintains full editorial control over all of its policy analysis, polling, and journalism activities.
Jeannie Fuglesten Biniek and Tricia Neuman are with KFF. Anthony Damico is an independent consultant.


Methods
This analysis uses data from the Centers for Medicare & Medicaid Services (CMS) Medicare Advantage Enrollment, Crosswalk and Landscape files for the respective year.
This analysis includes HMO, POS, local PPO, regional PPO, and PFFS plans. Enrollment counts in publications by firms operating in the Medicare Advantage market, such as company financial statements, might differ from KFF estimates due to inclusion or exclusion of certain plan types, such as SNPs or employer plans.
To calculate federal spending on quality bonus program payments we first obtained information on star ratings from the Part C and Part D Performance Data, Star Ratings Data Table for the previous plan year. These are the ratings on which a plan’s benchmark is based. We then determined each plan’s benchmark using these data and information from the Medicare Advantage Rate Book, Rate Calculation Data, which provides the benchmark by county for plans with a 5%, 3.5% and 0% bonus. A plan’s bonus payment per enrollee is equal to the difference between its quality adjusted benchmark (either the 5% or 3.5% bonus rate) and the benchmark if the plan was not in bonus (0% bonus rate), multiplied by the relevant percentage based on its star rating and year (for example, 65% for plans with 4 stars and 70% for plans with at least 4.5 stars in 2025). The bonus per enrollee is multiplied by enrollees in March of each year to get total spending. Actual bonus payments will depend on the risk scores of Medicare Advantage enrollees. According to the plan payment data release by CMS, the average risk score of MA enrollees was above 1 for every year from 2015 through 2023 (the most recent year for which data are available), meaning our estimates likely understate actual spending.