Primary Care Physicians Accepting Medicare: A Snapshot
Data Note
Policymakers, researchers, and the media have periodically raised questions about the ease or difficulty that Medicare patients experience when trying to find physicians who will see them. Previous studies show that the vast majority of physicians accept Medicare, but the proportion taking new Medicare patients is smaller, particularly among primary care physicians compared with specialists.1 Primary care is especially important for people with Medicare—55 million seniors and adults with permanent disabilities—because they are significantly more likely than others to have multiple chronic conditions.
This Data Note presents findings on reported acceptance of Medicare patients among non-pediatric primary care physicians, based on data from the Kaiser Family Foundation/Commonwealth Fund 2015 National Survey of Primary Care Providers. In addition to comparing physicians’ acceptance of Medicare to private insurance and Medicaid, this Data Note also explores the characteristics of non-pediatric primary care physicians who accept new Medicare patients and who have greater shares of Medicare patients in their caseloads. This analysis is limited to non-pediatric primary care physicians, given its Medicare focus. The methodology for the survey is provided in the Appendix.
Patient acceptance by type of insurance
The vast majority of non-pediatric primary care physicians (93 percent) say they accept Medicare—comparable to the share accepting private insurance (94 percent) (Figure 1). A majority of primary care physicians also say they are also taking new Medicare patients (72 percent), but this share is somewhat lower than the share of primary care physicians accepting new privately insured patients (80 percent).
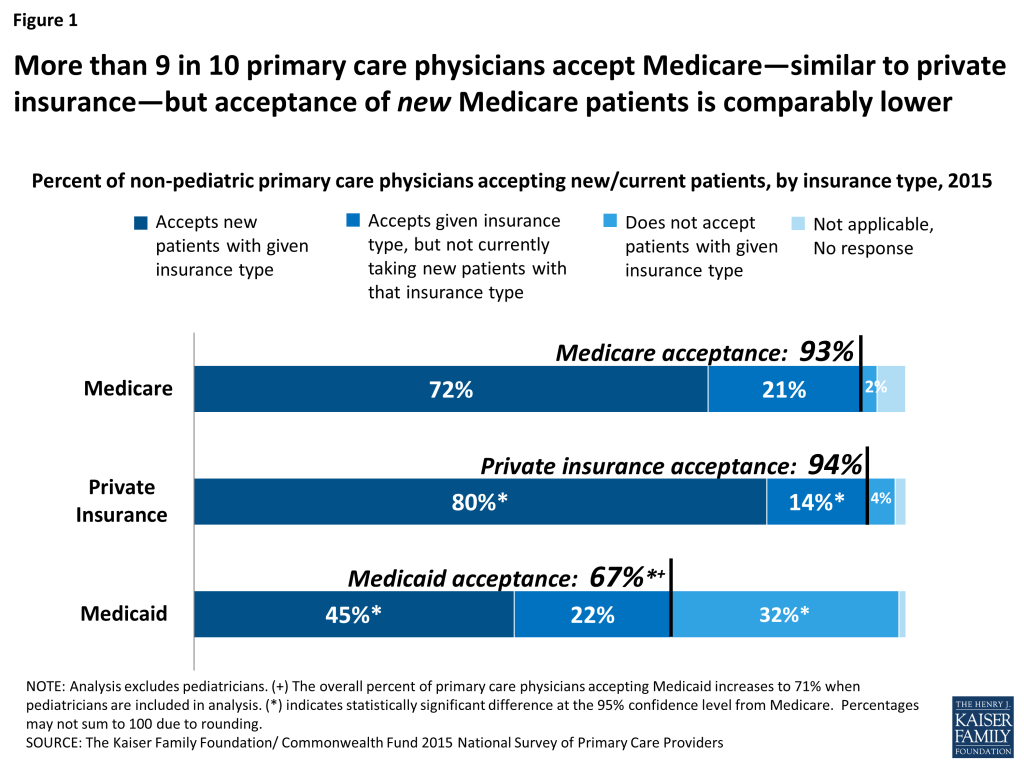
Compared with Medicare and private insurance, a lower share of non-pediatric primary care physicians—67 percent—say they accept Medicaid, the state-federal program that focuses primarily on coverage for children and adults with low-incomes. If pediatricians were included in the analysis of Medicaid acceptance, the share of physicians accepting Medicaid increases to 71 percent, reflecting the higher rate of Medicaid acceptance among pediatricians—84 percent. (Children account for almost half of the Medicaid-covered population.2 ) Further analysis of Medicaid acceptance among primary care physicians is discussed in a recently released issue brief by the Kaiser Family Foundation and the Commonwealth Fund.3
Primary care physicians who indicate that they are not taking new patients of a given insurance may have “closed practices,” which means they are not taking any new patients, regardless of insurance. In fact, in a separate survey question, about 2 in 10 primary care physicians (19 percent) report that they are not currently taking any new patients (not shown).
Primary care physicians taking Medicare
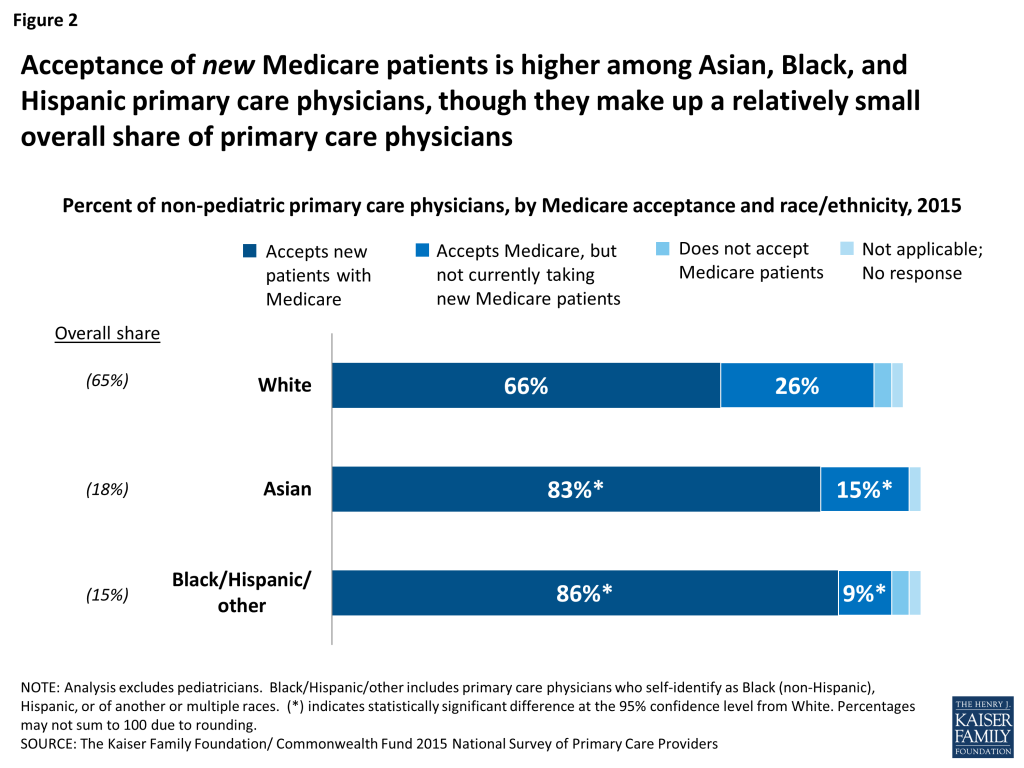
Demographic analysis reveals some differences in the rates at which different types of physicians report accepting new Medicare patients. For example, 83 percent of primary care physicians who self-identify as Asian accept new Medicare patients, similar to the 86 percent among physicians who self-identify as either Black, Hispanic, or of another or multiple races (Figure 2). In contrast, a lower share of white primary care physicians (66 percent) say they are accepting new Medicare patients. Notably, while higher shares of Black and Hispanic primary care physicians accept new Medicare patients, Black and Hispanic physicians continue to comprise a relatively small share of the overall non-pediatric primary care physician workforce.4
About two-thirds (67 percent) of primary care physicians age 55 or older say they accept new Medicare patients compared with about three-quarters (76 percent) of primary care physicians under age 55 (Figure 3). Younger doctors may be more likely to be building their patient caseloads and, therefore, may be more willing to take new patients. Alternatively, older physicians may have fuller practices and have less capacity to accept new patients. In fact, 78 percent of non-pediatric physicians age 55 and older say they are accepting new patients (regardless of insurance) compared with 83 percent among their younger counterparts (not shown).
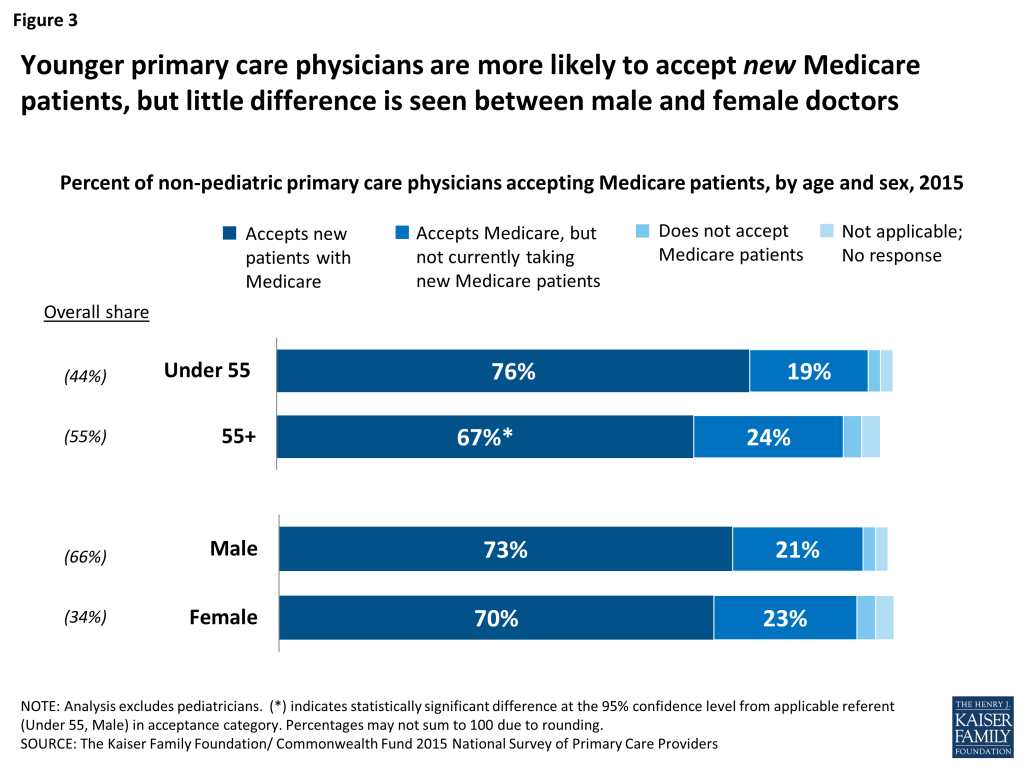
There is little difference between the share of male and female non-pediatric primary care physicians accepting new Medicare patients, though males comprise about two-thirds of the total non-pediatric primary care workforce.
In rural areas, a somewhat higher share of primary care physicians (81 percent) report accepting new Medicare patients relative to their counterparts who practice in cities (72 percent), but differences from cities compared to suburban areas or small towns are not statistically significant (Appendix Table 1). Further analysis by the demographics of physicians’ patient caseloads (income and race, for example), type of practice (such as, hospital-owned or independent practice), does not reveal notable differences regarding acceptance of new Medicare patients. Appendix Table 1 provides these results in more detail.
primary care physicians with relatively high shares of Medicare patients
About one-third of non-pediatric primary care physicians (32 percent) say that at least half their patients have Medicare (Figure 4). This cohort of physicians with the highest share of Medicare patients in their caseload is disproportionately male and older. Among physicians for whom at least half their patients have Medicare, 82 percent are male and 60 percent are age 55 and older. In comparison, among physicians with lower shares of Medicare patients in their caseloads, 58 percent are male and 37 percent are age 55 and older.
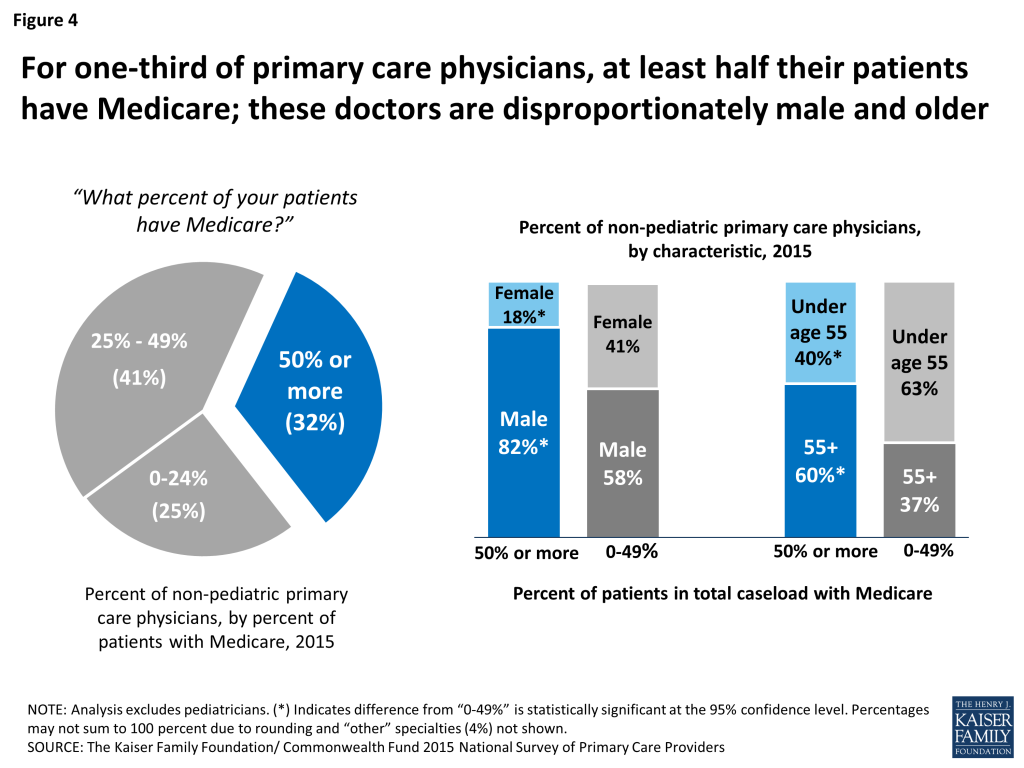
The Medicare patients of these older doctors have likely been in their caseloads for a long time, given results from other surveys which find that more than 90 percent of people age 65 and older say they did not look for a new primary care physician during the year.5 Therefore, to the extent that Medicare patients are longtime patients of their primary care doctors, the disproportionate share of males in the cohort of physicians with the highest shares of Medicare patients may reflect, to some extent, the relatively low proportion of female physicians three or so decades ago.6
Further considerations
With the Medicare population aging and increasing by about 2 million each year, efforts to monitor Medicare beneficiaries’ access to primary care are critical. In addition to physician surveys, including the one used for this Data Note, patient surveys are useful to draw a complete picture of access to care. In recent years, national patient-level surveys find that the large majority of Medicare beneficiaries report that they have a usual source of care, can find new doctors when they need one, and can get timely appointments, particularly if experiencing an illness or injury.7 Nonetheless, subsets of Medicare beneficiaries—including beneficiaries with no supplemental insurance or Medicaid and beneficiaries under age 65 living with a permanent disability—report experiencing higher rates of problems finding doctors.8 Further analysis of differences between communities across the country may reveal local market-level variation in access to primary care and could have further policy implications for Medicare.
Appendix
| Appendix Table 1: Share of Non-Pediatric Primary Care Physicians Accepting New and Current Medicare patients, by Provider and Practice Characteristics, 2015 | |||||
| Provider/practice characteristic | Overall | Accepts Medicare including NEW Medicare patients | Accepts Medicare, but not taking new Medicare patients | Does NOT accept Medicare patients | Not applicable |
| Overall, unweighted N | 1,257 | 72% | 21% | 2% | 3% |
| PHYSICIAN DEMOGRAPHICS | |||||
| Provider Sex | |||||
| Male (R) | 66% | 73% | 21% | 2% | 2% |
| Female | 34% | 70% | 23% | 3% | 3% |
| Provider Age | |||||
| Under 55 (R) | 55% | 76% | 19% | 2% | 2% |
| 55 and older | 44% | 67%* | 24% | 3% | 3% |
| Provider Race/ethnicity | |||||
| White (R) | 65% | 66% | 26% | 3% | 2% |
| Asian | 18% | 83%* | 15%* | 0%* | 2% |
| Black/ Hispanic/ other | 15% | 86%* | 9%* | 3% | 2% |
| Practice type | |||||
| Independent office-based (R) | 71% | 72% | 24% | 2% | 1% |
| Hospital-owned office-based | 17% | 76% | 20% | 0%* | 2% |
| Walk-in retail clinic/other | 6% | 44%* | 10%* | 10% | 28% |
| Community clinic/health center | 6% | 87%* | 9%* | 1% | 3% |
| Area type | |||||
| City (R) | 39% | 72% | 21% | 2% | 4% |
| Suburb | 31% | 72% | 24% | 2% | 1%* |
| Small town | 21% | 69% | 22% | 3% | 4% |
| Rural | 9% | 81%* | 15% | 3% | 1% |
| Physician Specialty | |||||
| Family Practice (R) | 50% | 73% | 22% | 2% | 1% |
| Internal Medicine | 46% | 73% | 21% | 2% | 2% |
| Other | 4% | — | — | — | — |
| Patient Caseload Characteristics | |||||
| Percent with Medicare | |||||
| 0-24% | 25% | 66% | 22% | 6%* | 5%* |
| 25% to 49% | 41% | 75% | 20% | 1% | 1% |
| 50% or more (R) | 32% | 74% | 23% | 1% | 1% |
| Percent African American | |||||
| 0-24% (R) | 81% | 70% | 22% | 3% | 3% |
| 25% or more | 17% | 79%* | 17% | 1% | 2% |
| Percent Hispanic | |||||
| 0-24% (R) | 82% | 70% | 23% | 3% | 2% |
| 25% or more | 15% | 78%* | 15% | 2% | 5% |
| Income | |||||
| Mostly low-income | 18% | 78% | 15%* | 1% | 5%* |
| Mostly medium-income (R) | 32% | 70% | 24% | 2% | 1% |
| Mixed income | 46% | 71% | 22%* | 3% | 3%* |
| Mostly high-income | 2% | — | — | — | — |
| NOTE: Statistically significant differences at the 95% confidence level are indicated by (*) from the applicable reference group, indicated by (R). Black/Hispanic/other includes primary care physicians who self-identify as Black (non-Hispanic), Hispanic, or of another race or multiple races. (–) indicates sample size too small to analyze. Percentages may not sum to 100 due to rounding and non-responses not shown.SOURCE: The Kaiser Family Foundation/ Commonwealth Fund 2015 National Survey of Primary Care Providers | |||||
Endnotes
- Boccuti, Cristina, Christina Swoope, Anthony Damico, and Patricia Neuman. “Medicare Patients’ Access to Physicians: A Synthesis of the Evidence,” Kaiser Family Foundation (December 2013). Boukus, Ellyn, Alwyn Cassil, Ann S. O’Malley. “A Snapshot of U.S. Physicians: Key Findings from the 2008 Health Tracking Physician Survey,” Center for Studying Health System Change, Data Bulletin, No. 35 (September 2009). ↩︎
- Kaiser Family Foundation, “Distribution of Medicaid Enrollees by Enrollment Group, 2011.” https://modern.kff.org/medicaid/state-indicator/distribution-of-medicaid-enrollees-by-enrollment-group/ ↩︎
- Kaiser Family Foundation / The Commonwealth Fund, “Experiences and Attitudes of Primary Care Providers Under the first Year of ACA Coverage Expansion,” (June 2015). ↩︎
- Calculations from data released by the Association of American Medical Colleges (AAMC) shows that among non-pediatric primary care physicians, approximately 5 percent are identified as Black or African American and 5 percent as Hispanic or Latino. Association of American Medical Colleges, Diversity in the Physician Workforce: Facts & Figures 2014, Table 11: Primary Care vs. Non-Primary Care by Race, Ethnicity, Age, and Sex, 2013 (December 2014). ↩︎
- Medicare Payment Advisory Commission, Report to the Congress: Medicare Payment Policy, Chapter 4, March 2015. ↩︎
- Association of American Medical Colleges, “Women in U.S. Academic Medicine and Science: Statistics and Benchmarking Report, 2011-2012.” Table 1: Medical Students, Selected Years, 1965-2011. (2012) ↩︎
- Medicare Payment Advisory Commission, Report to the Congress: Medicare Payment Policy, Chapter 4, March 2015. Boccuti, Cristina, Christina Swoope, Anthony Damico, and Patricia Neuman. “Medicare Patients’ Access to Physicians: A Synthesis of the Evidence,” Kaiser Family Foundation (December 2013). ↩︎
- Ibid. ↩︎