What Coverage and Financing is at Risk Under a Repeal of the ACA Medicaid Expansion?
Issue Brief
As discussion about repeal of the Affordable Care Act (ACA) unfolds, questions emerge about how a repeal may affect Medicaid. The specific effects would depend on many factors that are currently unknown, including whether there is a replacement for the ACA, what happens to federal Medicaid expansion funding, and whether broader changes to the underlying financing structure of the Medicaid program are made. While it is difficult to quantify the specific effects of a repeal given these unknowns, this issue brief examines the changes in coverage and financing that have occurred under the Medicaid expansion to provide insight into the potential scope of coverage and funding that may be at risk under a repeal. It finds:
- In 2015, an estimated 11 million enrollees were adults made newly eligible by the expansion who could be at risk for losing Medicaid coverage. However, the scope of coverage losses among this group would depend on the specifics of the repeal and any replacement plan as well as actions by individual states. The Medicaid expansion made many parents and other adults newly eligible for the program, as there was no option for states to cover most adults without children through Medicaid before the expansion. This eligibility expansion, along with outreach and enrollment efforts associated with the ACA, led to large increases in Medicaid enrollment. Between Summer 2013, just prior to the ACA, and September 2016, there was a net increase in Medicaid and CHIP enrollment of 15.7 million people. In 2015, an estimated 11 million Medicaid enrollees were adults made newly eligible by the expansion. This number has likely continued to grow since 2015 as enrollment has continued to increase and additional states have expanded, including Louisiana and Montana.
- Loss of Medicaid coverage could reverse the progress in reducing the uninsured. The Medicaid enrollment gains contributed to a fall in the uninsured rate among nonelderly individuals, which declined from 16.6% in 2013 to a historic low of 10% in 2016.
- As a result of the enhanced federal funding for expansion, expansion states have received $79 billion in federal funding from January 2014 through June 2015. The ACA Medicaid expansion provides enhanced federal funding for newly eligible adults with no or little state matching dollars. Alaska, Louisiana and Montana, had not claimed spending for the expansion group during this period.
Why did the ACA Expand Medicaid?
The ACA’s coverage provisions built on and attempted to fill gaps in an insurance system that left many without affordable coverage. This system had built up over time and included employer-based coverage for many—but not all—workers and their families, Medicaid coverage for certain categories of low-income people, directly-purchased coverage for a small number of people who bought policies on the non-group market, and Medicare for most people over age 65 as well as some younger people with disabilities. Under this system, many were ineligible for coverage or could not afford coverage that was available. In 2013, 44 million nonelderly people were uninsured. The majority who lacked coverage were poor and low-income adults (28% of the non-elderly uninsured had incomes below poverty and 62% had incomes below 200% of poverty in 2013). The main reason that most people said they lacked coverage was cost.1
The ACA Medicaid expansion was designed to fill gaps in coverage for low-income adults. Prior to the ACA, Medicaid eligibility for adults was very limited resulting in large numbers of uninsured poor adults. Income eligibility limits for parents were very low in most states, often below half the poverty level, and other non-disabled adults generally were not eligible regardless of their income. The ACA expanded Medicaid eligibility for parents and other adults to 138% FPL (about $16,000 for an individual or $28,000 for a family of three). Through this expansion and other changes, the ACA intended to establish a national minimum eligibility threshold in Medicaid of 138% FPL for nearly all individuals under age 65, making Medicaid the base of coverage for low-income people within the ACA’s broader coverage system. As enacted, this expansion was to occur nationwide beginning in January 2014. However, a 2012 Supreme Court ruling effectively made the expansion a state option.
In designing the ACA, expanding Medicaid was determined to be the most efficient and cost effective way to extend coverage to very poor adults. Medicaid had an existing role for the low-income population, and was already an operating program that could be extended rather than newly developed. Medicaid programs had experience providing coverage with low cost-sharing and comprehensive benefits suitable for a very low-income population. In addition, per capita spending in Medicaid is lower compared to private insurers after adjusting for the greater health needs of Medicaid enrollees.2
What Coverage is at Risk Under a Repeal of the Medicaid Expansion?
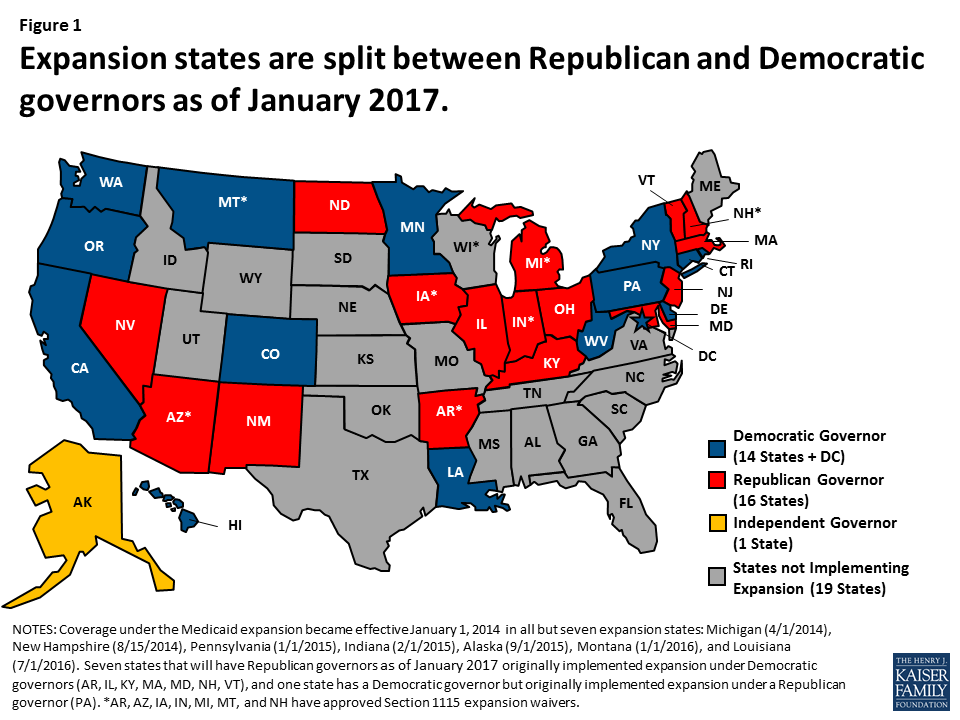
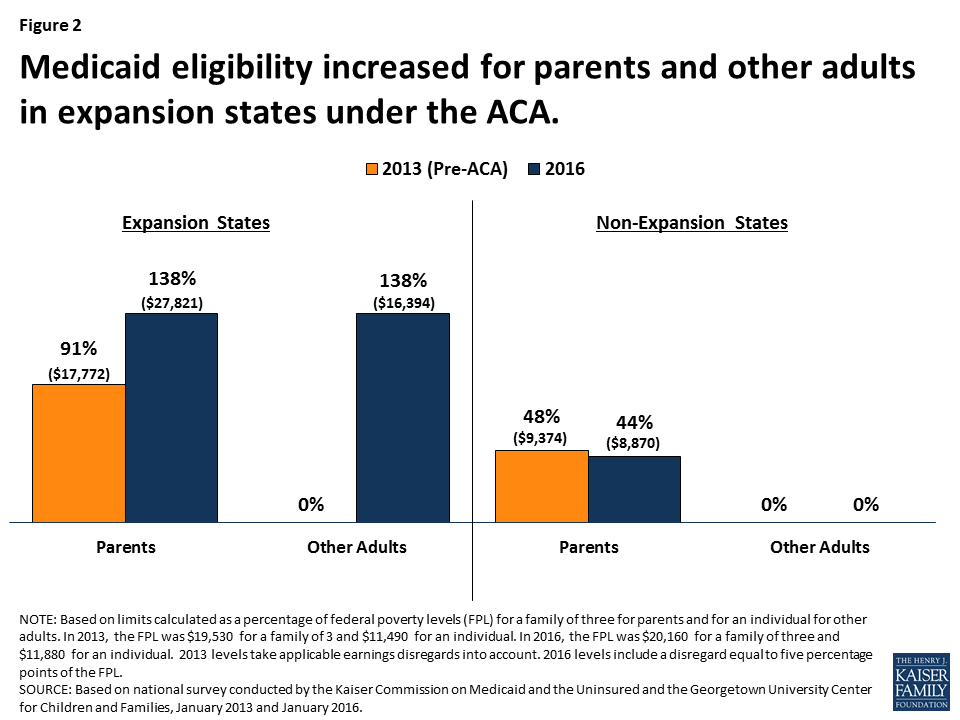
Under a repeal, many low-income parents and other adults could potentially lose eligibility for Medicaid. As of December 2016, 32 states including the District of Columbia implemented the ACA Medicaid expansion to adults. By January 2017, half (16) of the expansion states will have a Republican governor (Figure 1). Prior to the Medicaid expansion most states limited Medicaid eligibility for parents to less than the poverty level, and there was no option available to states within to cover other non-disabled adults within Medicaid (Appendix Table 1). As such, in expansion states, median eligibility increased from 91% to 138% FPL for parents ($27,821 for a family of three) and from 0% to 138% FPL for other adults ($16, 394 for an individual) (Figure 2 and Appendix Table 1 for state by state eligibility levels). In contrast, in non-expansion states, median eligibility for parents remains below half the poverty level and at 0% FPL for other adults.3 What would happen to eligibility levels would depend on the specifics of changes to federal eligibility rules under a repeal, including whether states would still have an option to cover adults, as well as other state choices. If states returned to their pre-ACA 2013 eligibility levels or lower, many parents and other adults would lose Medicaid eligibility in expansion states.
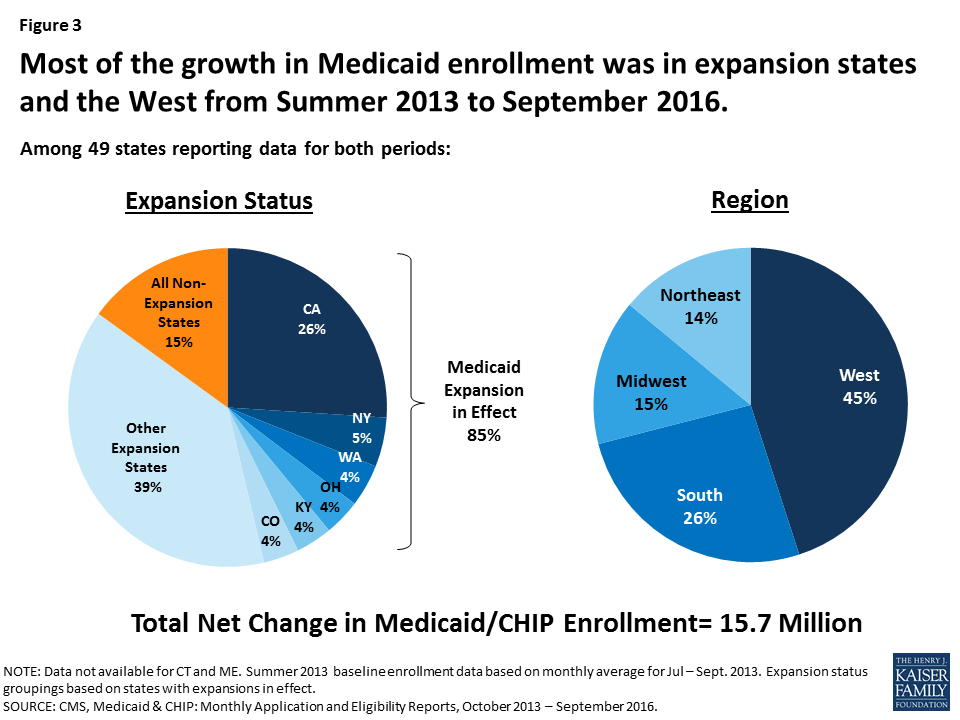
Decreases in eligibility would lead to declines in Medicaid enrollment, particularly in expansion states. Since the ACA coverage expansions were implemented starting in 2014 through September 2016, net Medicaid and CHIP enrollment has increased by 15.7 million, or 28% with the majority of growth occurring in expansion states. This growth included enrollment of newly eligible adults as well as children and adults who were previously eligible but not enrolled. Most growth was in large states in the West that expanded Medicaid (Figure 3). States that expanded Medicaid had over three times greater enrollment growth compared to non-expansion states (36% vs. 12%), although there was variation across states. If parents and adults were to lose eligibility for Medicaid, there would be declines in Medicaid enrollment, and most of these declines would likely be in areas that experienced the largest growth under expansion.
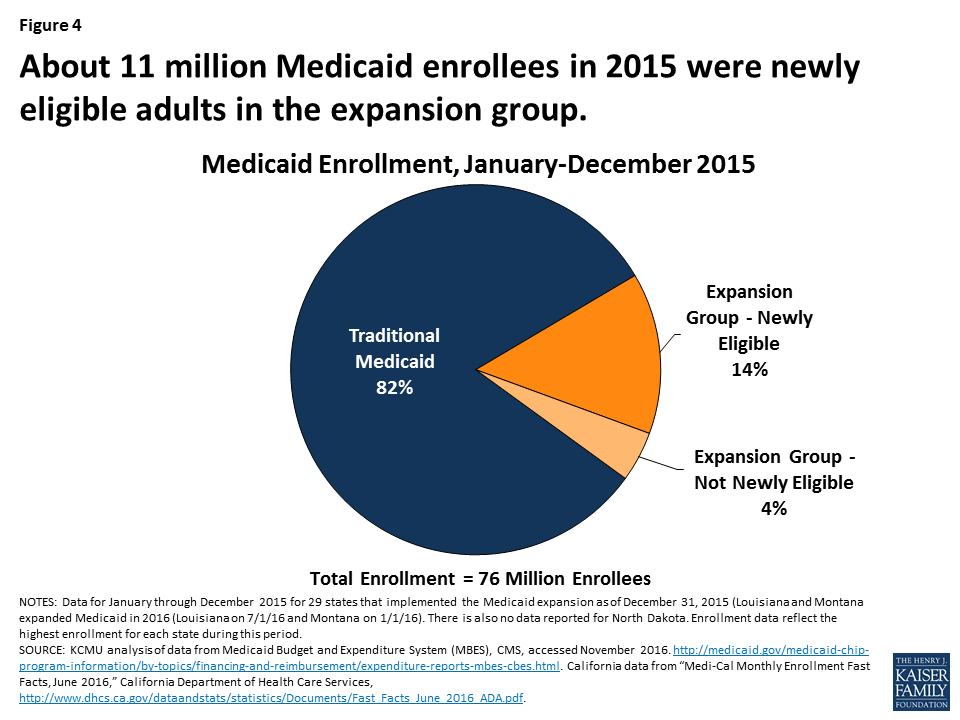
About 11 million Medicaid enrollees who were made newly eligible by the ACA Medicaid expansion would be at risk for losing Medicaid coverage if states no longer have an option to extend Medicaid eligibility to low-income adults and if federal enhanced financing is withdrawn under a repeal. The majority (82%) of Medicaid enrollees are eligible through pathways that existed prior to the ACA (e.g. children, pregnant women, elderly and individuals with disabilities). In addition, a small share of enrollees in the expansion group were eligible for Medicaid through pre-ACA expansions to adults.4 However, in 2015, about 11 million enrollees were adults in the expansion group who were made newly eligible by the ACA Medicaid expansion, accounting for 14% of all Medicaid enrollees (Figure 4 and Appendix Table 2 for state by state enrollment). Since 2015, this number has likely grown as enrollment has continued to increase and additional states have expanded, including Louisiana and Montana. Moreover, as of January 2016, an estimated 6.4 million adults were eligible for Medicaid but not enrolled, which include many newly eligible adults.5
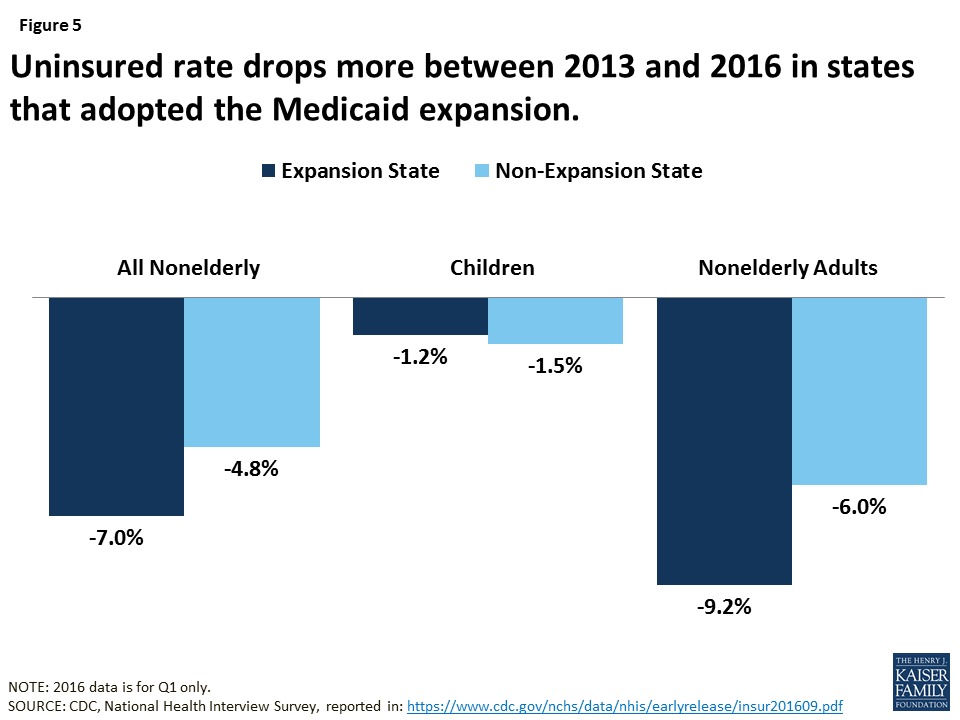
Uninsured rates could rise due to losses in Medicaid coverage, but, the extent of such losses would depend on what other coverage options may be available. Medicaid enrollment gains have played a significant role in decreasing the uninsured rate. Since implementation of the ACA, the uninsured rate among the nonelderly has fallen from 16.6% to a historic low of 10% in early 2016.6 Over 17 million more people have health coverage in 2016 compared to 2013, as the number of nonelderly uninsured dropped from 44 million to 27 million. Because the ACA coverage expansions mostly target adults, who have historically had higher uninsured rates than children, nearly the entire decline in the number of uninsured people has occurred among adults. Moreover, the decline in the uninsured rate for adults was larger among Medicaid expansion states compared to non-expansion states (Figure 5).
What Financing is at Risk Under a Repeal of the Medicaid Expansion?
The law provided enhanced federal funding for states to implement the Medicaid expansion. Under current law, Medicaid provides a guarantee to states for federal matching payments. The federal share of Medicaid is determined by a formula set in statute that is based on a state’s per capita income. The formula is designed so that the federal government pays a larger share of program costs in poorer states. The federal share (FMAP) varies by state from a floor of 50% to a high of 74% in 2016, and states may receive higher FMAPs for certain services or populations. The ACA provided states 100% federal funding for the costs of adults made newly eligible under the Medicaid expansion from 2014-2016 with the federal share phasing down to 95% in 2017 and to 90% by 2020 and beyond.
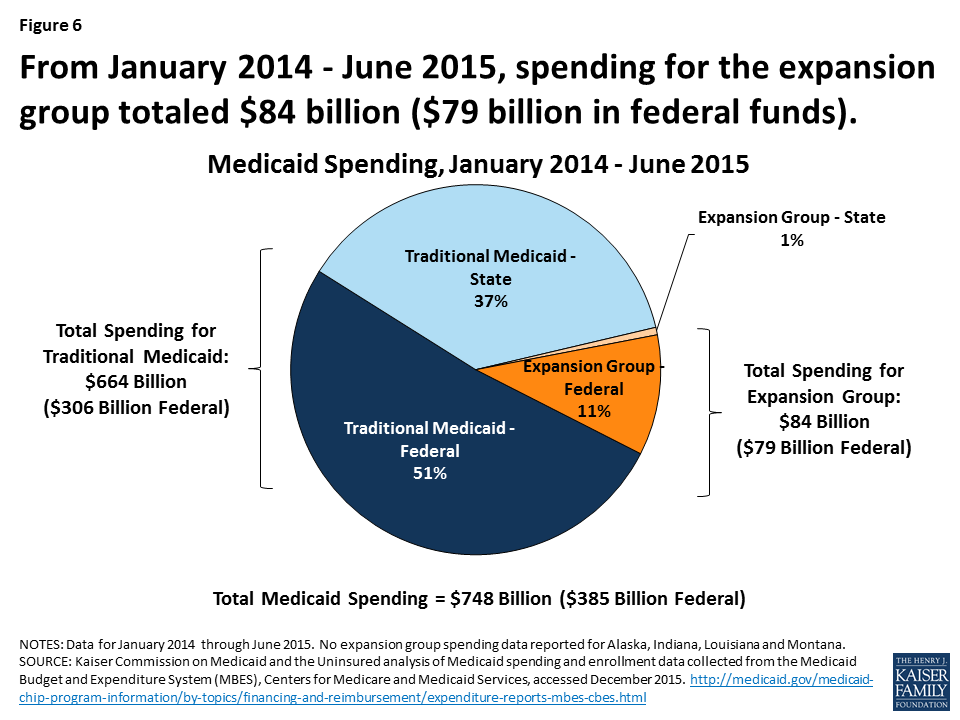
Under a repeal, states could potentially lose access to the enhanced federal funding made available for the Medicaid expansion. From January 2014 through June 2015, spending for the new adult group was $84 billion for the expansion group, accounting for about 12% of total Medicaid spending across all states over the period (Figure 6 and Appendix Table 3 for state by state spending). Nearly all expenditures for the new adult group ($79 billion out of $84 billion) were paid for with federal funds, reflecting the enhanced federal match for newly eligible adults.7 In contrast, federal funds comprised 58% of the costs for the traditional Medicaid population over the same period. Some states that implemented the expansion after January 2014, including Alaska, Louisiana and Montana, had not claimed spending for the expansion group during the data collection period.
Broader economic gains states have realized as a result of the Medicaid expansion could be affected. National, multi-state, and single-state studies show that states expanding Medicaid under the ACA have realized budget savings, revenue gains, and overall economic growth despite Medicaid enrollment growth initially exceeding projections in many states.8 Studies show that states have achieved net positive economic impacts from increased employment; increased revenues to hospitals, physicians, and other providers; decreases in uncompensated care; and savings in other states programs, such as state-funded behavioral health or corrections.
Conclusion
As a new Administration and Congress debate a repeal of the ACA, it is important context to note that many Americans have favorable opinions of many individual provisions in the ACA with 8 in 10 (and two-thirds of Trump voters) who have a favorable opinion of giving states the option of expanding their existing Medicaid program to cover more low-income uninsured.9 Thirty-two states have implemented the Medicaid expansion, and as of January 2017, 16 of these states will have Republican governors. While it is difficult to quantify the specific effects of a repeal of the ACA Medicaid expansion given the many uncertainties that remain at this time, examining the changes in coverage and financing that have occurred under the Medicaid expansion provides insight into the potential scope of coverage and funding that may be at risk under a repeal. Experience to date suggests that under a repeal of the Medicaid expansion, many low-income parents and other adults would be at risk for potentially losing eligibility for Medicaid, which might contribute to increases in the number of uninsured, depending on what coverage options are available under a repeal. Moreover, states could lose access to the enhanced federal funding made available for newly eligible adults under the Medicaid expansion and face increased costs associated with rises in uncompensated care and spending in state programs for the uninsured.
Appendix
| Appendix Table 1: Medicaid Eligibility Limits for Parents and Other Adults as a Percent of the Federal Poverty Level | ||||||
| State | Parents(in a family of three) | Other Adults(for an individual) | ||||
| 2013 (Pre-ACA) | 2016 | 2013 (Pre-ACA) | 2016 | |||
| Federal Poverty Level | $19,530 | $20,160 | $11,490 | $11,880 | ||
| Alabama | 23% | 18% | 0% | 0% | ||
| Alaska | 78% | 143% | 0% | 138% | ||
| Arizona | 106% | 138% | 100% | 138% | ||
| Arkansas | 16% | 138% | 0% | 138% | ||
| California | 106% | 138% | 0% | 138% | ||
| Colorado | 106% | 138% | 20% | 138% | ||
| Connecticut | 191% | 155% | 70% | 138% | ||
| Delaware | 120% | 138% | 110% | 138% | ||
| District of Columbia | 206% | 221% | 211% | 215% | ||
| Florida | 56% | 34% | 0% | 0% | ||
| Georgia | 48% | 37% | 0% | 0% | ||
| Hawaii | 138% | 138% | 100% | 138% | ||
| Idaho | 37% | 26% | 0% | 0% | ||
| Illinois | 139% | 138% | 0% | 138% | ||
| Indiana | 24% | 139% | 0% | 139% | ||
| Iowa | 80% | 138% | 0% | 138% | ||
| Kansas | 31% | 38% | 0% | 0% | ||
| Kentucky | 57% | 138% | 0% | 138% | ||
| Louisiana | 24% | 138% | 0% | 138% | ||
| Maine | 200% | 105% | 0% | 0% | ||
| Maryland | 122% | 138% | 0% | 138% | ||
| Massachusetts | 133% | 138% | 0% | 138% | ||
| Michigan | 64% | 138% | 0% | 138% | ||
| Minnesota | 215% | 138% | 75% | 138% | ||
| Mississippi | 29% | 27% | 0% | 0% | ||
| Missouri | 35% | 22% | 0% | 0% | ||
| Montana | 54% | 138% | 0% | 138% | ||
| Nebraska | 58% | 63% | 0% | 0% | ||
| Nevada | 84% | 138% | 0% | 138% | ||
| New Hampshire | 47% | 138% | 0% | 138% | ||
| New Jersey | 200% | 138% | 0% | 138% | ||
| New Mexico | 85% | 138% | 0% | 138% | ||
| New York | 150% | 138% | 100% | 138% | ||
| North Carolina | 47% | 44% | 0% | 0% | ||
| North Dakota | 57% | 138% | 0% | 138% | ||
| Ohio | 96% | 138% | 0% | 138% | ||
| Oklahoma | 51% | 44% | 0% | 0% | ||
| Oregon | 39% | 138% | 0% | 138% | ||
| Pennsylvania | 58% | 138% | 0% | 138% | ||
| Rhode Island | 181% | 138% | 0% | 138% | ||
| South Carolina | 89% | 67% | 0% | 0% | ||
| South Dakota | 50% | 52% | 0% | 0% | ||
| Tennessee | 122% | 101% | 0% | 0% | ||
| Texas | 25% | 18% | 0% | 0% | ||
| Utah | 42% | 45% | 0% | 0% | ||
| Vermont | 191% | 138% | 160% | 138% | ||
| Virginia | 30% | 39% | 0% | 0% | ||
| Washington | 71% | 138% | 0% | 138% | ||
| West Virginia | 31% | 138% | 0% | 138% | ||
| Wisconsin | 200% | 100% | 0% | 100% | ||
| Wyoming | 50% | 57% | 0% | 0% | ||
| NOTES: The Federal Poverty Level (FPLs) is for the 48 contiguous states and DC. Alaska and Hawaii have separate FPLs. Eligibility limits are for full Medicaid benefits; waiver programs that provide more limited benefits or state-funded programs are not included. Parent limits are based on a family of three; other adults are based on an individual. For parent limits that are based on a dollar threshold, the reported values are FPL equivalents. 2013 levels take states’ earnings disregards, when applicable, into account. 2016 limits include a disregard equal to five percentage points of the FPL.SOURCE: Based on results from national surveys conducted by the Kaiser Commission on Medicaid and the Uninsured and the Georgetown University Center for Children and Families, updated to reflect Medicaid expansion decisions as of November 2016. | ||||||
| Appendix Table 2: Medicaid Enrollment (rounded to nearest 100), 2015 | ||||||
| State | Expanded Medicaid by December 31, 2015 | Medicaid Enrollment | Expansion Group Enrollment | Expansion Group- Newly Eligible Enrollment | Expansion Group- Not Newly Eligible Enrollment | |
| Alabama | No | 1,055,900 | 0 | 0 | 0 | |
| Alaska* | Yes | 130,000 | 8,500 | 8,500 | 0 | |
| Arizona | Yes | 1,873,400 | 413,000 | 105,700 | 307,200 | |
| Arkansas | Yes | 1,183,700 | 291,600 | 266,700 | 39,500 | |
| California^ | Yes | 13,381,700 | 3,466,100 | 3,466,100 | 0 | |
| Colorado | Yes | 1,209,900 | 347,800 | 346,200 | 1,600 | |
| Connecticut | Yes | 840,600 | 201,000 | 187,000 | 19,600 | |
| Delaware | Yes | 212,200 | 61,300 | 10,100 | 51,600 | |
| District of Columbia | Yes | 249,000 | 62,000 | 62,000 | 0 | |
| Florida | No | 4,080,200 | 0 | 0 | 0 | |
| Georgia | No | 1,868,200 | 0 | 0 | 0 | |
| Hawaii | Yes | 313,800 | 107,500 | 34,300 | 74,100 | |
| Idaho | No | 303,300 | 0 | 0 | 0 | |
| Illinois | Yes | 3,014,000 | 671,100 | 654,400 | 25,200 | |
| Indiana* | Yes | 1,247,400 | 361,700 | 222,400 | 141,400 | |
| Iowa | Yes | 587,100 | 146,300 | 136,100 | 10,300 | |
| Kansas | No | 383,300 | 0 | 0 | 0 | |
| Kentucky | Yes | 1,283,800 | 439,000 | 439,000 | 0 | |
| Louisiana* | No | 1,462,800 | 0 | 0 | 0 | |
| Maine | No | 279,000 | 0 | 0 | 0 | |
| Maryland | Yes | 1,186,300 | 260,200 | 260,200 | 0 | |
| Massachusetts | Yes | 2,037,600 | 410,900 | 0 | 410,900 | |
| Michigan | Yes | 2,311,500 | 613,800 | 579,400 | 37,400 | |
| Minnesota | Yes | 1,194,200 | 208,500 | 207,700 | 900 | |
| Mississippi | No | 746,200 | 0 | 0 | 0 | |
| Missouri | No | 962,000 | 0 | 0 | 0 | |
| Montana* | No | 139,000 | 0 | 0 | 0 | |
| Nebraska | No | 237,000 | 0 | 0 | 0 | |
| Nevada | Yes | 566,400 | 187,100 | 187,100 | 0 | |
| New Hampshire | Yes | 188,000 | 49,000 | 48,800 | 400 | |
| New Jersey | Yes | 1,633,900 | 532,900 | 532,900 | 0 | |
| New Mexico | Yes | 840,100 | 235,400 | 235,400 | 0 | |
| New York | Yes | 6,657,700 | 2,276,900 | 285,600 | 1,993,000 | |
| North Carolina | No | 1,975,200 | 0 | 0 | 0 | |
| North Dakota^ | Yes | N/A | N/A | N/A | N/A | |
| Ohio | Yes | 3,078,200 | 665,900 | 618,200 | 47,600 | |
| Oklahoma | No | 760,800 | 0 | 0 | 0 | |
| Oregon | Yes | 1,113,800 | 546,400 | 474,800 | 71,600 | |
| Pennsylvania | Yes | 2,670,400 | 603,300 | 548,000 | 55,400 | |
| Rhode Island | Yes | 279,900 | 59,300 | 59,300 | 0 | |
| South Carolina | No | 1,219,600 | 0 | 0 | 0 | |
| South Dakota | No | 109,800 | 0 | 0 | 0 | |
| Tennessee | No | 1,654,200 | 0 | 0 | 0 | |
| Texas | No | 4,338,400 | 0 | 0 | 0 | |
| Utah | No | 327,700 | 0 | 0 | 0 | |
| Vermont | Yes | 207,100 | 60,700 | 0 | 60,700 | |
| Virginia | No | 992,800 | 0 | 0 | 0 | |
| Washington | Yes | 1,813,800 | 592,100 | 577,400 | 15,600 | |
| West Virginia | Yes | 554,600 | 175,000 | 175,000 | 0 | |
| Wisconsin | No | 1,213,000 | 0 | 0 | 0 | |
| Wyoming | No | 72,600 | 0 | 0 | 0 | |
| Total | 30 expanded by 12/31/15 | 76,041,000 | 14,054,100 | 10,728,200 | 3,363,900 | |
| NOTES: *Medicaid expansion column reflects if states expanded Medicaid by December 31, 2015. Alaska and Indiana expanded mid-2015 (Alaska on 9/1/15 and Indiana on 2/1/15). Louisiana and Montana have since expanded Medicaid (Louisiana on 7/1/16 and Montana on 1/1/16). ^California and North Dakota data were unavailable from CMS. California data were obtained from California Department of Health Report. This report does not distinguish newly eligible and not newly eligible adults, but because California did not provide full benefits to the new eligibility group prior to expansion, we classified all California beneficiaries as newly eligible.Enrollment from both MBES and CA DHCS report is reported for each month. In an effort to take into account that some beneficiaries are enrolled for only part of the year, maximum monthly enrollment for each state is used to estimate total annual enrollment.Due to rounding, state totals may not sum to national total.SOURCE: Kaiser Commission on Medicaid and the Uninsured analysis of Medicaid spending and enrollment data collected from the Medicaid Budget and Expenditure System (MBES), Centers for Medicare and Medicaid Services (accessed November 2016) and California Department of Health Care Services report “Medi-Cal Monthly Enrollment Fast Facts, June 2016”. https://www.medicaid.gov/medicaid/program-information/medicaid-and-chip-enrollment-data/enrollment-mbes/index.html. http://www.dhcs.ca.gov/dataandstats/statistics/Documents/Fast_Facts_June_2016_ADA.pdf. State expansion status available at “Status of State Action on the Medicaid Expansion Decision,” KFF State Health Facts, https://www.kff.org/health-reform/state-indicator/state-activity-around-expanding-medicaid-under-the-affordable-care-act | ||||||
| Appendix Table 3: Medicaid Spending (in millions), January 2014-June 2015 | ||||||
| State | Total Medicaid Spending | Traditional Medicaid- Federal Spending | Traditional Medicaid- State Spending | Expansion Group -Federal Spending | Expansion Group -State Spending | |
| Alabama | $7,816 | $5,418 | $2,398 | N/A | N/A | |
| Alaska* | $2,400 | $1,408 | $992 | N/A | N/A | |
| Arizona | $14,613 | $8,211 | $3,542 | $2,512 | $349 | |
| Arkansas | $8,018 | $4,516 | $1,829 | $1,673 | $0 | |
| California | $105,621 | $42,732 | $41,637 | $21,252 | $0 | |
| Colorado | $9,977 | $4,191 | $4,039 | $1,743 | $4 | |
| Connecticut | $11,320 | $4,816 | $4,650 | $1,817 | $37 | |
| Delaware | $2,680 | $1,143 | $957 | $469 | $111 | |
| District of Columbia | $3,609 | $2,198 | $944 | $464 | $3 | |
| Florida | $31,790 | $19,127 | $12,662 | N/A | N/A | |
| Georgia | $14,720 | $9,964 | $4,756 | N/A | N/A | |
| Hawaii | $2,986 | $1,230 | $1,110 | $599 | $47 | |
| Idaho | $2,600 | $1,869 | $731 | N/A | N/A | |
| Illinois | $26,478 | $11,832 | $11,224 | $3,370 | $52 | |
| Indiana* | $13,992 | $8,904 | $4,345 | $610 | $133 | |
| Iowa | $6,573 | $3,226 | $2,359 | $967 | $21 | |
| Kansas | $4,409 | $2,516 | $1,894 | N/A | N/A | |
| Kentucky | $12,591 | $6,415 | $2,687 | $3,488 | $0 | |
| Louisiana* | $10,956 | $6,861 | $4,095 | N/A | N/A | |
| Maine | $3,765 | $2,351 | $1,414 | N/A | N/A | |
| Maryland | $14,465 | $6,117 | $5,943 | $2,405 | $0 | |
| Massachusetts | $22,980 | $10,465 | $10,100 | $1,858 | $556 | |
| Michigan | $21,984 | $12,507 | $6,354 | $3,081 | $42 | |
| Minnesota | $14,821 | $6,476 | $6,310 | $2,034 | $2 | |
| Mississippi | $7,689 | $5,682 | $2,007 | N/A | N/A | |
| Missouri | $13,861 | $8,793 | $5,067 | N/A | N/A | |
| Montana* | $1,741 | $1,179 | $562 | N/A | N/A | |
| Nebraska | $2,776 | $1,509 | $1,266 | N/A | N/A | |
| Nevada | $4,124 | $2,004 | $1,092 | $1,029 | $0 | |
| New Hampshire | $2,278 | $1,060 | $1,020 | $198 | $1 | |
| New Jersey | $20,607 | $8,795 | $8,229 | $3,583 | $0 | |
| New Mexico | $6,983 | $3,693 | $1,560 | $1,730 | $0 | |
| New York | $86,485 | $37,759 | $36,143 | $9,265 | $3,317 | |
| North Carolina | $18,669 | $12,379 | $6,290 | N/A | N/A | |
| North Dakota | $1,273 | $557 | $535 | $179 | $2 | |
| Ohio | $31,119 | $17,554 | $9,809 | $3,676 | $79 | |
| Oklahoma | $7,388 | $4,750 | $2,638 | N/A | N/A | |
| Oregon | $11,559 | $5,284 | $2,717 | $3,559 | $0 | |
| Pennsylvania | $33,939 | $17,677 | $15,479 | $757 | $26 | |
| Rhode Island | $3,659 | $1,518 | $1,481 | $660 | $0 | |
| South Carolina | $8,809 | $6,240 | $2,569 | N/A | N/A | |
| South Dakota | $1,204 | $689 | $515 | N/A | N/A | |
| Tennessee | $12,895 | $8,443 | $4,452 | N/A | N/A | |
| Texas | $48,556 | $28,854 | $19,702 | N/A | N/A | |
| Utah | $3,266 | $2,311 | $955 | N/A | N/A | |
| Vermont | $2,382 | $1,162 | $877 | $276 | $68 | |
| Virginia | $11,685 | $5,936 | $5,750 | N/A | N/A | |
| Washington | $16,420 | $5,914 | $5,702 | $4,751 | $52 | |
| West Virginia | $5,349 | $3,282 | $1,311 | $755 | $0 | |
| Wisconsin | $11,569 | $6,895 | $4,675 | N/A | N/A | |
| Wyoming | $817 | $418 | $399 | N/A | N/A | |
| Total | $748,267 | $384,829 | $279,775 | $78,761 | $4,902 | |
| NOTE: *Alaska and Indiana expanded mid-2015 (Alaska on 9/1/15 and Indiana on 2/1/15). Louisiana and Montana have since expanded Medicaid (Louisiana on 7/1/16 and Montana on 1/1/16). Due to rounding, spending amounts may not sum to subtotals or national total.SOURCE: Kaiser Commission on Medicaid and the Uninsured analysis of Medicaid spending data collected from the Medicaid Budget and Expenditure System (MBES), Centers for Medicare and Medicaid Services (accessed November 2016). https://www.medicaid.gov/medicaid/financing-and-reimbursement/state-expenditure-reporting/expenditure-reports/index.html | ||||||
Endnotes
- Rachel Garfield, Melissa Majerol, Anthony Damico, and Julia Foutz, The Uninsured: A Primer – Key Facts about Health Insurance and the Uninsured in the Wake of National Health Reform (Washington, DC: Kaiser Commission on Medicaid and the Uninsured, November, 2016), https://modern.kff.org/uninsured/report/the-uninsured-a-primer-key-facts-about-health-insurance-and-the-uninsured-in-the-wake-of-national-health-reform/ ↩︎
- Lisa Clemans-Cope, Urban Institute, John Holahan, and Rachel Garfield, Medicaid Spending Growth Compared to Other Payers: A Look at the Evidence (Washington, DC: Kaiser Commission on Medicaid and the Uninsured, April, 2016), https://modern.kff.org/medicaid/issue-brief/medicaid-spending-growth-compared-to-other-payers-a-look-at-the-evidence/ ↩︎
- Changes between 2013 and 2016 reflect the conversion to use of Modified Adjusted Gross Income to determine financial eligibility under the ACA. In addition, a number of non-expansion states tie parent eligibility to a dollar value that does not regularly adjust. As such, its value as a percent of the FPL erodes over time as the FPL increases each year. ↩︎
- California data from “Medi-Cal Monthly Enrollment Fast Facts, June 2016,” California Department of Health Care Services, http://www.dhcs.ca.gov/dataandstats/statistics/Documents/Fast_Facts_June_2016_ADA.pdf. All ACA expansion adults are included as newly eligible in KCMU analysis. ↩︎
- Rachel Garfield, Anthony Damico, Cynthia Cox, Gary Claxton, and Larry Levitt, Estimates of Eligibility for ACA Coverage among the Uninsured in 2016. (Kaiser Family Foundation, October, 2016), https://modern.kff.org/uninsured/issue-brief/estimates-of-eligibility-for-aca-coverage-among-the-uninsured-in-2016/ ↩︎
- Robin A. Cohen, Ph.D., Michael E. Martinez, M.P.H., M.H.S.A., and Emily P. Zammitti, M.P.H., Health Insurance Coverage: Early Release of Estimates From the National Health Interview Survey, January–March 2016 (National Health Interview Survey Early Release Program, September 2016), http://www.cdc.gov/nchs/data/nhis/earlyrelease/insur201609.pdf ↩︎
- In some states that had expanded coverage to adults prior to the ACA, the new adult group includes some adults that were previously eligible through these pre-ACA expansions. These adults may be matched at a rate lower than the 100% rate for 2014-2016. ↩︎
- Larisa Antonisse, Rachel Garfield, Robin Rudowitz, and Samantha Artiga, The Effects of Medicaid Expansion under the ACA: Findings from a Literature Review, (Washington, DC: Kaiser Commission on Medicaid and the Uninsured, June 2016), https://modern.kff.org/medicaid/issue-brief/the-effects-of-medicaid-expansion-under-the-aca-findings-from-a-literature-review/. ↩︎
- Ashley Kirzinger, Elise Sugarman, and Mollyann Brodie, Kaiser Health Tracking Poll: November 2016, (Kaiser Family Foundation, December, 2016), https://modern.kff.org/health-reform/poll-finding/kaiser-health-tracking-poll-november-2016/ ↩︎