KFF Health Tracking Poll: Public Views on Recent Tax and Budget Legislation
Read the news release about these poll findings.
Findings
Key Takeaways
- Following passage of the tax and budget reconciliation bill, dubbed the “big beautiful bill” by President Trump and Republicans, public attention to the bill has increased. Two-thirds now say they’ve heard “a lot” or “some” about the legislation, up from half who said so in June. Overall views remain largely negative, with about two-thirds (63%) continuing to hold unfavorable views of the legislation – which is similar to the share who said the same last month before the legislation passed. Despite this stability in overall views, partisan divides have widened, with the share of Republicans expressing favorable views increasing from 61% to 78% and the share of Democrats expressing unfavorable views rising from 85% to 94%.
- Almost half (46%) of adults think the legislation will hurt them and their family, while a quarter (28%) don’t expect to be affected and another quarter (26%) think it will help them, up from 17% in June. The shift in perceptions of how the law will impact families is largely driven by Republicans and especially those who identify with the MAGA movement. Over half (54%) of Republicans now think the legislation will help them and their family, up from a third (32%) who said so in June. Among Republicans and Republican-leaning independents who identify with the MAGA movement, six in ten (61%) now expect the law to help their families, up from four in ten (38%). A majority of Democrats (72%) and about half of independents (53%) continue to say the law will hurt them and their family.
- Reflecting where most people get their news, a majority of adults, and similar shares across partisans, say they saw information about the tax and budget bill on social media in the past month (78% of those who use social media, and 73% of all adults). About half of those who saw content about the tax and budget bill on social media say the content was mostly in opposition to the bill, while fewer (11%) say the content they saw was mostly in support of it, and about four in ten (41%) saw a mix of both positive and negative content. Reflecting the partisan bent of most social media feeds, Democrats are much more likely to say they saw content in opposition to the legislation, whereas Republicans are much more likely to say they saw content in favor of the legislation or a mix of both positive and negative. Regardless of the tone of the social media content, most of those who saw content about the tax and budget bill on social media say it was a least “somewhat helpful” in helping them understand what the bill does.
Awareness and Impact of the Reconciliation Legislation
Earlier in July, the tax and budget bill, also known by Republicans as the “big beautiful bill,” was passed in Congress and signed by President Trump. The legislation has been lauded by Republicans as the largest tax cut in history for middle- and working-class Americans, but others describe it as the largest rollback in health programs, containing provisions that would significantly cut and drastically change Medicaid and the Affordable Care Act (ACA). The latest KFF tracking poll shows that as public awareness of the legislation has increased, partisan divides in opinion of the law have widened.
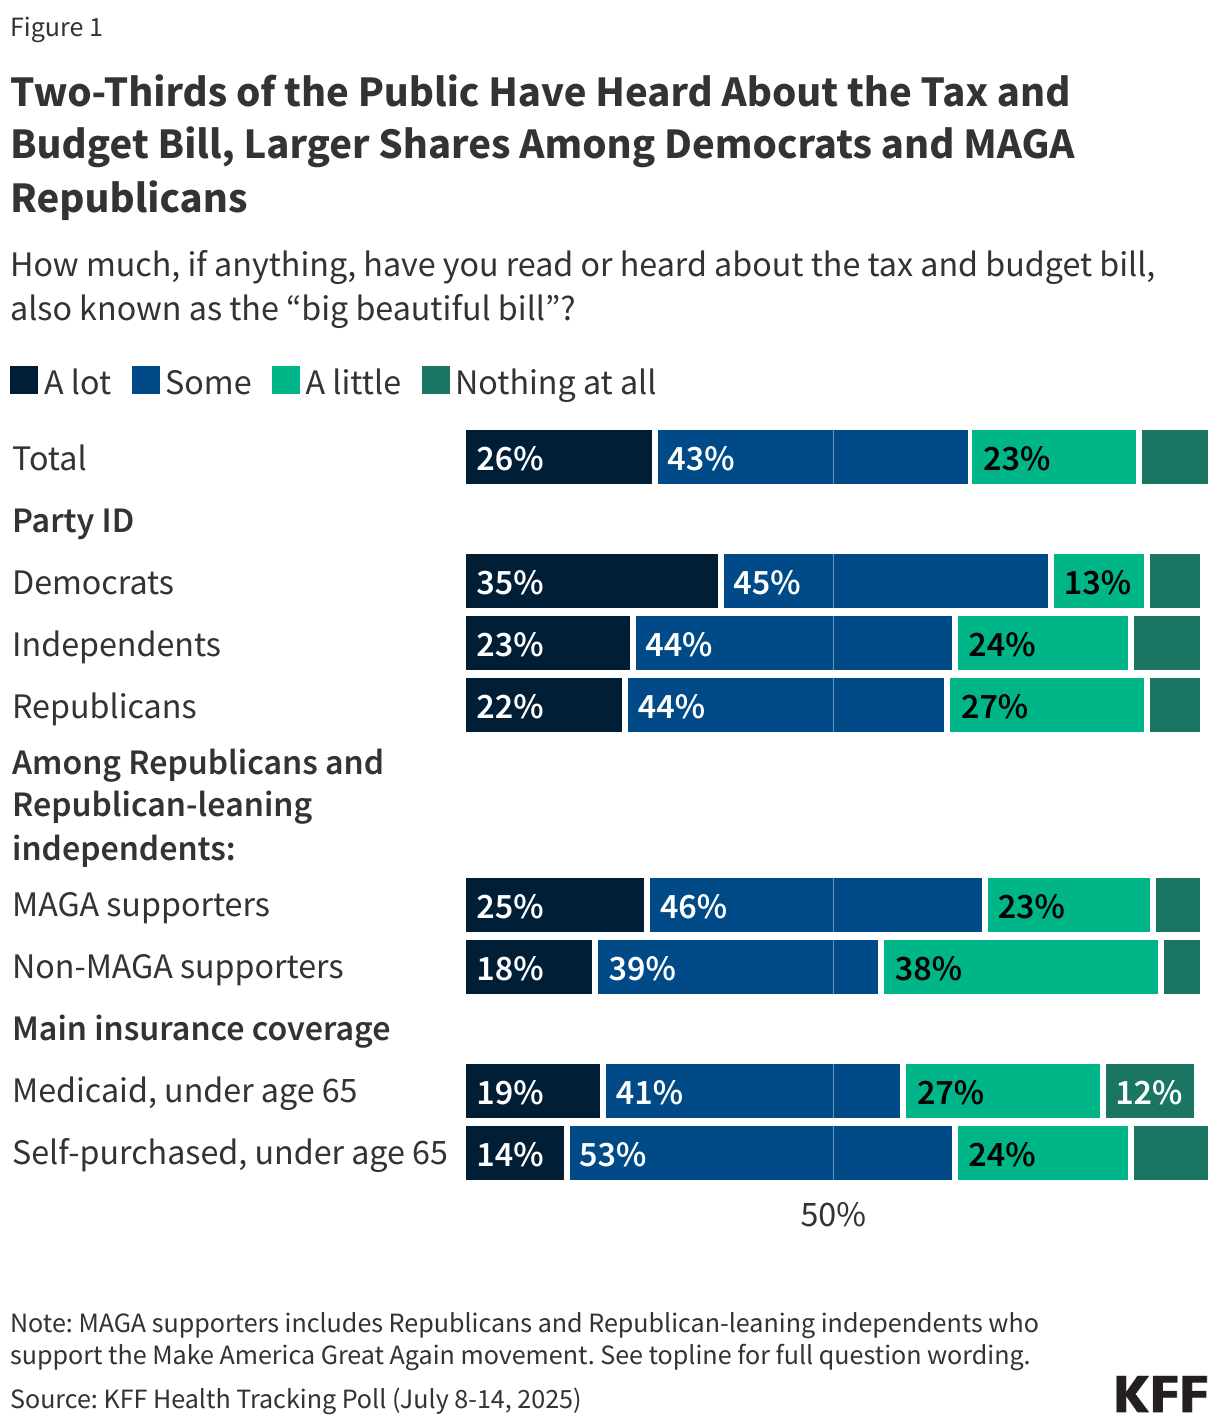
Two-thirds (68%) of the public now say they have heard “a lot” or “some” about the tax and budget bill, up from half who said the same in June. Another quarter say they’ve heard “a little” (23%), while few (9%) say they have heard “nothing at all.” Democrats remain somewhat more likely than Republicans and independents to say they’ve heard at least “some” about the legislation. Among Republicans and Republican-leaning independents, those who consider themselves part of the MAGA movement are more likely to have heard “a lot” or “some” about the law compared to non-MAGA Republicans (71% vs. 57%).
Two-thirds (66%) of those who self-purchased their insurance and six in ten adults under age 65 with Medicaid coverage, two of the groups that will be most directly impacted by the law, say they’ve heard “a lot” or “some” about the legislation.
Overall favorability for the “big beautiful bill” remains relatively low, with about one-third (36%) of adults holding a favorable opinion and six in ten (63%) having an unfavorable view. Overall views of the reconciliation bill remain unchanged from KFF’s June tracking poll, which was conducted prior to the Senate passing the legislation. This overall stability masks a widening partisan divide in views. Favorability among Republicans has increased 17 percentage points since June, from 61% to 78%. At the same time, Democrats have become even more negative in their views, with 94% expressing an unfavorable opinion, up from 85% in June. Favorability among independents has remained steady but still low, with around one-quarter (26%) expressing a favorable view of the legislation, similar to the share in June (27%).
Among Republicans and Republican-leaning independents, those who identify with the MAGA movement express more favorable opinions of the law than those who don’t identify as MAGA (85% vs. 54%). Notably, however, the share of non-MAGA Republicans viewing the bill favorably increased from one-third (33%) in June to a slight majority (54%) after it was passed and signed into law.
Among Medicaid enrollees under age 65 – a group that is most likely to be impacted by the health provisions of the reconciliation law, three in ten (29%) have a favorable opinion, while seven in ten (69%) view the bill unfavorably. Additionally, almost half (46%) of those who purchased their own insurance (46%) have a favorable opinion, while 53% are unfavorable.
Among adults with household incomes of less than $40,000 annually, few (30%) hold favorable views of the law.

Almost half (46%) of adults say they think the tax and budget legislation will generally hurt them and their family, similar to the share who said so in June (44%). About a quarter (26%) of adults think the law will “help,” up from 17% in June. Another quarter (28%) think it won’t make a difference for them and their families.
The uptick in the share who believe the bill will help them and their families is largely driven by Republicans. After passage, just over half (54%) of Republicans think the reconciliation bill will help them and their family, up from a third (32%) who said so in June. At the same time, the share of Republicans who say the bill won’t impact their families decreased from 47% to 33%. Among Republicans and Republican-leaning independents who identify with the MAGA movement, six in ten (61%) now say the bill will help them, up from 38% in June. Non-MAGA Republicans are more divided, with 38% expecting the bill to help their families, with three in ten respectively expecting it to hurt (30%) or saying it won’t make much difference (32%). Seven in ten Democrats (72%) and about half of independents (53%) continue to say the bill will hurt them and their family.
Those with lower incomes are much more likely to say that the tax and budget bill will hurt them and their families, with over half (56%) of those with a household income of less than $40,000 a year who say so.
Two-thirds (65%) of Medicaid enrollees say the tax and budget bill will hurt them and their families, while just under one in ten (18%) believe it will help. Four in ten (38%) of those who have insurance that they purchased themselves expect that the legislation will generally hurt them and their family, while a similar share (35%) say it won’t make much of a difference. Fewer (26%) say it will help them and their family.

The Reconciliation Legislation on Social Media
A majority of adults (78% of those who use social media, and 73% of all adults) and similar shares across partisans say they saw information about the tax and budget bill on social media in the past month – reflecting the type of information the public is getting from their social media feeds. Among those who use social media, the share who say they saw information about the tax and budget bill on social media is similar to the share who say they saw information about other prominent topics on social media, including immigration (85%) and the U.S. economy (83%). Smaller shares of those who use social media report seeing information about Medicaid (58%) or the Affordable Care Act (34%) on social media in the past month.
The share of adults who report seeing information about each topic is similar across age groups but slightly differs across partisanship – perhaps reflecting the partisan bent of social media feeds. While similar shares of partisans say they saw information about the tax and budget bill, immigration, and the U.S. economy, Democrats who use social media were more likely than Republicans to say they saw information about Medicaid (67% vs. 48%) and the Affordable Care Act (39% vs. 24%) on social media in the past month.

Reflecting in part the sites’ widespread adoption among the public, Facebook is the most common reported source of information seen about the tax and budget bill, followed by YouTube. About six in ten (62%) adults who say they saw information about the tax and budget bill on social media say they saw it on Facebook (49% of all social media users), including majorities of Democrats, independents, and Republicans. About four in ten (42%) of those who saw information say it was on YouTube (33% of all social media users), followed by about least one in five adults who use social media saying they saw it on Instagram (24%), TikTok (23%), or on X, formerly known as Twitter (19%). Fewer adults who use social media report seeing information about the tax and budget bill on other social media apps or sites, including Reddit (11%), Truth Social (4%), Bluesky (2%), or Snapchat (2%).

Among those who saw information about the tax and budget bill on social media, about half (47%) say most of the content they saw was in opposition to the tax and budget legislation, while about one in ten (11%) say the content was mostly in support of the legislation, and an additional four in ten (41%) say they saw a mix of both. Reflecting the partisan bent of most social media feeds, about three in four (76%) Democrats who say they saw content say that was in opposition to the bill, while Republicans are more likely (26%) to say the content was in support of the legislation. Notably, about half of Republicans who saw information about the legislation on social media say the content they saw was a mix – perhaps reflecting the debate among Republican lawmakers leading up to the bill’s passing.

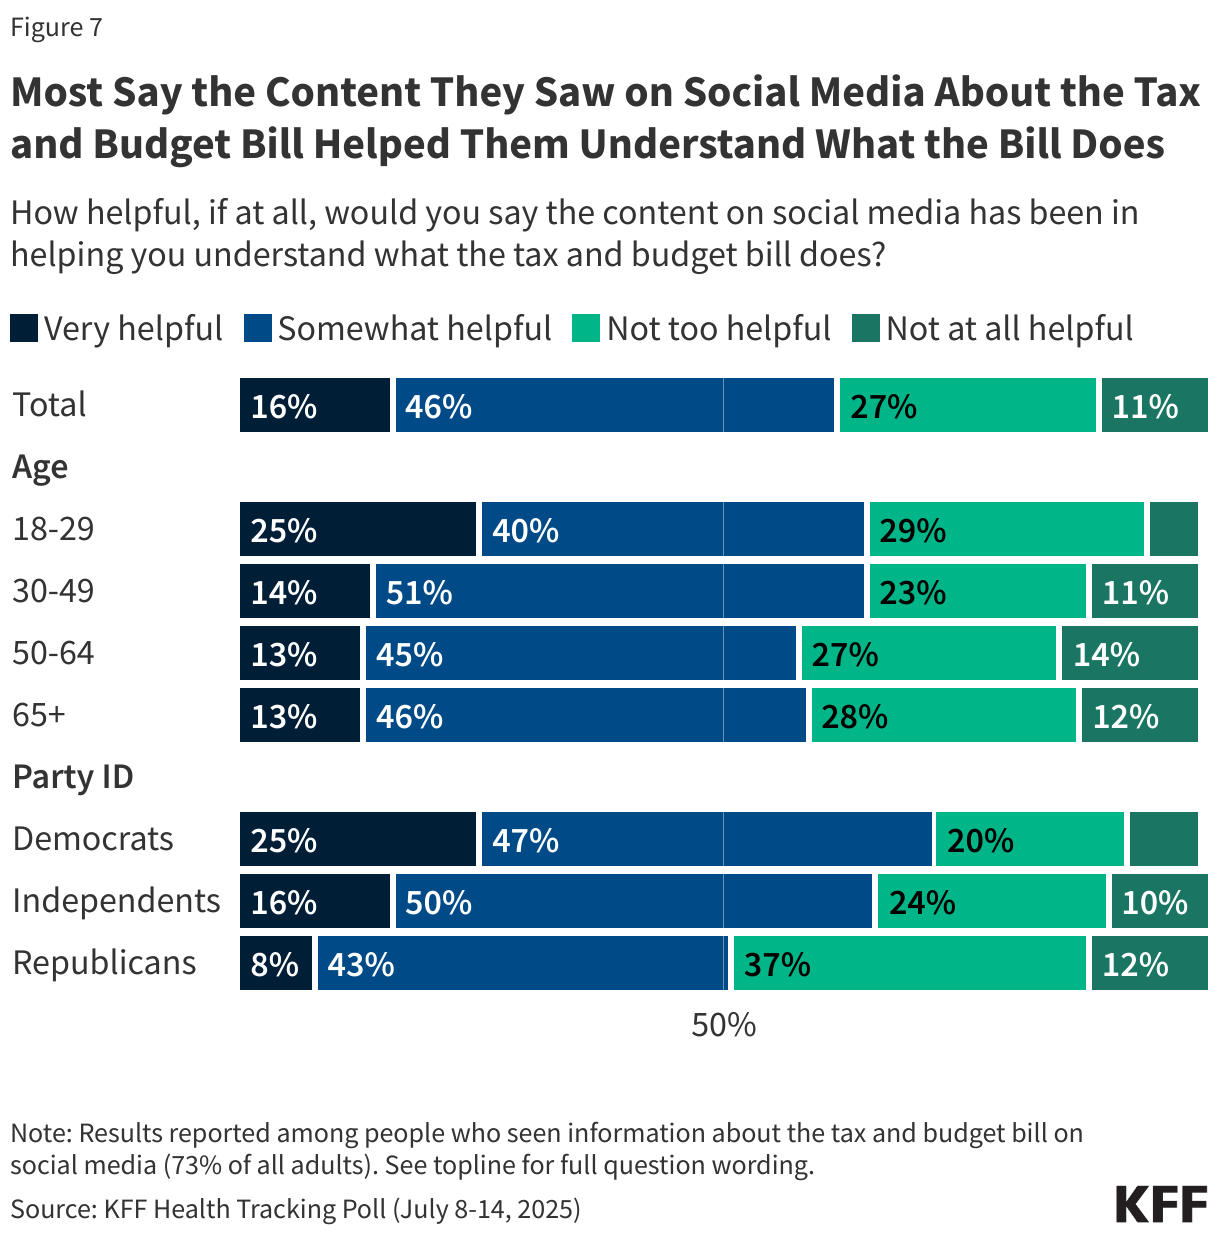
Most (62%) people who say they saw content about the tax and budget bill on social media say it was at least “somewhat helpful” in understanding what the bill does, including about one in six (16%) who found it “very helpful." An additional one in four (27%) say it was “not too helpful,” while a further one in ten (11%) say it was “not at all helpful.” Democrats (72%) and independents (66%) are more likely to say that they found the content helpful in explaining what the bill does compared with Republicans (51%). One in four (25%) young adults under age 30 say the content they saw on social media about the bill was “very helpful” in helping them understand what it does, larger than the shares of older adults who say the same.
Methodology
This KFF Health Tracking Poll/KFF Tracking Poll on Health Information and Trust was designed and analyzed by public opinion researchers at KFF. The survey was conducted July 8-14, 2025, online and by telephone among a nationally representative sample of 1,283 U.S. adults in English (n=1,212) and in Spanish (n=71). The sample includes 1,004 adults (n=58 in Spanish) reached through the SSRS Opinion Panel either online (n=979) or over the phone (n=25). The SSRS Opinion Panel is a nationally representative probability-based panel where panel members are recruited randomly in one of two ways: (a) Through invitations mailed to respondents randomly sampled from an Address-Based Sample (ABS) provided by Marketing Systems Groups (MSG) through the U.S. Postal Service’s Computerized Delivery Sequence (CDS); (b) from a dual-frame random digit dial (RDD) sample provided by MSG. For the online panel component, invitations were sent to panel members by email followed by up to three reminder emails.
Another 279 (n=13 in Spanish) adults were reached through random digit dial telephone sample of prepaid cell phone numbers obtained through MSG. Phone numbers used for the prepaid cell phone component were randomly generated from a cell phone sampling frame with disproportionate stratification aimed at reaching Hispanic and non-Hispanic Black respondents. Stratification was based on incidence of the race/ethnicity groups within each frame. Among this prepaid cell phone component, 135 were interviewed by phone and 144 were invited to the web survey via short message service (SMS).
Respondents in the prepaid cell phone sample who were interviewed by phone received a $15 incentive via a check received by mail. Respondents in the prepaid cell phone sample reached via SMS received a $10 electronic gift card incentive. SSRS Opinion Panel respondents received a $5 electronic gift card incentive (some harder-to-reach groups received a $10 electronic gift card). In order to ensure data quality, cases were removed if they failed two or more quality checks: (1) attention check questions in the online version of the questionnaire, (2) had over 30% item non-response, or (3) had a length less than one quarter of the mean length by mode. Based on this criterion, 1 case was removed.
The combined cell phone and panel samples were weighted to match the sample’s demographics to the national U.S. adult population using data from the Census Bureau’s 2024 Current Population Survey (CPS), September 2023 Volunteering and Civic Life Supplement data from the CPS, and the 2025 KFF Benchmarking Survey with ABS and prepaid cell phone samples. The demographic variables included in weighting for the general population sample are gender, age, education, race/ethnicity, region, civic engagement, frequency of internet use, political party identification by race/ethnicity, and education. The weights account for differences in the probability of selection for each sample type (prepaid cell phone and panel). This includes adjustment for the sample design and geographic stratification of the cell phone sample, within household probability of selection, and the design of the panel-recruitment procedure.
The margin of sampling error including the design effect for the full sample is plus or minus 3 percentage points. Numbers of respondents and margins of sampling error for key subgroups are shown in the table below. For results based on other subgroups, the margin of sampling error may be higher. Sample sizes and margins of sampling error for other subgroups are available on request. Sampling error is only one of many potential sources of error and there may be other unmeasured error in this or any other public opinion poll. KFF public opinion and survey research is a charter member of the Transparency Initiative of the American Association for Public Opinion Research.
| Group | N (unweighted) | M.O.S.E. |
| Total | 1,283 | ± 3 percentage points |
| Party ID | ||
| Democrats | 439 | ± 6 percentage points |
| Independents | 387 | ± 6 percentage points |
| Republicans | 344 | ± 6 percentage points |
| MAGA Republicans | 308 | ± 7 percentage points |