Medicaid Enrollment & Spending Growth: FY 2019 & 2020
Issue Brief
States reported declines in Medicaid enrollment and modest growth in total Medicaid spending for state fiscal year (FY) 2019 and budgeted for nearly flat enrollment growth but a return to more typical rates of spending growth for FY 2020. These Medicaid changes fall against the backdrop of robust state economies marked by strong revenue growth and low unemployment. This brief analyzes Medicaid enrollment and spending trends for FY 2019 and FY 2020 based on interviews and data provided by state Medicaid directors as part of the 19th annual survey of Medicaid directors in all 50 states and the District of Columbia. The methodology used to calculate enrollment and spending growth as well as additional information about Medicaid financing can be found at the end of the brief. Key findings are described below and in a companion report.
Enrollment: States largely attributed enrollment declines in FY 2019 (-1.7%) and relatively flat enrollment growth in FY 2020 (0.8%) to a stronger economy (Figure 1). A number of states, however, also pointed to changes in renewal processes, new functionality of upgraded eligibility systems, and enhanced verifications and data matching efforts as contributing to enrollment declines.
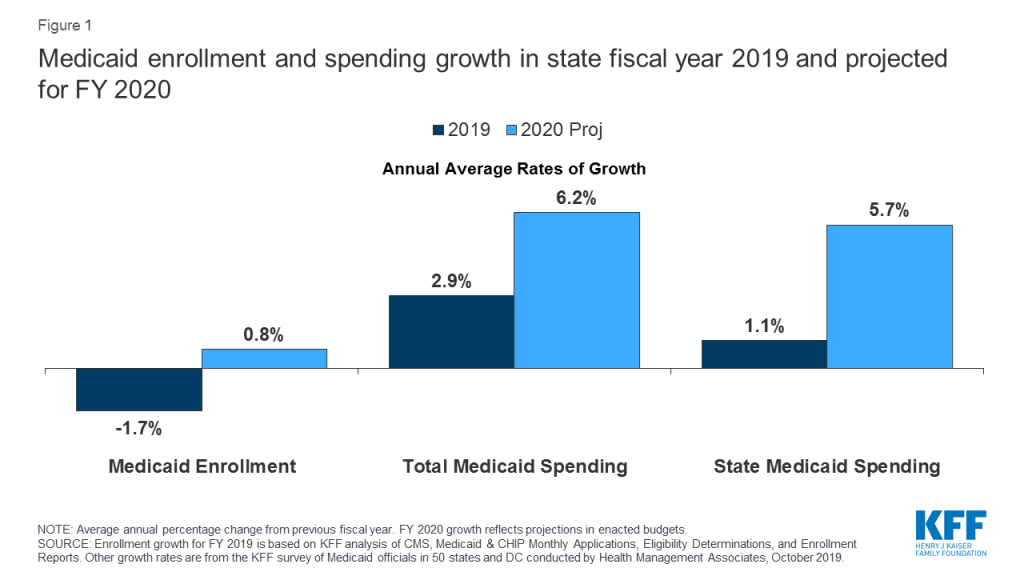
Total Spending: Total spending growth slowed to 2.9% in FY 2019 primarily due to enrollment declines. For FY 2020, however, states adopted budgets with projected growth returning to more typical levels of 6.2% as higher costs for prescription drugs, provider rate increases, and costs for the elderly and people with disabilities (including increased utilization of long-term services and supports) are expected to put upward pressure on total Medicaid spending.
State Spending: Despite an increase in the state share of financing for the Affordable Care Act’s (ACA’s) Medicaid expansion (from 6% in 2018 to 7% in 2019 and 10% in FY 2020 – midway through the state fiscal year), growth in the state share of Medicaid costs was lower than total spending growth in FY 2019 and budgeted to be similarly lower in FY 2020. Most expansion states reported relying on general fund support to finance the ACA Medicaid expansion, but a number of states also reported relying on provider taxes or other savings from the expansion.
Looking ahead: Looking ahead beyond FY 2020, economic conditions and the outcomes of federal and state elections in November 2020 are likely to have major implications for Medicaid, state budgets, and enrollees as debate about Medicaid expansion, demonstration waivers, the ACA, and broader health reform continue to be a major focus for candidates and voters.
Context
Medicaid (together with CHIP) provided coverage to about one in five Americans, or about 72 million people, as of July 2019.1 Total Medicaid spending was $593 billion in FY 2018 with 62.5% paid by the federal government and 37.5% financed by states.2 Medicaid accounts for one in six dollars spent in the health care system and more than half of spending on long-term services and supports.3 Since the end of the Great Recession, a steadily improving economy in most states has led to lower unemployment and improving state revenues. These trends can mitigate Medicaid enrollment growth while robust state revenue growth can support program expansions or enhancements such as benefit expansions or provider rate increases. According to the National Association of State Budget Officers (NASBO), FY 2020 will likely mark the tenth straight year of state general fund spending increases following two years of decline in FY 2009 and FY 2010.4 Another key factor affecting Medicaid spending and enrollment is the implementation of the ACA’s coverage expansions beginning in 2014. As of October 2019, 37 states (including DC) have adopted the ACA Medicaid expansion with implementation expected in January 2020 in Idaho, in October 2020 in Nebraska (FY 2021) and in July 2020 in Utah if waiver options are not approved before then (also FY 2021).5
State revenue performance in FY 2019 was strong. NASBO reported that most states entered FY 2019 with budget surpluses from robust revenue growth in FY 2018. In its June report, NASBO estimated nominal general fund revenue growth of 7.0% in FY 2018 and 2.7% in FY 2019.6 Strong revenue growth allowed states to increase general fund spending by an average of 5.8% in FY 2019 and also bolster reserve funds.7
FY 2020 state budgets include increases for a variety of state priorities. By July 1, 2019, seven states (Massachusetts, New Hampshire, North Carolina, Ohio, Oregon, Rhode Island, and Wisconsin) had not adopted a FY 2020 budget (compared to two states that had not adopted a FY 2019 budget at the same time last year). These budget impasses were primarily driven by policy disagreements rather than weak fiscal conditions.8 ,9 Across states, adopted budgets for FY 2020 increased spending for priority programs (early education, K-12 and higher education, and workforce development), provided one-time spending for infrastructure projects, and directed more dollars to build up state rainy day funds.10 Other areas for increased spending included Medicaid expansion (in a few states), child welfare services, behavioral health, affordable housing, corrections, expansion of broadband internet, water quality and clean energy initiatives, additional pension funding, and state employee pay raises and bonuses.11
Fiscal conditions vary across states but remain strong overall. Underneath national trends lies considerable state variation in fiscal conditions. For example, eight states reported flat or negative revenue growth in FY 2019 while 11 states experienced growth of 5% or more. Unemployment also varied across states with Alaska, Arizona, DC, Mississippi, and New Mexico reporting the highest state unemployment rates in August 2019, exceeding the national rate by one percentage point or more.12 Overall, the national unemployment rate remained steady at 3.7% in August 2019.13
Key Findings
Trends in Enrollment Growth FY 2019 and FY 2020
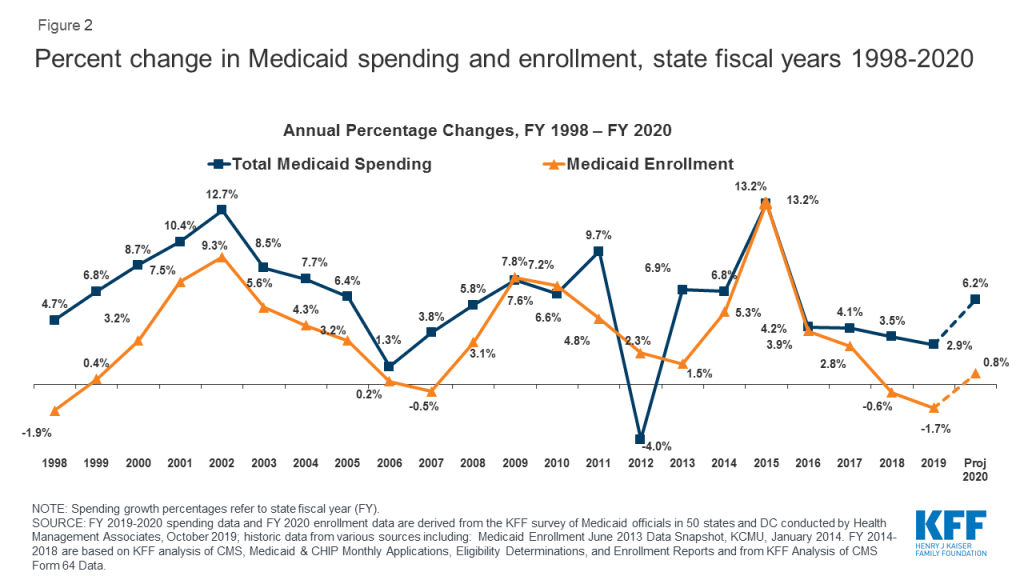
Medicaid enrollment declined in FY 2019 and is expected to be flat in FY 2020. Medicaid enrollment growth peaked in FY 2015 due to the implementation of the ACA and has tapered each year since, dropping to -0.6% in FY 2018 and -1.7% in FY 2019. For FY 2020, states project nearly flat enrollment growth of 0.8% overall (Figure 2) with fewer states (11 states) expecting enrollment declines compared to FY 2019 (35 states). States were more likely to report enrollment declines for children compared to other groups (expansion adults, seniors and people with disabilities, other adults) (data not shown).
States largely attribute Medicaid enrollment declines to improving economic conditions. Increased incomes generated by the strong economy may have resulted in Medicaid coverage losses for some low-income enrollees. However, recent Census Bureau data show an increase in the number of uninsured in the U.S., suggesting that some people losing Medicaid coverage may not gain access to employer-based health benefits and are not buying their own insurance.14 Some states also pointed to process and systems changes including changes to renewal processes, upgraded eligibility systems, and enhanced data matching efforts to verify eligibility as putting a downward pressure on enrollment.15 At least one state mentioned changes driven by the Centers for Medicare and Medicaid Services (CMS) guidance instructing states to tighten procedures related to verifying income changes as a cause of enrollment declines. In June 2019, CMS issued guidance to state Medicaid agencies outlining practices “to ensure that program resources are reserved for those who meet eligibility requirements.” The guidance spotlights use of periodic data matching between annual renewals to verify eligibility throughout the year.16 In line with other research,17 a few states also noted that the recently finalized public charge rule is expected to have a chilling effect on Medicaid enrollment of immigrant families, deterring eligible individuals from enrolling (or causing eligible individuals to disenroll).
Enrollment declines were mitigated by enrollment growth in some states. Eleven states reported enrollment growth in FY 2019 while 31 states are projecting enrollment growth in FY 2020, including a few states newly implementing or planning to implement the ACA Medicaid expansion in FY 2019 or FY 2020. Overall, states reported a higher median enrollment growth rate for the elderly and people with disabilities compared to other groups (expansion adults, other adults, and children) or as compared to the overall growth rate (data not shown). Higher enrollment growth for these high-cost enrollees contributes to a higher acuity case-mix, which will tend to increase spending per enrollee.
Trends in Spending Growth FY 2019 and FY 2020
Growth in total Medicaid spending slowed in FY 2019, but is expected to resume to more typical growth rates in budgets adopted for FY 2020. High rates of enrollment growth, tied first to the Great Recession and later to the implementation of the ACA, were the primary drivers of total Medicaid spending growth over the last decade. Similarly, declining enrollment driven by a strong economy was the primary driver identified by states for slow spending growth in FY 2019. While flat enrollment is projected to continue as a mitigating factor on spending in FY 2020, Medicaid officials identified increasing costs for prescription drugs (particularly for specialty drugs), rate increases (most often for managed care organizations, hospitals, and nursing facilities), as well as pressures from an aging population and a higher acuity case-mix as key upward pressures on total Medicaid spending. Some states noted that medical inflation, which trends higher than general inflation, results in higher Medicaid spending growth compared to other state programs. It is worth noting that actual spending growth for FY 2019 was lower than what was included in the FY 2019 budgets, so it is possible that actual spending for FY 2020 might be higher or lower than budgeted. During economic downturns, states may spend more than budgeted amounts and face shortfalls, requiring the need for supplemental funding.
Thirty states reported per enrollee growth was higher for certain groups, and about half of those pointed to higher growth for the elderly and people with disabilities (data not shown). A smaller number of states pointed to higher per enrollee growth for expansion adults. One of these states noted that broader enrollment declines in the expansion adult group resulted in a higher acuity level and higher per person cost for the remaining enrollees while another state commented that opioid treatment costs were especially high for expansion adults. The remaining states reporting higher growth in some groups were mixed with a few pointing to higher growth for children, pregnant women, or other more specific groups.
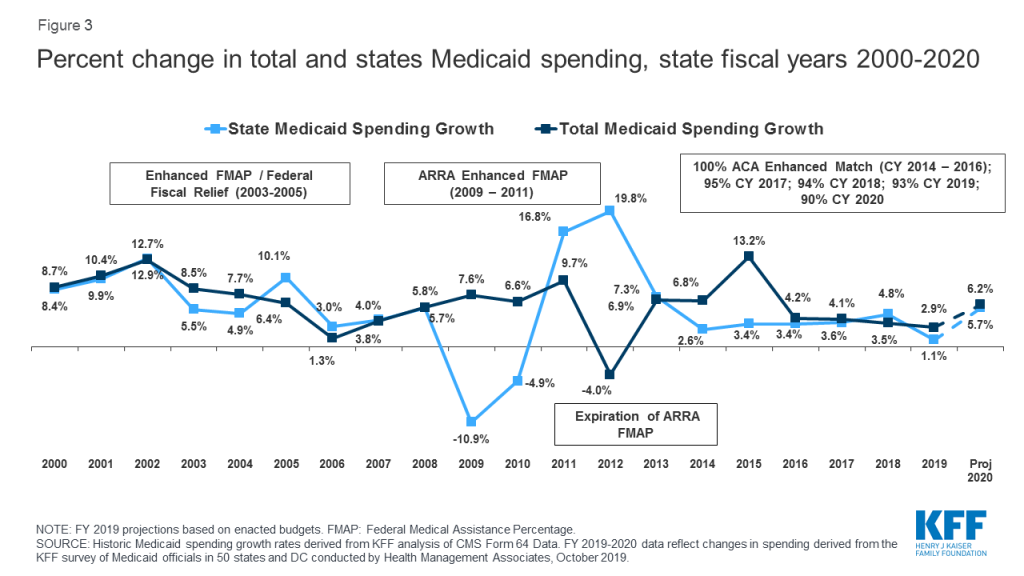
The state share of Medicaid spending typically grows at a similar rate to total Medicaid spending growth, unless there is a change in the federal matching rate. Following the implementation of the ACA, the enrollment of millions of expansion adults at a 100% federal match rate resulted in lower overall state spending growth compared to total spending growth. Mid-way through FY 2017, expansion states began paying 5% of the costs of the new group, and this amount increased to 6% in January 2018 and 7% in January 2019. In FY 2018, the first full state fiscal year states were responsible for paying for a share of the Medicaid expansion, state Medicaid spending growth slightly outpaced total Medicaid spending growth. This could be because the increase in 2017 was from 0% state share to 5% (comparatively larger than later, more incremental increases). In FY 2019, however, state spending growth was lower than total Medicaid spending growth (1.1% compared to 2.9%), despite the increase in the required state matching rate to 7%. In January 2020, the state share of costs for the expansion group will increase to 10% where it will stay in future years. Similar to FY 2019, states project that state spending growth will be slightly lower than total spending growth in FY 2020. Average state spending growth may be slower than total spending in FY 2019 and FY 2020 because of the marginally smaller increases in the state share of expansion costs (compared to the earlier jump from 0% to 5%); however, our survey data do not provide an explanation. In both FY 2019 and FY 2020, state Medicaid spending growth is moving in the same direction as total Medicaid spending growth (Figure 3).
In FY 2019, state spending growth for Medicaid was lower than overall general fund expenditure growth. State spending growth for Medicaid typically outpaces overall state general fund growth as medical costs have historically grown faster than inflation. During the first three years of ACA implementation (2014-2016), however, state spending for Medicaid grew at a slower pace compared to overall state general fund growth, likely due to the enhanced federal match rate for expansion adults that covered the full cost of the expansion in those years as well as slower growth in health costs generally, and the improving economy. While data in this report reflect state spending from general fund and other state sources, states reported estimated state Medicaid spending growth of only 1.1% in FY 2019 compared to 5.8% general fund expenditure growth (as reported by NASBO18 ). NASBO data also show state Medicaid general fund spending growing at a slower rate (3.6%) compared to total general fund spending (5.8%).
A number of states use provider taxes or savings from expansion to finance the state share of expansion costs. A large majority of states use general revenue to finance the state share of Medicaid expansion costs; however, 11 states use increases in existing or new provider taxes and seven states identified savings from expansion (e.g., in other state health programs) to finance these costs. Indiana and Louisiana reported using cigarette taxes or tobacco taxes to finance the expansion. Several expansion states reported multiple sources of financing.
Conclusion and Looking Ahead
A stronger economy as well as new enrollment systems and enhanced verifications contributed to declines in Medicaid enrollment in FY 2019 and flat growth projections for FY 2020. Enrollment declines accounted for low Medicaid spending growth in FY 2019, with state revenues increasing faster than state spending on Medicaid. Rising costs for prescription drugs, provider rate increases, and costs tied to the elderly and people with disabilities (including increased utilization of long-term services and supports) were cited as factors contributing to expected upward spending growth in FY 2020, even as enrollment growth is expected to remain flat. Looking ahead, the factors driving Medicaid spending growth are likely to continue and could be exacerbated in the event of a future economic downturn that would likely have significant effects on Medicaid enrollment and spending. As the debate heats up for the November 2020 elections, health care remains a key issue for candidates and voters at both the state and federal levels. At the state level, continued debates about Medicaid expansion, drug costs, and Section 1115 demonstration waivers will be important to watch. At the federal level, the health care debate is far-reaching. Democratic presidential candidates are proposing to further expand coverage while the Trump Administration continues to support policies that would eliminate the ACA and fundamentally restructure Medicaid with less federal funding. A strong economy and lower Medicaid enrollment growth relieve some fiscal pressure on states, but a future economic downturn as well as the outcomes of the elections could have significant implications for the Medicaid program, state budgets, and for Medicaid enrollees.
Methods
Definition of Medicaid Spending. Total Medicaid spending includes all payments to Medicaid providers for Medicaid-covered services provided to enrolled Medicaid beneficiaries. Medicaid spending also includes special disproportionate share hospital (DSH) payments that subsidize uncompensated hospital care for persons who are uninsured and unreimbursed costs of care for persons on Medicaid. Not included in total Medicaid spending are Medicaid administrative costs and federally mandated state “Clawback” payments to Medicare (to help finance the Medicare Part D prescription drug benefit for Medicaid beneficiaries who are also enrolled in Medicare). States are also asked to exclude costs for the Children’s Health Insurance Program (CHIP). Total Medicaid spending includes payments financed from all sources, including state funds, local contributions, and federal matching funds. Historical state Medicaid spending refers to all non-federal spending, which may include local funds and provider taxes and fees as well as state general fund dollars.
Methodology. The Kaiser Family Foundation (KFF) commissioned Health Management Associates (HMA) to survey Medicaid directors in all 50 states and DC to identify and track trends in Medicaid spending, enrollment, and policymaking. Given differences in the financing structure of their programs, the U.S. territories were not included in this analysis. This is the 19th annual survey, conducted at the beginning of each state fiscal year from FY 2002 through FY 2020. The KFF/HMA Medicaid survey for this report was sent to each Medicaid director in June 2019. Medicaid directors and staff responded to the written survey and participated in follow-up telephone interviews from June through September 2019. All 50 states and DC participated in this year’s survey (although Maryland was not available to complete a follow-up interview).
For FY 2019 and FY 2020, annual rates of growth for Medicaid spending were calculated as weighted averages across all states. Weights for spending were derived from the most recent state Medicaid expenditure data for FY 2018, based on estimates prepared for KFF by the Urban Institute using CMS Form 64 reports, adjusted for state fiscal years. These CMS-64 data were also used for historic Medicaid spending. For FY 2018, state spending for New York was adjusted to reflect growth reported on the 2019 state survey due to unexplained anomalies in the CMS-64 data.
Medicaid average annual growth rates for enrollment were calculated using weights based on Medicaid and CHIP monthly enrollment data for June 2019 published by CMS. Historical enrollment trend data for FY 1998 to FY 2013 reflects the annual percentage change from June to June of monthly enrollment data for Medicaid beneficiaries collected from states. Enrollment trend data for FY 2014 to FY 2019 reflects growth in average monthly enrollment based on KFF analysis of the Medicaid & CHIP Monthly Applications, Eligibility Determinations, and Enrollment Reports from CMS. The data reported for FY 2019 and FY 2020 for Medicaid spending and FY 2020 for Medicaid enrollment are weighted averages, and therefore, data reported for states with larger enrollment and spending have a greater effect on the national average. Additional information collected in the survey on policy actions taken during FY 2019 and FY 2020 can be found in the companion report.
Appendix
Background on Medicaid Financing
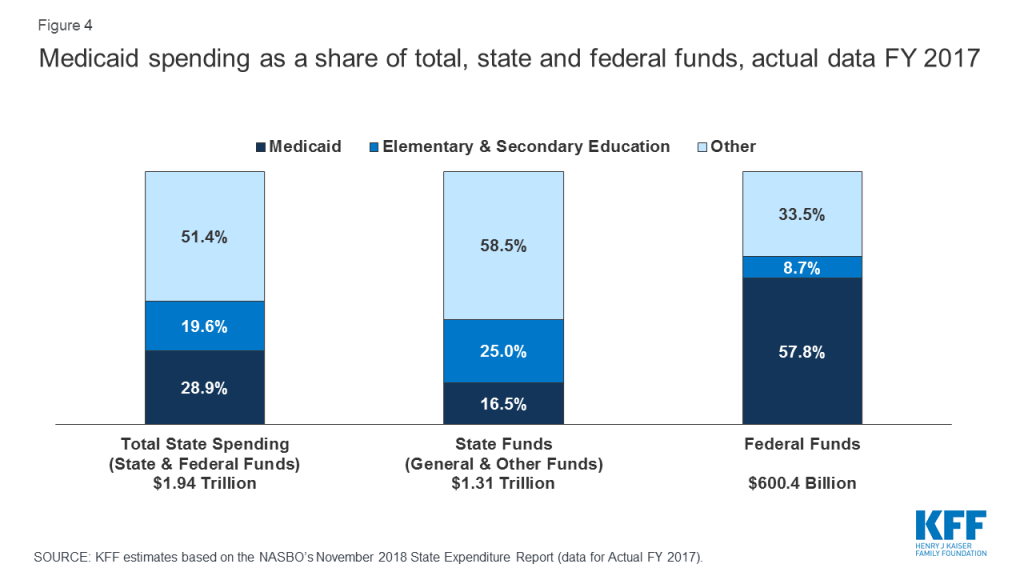
Medicaid Financing Structure. The federal government jointly funds the Medicaid program with states by matching qualifying state Medicaid expenditures. The federal match rate (known as the Federal Medical Assistance percentage, or FMAP) is calculated annually for each state using a statutory formula based on a state’s average personal income relative to the national average which results in higher FMAP rates for poorer states. The FMAP formula relies on three years of lagged personal income data, so data for federal fiscal years (FFYs) 2015 to 2017 was used to calculate FFY 2020 FMAP rates which range from a floor of 50% (applicable to 13 states) to a high of 77% (for Mississippi).19 Because of the federal matching structure, Medicaid is both a state budget expenditure item and a source of federal revenue for states. In FY 2017 (the latest year of actual data), Medicaid accounted for 28.9% of total state spending, but 16.5% of state funds (general fund plus other state funds), a far second to spending on K-12 education (25.0% of state funds). Medicaid is the largest single source of federal funds for states, accounting for over half (57.8%) of all federal funds for states (Figure 4).20
Medicaid and the Economy. Medicaid is a countercyclical program. During economic downturns, more people qualify and enroll in Medicaid, increasing program spending at the same time that state tax revenues may be stagnating or falling. To mitigate these budget pressures, Congress has twice passed temporary FMAP increases to help support states during economic downturns, most recently in 2009 as part of the American Recovery and Reinvestment Act (ARRA). The ARRA-enhanced FMAP rates provided states over $100 billion in additional federal funds over 11 quarters, ending in June 2011.21
Medicaid and the ACA. Effective January 1, 2014, the ACA expanded Medicaid eligibility to millions of non-elderly adults with income at or below 138% of the federal poverty level (FPL) –$17,236 per year for an individual in 2019. 22 The law also provided 100% federal funding for expansion adults through 2016, phasing down to 90% in 2020 and future years. The June 2012 Supreme Court ruling on the ACA effectively made the Medicaid expansion optional for states; as of October 2019, 37 states (including DC) had adopted the expansion.
Endnotes
- The Kaiser Family Foundation State Health Facts. Total Monthly Medicaid and CHIP Enrollment July 2019 (accessed October 2019) https://modern.kff.org/health-reform/state-indicator/total-monthly-medicaid-and-chip-enrollment/?currentTimeframe=0&sortModel=%7B%22colId%22:%22Location%22,%22sort%22:%22asc%22%7D. ↩︎
- The Kaiser Family Foundation analysis of Centers for Medicare and Medicaid Services, Federal and State Share of Medicaid Spending, accessed September 2019 https://modern.kff.org/medicaid/state-indicator/federalstate-share-of-spending/?currentTimeframe=0&sortModel=%7B”colId”:”Location”,”sort”:”asc”%7D. ↩︎
- Kaiser Family Foundation estimates based on 2017 National Health Expenditure Accounts data from CMS, Office of the Actuary; The Kaiser Family Foundation, Medicaid in the United States Fact Sheet, October 2019 (accessed October 2019). http://files.kff.org/attachment/fact-sheet-medicaid-state-US. ↩︎
- National Association of State Budget Officers, Summaries of FY 2020 Proposed & Enacted Budgets, (NASBO, September 6, 2019), https://higherlogicdownload.s3.amazonaws.com/NASBO/9d2d2db1-c943-4f1b-b750-0fca152d64c2/UploadedImages/Issue%20Briefs%20/FY20_Summary_of_Proposed_and_Enacted_Budgets.pdf. ↩︎
- The Kaiser Family Foundation State Health Facts. Status of State Action on the Medicaid Expansion Decision (accessed August 2019). https://modern.kff.org/health-reform/state-indicator/state-activity-around-expanding-medicaid-under-the-affordable-care-act/?currentTimeframe=0&sortModel=%7B%22colId%22:%22Location%22,%22sort%22:%22asc%22%7D. ↩︎
- National Association of State Budget Officers, The Fiscal Survey of the States, (Washington, DC: NASBO, Spring 2019), https://higherlogicdownload.s3.amazonaws.com/NASBO/9d2d2db1-c943-4f1b-b750-0fca152d64c2/UploadedImages/Fiscal%20Survey/NASBO_Spring_2019_Fiscal_Survey_of_States_-_S.pdf. ↩︎
- National Association of State Budget Officers, The Fiscal Survey of the States, (Washington, DC: NASBO, Spring 2019), https://higherlogicdownload.s3.amazonaws.com/NASBO/9d2d2db1-c943-4f1b-b750-0fca152d64c2/UploadedImages/Fiscal%20Survey/NASBO_Spring_2019_Fiscal_Survey_of_States_-_S.pdf. ↩︎
- National Association of State Budget Officers, Summaries of FY 2020 Budgets, (NASBO, September 6, 2019), https://www.nasbo.org/resources/communityblogs. ↩︎
- National Conference of State Legislatures, FY 2020 State Budget Status, (NCSL, July 26, 2019), http://www.ncsl.org/research/fiscal-policy/fy-2020-state-budget-status.aspx. ↩︎
- Brian Sigritz, Summaries of FY 2020 Budgets, (Washington, DC: NASBO, September 7, 2019) http://budgetblog.nasbo.org/budgetblogs/blogs/brian-sigritz/2019/09/06/summaries-of-fy2020-budgets. ↩︎
- National Association of State Budget Officers, Summaries of Fiscal Year Proposed & Enacted Budgets (Washington, DC: NASBO, September 6, 2019), https://higherlogicdownload.s3.amazonaws.com/NASBO/9d2d2db1-c943-4f1b-b750-0fca152d64c2/UploadedImages/Issue%20Briefs%20/FY20_Summary_of_Proposed_and_Enacted_Budgets.pdf ↩︎
- Bureau of Labor Statistics, Unemployment Rates for States, Seasonally Adjusted, (Washington, DC: U.S. Bureau of Labor Statistics, August 2019), https://www.bls.gov/web/laus/laumstrk.htm. ↩︎
- Bureau of Labor Statistics, Labor Force Statistics from the Current Population Survey: Unemployment Rate, (Washington, DC: U.S: Bureau of Labor Statistics, October 2019), https://data.bls.gov/timeseries/lns14000000. ↩︎
- United States Census Bureau, Health Insurance Coverage in the United States: 2018, (Washington, DC: U.S Census Bureau, September 10, 2019), https://www.census.gov/library/publications/2019/demo/p60-267.html. ↩︎
- Samantha Artiga and Olivia Pham, Recent Medicaid/CHIP Enrollment Declines and Barriers to Maintaining Coverage, (Washington, DC: Kaiser Family Foundation, September 2019), https://modern.kff.org/medicaid/issue-brief/recent-medicaid-chip-enrollment-declines-and-barriers-to-maintaining-coverage/. ↩︎
- CMCS Informational Bulletin, Oversight of State Medicaid Claiming and Program Integrity Expectations (June 20, 2019), https://www.medicaid.gov/federal-policy-guidance/downloads/cib062019.pdf. ↩︎
- Samantha Artiga, Rachel Garfield, and Anthony Damico, Estimated Impacts of Final Public Charge Inadmissibility Rule on Immigrants and Medicaid Coverage (Washington, DC: Kaiser Family Foundation, September 2019), https://modern.kff.org/disparities-policy/issue-brief/estimated-impacts-of-final-public-charge-inadmissibility-rule-on-immigrants-and-medicaid-coverage/. ↩︎
- National Association of State Budget Officers, The Fiscal Survey of the States, (NASBO, Spring 2019), https://higherlogicdownload.s3.amazonaws.com/NASBO/9d2d2db1-c943-4f1b-b750-0fca152d64c2/UploadedImages/Fiscal%20Survey/NASBO_Spring_2019_Fiscal_Survey_of_States_-_S.pdf. ↩︎
- The Kaiser Family Foundation State Health Facts. Federal Medical Assistance Percentage (FMAP) for Medicaid and Multiplier: FY 2020. Data Source: Federal Register, November 28, 2018 (Vol 83, No. 229), pp 61159. https://modern.kff.org/medicaid/state-indicator/federal-matching-rate-and-multiplier/?currentTimeframe=0&sortModel=%7B%22colId%22:%22FMAP%20Percentage%22,%22sort%22:%22desc%22%7D. ↩︎
- Kaiser Family Foundation estimates based on the data reported in: National Association of State Budget Officers, State Expenditure Report – Fiscal Years 2016-2018 (Washington, DC: National Association of State Budget Officers, November 2018), https://higherlogicdownload.s3.amazonaws.com/NASBO/9d2d2db1-c943-4f1b-b750-0fca152d64c2/UploadedImages/SER%20Archive/2018_State_Expenditure_Report_S.pdf. ↩︎
- To be eligible for ARRA funds, states could not restrict eligibility or tighten enrollment procedures in Medicaid or CHIP. Vic Miller, Impact of the Medicaid Fiscal Relief Provisions in the American Recovery and Reinvestment Act (ARRA) (Washington, DC: Kaiser Commission on Medicaid and the Uninsured, October 2011), http://kff.org/medicaid/issue-brief/impact-of-the-medicaid-fiscal-relief-provisions/. ↩︎
- U.S. Department of Health & Human Services, Office of the Assistant Secretary for Planning and Evaluation. U.S. Federal Poverty Guidelines Used to Determine Financial Eligibility for Certain Federal Programs (January 2019), https://aspe.hhs.gov/poverty-guidelines ↩︎
