Kaiser Health Tracking Poll: March 2016
Findings
The March Kaiser Health Tracking Poll finds that health care is one of many issues that will be important to voters in the Presidential election, trailing concerns about the economy and jobs and leading concerns about another hot issue, immigration. Health care ranks higher for Democratic voters than for Republican and independent voters and is a higher priority for women than for men.
A majority of Democratic voters name Hillary Clinton as the candidate for president they trust to represent their view of women’s reproductive health choices and services, while Republican voters don’t coalesce around any one candidate. About a fourth of Republican voters say they trust Donald Trump to represent their views and about two in 10 name Ted Cruz.
About one-third of Americans say ‘there is a wide-scale effort to limit women’s reproductive health choices and services, such as abortion, family planning, and contraception’ a six percentage point increase from 2012. Women, as a group, express more concern about the state of women’s reproductive health policy than men; however, opinions among women vary along political party lines with an equal share of Republican women saying that the wide-scale effort is a ‘good’ and ‘bad’ thing.
Health care costs remain on the forefront of the minds of both the uninsured and voters, with nearly half of uninsured Americans saying that cost is the main reason they haven’t gotten health insurance and almost three in 10 voters who say health care is important to their vote for President citing health care costs as their top health concern.
The Role of Health Care in the 2016 Presidential Election
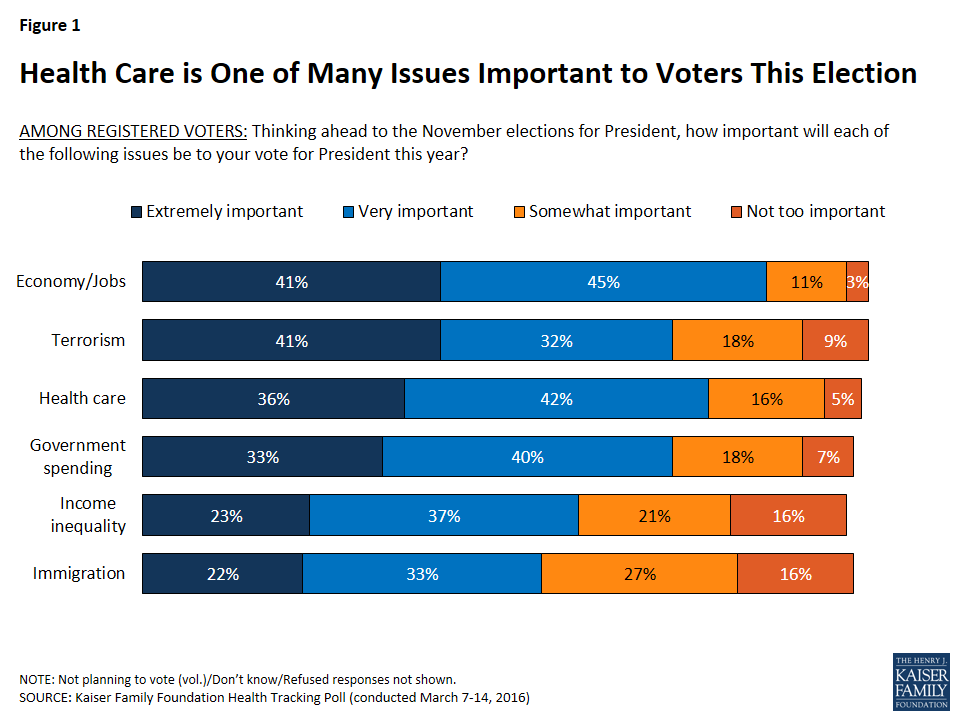
The March Kaiser Health Tracking Poll finds that no one issue truly stands out for voters, with several issues, including health care, cited as important to the majority of registered voters. Most voters rate all of the issues presented as either ‘extremely important’ or ‘very important’ to their vote for President this year, with the largest shares saying that the economy and jobs, terrorism, and health care are ‘extremely important.’
The economy and jobs and terrorism are the top issues with about four in 10 registered voters (41 percent each) saying they are ‘extremely important’ to their vote for President this year. Other top issues for voters are health care (36 percent) and government spending (33 percent). Fewer voters, although still substantial shares, name income inequality (23 percent), and immigration (22 percent) as ‘extremely important’ to their vote for President this year.
Health Care is More Important to Democrats and Women
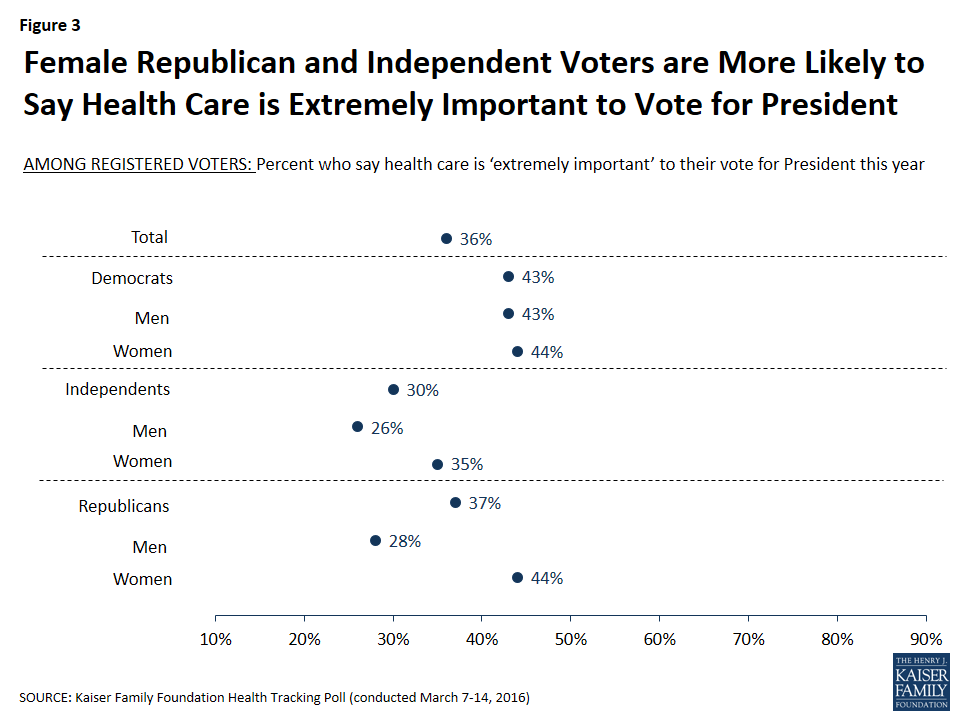
Slightly more Democratic voters than independents and Republicans say that health care is ‘extremely important’ to their vote for President (43 percent vs. 30 percent and 37 percent, respectively). Overall, Democrats rate both health care and the economy and jobs as the most important issues to their vote for President, while independents and Republicans rate the economy and jobs, terrorism, and government spending above health care. More than half of Republican voters (53 percent) say that terrorism is ‘extremely’ important to their vote for President.

Over four in 10 Democratic voters overall (43 percent) – including similar shares of men and women – say health care is ‘extremely important’ to their vote. However, among Republican and independent voters, women are more likely than men to say health care is an extremely important voting issue (44 percent versus 28 percent for Republicans; 35 percent versus 26 percent for independents).
What About Health Care Is Important to Voters?
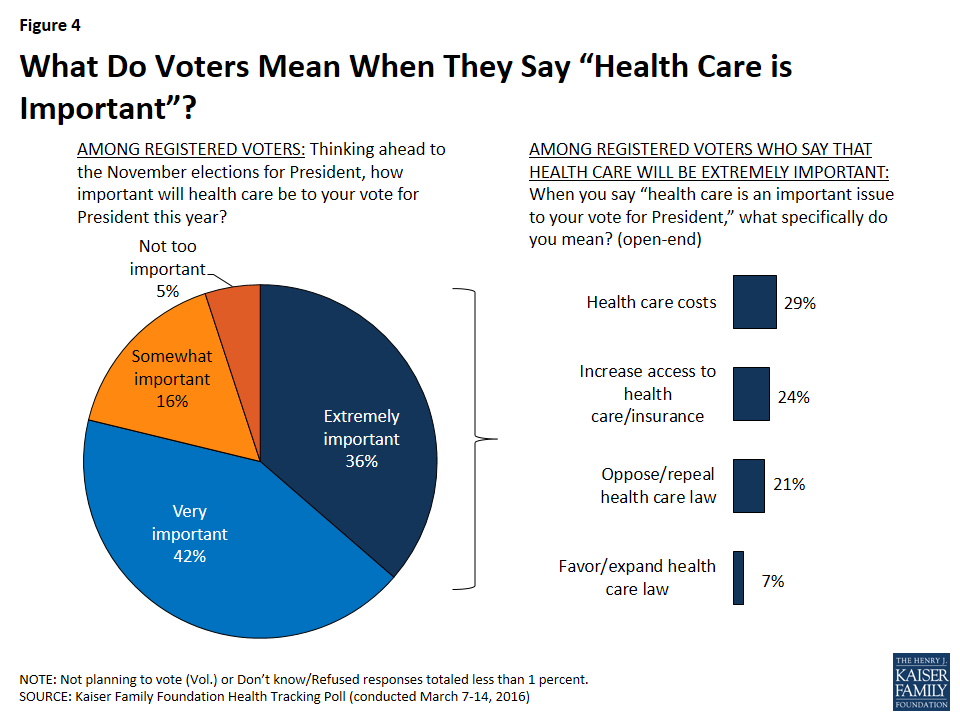
The survey also included an open-ended question asked of those who said health care was one of the issues that would be ‘extremely’ important to their vote (a group representing 36 percent of registered voters) to find out what specifically about the issue was on their minds. Three in 10 (30 percent) of this group mention something about 2010 health care law, with three times as many saying they oppose it or want to repeal it (21 percent) as favor it or want to expand it (7 percent). A similar share mention health care costs (29 percent) and 24 percent mention increasing access to health care/insurance.
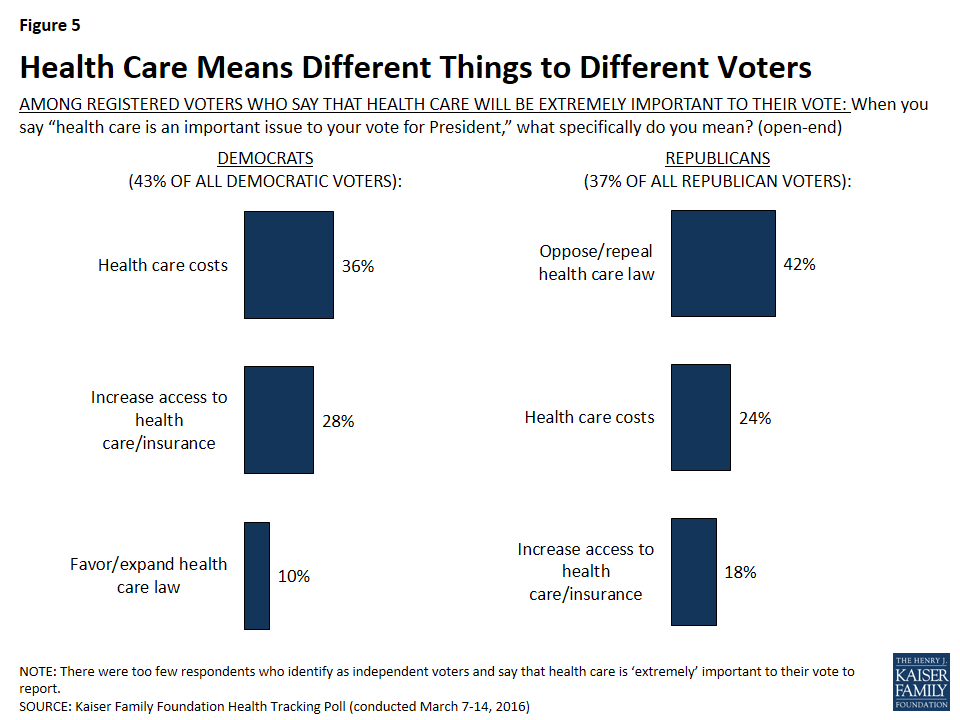
Of the 37 percent of Republican voters who were asked what they meant when they say health care is extremely important to their vote, four in 10 (42 percent) mention opposing or repealing the health care law with many fewer mentioning health care costs (24 percent) and increasing access to health care and insurance (18 percent). On the other side, smaller shares of Democratic voters who were asked what they mean when they say health care is extremely important to their vote mention the health care law (5 percent mention opposing or repealing the law and 10 percent favoring or expanding it), but they are more likely to say increasing access to health care and insurance (28 percent) and cost-related concerns (36 percent).
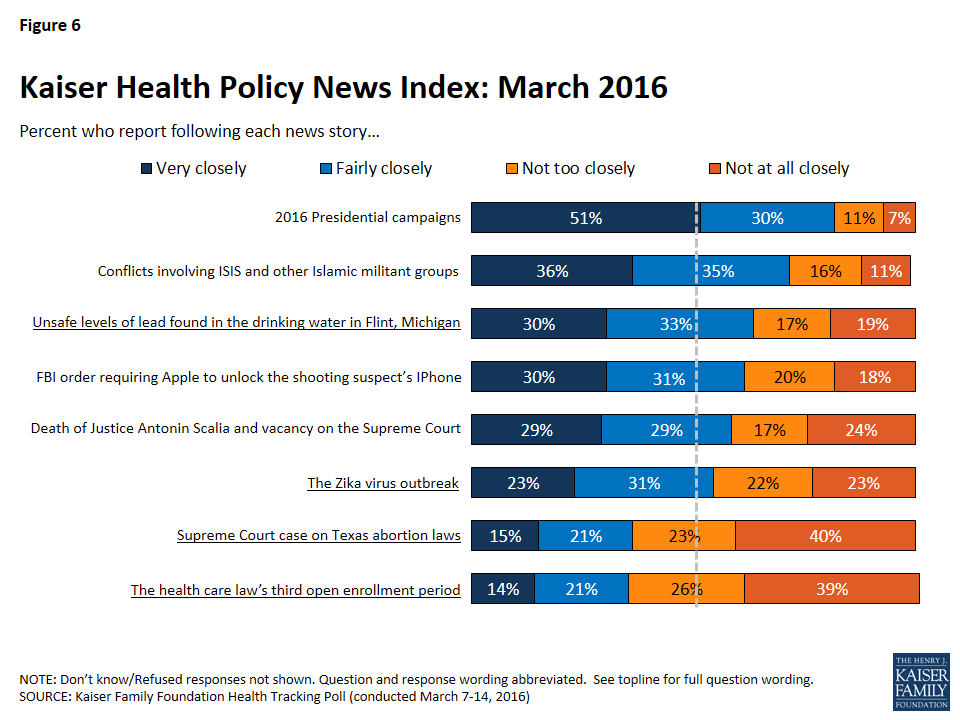
Kaiser Health Policy News Index: March 2016
The March Kaiser Health Tracking Poll finds that the vast majority of Americans (81 percent) are following stories about the 2016 presidential campaign, an eight percentage point increase from last month’s Health Tracking Poll. In fact, for the first time this election season, more than half of Americans (51 percent) report following the news of the presidential campaigns ‘very closely.’ Other stories that captured the attention of Americans this month include conflicts involving ISIS and other Islamic militant groups (72 percent), the health policy news story about unsafe lead levels in Flint Michigan’s water (63 percent), the FBI order requiring Apple to unlock the San Bernardino shooting suspect’s iPhone (61 percent), and the death of Supreme Court Justice Antonin Scalia and the subsequent vacancy on the Supreme Court (59 percent). Just over half of the public says they followed news about the Zika virus outbreak (54 percent). Fewer Americans report following two additional health policy stories, with only slightly more than a third saying they closely followed news about the U.S. Supreme Court case on Texas abortion laws (36 percent) and the health care law’s third open enrollment period (34 percent).
Women’s Reproductive Health Choices and Services
The Supreme Court case on Texas abortion laws, closely followed by 36 percent of the public, is one of two cases regarding women’s reproductive health before the U.S. Supreme Court this term. The other case deals with religious objections to the health care law’s requirement that employers provide contraception coverage for their female employees. In light of these cases, this month’s Kaiser Health Tracking Poll examines how the public, and women specifically, feel about the state of women’s reproductive health policy.
Wide-Scale Effort to Limit Women’s Reproductive Health Choices and Services
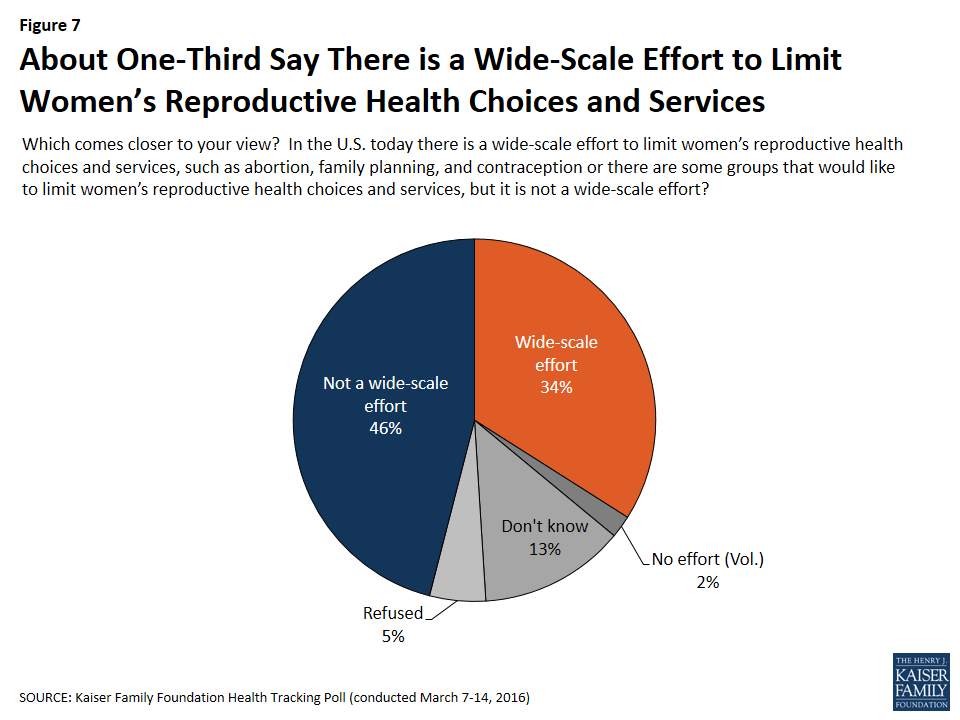
About a third of Americans (34 percent) say ‘there is a wide-scale effort to limit women’s reproductive health choices and services, such as abortion, family planning, and contraception’ while nearly half (46 percent) say that ‘there are some groups that would like to limit these choices and services, but it is not a wide-scale effort,’ and 13 percent say they don’t know. The share that say there is a wide-scale effort is six percentage points higher than it was in 2012 when women’s reproductive health policy garnered similar levels of media attention.
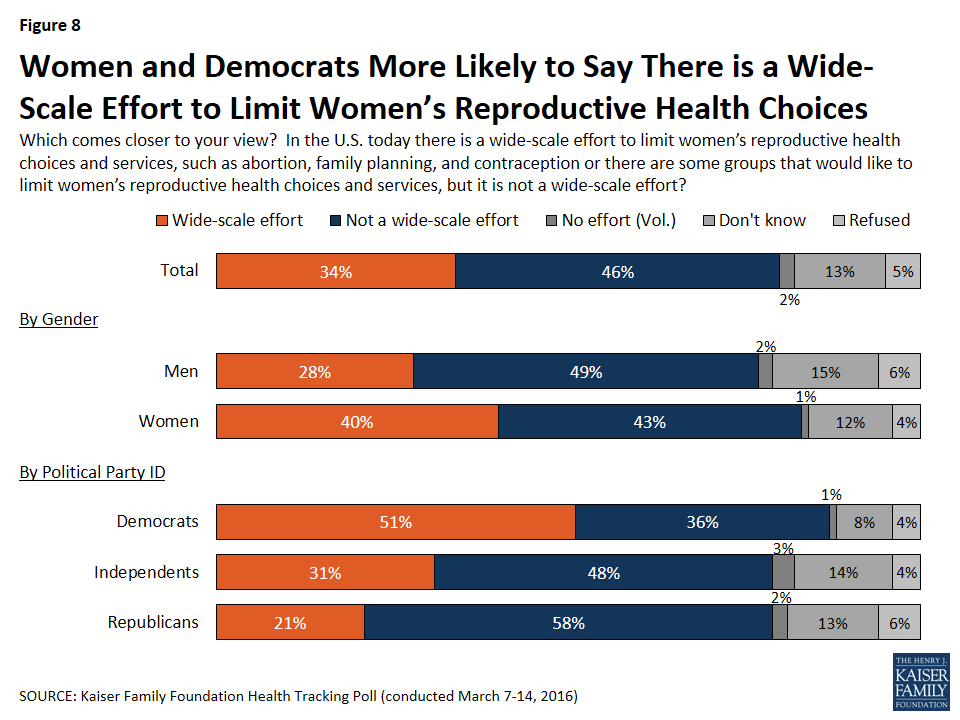
Significantly more women than men (40 percent vs. 28 percent) and more Democrats than independents or Republicans (51 percent vs. 31 percent and 21 percent) say they believe there is a wide-scale effort to limit women’s reproductive health choices and services.
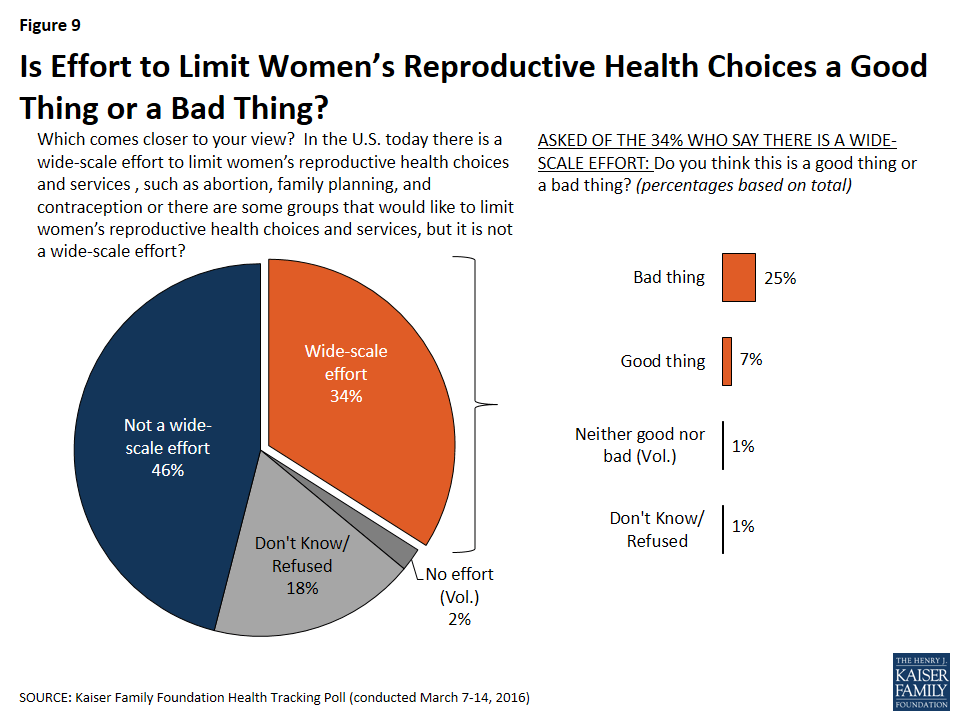
Among those who say there is a wide-scale effort to limit women’s reproductive health choices and services, more say the wide-scale effort is a ‘bad thing’ (25 percent overall), than say there it is a ‘good thing’ (7 percent overall).
A Closer Look at the Opinions of Women Partisans
Opinions among women are by no means uniform when it comes to issues of women’s reproductive health, and fall very distinctly down party lines.
Female Democratic voters are more likely to believe that there is a wide-scale effort to limit women’s reproductive health choices and services than independent and Republican female voters (56 percent vs. 36 percent and 25 percent, respectively). Furthermore, female Democratic and independent voters are much more likely to say that it is a ‘bad thing’ (51 percent and 29 percent) than a ‘good thing,’ while female Republican voters are evenly divided between thinking such an effort is a ‘bad thing’ or a ‘good thing’ (11 percent and 10 percent). About half of female Democratic voters (52 percent) say that they are personally concerned about women’s reproductive health choices and services compared to about three in 10 female independent voters (31 percent) and two in 10 female Republican voters (18 percent) who say the same.
| Table 1: Female Partisans on Women’s Reproductive Health Choices and Services | |||
| Which comes closer to your view? | Dem Female Voters | Ind Female Voters | Rep Female Voters |
| There is a wide-scale effort to limit women’s reproductive health choices and services, such as abortion, family planning, and contraception | 56% | 36% | 25% |
| Good thing | 2 | 4 | 10 |
| Bad thing | 51 | 29 | 11 |
| Neither good nor bad (Vol.) | 3 | 3 | 1 |
| Very or somewhat personally concerned | 52 | 31 | 18 |
| Not too or not at all personally concerned | 4 | 5 | 5 |
| There are some groups that would like to limit women’s reproductive health choices and services, but it is not a wide-scale effort | 33 | 45 | 56 |
| There has been no effort to limit women’s reproductive health choices and services (Vol.) | <1 | 2 | 2 |
| Don’t Know/ Refused | 11 | 17 | 17 |
| NOTE: Don’t Know/ Refused responses not shown for questions asked of those who say there is a wide-scale effort. | |||
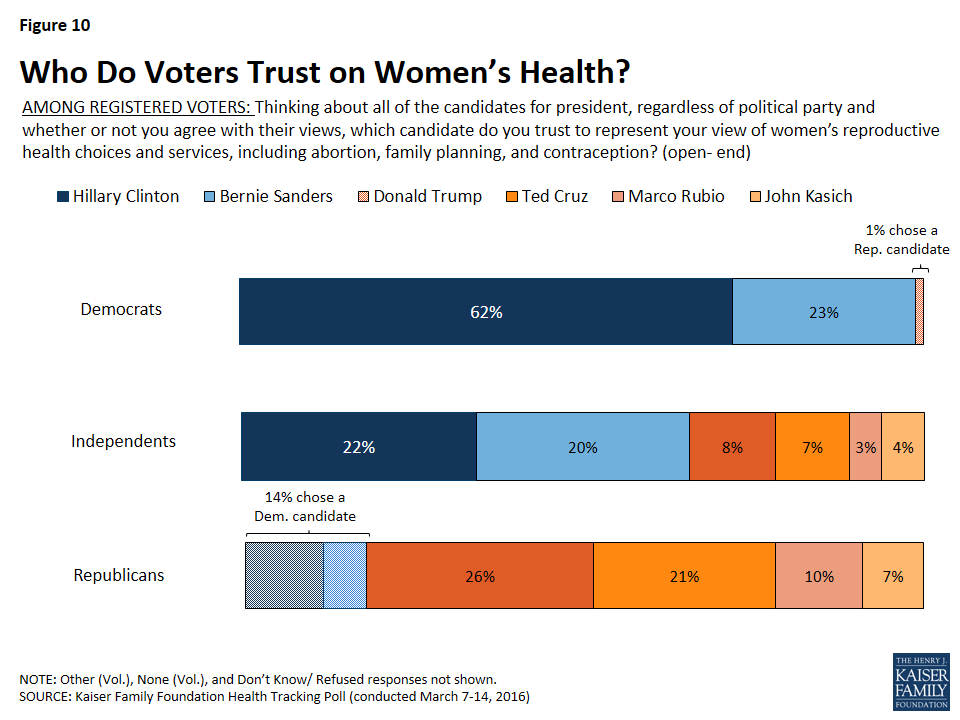
Which Candidate Do Voters Trust to Represent Views on Women’s Health
A majority of Democratic voters (62 percent) name Hillary Clinton when asked which candidate for president they trust to represent their view of women’s reproductive health choices and services, while almost a quarter of Democratic voters (23 percent) name Bernie Sanders, and one percent name Republican candidate Donald Trump. On the other side of the political spectrum, Republican voters don’t coalesce around any one candidate as the most trustworthy when it comes to women’s health. About a fourth of Republican voters (26 percent) say they trust Donald Trump to represent their views and about two in 10 (21 percent) name Ted Cruz. Fewer Republican voters name Marco Rubio (10 percent) or John Kasich (7 percent), which is similar to the share of Republican voters who name Democratic candidates Hillary Clinton (9 percent) and Bernie Sanders (5 percent). More independent voters say they trust the Democratic candidates than say they trust the Republican candidates when it comes to women’s reproductive health, however there is no candidate that stands out as the most trustworthy; with Hillary Clinton and Bernie Sanders nearly tied (22 percent and 20 percent, respectively). Female voters’ responses largely mirror the majority of voters from each party.
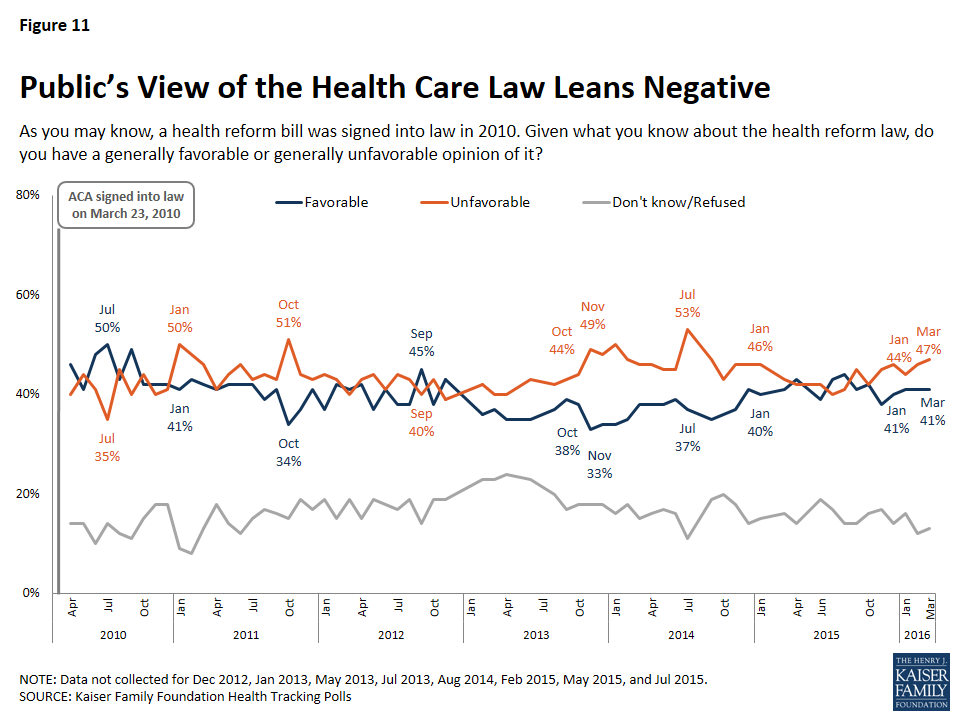
Americans’ Opinions of the Affordable Care Act
After the close of the ACA’s third open enrollment period on January 31st, Americans’ opinion of the health care law is tilting negative, with 41 percent saying they have a favorable view and 47 percent saying they have an unfavorable view. Furthermore, partisans continue to hold widely differing views; over two-thirds of Democrats (69 percent) report a favorable view, while nearly eight in 10 Republicans (78 percent) report an unfavorable view, and independents fall in the middle, with 40 percent saying they have a favorable opinion and 45 percent saying they have an unfavorable opinion.
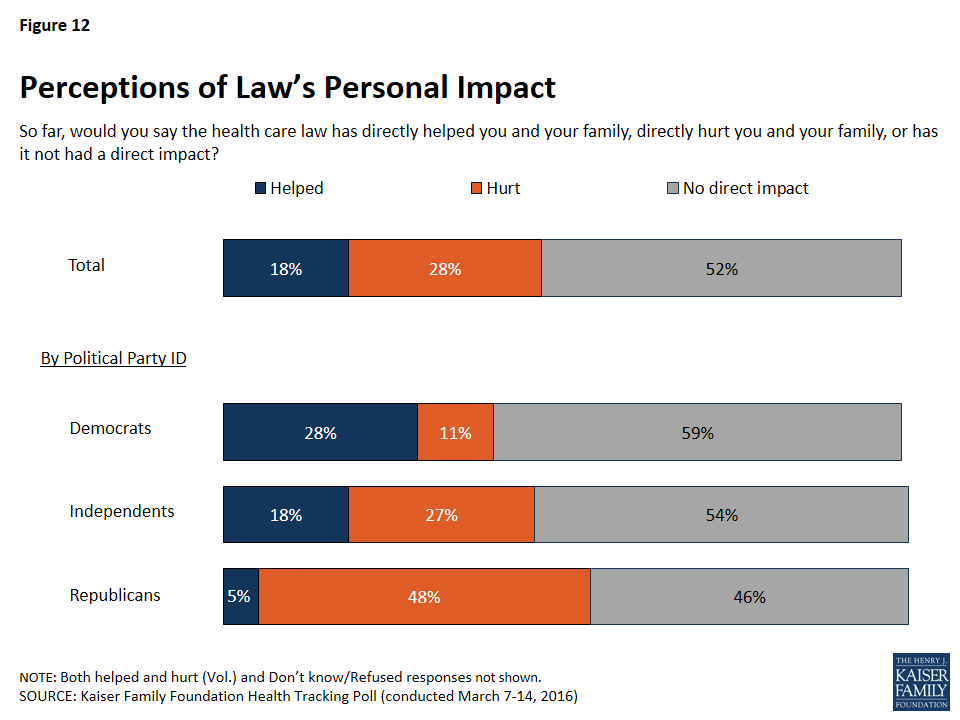
Overall, half of the public (52 percent) says they have not been directly impacted by the health care law, however more say they have been hurt by the law than say they have been helped (28 percent compared to 18 percent). Once again, this significantly differs by party with 28 percent of Democrats reporting that they have been helped while almost half (48 percent) of Republicans reporting they have been hurt by the health care law.
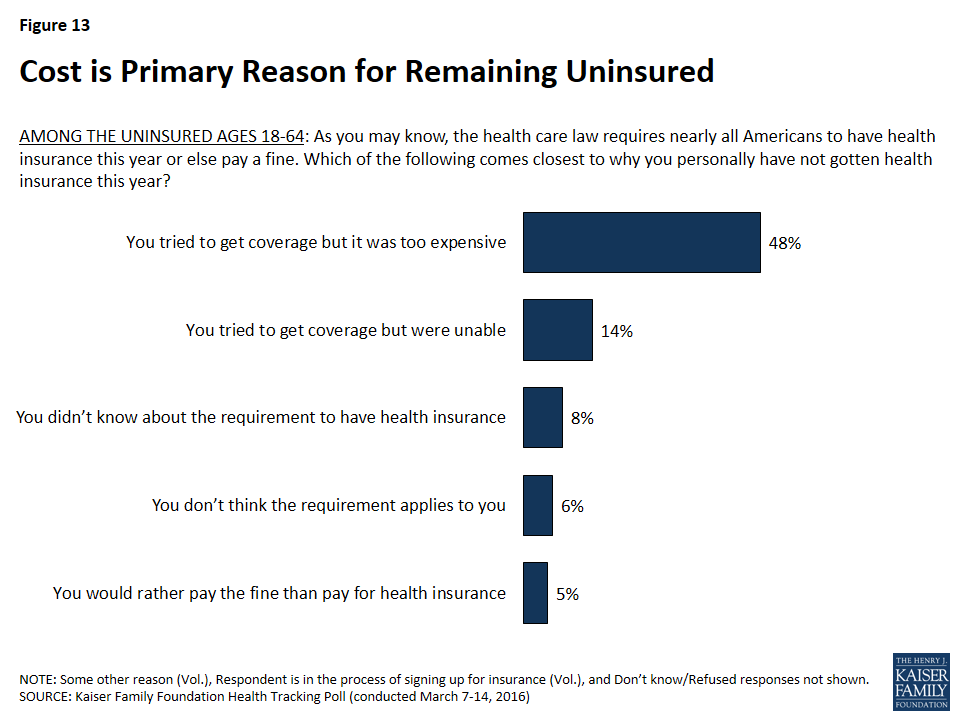
Uninsured Americans Cite Costs as Main Reason for Remaining Uninsured
When asked why they have not purchased health insurance this year, nearly half of the uninsured (48 percent) say they have tried to get coverage but that it was too expensive. Others say they tried to get coverage but were unable (14 percent), they did not know about the requirement to have health insurance (8 percent), they did not think the requirement applies to them (6 percent), and they would rather pay the fine than pay for coverage (5 percent).
Methodology
This Kaiser Health Tracking Poll was designed and analyzed by public opinion researchers at the Kaiser Family Foundation (KFF). The survey was conducted March 7-14, 2016, among a nationally representative random digit dial telephone sample of 1,201 adults ages 18 and older, living in the United States, including Alaska and Hawaii (note: persons without a telephone could not be included in the random selection process). Computer-assisted telephone interviews conducted by landline (421) and cell phone (780, including 478 who had no landline telephone) were carried out in English and Spanish by Princeton Data Source under the direction of Princeton Survey Research Associates International (PSRAI). Both the random digit dial landline and cell phone samples were provided by Survey Sampling International, LLC. For the landline sample, respondents were selected by asking for the youngest adult male or female currently at home based on a random rotation. If no one of that gender was available, interviewers asked to speak with the youngest adult of the opposite gender. For the cell phone sample, interviews were conducted with the adult who answered the phone. KFF paid for all costs associated with the survey.
The combined landline and cell phone sample was weighted to balance the sample demographics to match estimates for the national population using data from the Census Bureau’s 2014 American Community Survey (ACS) on sex, age, education, race, Hispanic origin, nativity (for Hispanics only), and region along with data from the 2010 Census on population density. The sample was also weighted to match current patterns of telephone use using data from the January-June 2015 National Health Interview Survey. The weight takes into account the fact that respondents with both a landline and cell phone have a higher probability of selection in the combined sample and also adjusts for the household size for the landline sample. All statistical tests of significance account for the effect of weighting.
The margin of sampling error including the design effect for the full sample is plus or minus 3 percentage points. Numbers of respondents and margins of sampling error for key subgroups are shown in the table below. For results based on other subgroups, the margin of sampling error may be higher. Sample sizes and margins of sampling error for other subgroups are available by request. Note that sampling error is only one of many potential sources of error in this or any other public opinion poll. Kaiser Family Foundation public opinion and survey research is a charter member of the Transparency Initiative of the American Association for Public Opinion Research.
| Group | N (unweighted) | M.O.S.E. |
| Total | 1201 | ±3 percentage points |
| Registered Voters | 970 | ±4 percentage points |
| Party Identification | ||
| Democrats | 382 | ±6 percentage points |
| Republicans | 335 | ±6 percentage points |
| Independents | 324 | ±6 percentage points |
| Gender | ||
| Male | 607 | ±4 percentage points |
| Female | 594 | ±5 percentage points |