New Analysis Shows States with Medicaid Expansion Experienced Declines in Uninsured Hospital Discharges
Expanded health insurance coverage through the Affordable Care Act (ACA) is having a major impact on hospital payer mix across the country. Similar to other reports recently released, new data examining hospital discharges in 16 states with data through the second quarter in 2014 show increases in Medicaid and declines in uninsured or self-pay discharges in states that implemented the Medicaid expansion. These trends hold true for all hospital discharges as well as for specific services such as mental health or asthma. This information adds to a growing body of evidence indicating that coverage expansions are affecting providers and may lead to decreases in uncompensated care for the uninsured. These 16 states include 6 states that have not implemented (Florida, Georgia, Indiana, Missouri, Virginia, and Wisconsin) and 10 states that had implemented the Medicaid expansion (Arizona, California, Colorado, Hawaii, Iowa, Kentucky, Michigan, Minnesota, New Jersey, New York) by the second quarter in 2014.
Key Findings
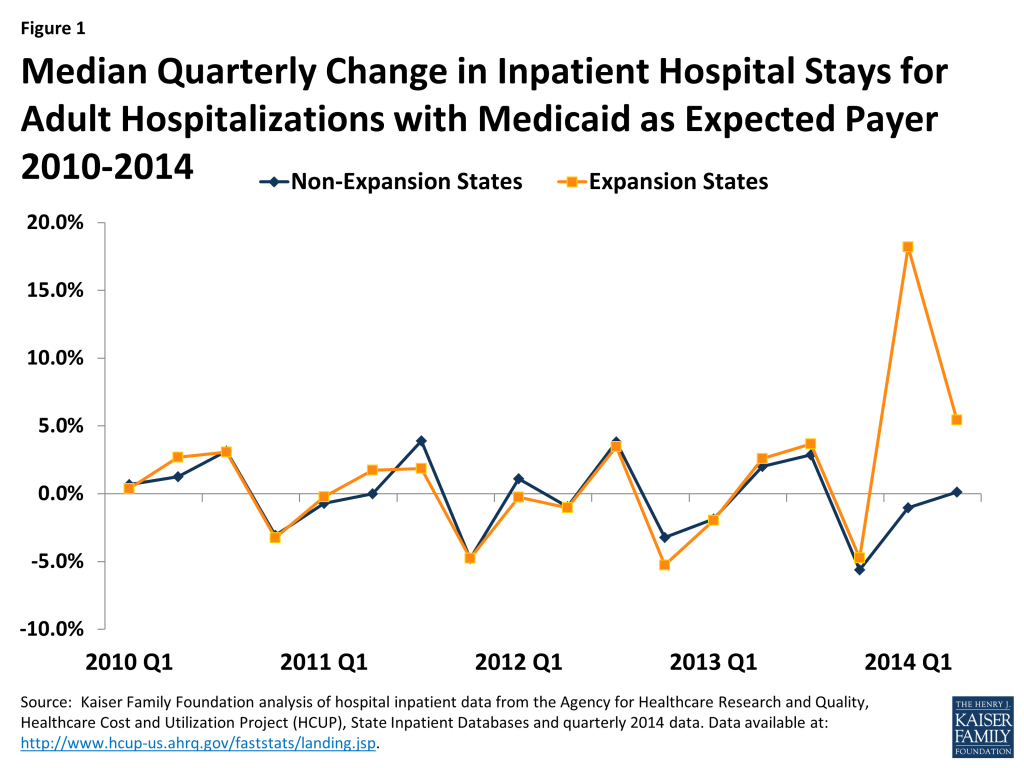
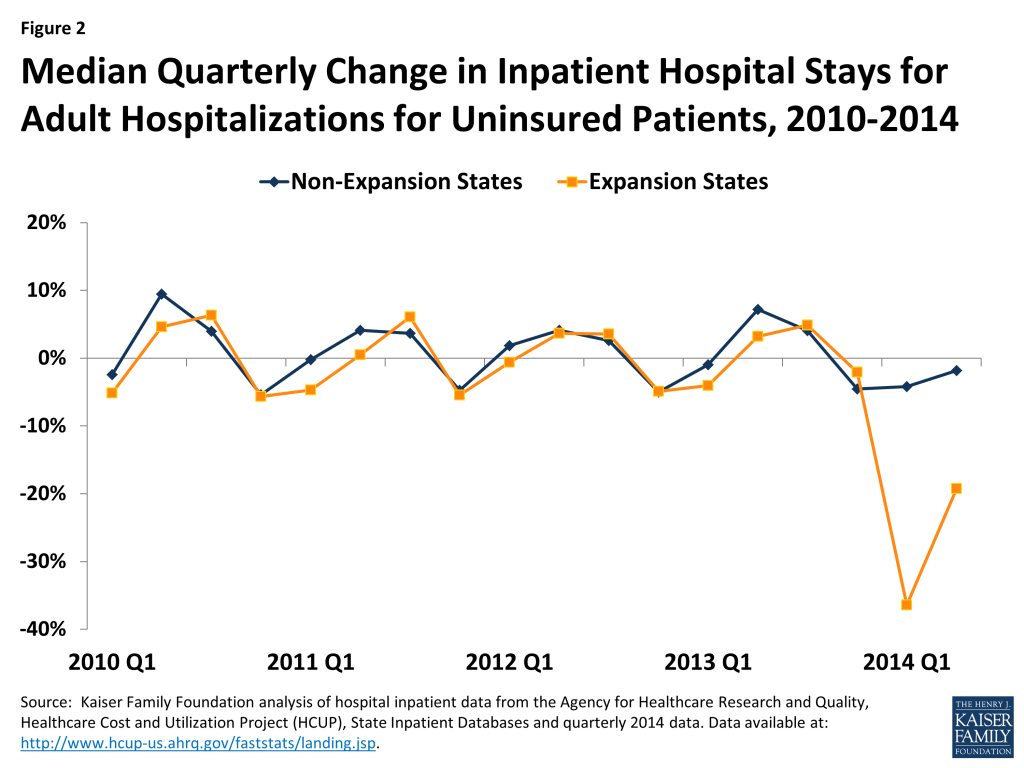
Prior to the ACA’s major coverage expansions, growth rates for inpatient stays in expansion and non-expansion states moved in tandem, but patterns diverged starting in 2014. From 2010 through 2013, the number of quarterly Medicaid and uninsured discharges in both expansion and non-expansion states changed cyclically in a similar pattern (Figures 1 and 2). Beginning in 2014, expansion states show sharp increases in inpatient stays for Medicaid and sharp declines for uninsured compared to non-expansion states (Figures 1 and 2).
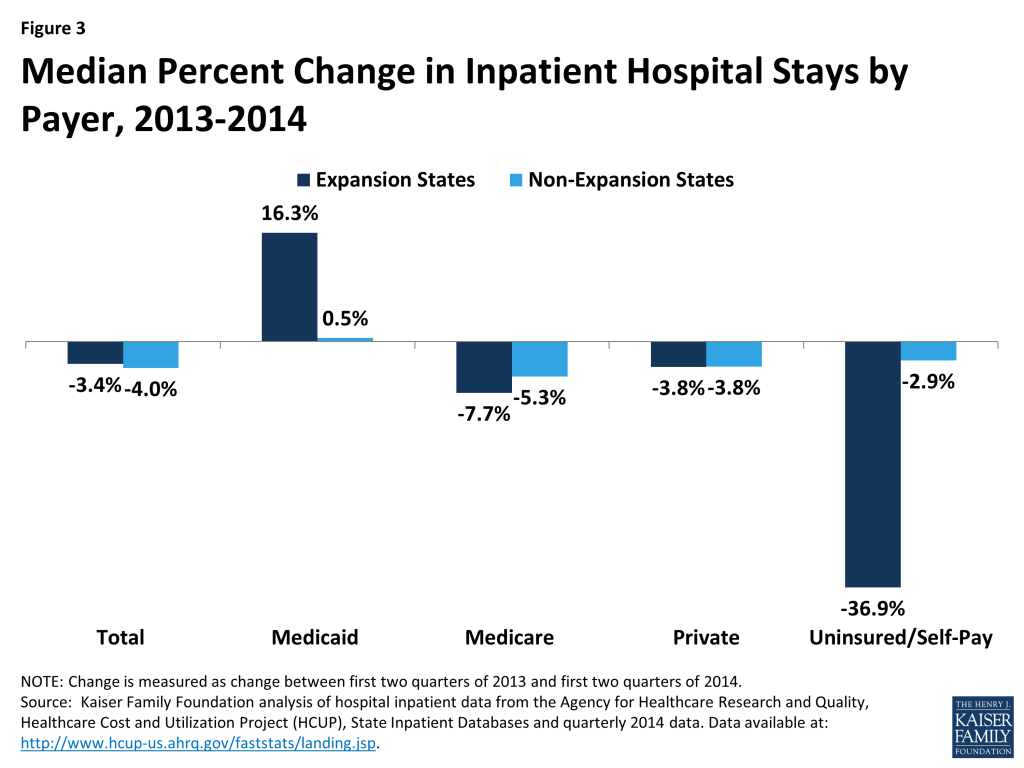
Comparing inpatient stays by payer for 2013 to 2014 shows sharp increases for Medicaid and sharp declines in uninsured for expansion states. Data show that while inpatient stays declined by 3.4% for a typical expansion state from 2013 to 2014, Medicaid inpatient stays increased by 16.3% and uninsured stays decreased by 36.9%. A typical non-expansion state experienced a decline in inpatient stays of 4.0% with small (0.5%) increases in Medicaid stays and slight declines in uninsured inpatient stays (2.9%) (Figure 3).
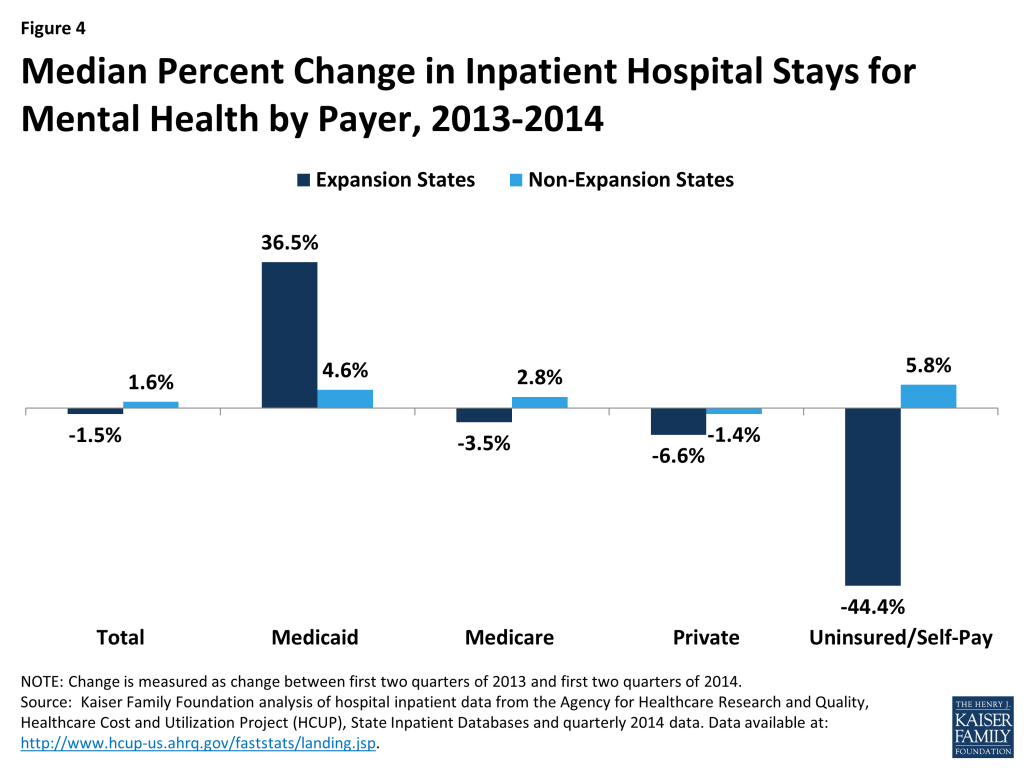
Increases in Medicaid discharges and declines in uninsured discharges for expansion states were especially pronounced for mental health. Among the states included in this analysis, adult mental health stays accounted for 5.8% of adult hospital stays in the 2nd quarter of 2014 (data not shown). A typical expansion state experienced a decrease of 1.5% in mental health inpatient stays but saw a 36.5% increase in Medicaid mental health inpatient stays and a 44.4% decline in uninsured stays for mental health. Non-expansion states saw overall mental health stays increase slightly (1.6% increase) with similar slight increases across payers except for private (Figure 4).
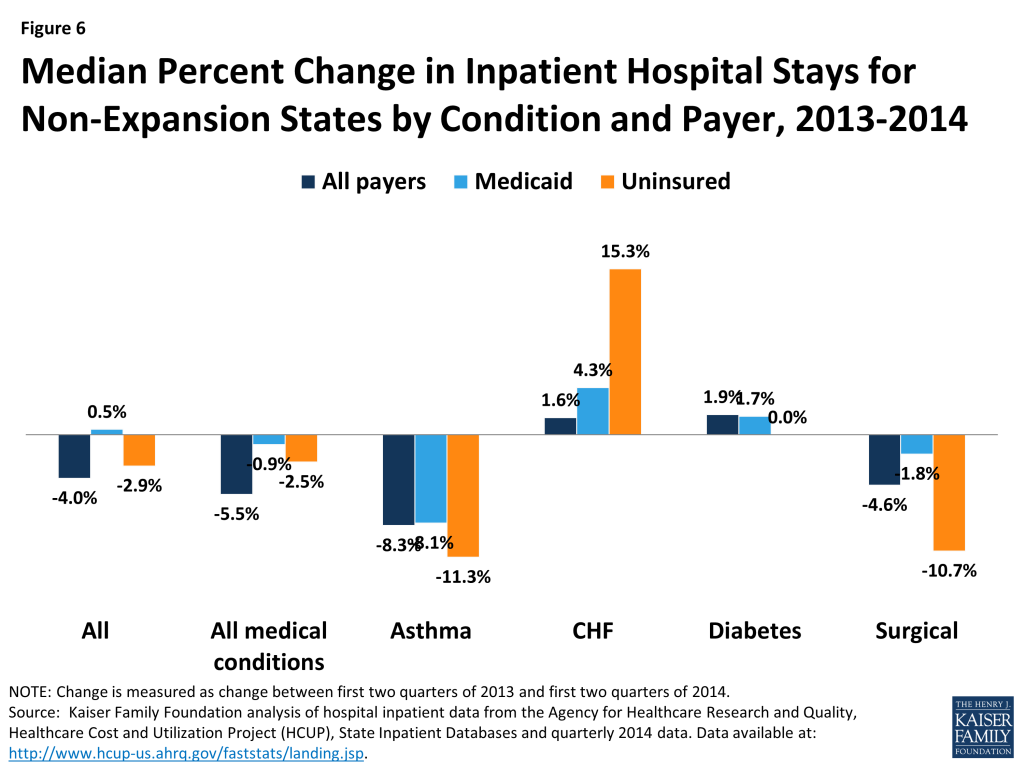
The 2013 to 2014 trends for expansion and non-expansion states are consistent across other types of inpatient stays. Among states in this analysis, medical conditions account for about half of all stays, surgical discharges account for about 23% of all stays, and other conditions account for much smaller shares (data not shown). These shares are similar for expansion and non-expansion states. Looking at changes in stays for other types of conditions including asthma, coronary heart failure (CHF), diabetes, and surgical care reveal similar patterns for expansion states as seen for total adult hospitalizations: while discharges declined overall, Medicaid discharges increased and uninsured discharges declined (Figure 5). For non-expansion states, stays for most conditions were flat or declined, both overall and for Medicaid and uninsured discharges. The exceptions to the pattern for non-expansion states were discharges for CHF, which rose 1.6% overall and 15.3% and 4.3% for uninsured and Medicaid, respectively, and diabetes, which rose slightly for all payers as well as Medicaid (Figure 6).

Looking ahead, changes may converge. Data for the later quarters in 2014 (not included in this analysis) show that the percent changes from quarter to quarter were not as disparate for expansion and non-expansion states as they were for the early months in 2014. This is likely because big level changes were occurring by payer when individuals changed coverage as a result of the Medicaid expansion in expansion states. Going forward, change between expansion and non-expansion states may follow similar trends as prior to the implementation of the ACA. In addition, it will be important to assess how these changes in discharges by payer are affecting hospitals’ financial position. While hospitals in expansion states saw large shifts in payer mix between Medicaid and uninsured, most hospital discharges are covered by other payers such as Medicare or private insurance. As states and hospitals continue to report data on changes in payer mix and financial performance, we will be able to gain a fuller picture of the full impact of the ACA on providers.
Methods
This data note uses data from the Healthcare Cost and Utilization Project (HCUP) to examine changes in discharges by payer for states that did and did not implement the ACA Medicaid expansion. HCUP consists of family of health care databases developed through a Federal-State-Industry partnership and sponsored by the Agency for Healthcare Research and Quality (AHRQ). Specifically, this analysis is based on data in the State Inpatient Databases (SID). The data is discharge-level data for all patients treated in community, non-rehabilitation hospitals in the state and is weighted to represent all discharges in the state. While 48 states participate in the SID, this analysis examines data from 16 states with data from 2010 through the second quarter of 2014. The 16 states include 6 states that had not implemented (Florida, Georgia, Indiana, Missouri, Virginia, and Wisconsin) and 10 states that had implemented the Medicaid expansion (Arizona, California, Colorado, Hawaii, Iowa, Kentucky, Michigan, Minnesota, New Jersey, New York) in this time period.
This data includes nearly 3 million hospital stays in the second quarter of 2014 (with 1.8 million (61%) from the expansion states and 1.2 million (39%) from the non-expansion states). Discharges in expansion and non-expansion states were concentrated in a small number of large states. For the group of expansion states, California and New York accounted for more than half of all discharges (54%), and for the non-expansion states, Florida and Georgia accounted for 56% of the discharges for the second quarter in 2014. (Table 1) Because these large states have a bigger impact on the overall experience of each group of states, we used the median for the group when examining outcomes of payer mix, percent change by quarter and when measuring change from 2013 to 2014.
The dominant payers for both expansion and non-expansion states were Medicare and private insurance. For all discharges in the second quarter of 2014, the typical expansion state had a higher percentage of Medicaid discharges compared to non-expansion states (22% versus 15%) and a lower percentage of uninsured discharges (3% versus 9%). (Table 1)
| Table 1: Number and Distribution of Discharges by Payer for States Included in Analysis, 2014 Q2 | |||||||||
| State | Total | Medicaid Discharges | Uninsured Discharges | Medicare Discharges | Private Insurance Discharges | ||||
| # | # | As a % ofTotal Discharges | # | As a % ofTotal Discharges | # | As a % ofTotal Discharges | # | As a % ofTotal Discharges | |
| All Expansion States | |||||||||
| Total | 1,836,900 | 448,350 | 24% | 62,450 | 3% | 778,250 | 42% | 547,850 | 30% |
| Median | 108,950 | 24,250 | 22% | 3,075 | 3% | 47,675 | 43% | 35,025 | 32% |
| Arizona | 121,900 | 29,350 | 24% | 6,500 | 5% | 52,700 | 43% | 33,350 | 27% |
| California | 604,050 | 176,550 | 29% | 20,500 | 3% | 235,300 | 39% | 171,700 | 28% |
| Colorado | 75,950 | 18,100 | 24% | 2,700 | 4% | 28,800 | 38% | 26,350 | 35% |
| Hawaii | 18,800 | 5,100 | 27% | 350 | 2% | 6,600 | 35% | 6,750 | 36% |
| Iowa | 56,950 | 8,300 | 15% | 1,100 | 2% | 29,550 | 52% | 18,000 | 32% |
| Kentucky | 96,000 | 26,400 | 28% | 2,300 | 2% | 42,650 | 44% | 24,650 | 26% |
| Michigan | 219,950 | 42,250 | 19% | 3,450 | 2% | 107,950 | 49% | 66,300 | 30% |
| Minnesota | 87,800 | 15,000 | 17% | 1,050 | 1% | 35,050 | 40% | 36,700 | 42% |
| New Jersey | 168,250 | 22,100 | 13% | 13,350 | 8% | 75,900 | 45% | 56,900 | 34% |
| New York | 387,250 | 105,200 | 27% | 11,150 | 3% | 163,750 | 42% | 107,150 | 28% |
| All Non-Expansion States | |||||||||
| Total | 1,155,850 | 191,300 | 17% | 108,450 | 9% | 544,950 | 47% | 311,150 | 27% |
| Median | 140,525 | 21,225 | 15% | 13,400 | 10% | 64,550 | 46% | 42,000 | 30% |
| Florida | 81,150 | 81,150 | 18% | 43,650 | 9% | 236,550 | 50% | 108,950 | 23% |
| Georgia | 31,250 | 31,250 | 16% | 27,600 | 16% | 67,950 | 39% | 45,600 | 26% |
| Indiana | 20,150 | 20,150 | 16% | 8,100 | 6% | 60,700 | 48% | 37,350 | 30% |
| Missouri | 22,300 | 22,300 | 12% | 13,750 | 10% | 64,150 | 46% | 38,400 | 28% |
| Virginia | 17,400 | 17,400 | 18% | 13,050 | 9% | 64,950 | 46% | 47,050 | 33% |
| Wisconsin | 19,050 | 19,050 | 18% | 2,300 | 2% | 50,650 | 48% | 33,800 | 32% |
| SOURCE: Kaiser Family Foundation analysis of hospital inpatient data from the Agency for Healthcare Research and Quality, Healthcare Cost and Utilization Project (HCUP), State Inpatient Databases and quarterly 2014 data. Data available at: http://www.hcup-us.ahrq.gov/faststats/landing.jsp. | |||||||||