Data Note: Prescription Drugs and Older Adults
Findings
With continued attention from policymakers on prescription drug costs, a 2019 KFF Health Tracking Poll took a deep dive into the views of Americans on a variety of topics related to prescription drugs with special attention paid to the experiences and attitudes of older adults, defined here as people ages 65 and older. Older adults’ experiences with prescription medications can vary significantly based on their health status, how many prescription drugs they are currently taking, and other demographic variables like household income. This data note explores the varied experiences of older adults across such different demographic groups. With most older adults (83%) reporting that they currently have insurance that helps them pay for prescription drugs1 , this data note also explores how older adults chose their prescription drug plans and what they prioritize in their coverage. In addition, it explores older adults’ views on several prescription drug policy options currently being discussed by policymakers.
Prescription Drug Use and Affordability Issues
Nearly nine in ten (89%) adults 65 and older report they are currently taking any prescription medicine. This compares to three-fourths of 50-64 year olds who report taking prescription drugs, half (51%) of 30-49 year olds, and four in ten (38%) 18-29 year olds. Older adults are also more likely than their younger counterparts to be taking multiple prescription medications. More than half of adults 65 and older (54%) report taking four or more prescription drugs compared to one-third of adults 50-64 years old (32%) and about one in ten adults 30-49 (13%) or 18-29 (7%).
Most seniors have prescription drug coverage through Medicare Part D, but majorities across party lines say drug costs are unreasonable. This @KFF data note examines this group’s experiences across a variety of demographics.
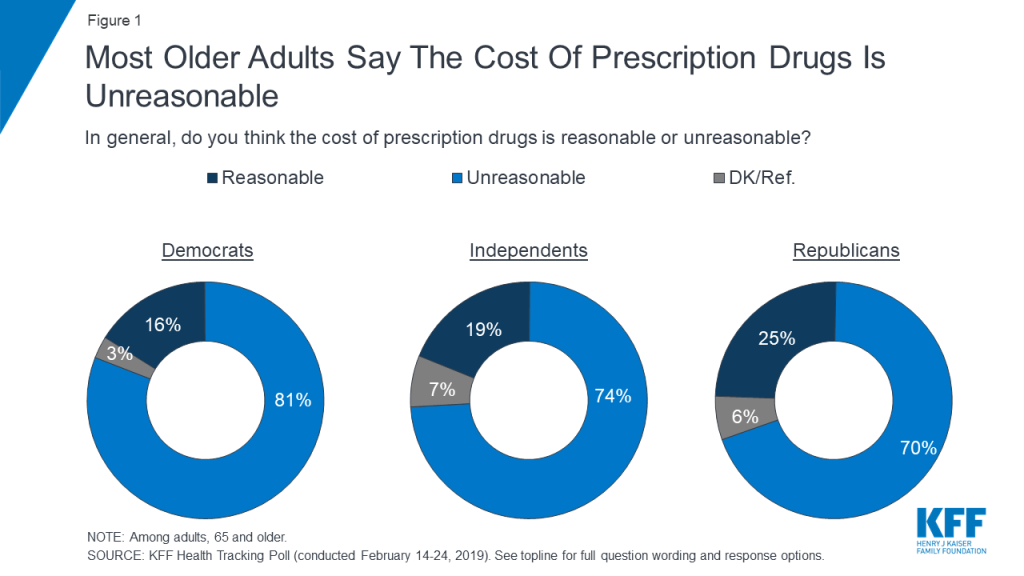
While a majority of older adults have prescription drug coverage through Medicare Part D, which is Medicare’s voluntary prescription drug benefit, most older adults (76%) think the cost of prescription drugs is unreasonable. This viewpoint is consistent across party identification, with majorities of Democrats (81%), independents (74%), and Republicans (70%) saying the cost of prescription drugs is unreasonable.
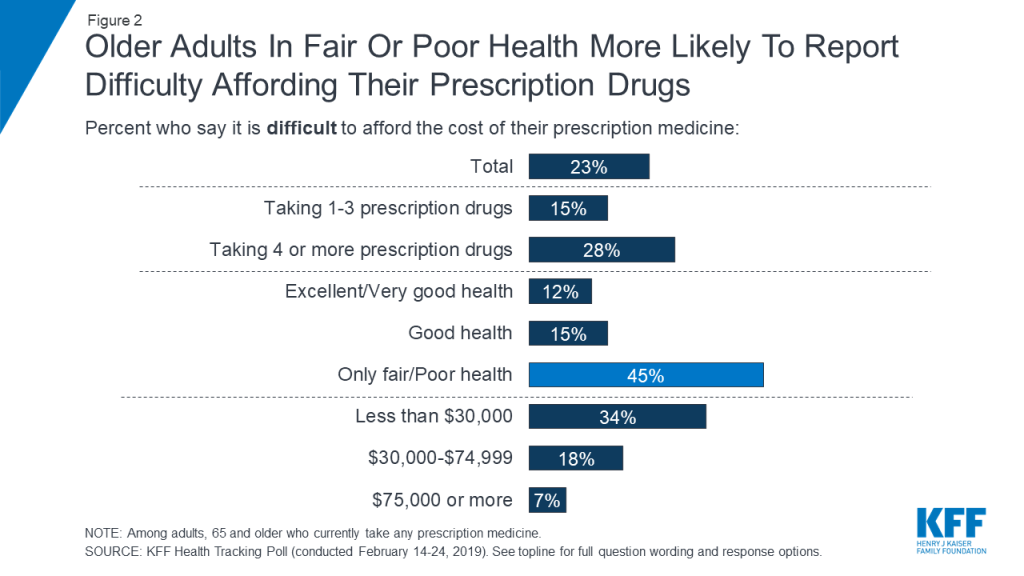
Nearly 1 in 4 older adults say it’s difficult to afford their prescription drugs. Who has the most trouble? Those in fair or poor health and those with low incomes. Read more @KFF
In addition, one-fourth of older adults (23%) who take prescription drugs say it is difficult to afford their prescription drugs, including about one in ten (8%) saying it is “very difficult.” As is true among the public as a whole, there are certain groups of older adults who are much more likely to report difficulty affording medications, including those who report being in either “only fair” or “poor” health (45%), whose household income is less than $30,000 annually (34%), and who take four or more prescriptions (28%). These factors are inter-related, as those who are in relatively poor health are also more likely to be taking four or more prescriptions and spending at least $25 a month on their medications.
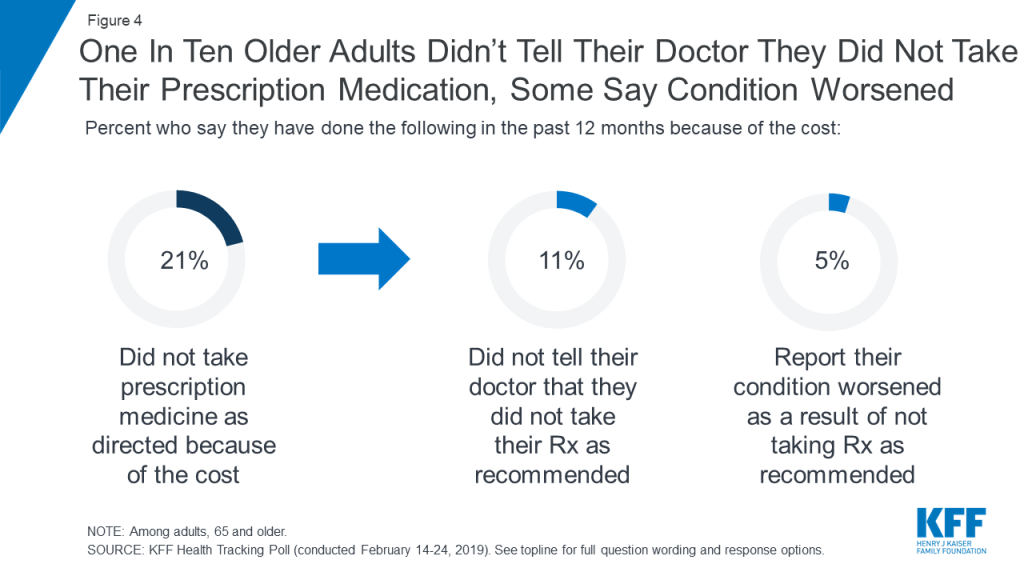
About one in five older adults (21%) say they did not take their medicines as prescribed at some point in the past year because of the cost. This includes those who report that, due to costs, they haven’t filled a prescription (12% of total older adults), took an over-the counter drug instead (11% of total), or cut pills in half or skipped a dose (8% of total).

Notably, among those who report not taking their medicines as prescribed, slightly more than half (53%) say they didn’t tell their doctor or health care provider (11% of the total) and one-fifth (22%) of this group say their condition got worse as a result of not taking their prescription as recommended (5% of total).
Less Than Half Of older adults report discussing the cost of Their prescriptions with their doctor or pharmacist
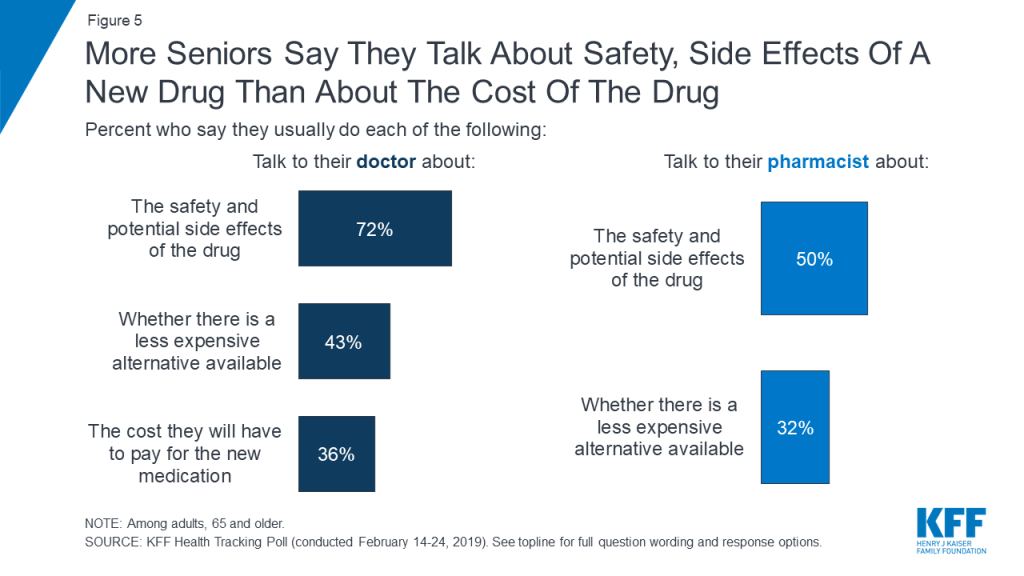
The KFF polling finds that older adults are more likely to report discussing safety concerns than cost issues with their doctors and pharmacists when getting a new prescription. Seven in ten older adults (72%) say they usually talk to their doctor about the safety and potential side effects of the drug when their doctor writes a prescription for a drug they haven’t taken before. In contrast, around four in ten older adults (43%) say they usually talk to their doctor about whether there is a less expensive alternative, and just over one-third (36%) talk about the cost they will have to pay for the new medication.
Similarly, while half of older adults say they usually talk to their pharmacist about the safety and potential side effects of a new prescription drug, fewer (32%) say they talk to their pharmacist about whether there is a less expensive alternative available. About four in ten (43%) say they talk their doctor about the same thing.
Older adults who report difficulty affording their prescriptions are no more likely to report talking to their doctor or their pharmacist about drug costs than those who report no difficulty affording their medications.
Experiences with Prescription Drug Coverage
People with prescription drug coverage under Medicare Part D are encouraged to compare plans each year to find coverage that best meets their individual needs, based on the specific drugs they take. For 2019, Medicare beneficiaries could choose from among 27 stand-alone Medicare Part D prescription drug plans, and 21 Medicare Advantage prescription drug plans, on average.
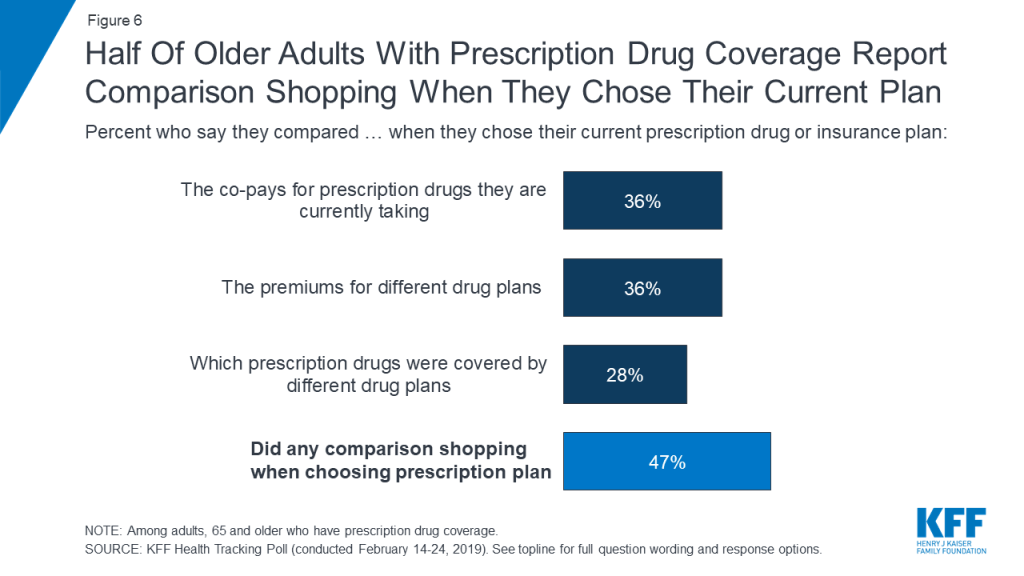
Less than four in ten older adults report comparing plan premiums (36%) or co-pays for prescription drugs they were currently taking (36%), and about three in ten (28%) say they compared which prescription drugs were covered by each of the different drug plans. Overall, about half (47%) of older adults who have prescription drug coverage say they did some comparison shopping when choosing their current prescription drug plan.
Some older adults report various problems accessing prescription drugs through their plan
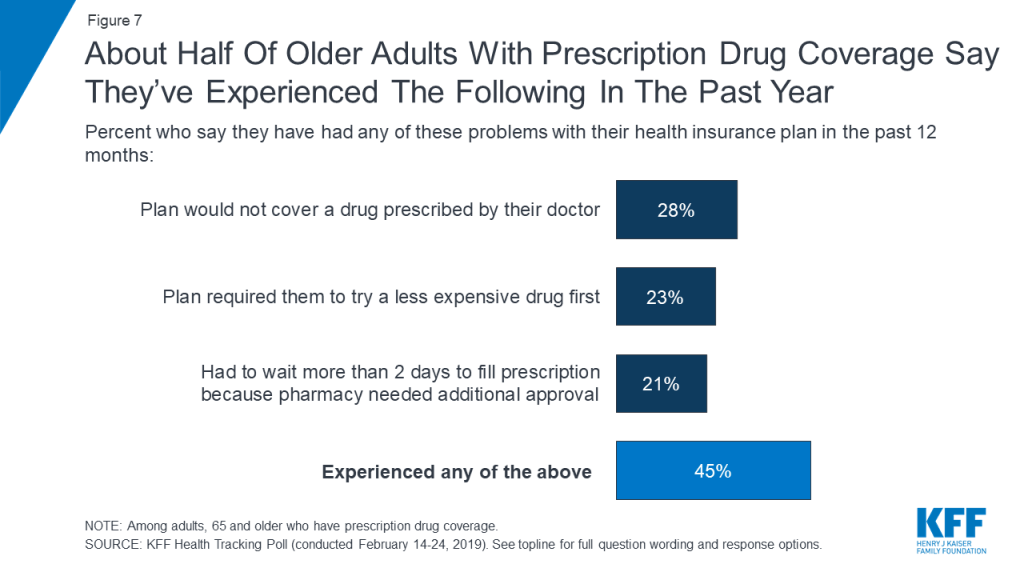
Overall, nearly half (45%) of older adults with prescription drug coverage say they have experienced various problems accessing prescription drugs through their drug plan in the past 12 months. Nearly three in ten older adults (28%) report that their plan did not cover a drug prescribed by their doctor. Nearly one-fourth (23%) report that their plan required them to try a less expensive drug before they could get a more expensive drug initially prescribed by their doctor—a utilization management tool known as step therapy—and one in five (21%) report having to wait more than two days to get a prescription filled due to prior authorization requirements by their drug plan.
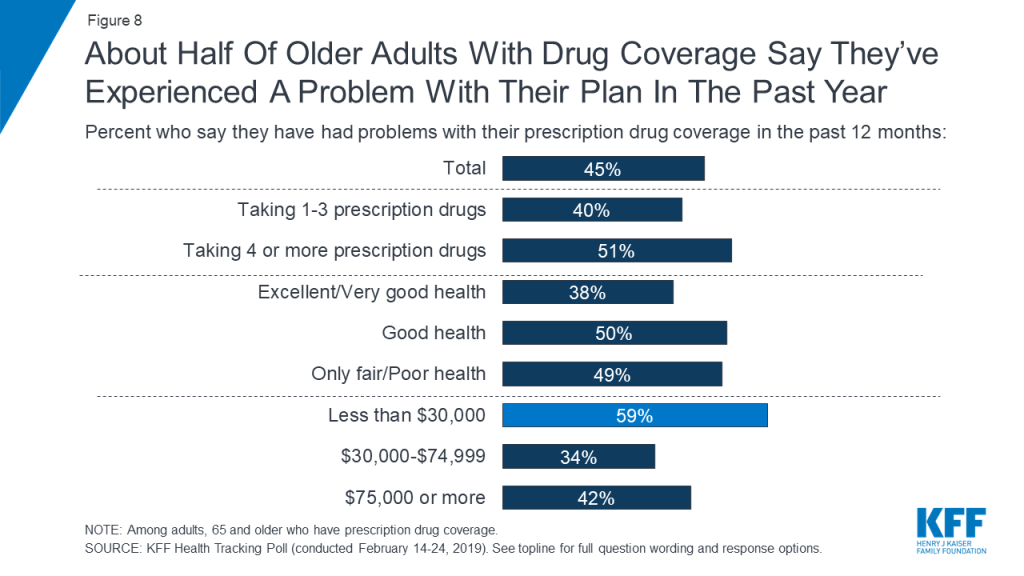
Certain groups of older adults were more likely than others to report experiencing difficulty with their prescription drug coverage in the past 12 months, including more than half of those with a household income of less than $30,000 a year and just over half of those taking four or more prescription drugs.
Few older adults report using patient assistance programs or other types of discounts
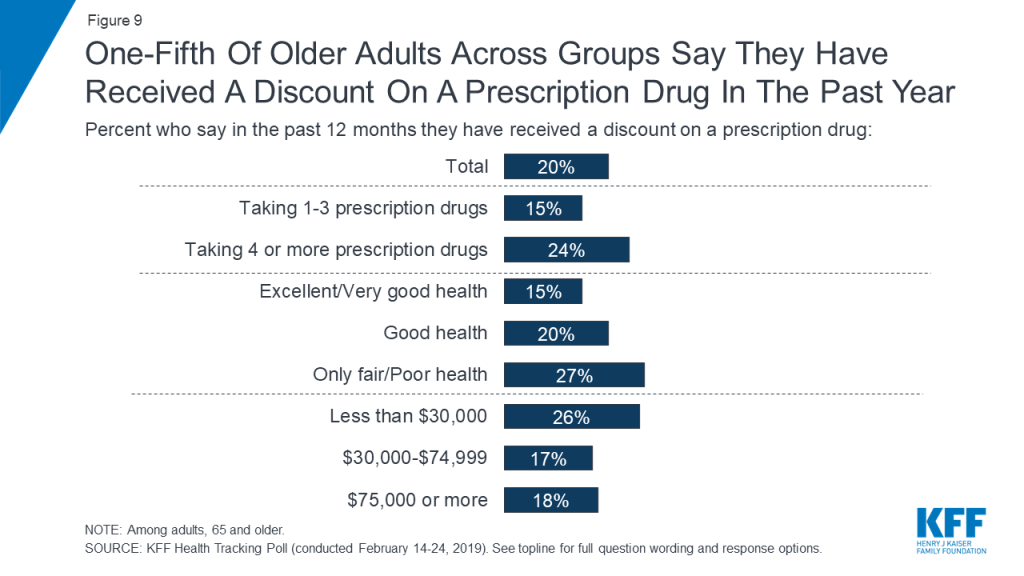
One-fifth of older adults say they have received a discount on a prescription drug in the past year, either through a coupon, a co-pay card, drug company patient assistance program, or some other type of discount. Those who report difficulty affording their medications are no more likely than those who do not report difficulty affording their medications to say they have received a discount on a prescription drug in the past year (25% compared to 20%, respectively).
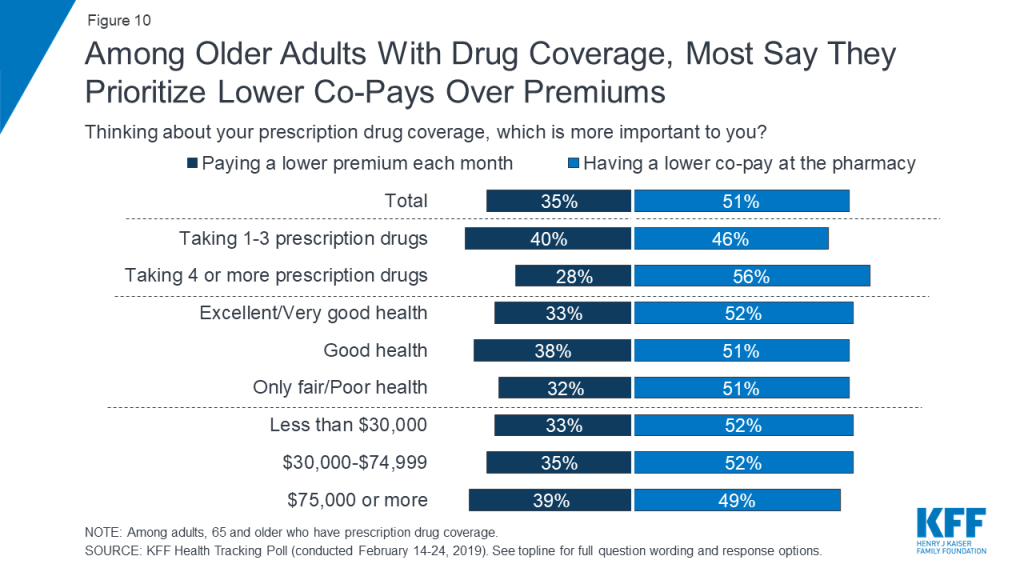
When older adults with prescription drug coverage were asked what feature of their coverage is more important to them, a larger share say having a lower co-pay at the pharmacy is more important to them than paying a lower premium each month (51% versus 35%). This finding may reflect the greater frequency of payment for prescription drug co-pays versus monthly premiums. In addition, monthly Part D premiums have been relatively stable in recent years, which may help to lessen concerns about premium levels among older adults.
Majorities of Older Adults Support Various Actions Aimed at Keeping Costs Down
Unlike many other health policies that divide partisans, majorities of older adults across party identification favor many of the policy proposals included in the KFF poll, including recent Trump administration proposals like international reference pricing, Democratic proposals to allow the federal government to negotiate drug prices, and bipartisan proposals to add a cap on out-of-pocket spending to Part D. Each of these policy proposals is supported by large majorities of Democrats, independents, and Republicans.
| Table 1: Majorities Of Older Adults Across Partisans Say They Favor Medicare Drug Negotiations, Reference Pricing, And Placing Limits On Spending To Lower Drug Costs | ||||
| Percent of older adults who favor each of the following actions to keep prescription drug costs down: | Total | Democrats | Independents | Republicans |
| Allowing the gov’t to negotiate with drug companies to get a lower price for people with Medicare | 82% | 88% | 79% | 81% |
| Placing an annual limit on out-of-pocket drug costs for people with Medicare | 68 | 68 | 67 | 73 |
| Lowering what Medicare pays based on amounts in other countries | 60 | 61 | 61 | 58 |
| Allowing Medicare drug plans to put more restrictions on use of certain drugs | 45 | 48 | 46 | 42 |
| Allowing Medicare drug plans to exclude more drugs | 24 | 28 | 21 | 20 |
Fewer older adults favor allowing Medicare to restrict access to certain prescription medications such as allowing Medicare drug plans to put more restrictions on the use of certain drugs (45%) or allowing these plans to exclude more drugs (24%).
Methodology
This KFF Health Tracking Poll was designed and analyzed by public opinion researchers at the Kaiser Family Foundation (KFF). The survey was conducted February 14th–24th 2019, among a nationally representative random digit dial telephone sample of 1,440 adults ages 18 and older, living in the United States, including Alaska and Hawaii (note: persons without a telephone could not be included in the random selection process). The sample included 290 respondents reached by calling back respondents that had previously completed an interview on the KFF Tracking poll more than nine months ago. This month’s poll also includes an analysis of older Americans age 65 or older (n=606). To obtain a large enough sample, the sampling frame included an oversample of older adults using cell phones (n=26) and landlines (n=75) as well as callbacks to adults who fit the age criterion using the SSRS Omnibus poll (n=136). To efficiently obtain a sample of lower-income and non-White respondents, the sample also included an oversample of prepaid (pay-as-you-go) telephone numbers (25% of the cell phone sample consisted of prepaid numbers) as well as a subsample of respondents who had previously completed Spanish language interviews on the SSRS Omnibus poll (n=11). Both the random digit dial landline and cell phone samples were provided by Marketing Systems Group (MSG).
Computer-assisted telephone interviews conducted by landline (464) and cell phone (976, including 662 who had no landline telephone) were carried out in English and Spanish by SSRS of Glen Mills, PA. For the landline sample, respondents were selected by asking for the youngest adult male or female currently at home based on a random rotation. If no one of that gender was available, interviewers asked to speak with the youngest adult of the opposite gender. For the cell phone sample, interviews were conducted with the adult who answered the phone. KFF paid for all costs associated with the survey with additional funding for the over-sample provided by the John Hopkins’ Bloomberg School of Public Health.
The combined landline and cell phone sample was weighted to balance the sample demographics to match estimates for the national population using data from the Census Bureau’s 2017 American Community Survey (ACS) on sex, age, education, race, Hispanic origin, and region along with data from the 2010 Census on population density. The sample was also weighted to match current patterns of telephone use using data from the January-June 2018 National Health Interview Survey. The weight takes into account the fact that respondents with both a landline and cell phone have a higher probability of selection in the combined sample and also adjusts for the household size for the landline sample, and design modifications, namely, the oversampling of prepaid cell phones and likelihood of non-response for the re-contacted sample. To ensure accurate representation of the older population, the data were weighted separately for those younger than 65 and those 65 or older. All statistical tests of significance account for the effect of weighting.
The margin of sampling error including the design effect for the full sample is plus or minus 3 percentage points. Numbers of respondents and margins of sampling error for key subgroups are shown in the table below. For results based on other subgroups, the margin of sampling error may be higher. Sample sizes and margins of sampling error for other subgroups are available by request. Note that sampling error is only one of many potential sources of error in this or any other public opinion poll. Kaiser Family Foundation public opinion and survey research is a charter member of the Transparency Initiative of the American Association for Public Opinion Research.
| Group | N (unweighted) | M.O.S.E. |
| Total | 1,440 | ±3 percentage points |
| Adults who currently take prescription medicine | 1030 | ±4 percentage points |
| Adults with prescription drug plans | 1092 | ±4 percentage points |
| Democrats | 473 | ±6 percentage points |
| Republicans | 410 | ±6 percentage points |
| Independents | 397 | ±6 percentage points |
| Adults, 65 and older | 606 | ±5 percentage points |
| Adults, 65 or older, with prescription drug plan | 513 | ±5 percentage points |
Endnotes
- Another analysis conducted by the Kaiser Family Foundation of Medicare Part D enrollment data finds about three-fourths of older adults are Part D enrollees (72%), but some older adults may have other sources of drug coverage, such as retiree health benefits or coverage through the Veterans Administration. ↩︎