2025 California Health Benefits Survey
Average Family Premiums Exceed $28,000 in California
Introduction
Over 17 million non-elderly Californians (55%) received health benefits through an employer in 2023. The California Health Benefits Survey (CHBS) tracks trends in their coverage, including premiums, employee premium contributions, cost sharing, offer rates, and employer benefit strategies. In 2025, the survey also included questions about provider networks, coverage for GLP-1 agonists, premium cost drivers, and employee concerns about utilization management. The CHBS is jointly sponsored by the California Healthcare Foundation (CHCF) and KFF.
The 2025 survey includes responses from 464 non-federal public and private firms either located in California or employing workers in the state. The results are representative of California workers. Fielded from January through July 2025, it is the first California Health Benefits Survey since 2022. CHBS is as an oversample of the national KFF Employer Health Benefits Survey, allowing comparisons between the coverage available to workers in California and the nation overall. Unless otherwise noted, this report defines small firms as those with 10–199 workers and large firms as those with 200 or more workers.
Key Findings
- Premiums for covered workers in California are higher than premiums nationally. The average annual single coverage premium in California is $10,033, higher than the national average of $9,325. The average annual family premium in California is $28,397, higher than the national average of $26,993.
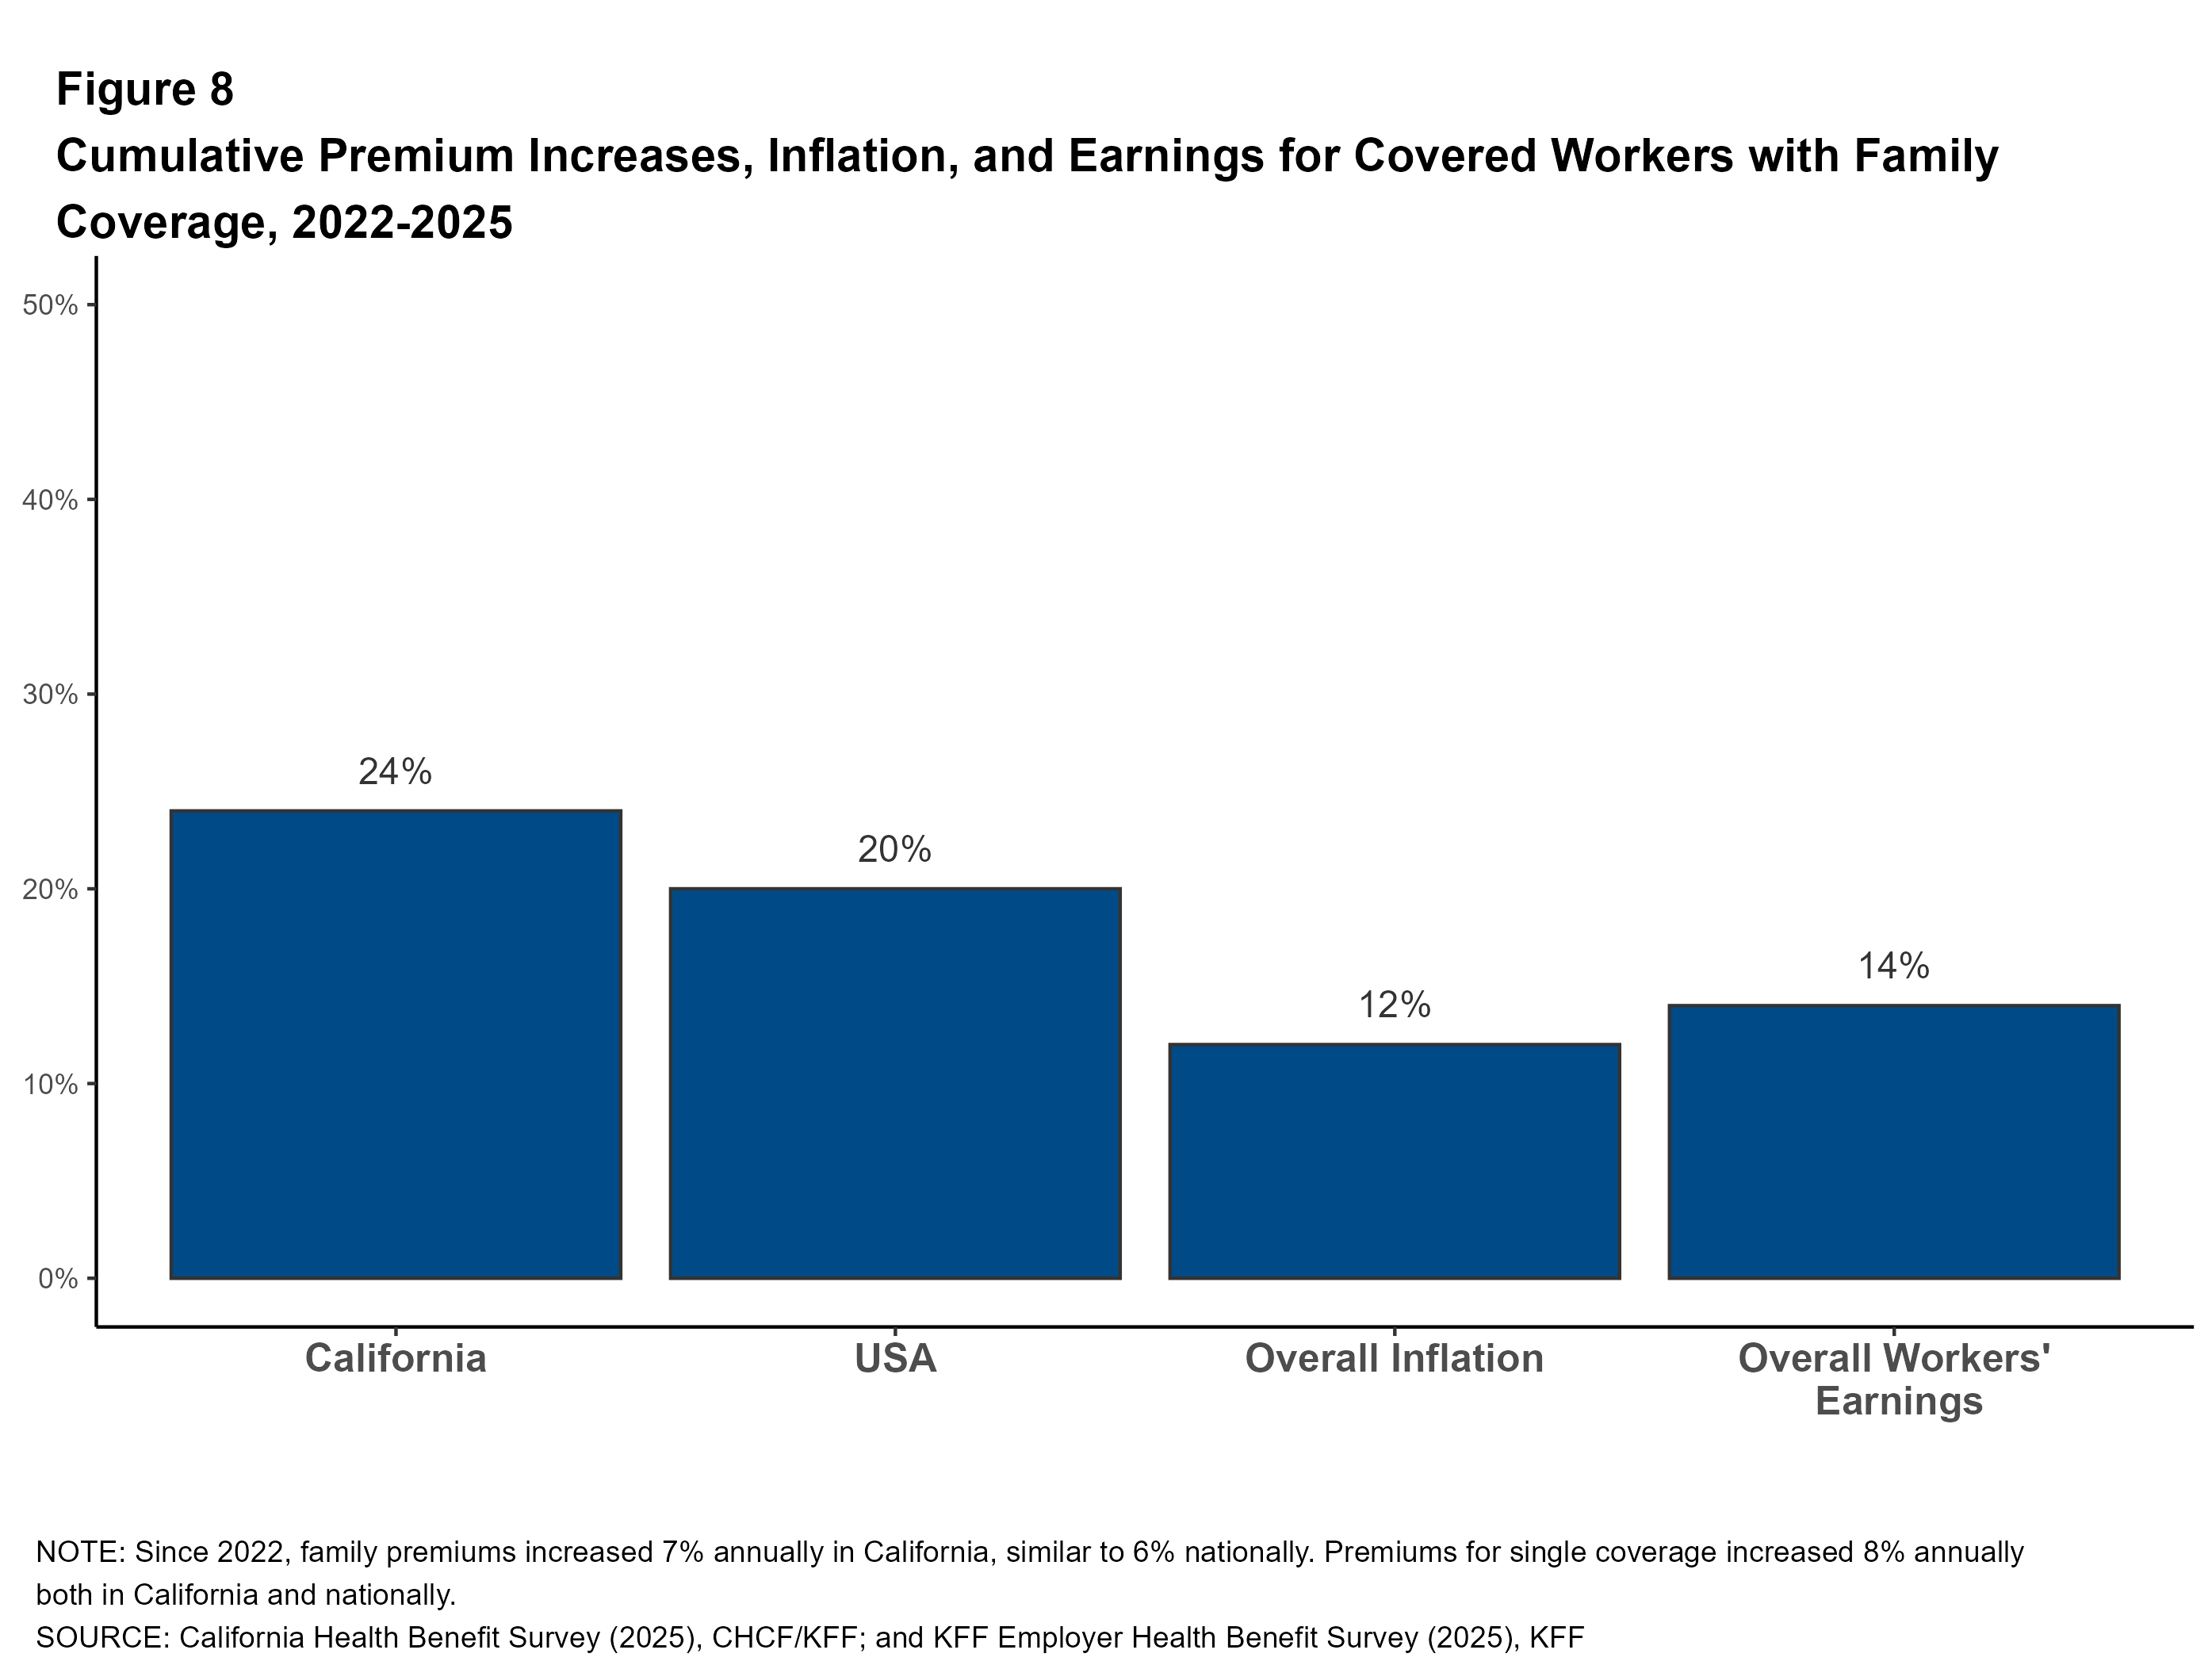
- In total, the average family premium has increased annually by 7% in California, and 6% nationally. The average single premium has increased 8% annually in California and 6% nationally. Since 2022, the average premium for family coverage has risen 24% in California, higher than national measures of inflation (12.2%) and wage growth (14.4%).
- Workers are typically required to contribute directly to the cost of coverage, usually through a payroll deduction. On average, covered workers in California contribute 14% of the premium for single coverage and 27% for family coverage in 2025. These shares vary considerably, and some workers face much higher premium contributions, especially for family coverage.
- Overall, a higher share of covered workers in California are enrolled in an HMO than the national average. Over a third (34%) of covered workers in California are enrolled in an HMO, compared to 12% nationally.
- A lower share of covered workers in California face a general annual deductible for single coverage than covered workers nationally (75% vs. 88%), and the average deductible is lower ($1,620 vs. $1,886). The share of California covered workers with a deductible has increased from 68% in 2022 to 75% in 2025.
- Employers in California are significantly less likely than employers across the nation to say there were a sufficient number of mental health providers in their plans’ networks to provide timely access to services.
- Many employers report concerns about out-of-pocket costs: 47% of firms offering health benefits indicate that their employees have a “high” or “moderate” level of concern about the affordability of cost sharing of their plans. One in 10 covered workers in California face a general annual deductible of $3,000 or more for single coverage.
- Large California employers view drug prices as a major driver of rising premiums. Thirty-six percent of large firms report that prescription drug prices contributed “a great deal” to premium increases.
- Over one-quarter (28%) of large firms offering health benefits in California say they cover GLP-1 agonists when prescribed primarily for weight loss. Nearly one-third of these firms report higher-than-expected utilization.
Distributions of Workers and Employers
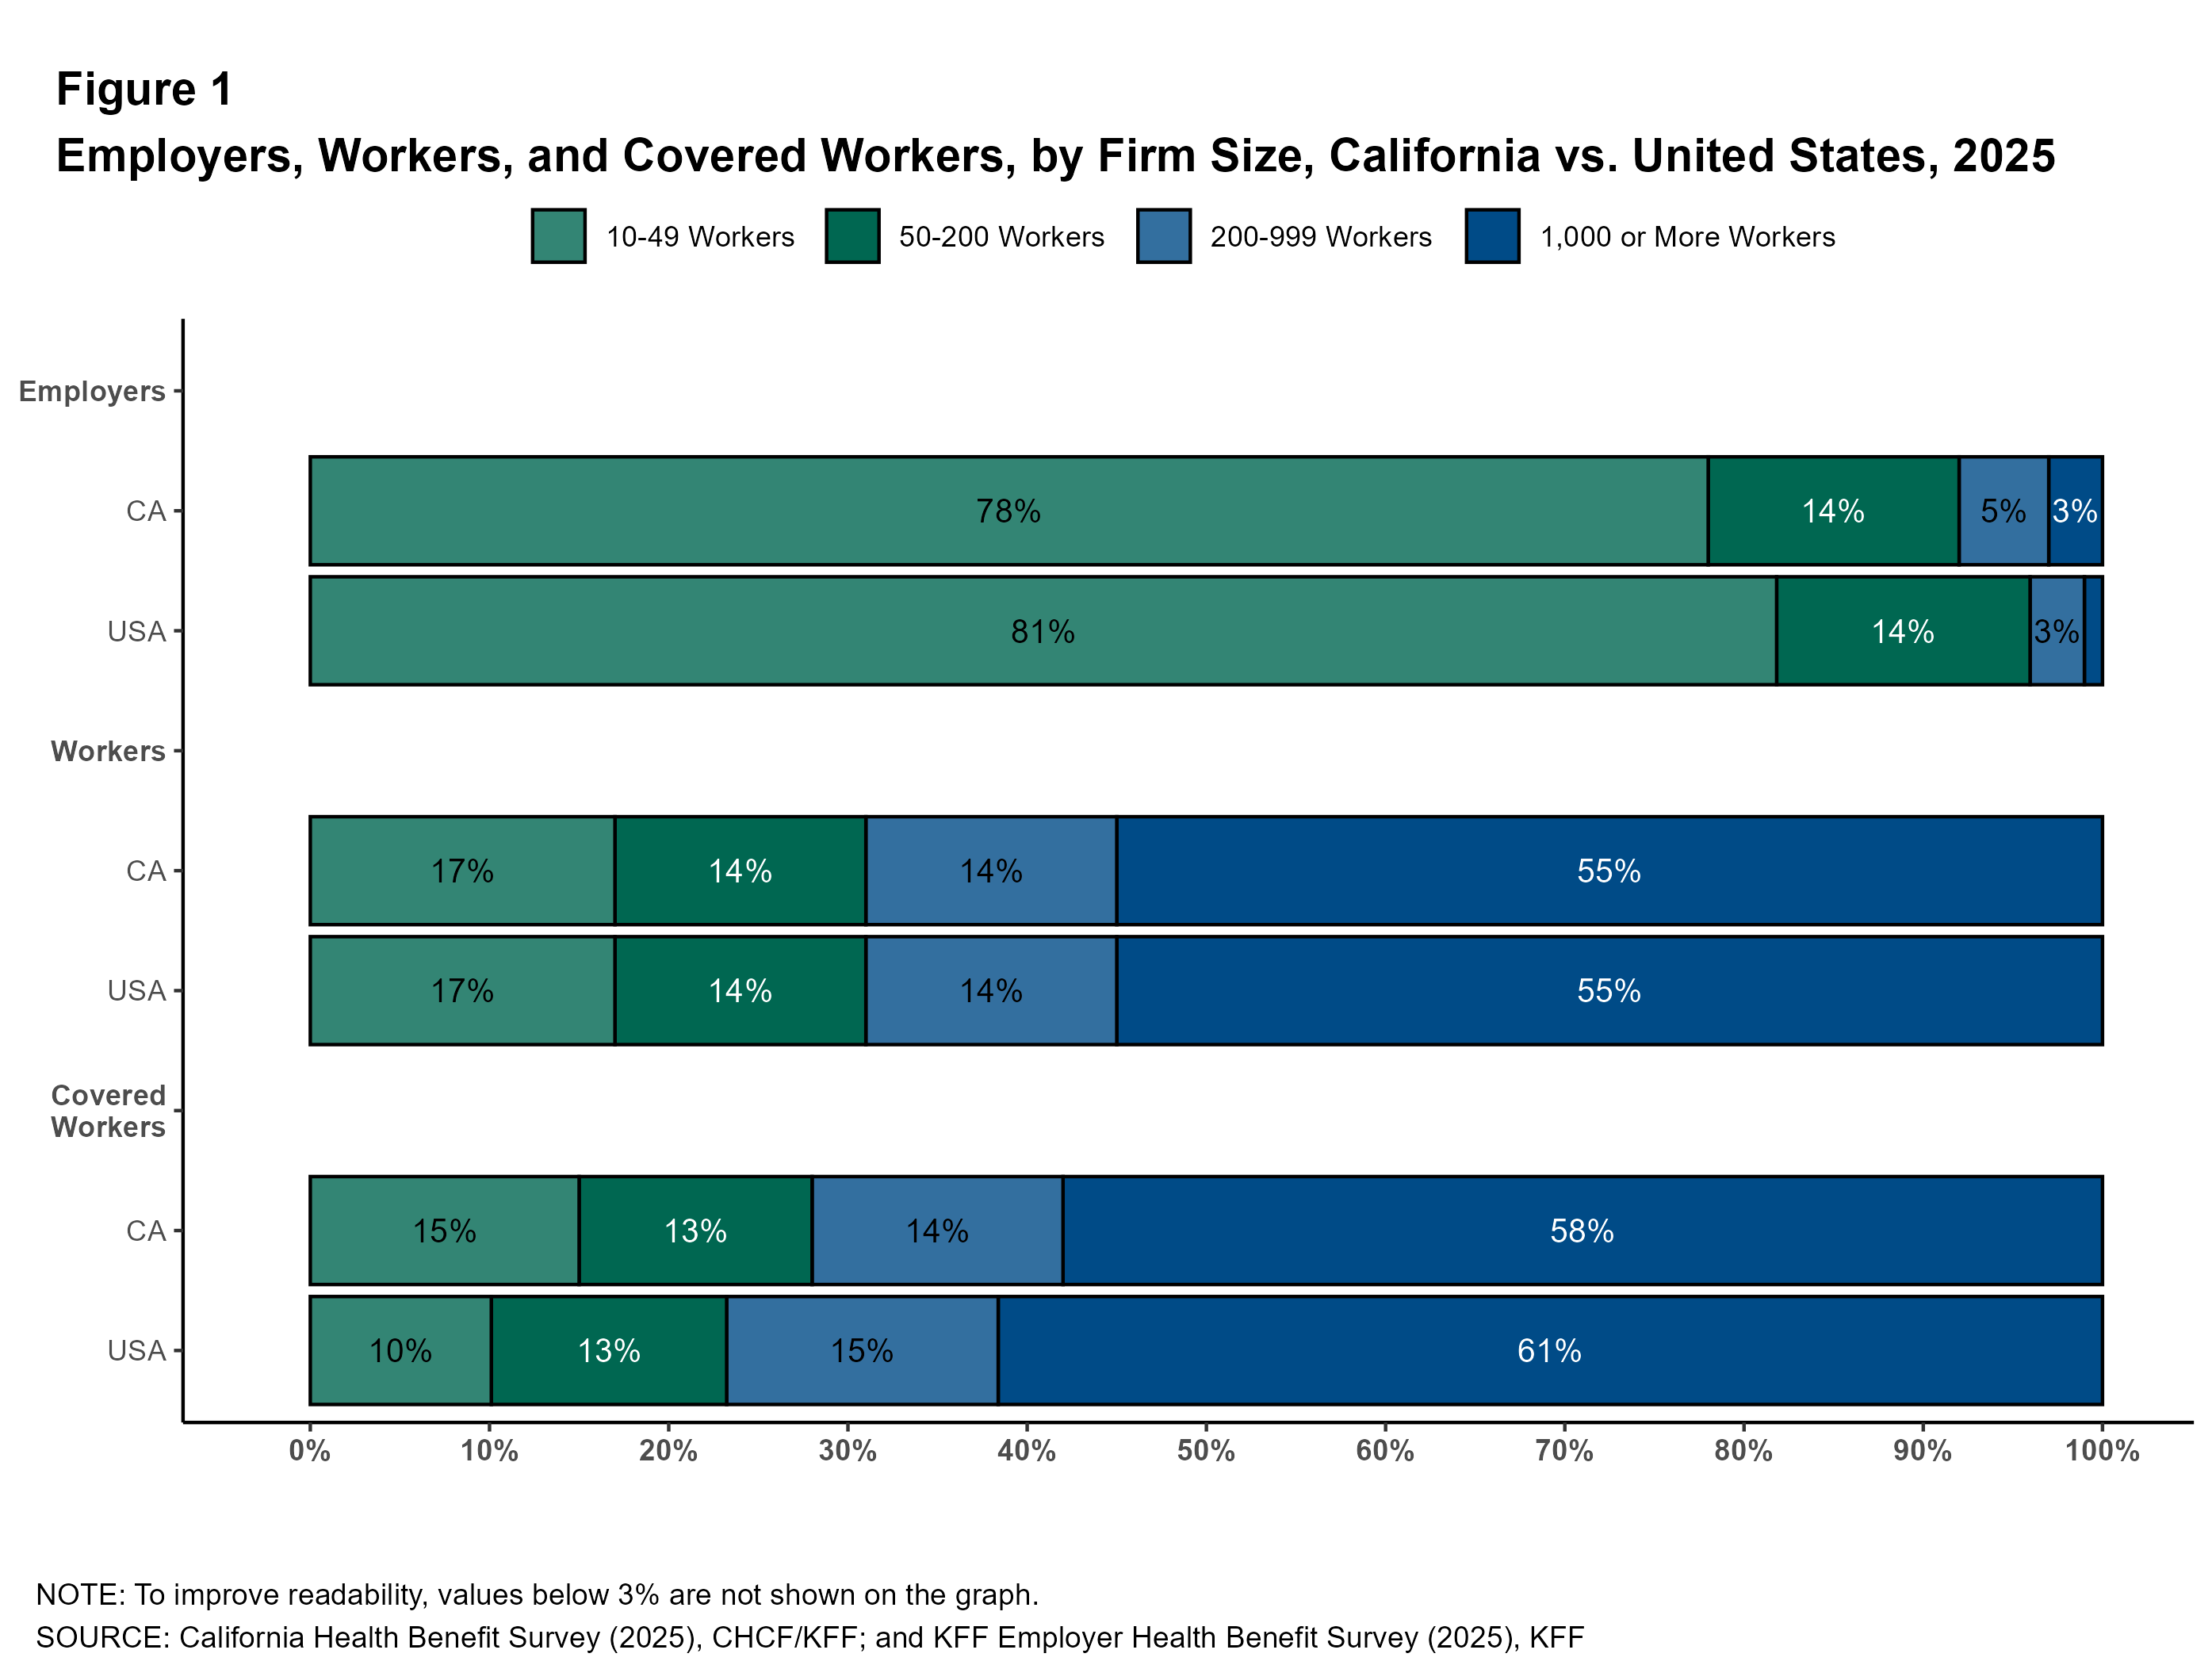
While 93% of all firms in California are small (10-199 employees), 72% of workers covered by health benefits are employed by large firms (200 or more employees). More than half of covered workers in California and nationally are employed by a firm with 1,000 or more workers (58% and 61%, respectively).
Premiums and Contributions
This survey asks employers about the cost of single coverage and coverage for a family of four for up to two of their largest plans.
Health Insurance Premiums
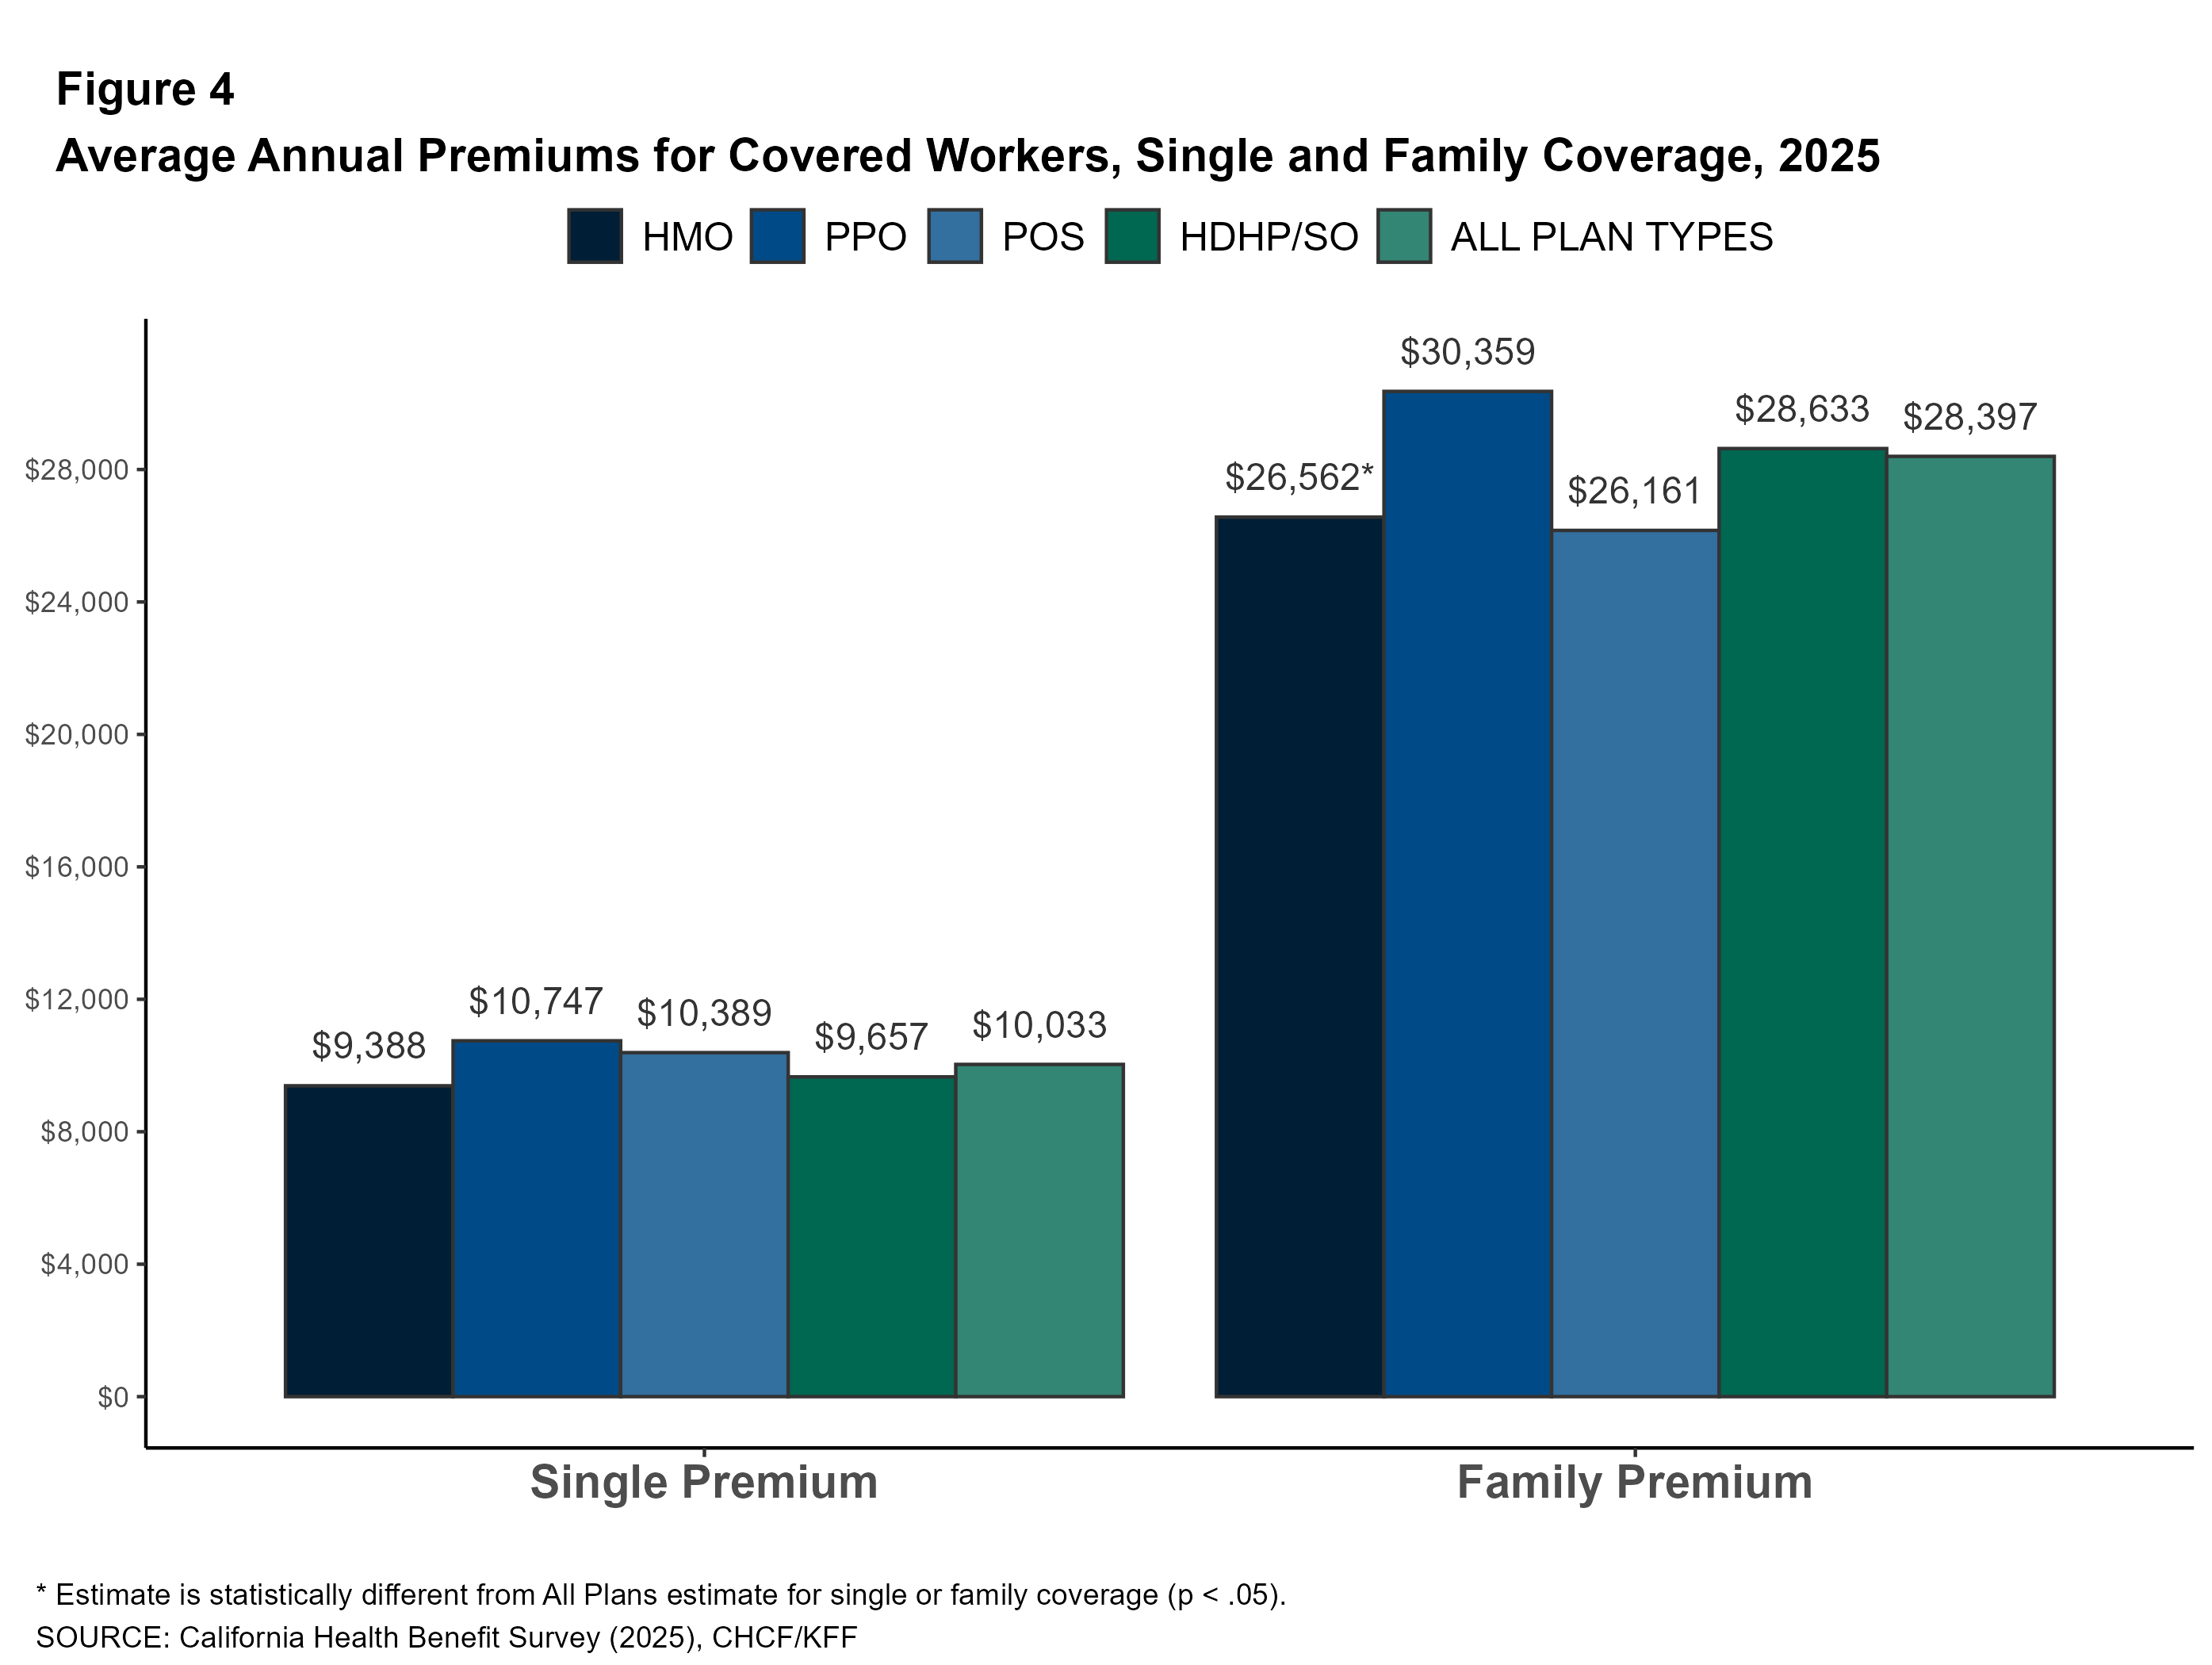
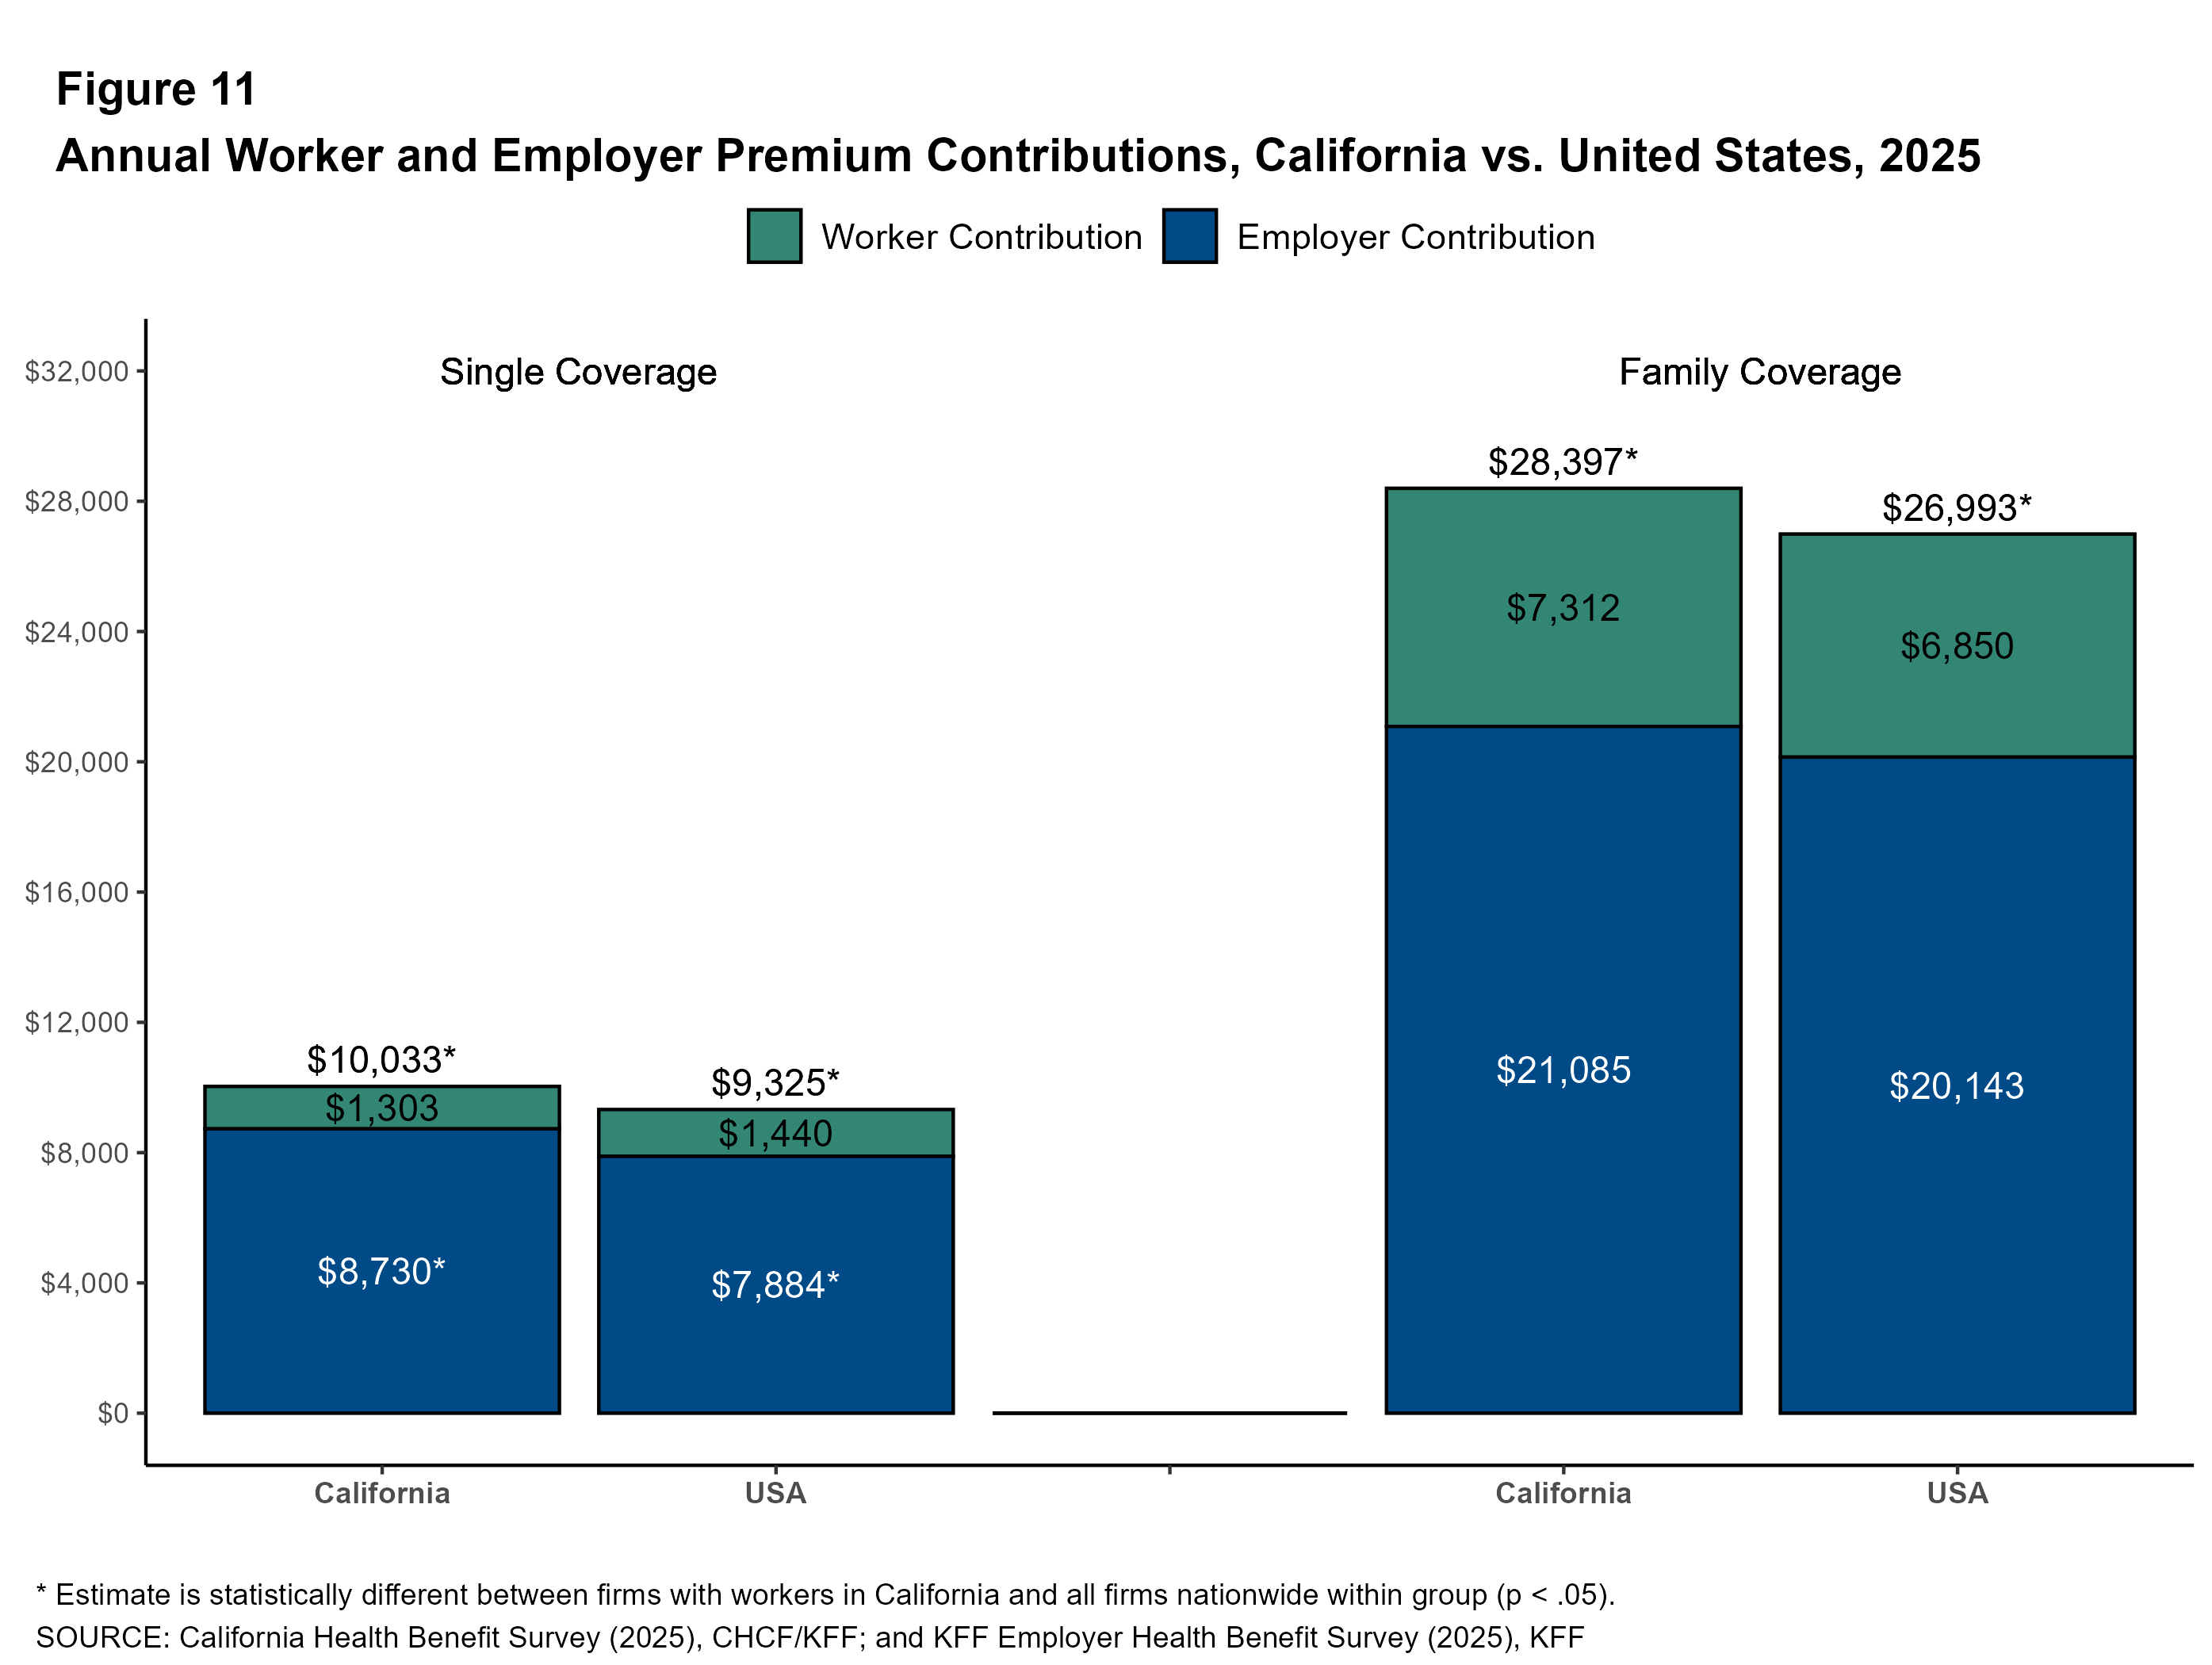
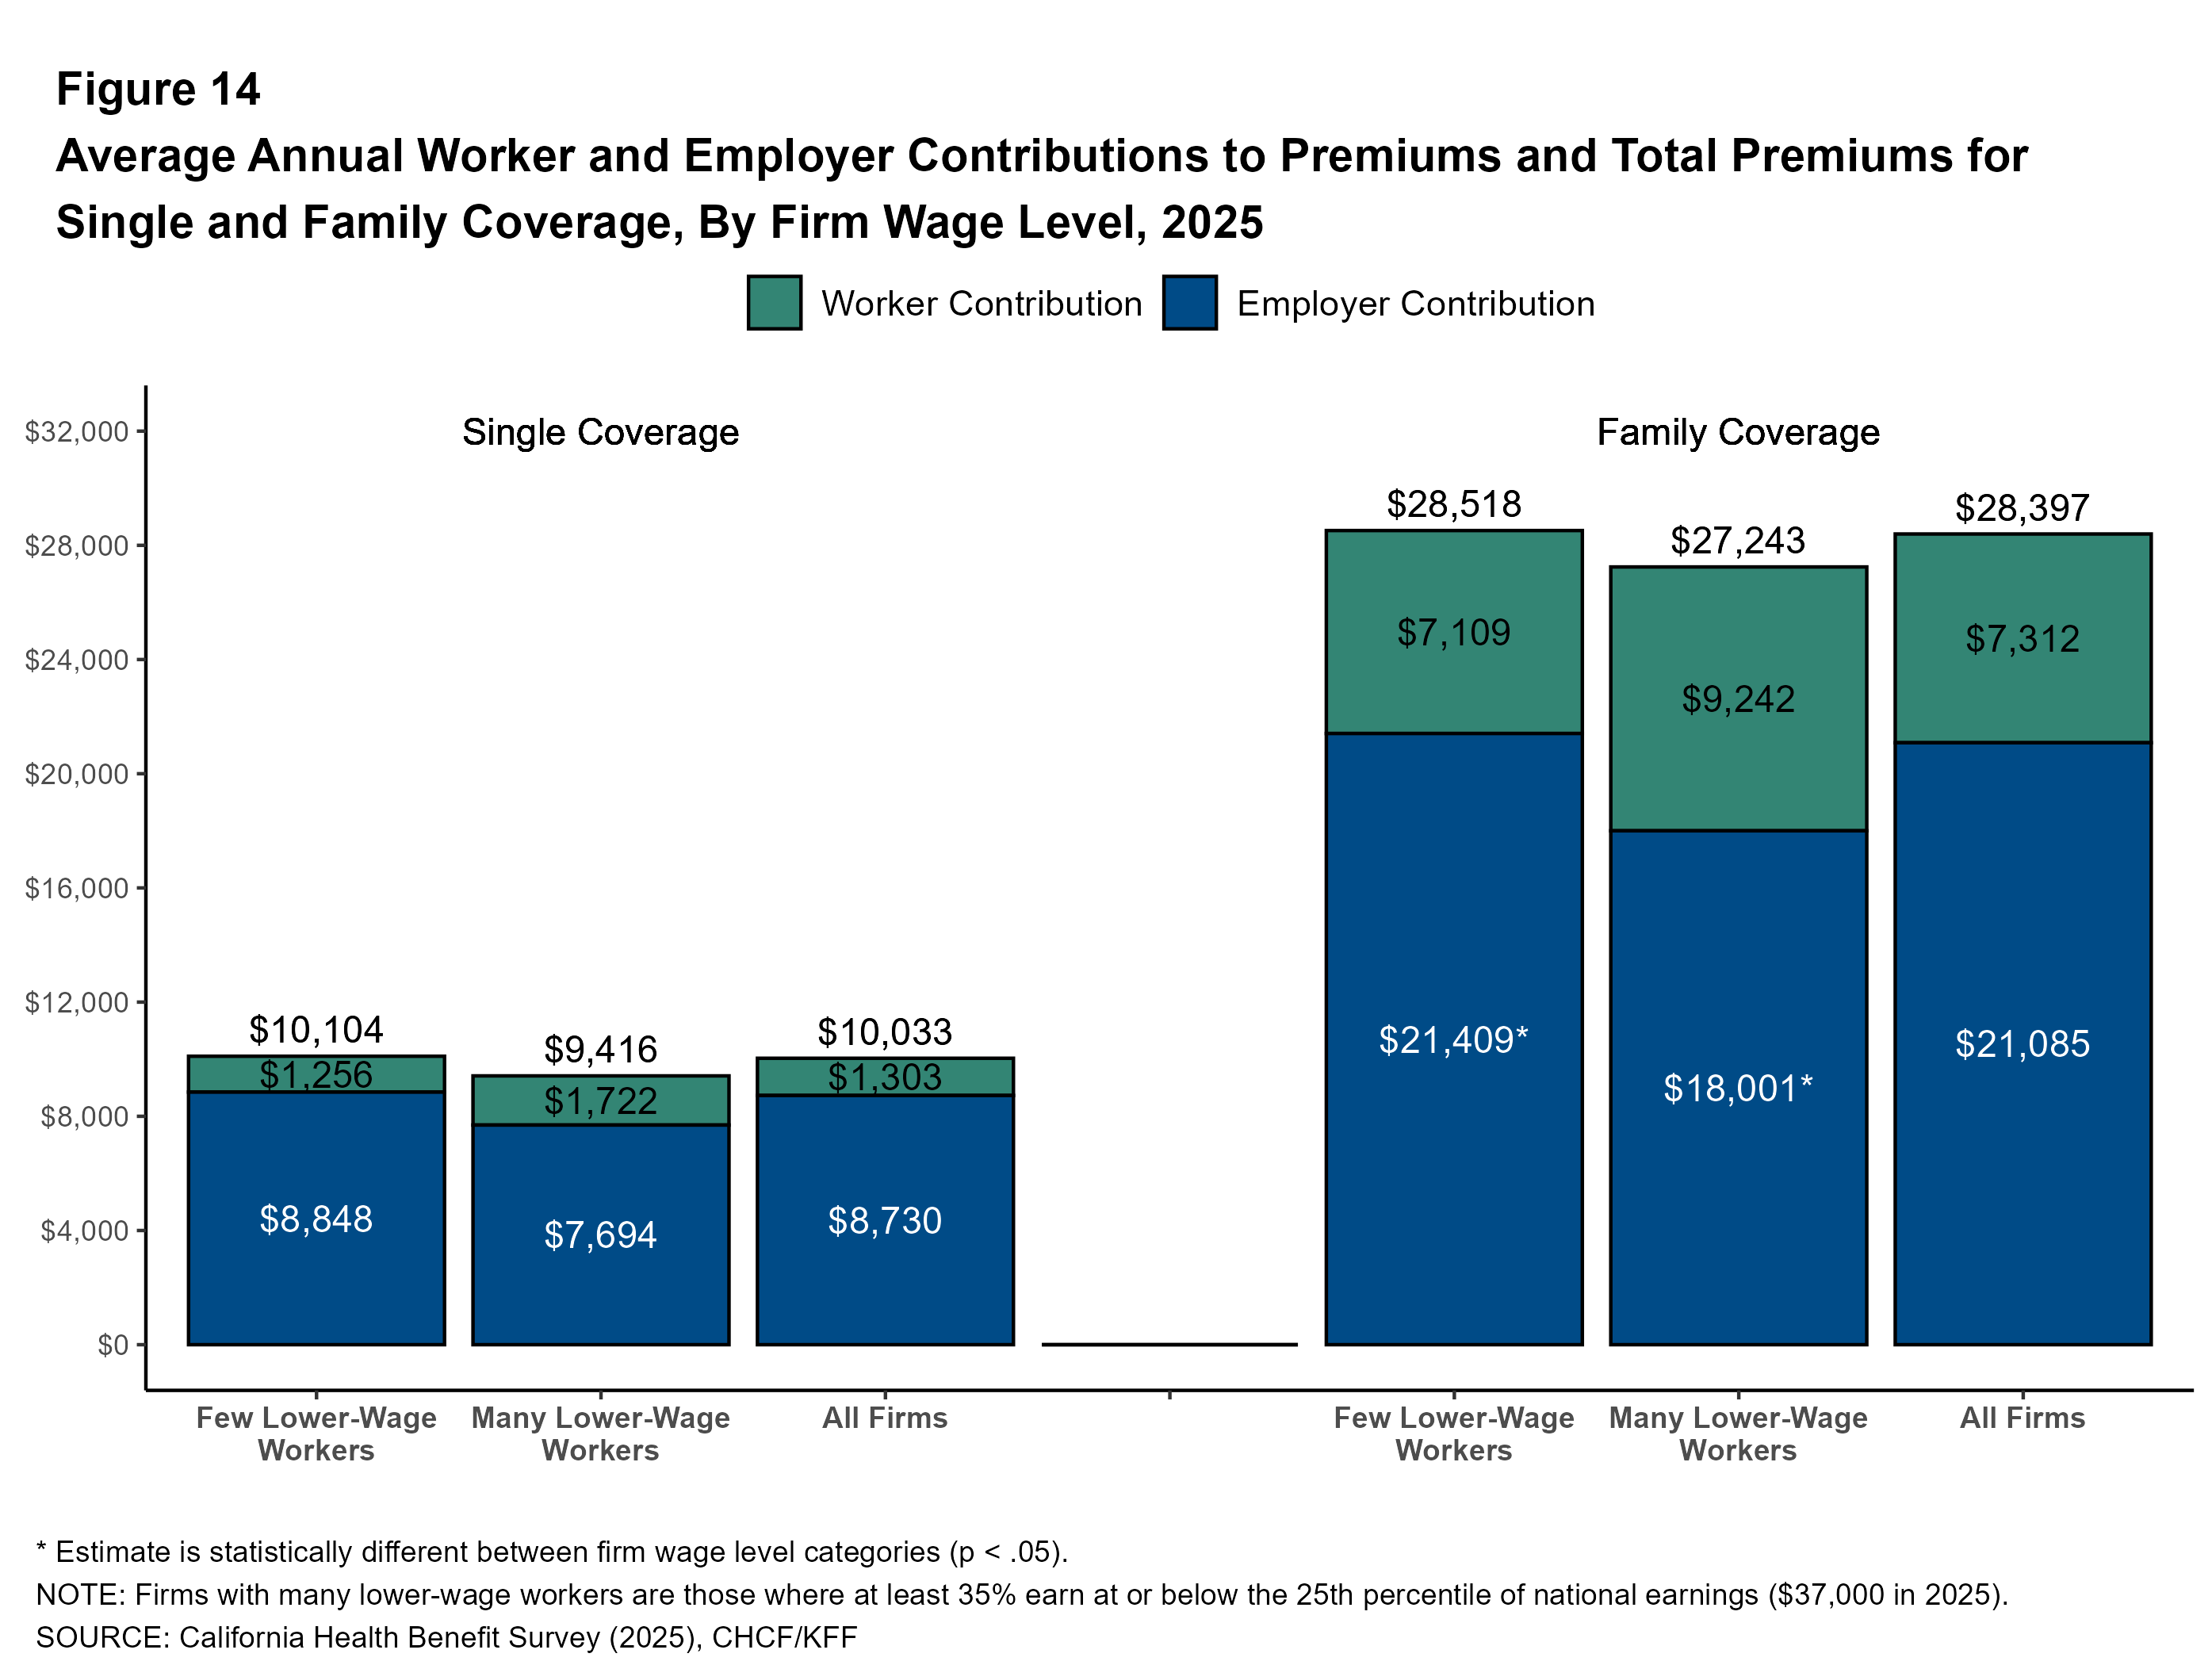
In 2025, the average premiums for covered workers in California are $10,033 for single coverage and $28,397 for family coverage. Premiums for covered workers in California are higher than for covered workers nationally for both single coverage ($10,033 vs. $9,325) and family coverage ($28,397 vs. $26,993).
Plan Type: Premiums vary by plan type. The average annual family premium for covered workers in HMOs is lower than the overall average ($26,562 vs. $28,397). Average premiums for covered workers in HDHP/SOs, including HSA-qualified plans, are similar to the overall average for both single and family coverage.
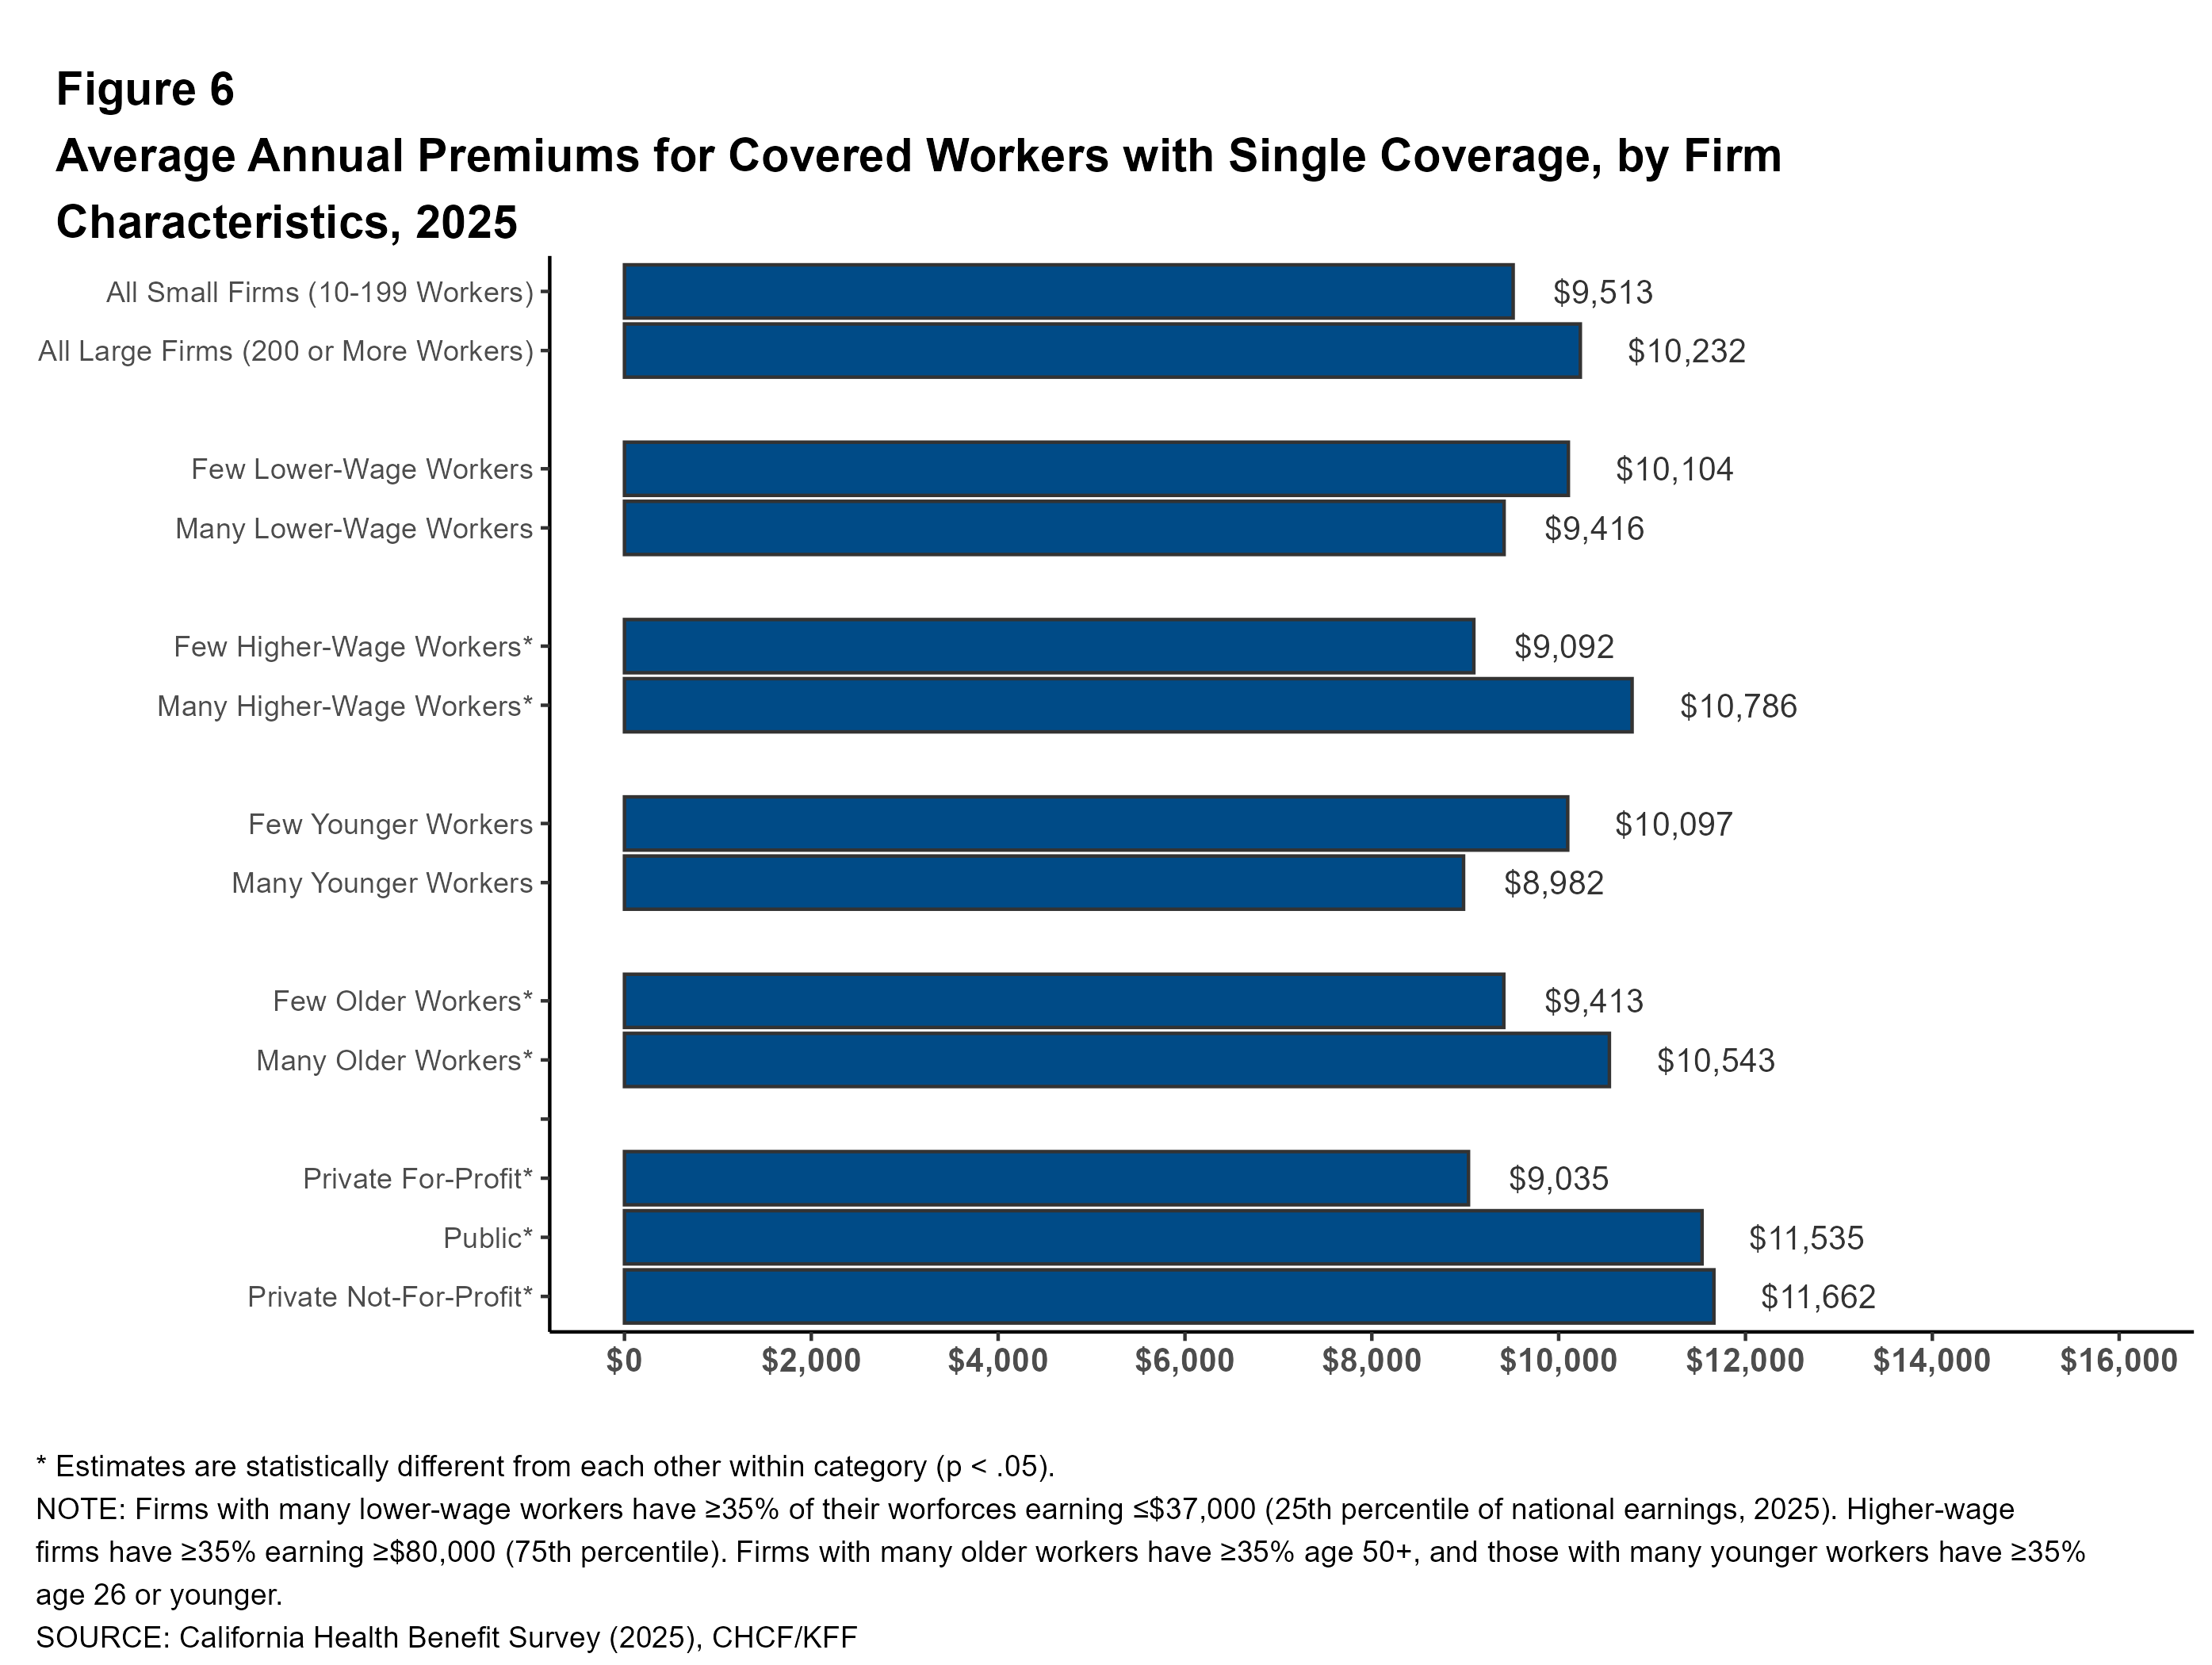
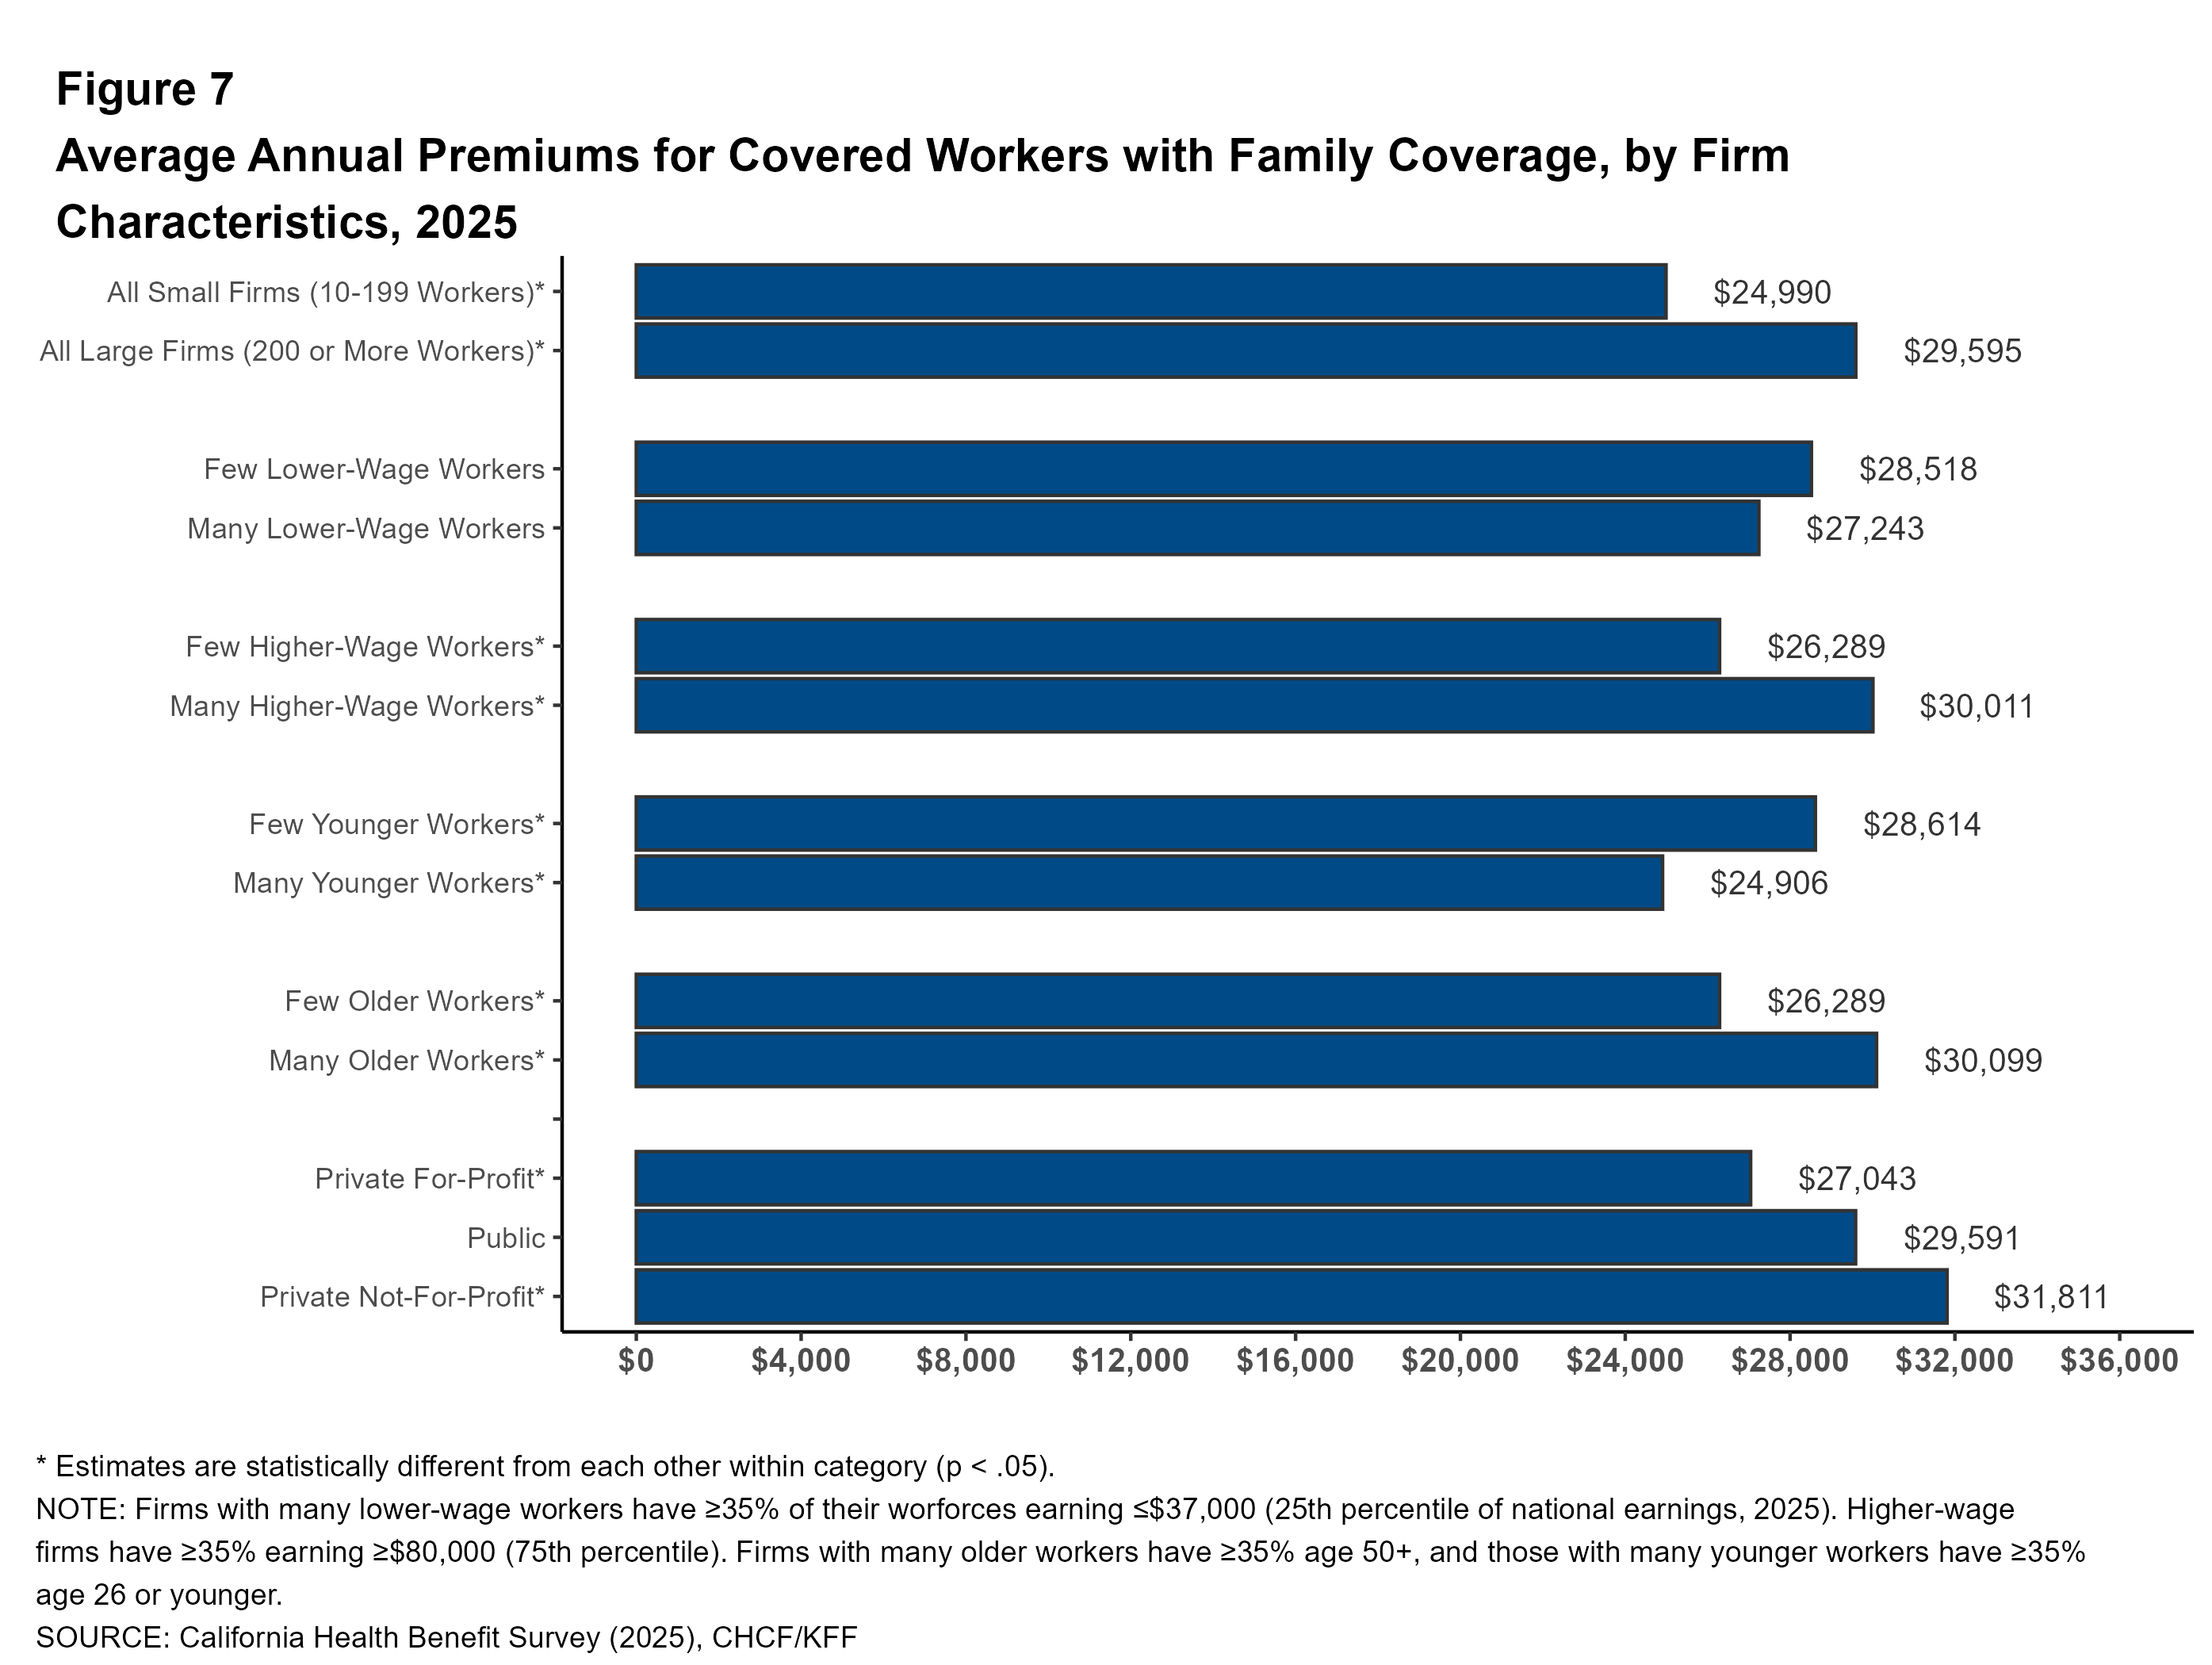
Firm Size: The average annual premium for family coverage is lower for covered workers at firms with 10 to 199 workers than for covered workers at larger firms ($24,990 vs. $29,595).
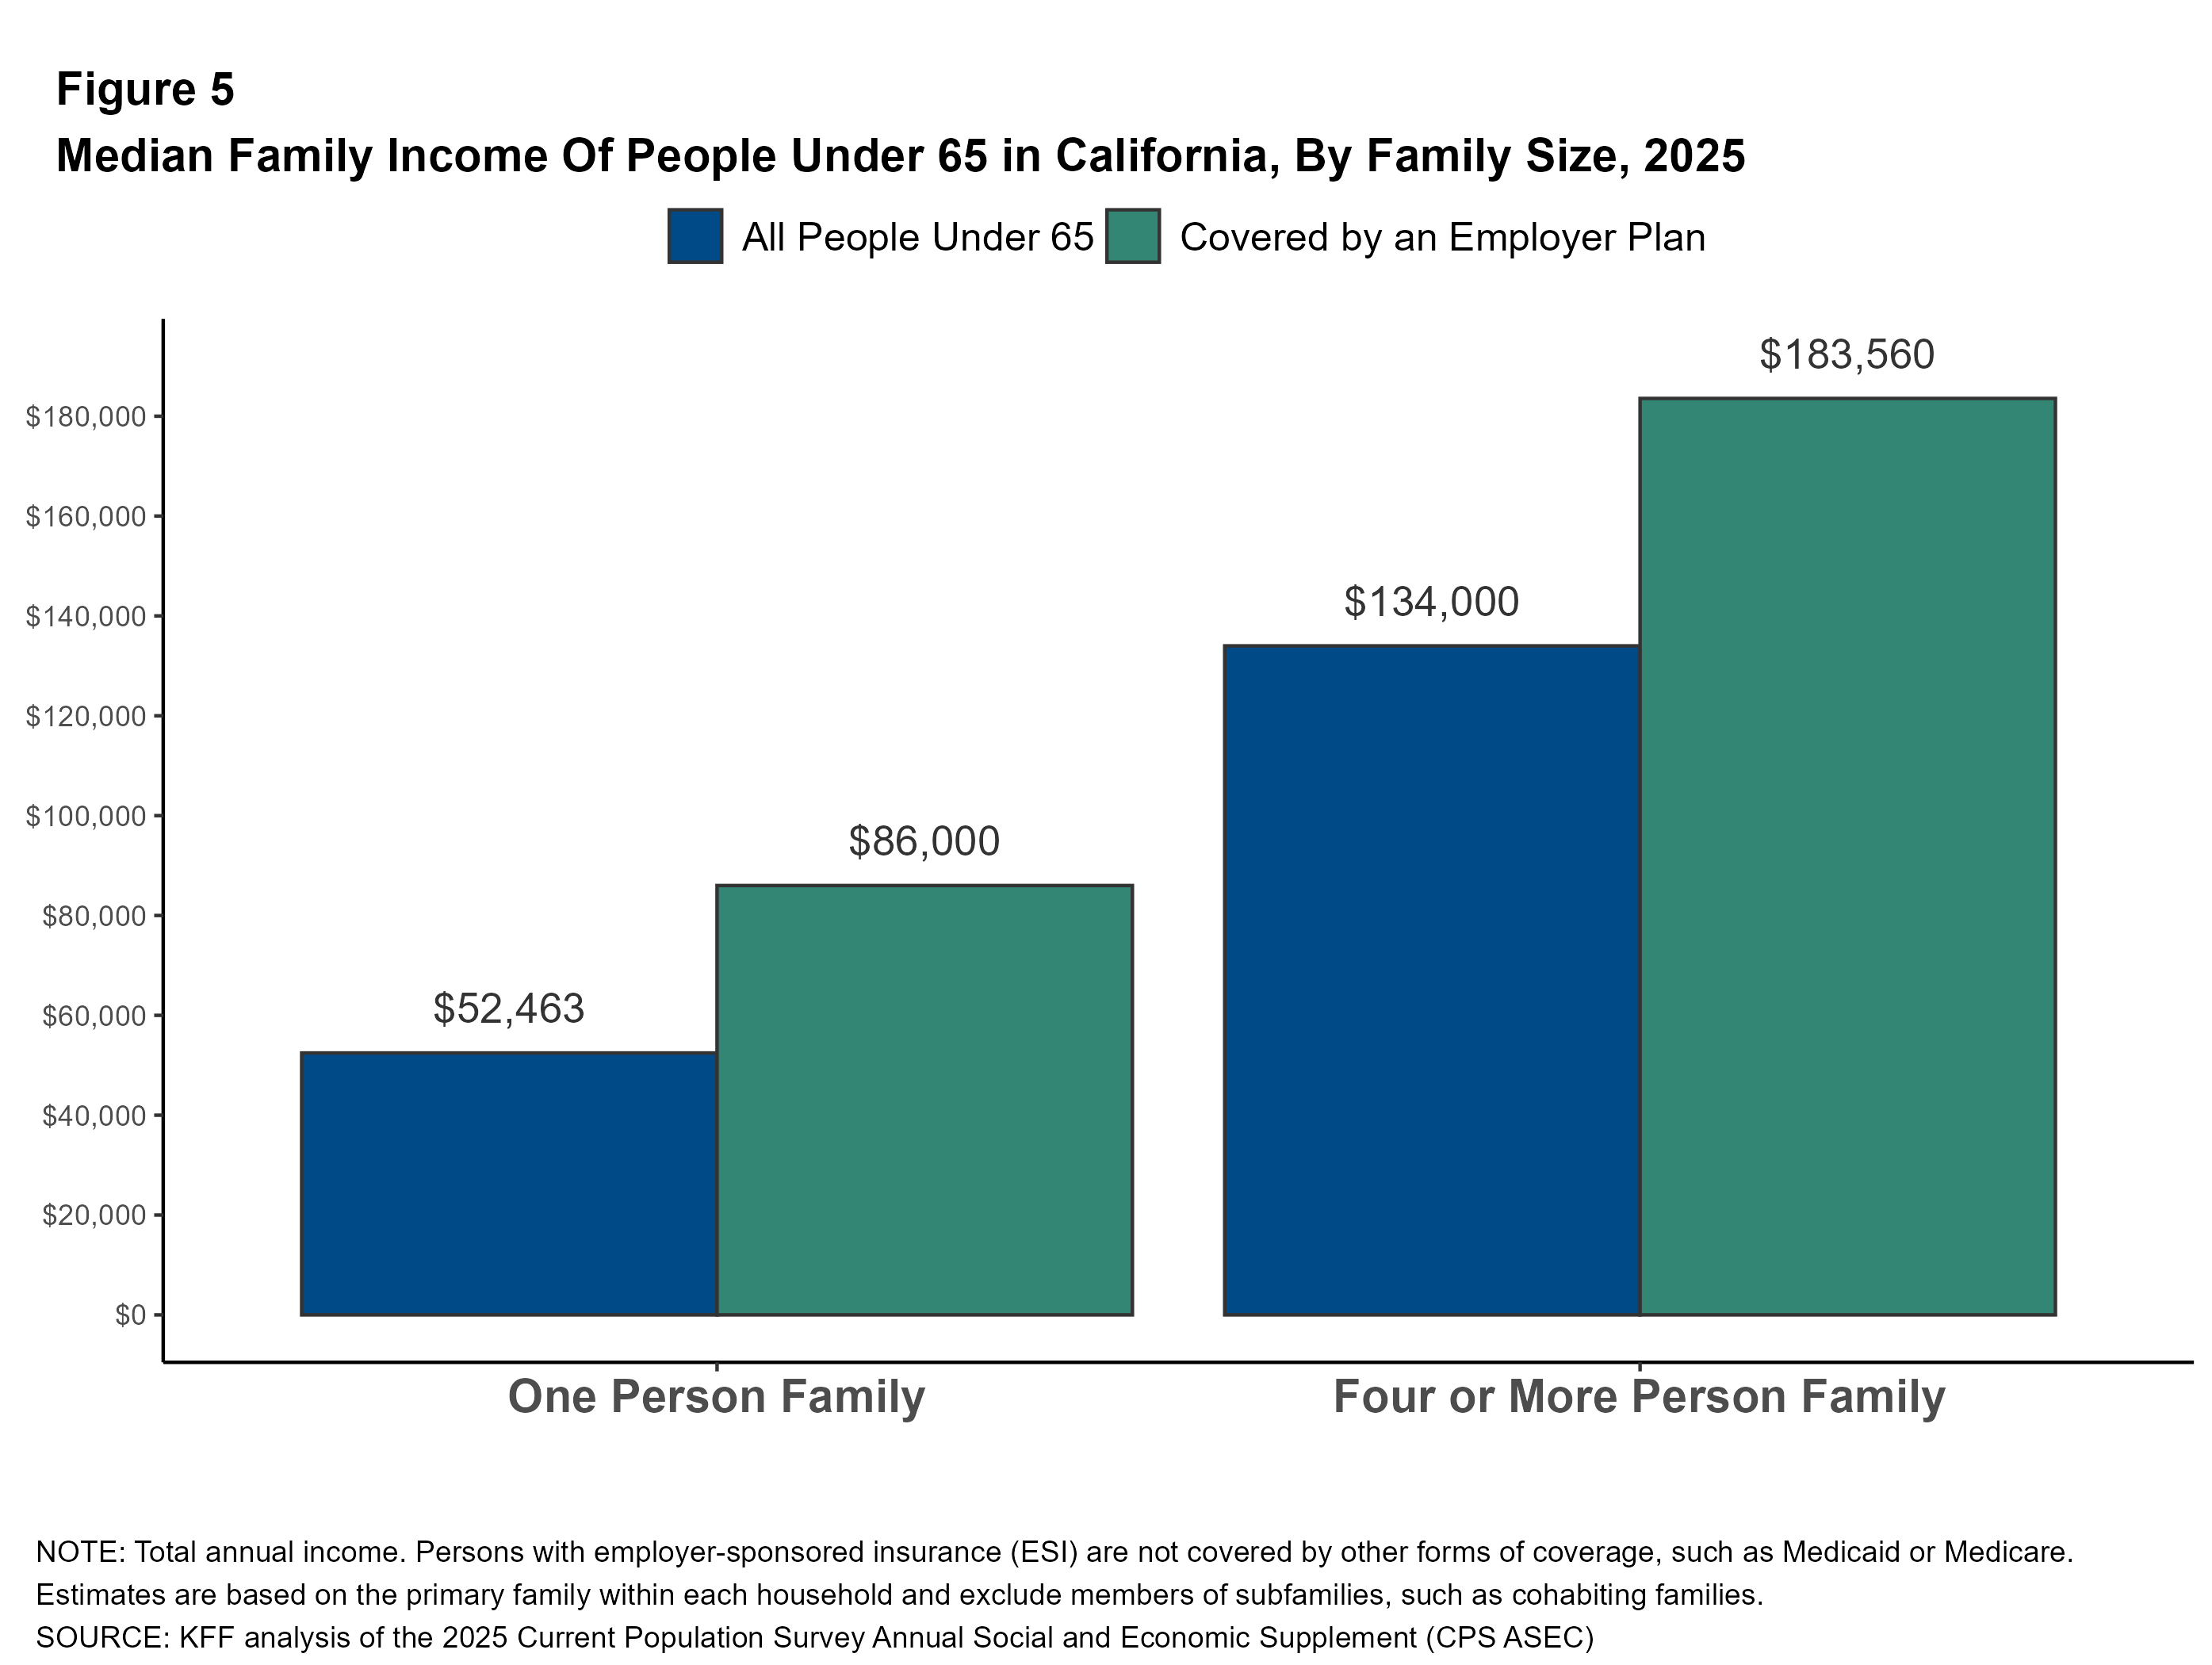
These premium amounts can be compared to the income of people with job-based coverage. In California, non-elderly individuals with employer-sponsored insurance who live alone have a median income of $86,000. Among families of four with employer-sponsored insurance, the median income is $183,560. Among all families of four, including those not enrolled in an employer plan, the median family income is $134,000.


Firm Characteristics: Premiums vary by the age of the firm’s workforce.
- In California, the average premiums for covered workers at firms with large shares of younger workers (firms where at least 35% of the workers are age 26 or younger) are lower than the average premiums for covered workers at firms with smaller shares of younger workers for family coverage ($24,906 vs. $28,614).
- In California, the average premiums for covered workers at firms with large shares of older workers (firms where at least 35% of the workers are age 50 or older) are higher than the average premiums for covered workers at firms with smaller shares of older workers for both single coverage ($10,543 vs. $9,413) and family coverage ($30,099 vs. $26,289).
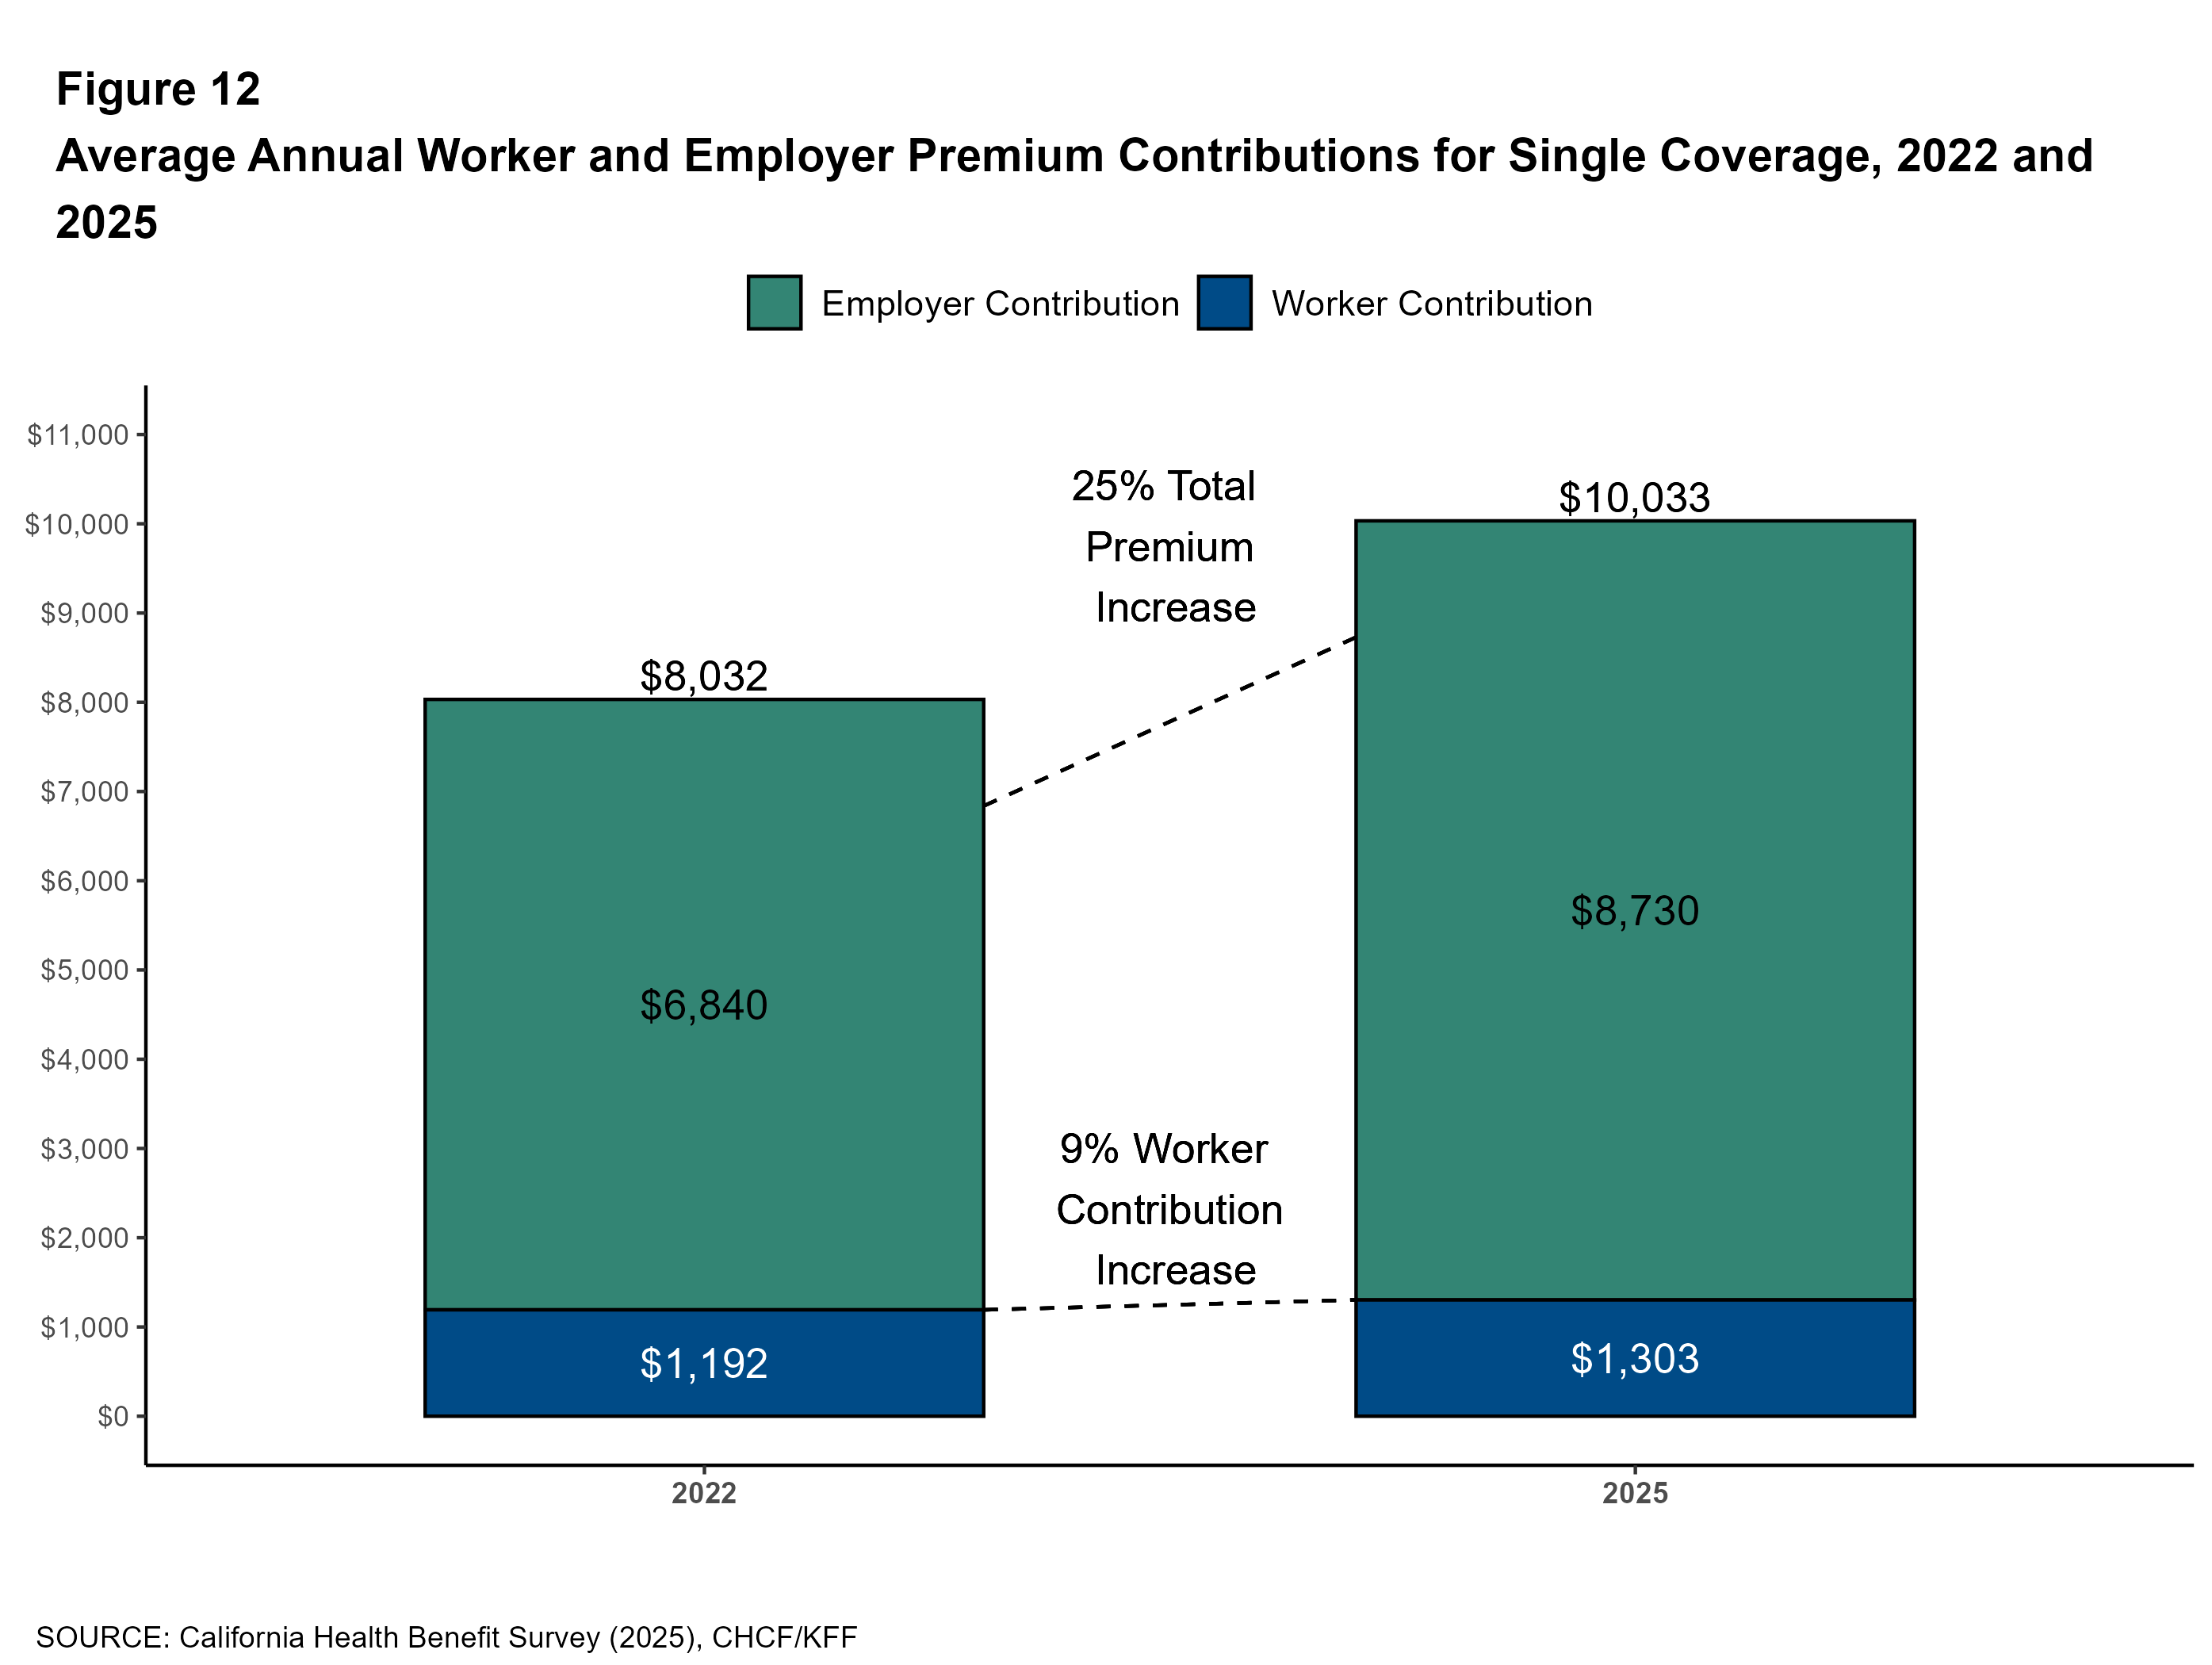
Premium Growth: Since 2022, family premiums have increased 7% annually in California, similar to the national overall increase of 6%. Premiums for single coverage increased 8% annually in California and 6% nationally. For comparison, the annual inflation rate over the period was 4% on average, and workers’ wages increased 5%. In the last year, there was an increase of 4% in workers’ wages, and inflation was 2.7%.
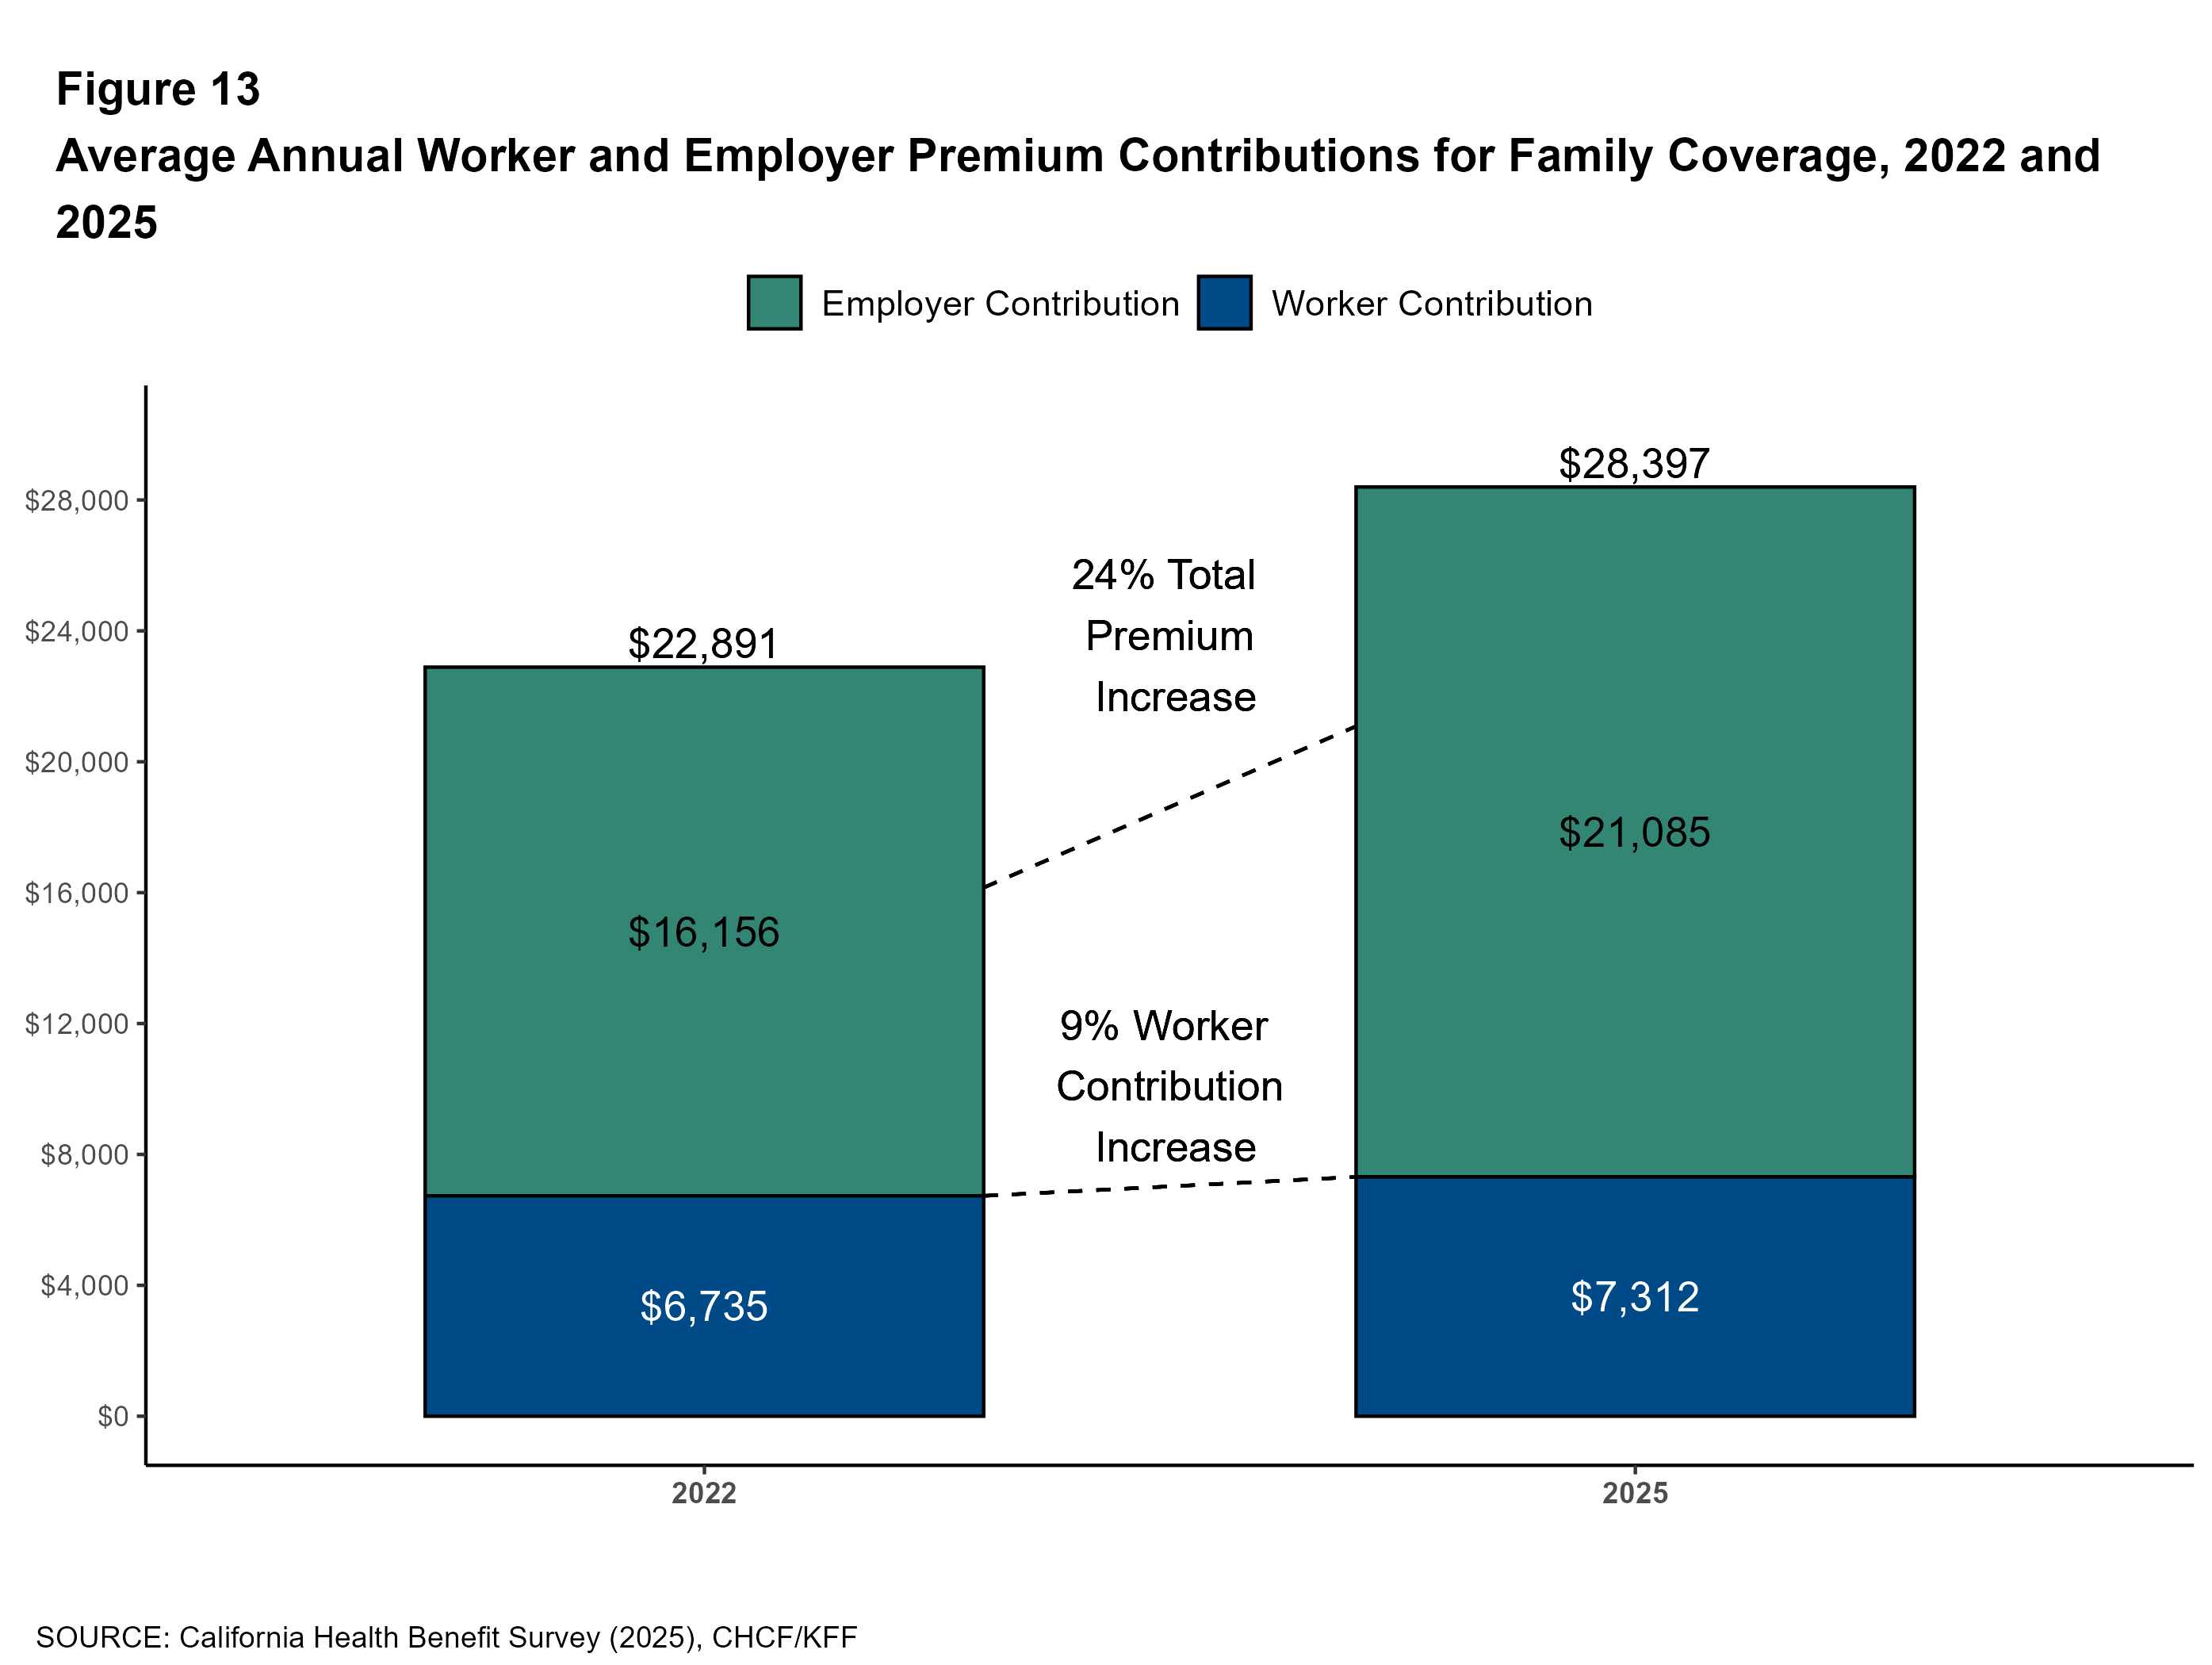
Since 2022, the average premium for family coverage has risen from $22,891 to $28,397, an increase of 24%, compared to inflation (12.2%) and wage growth (14.4%). In the years before the 2022 CHBS was fielded, the economy had experienced high general inflation. Since 2020, inflation has risen by 24%, much faster than the 10% increase between 2015 and 2020, or the 8% increase between 2010 and 2015.
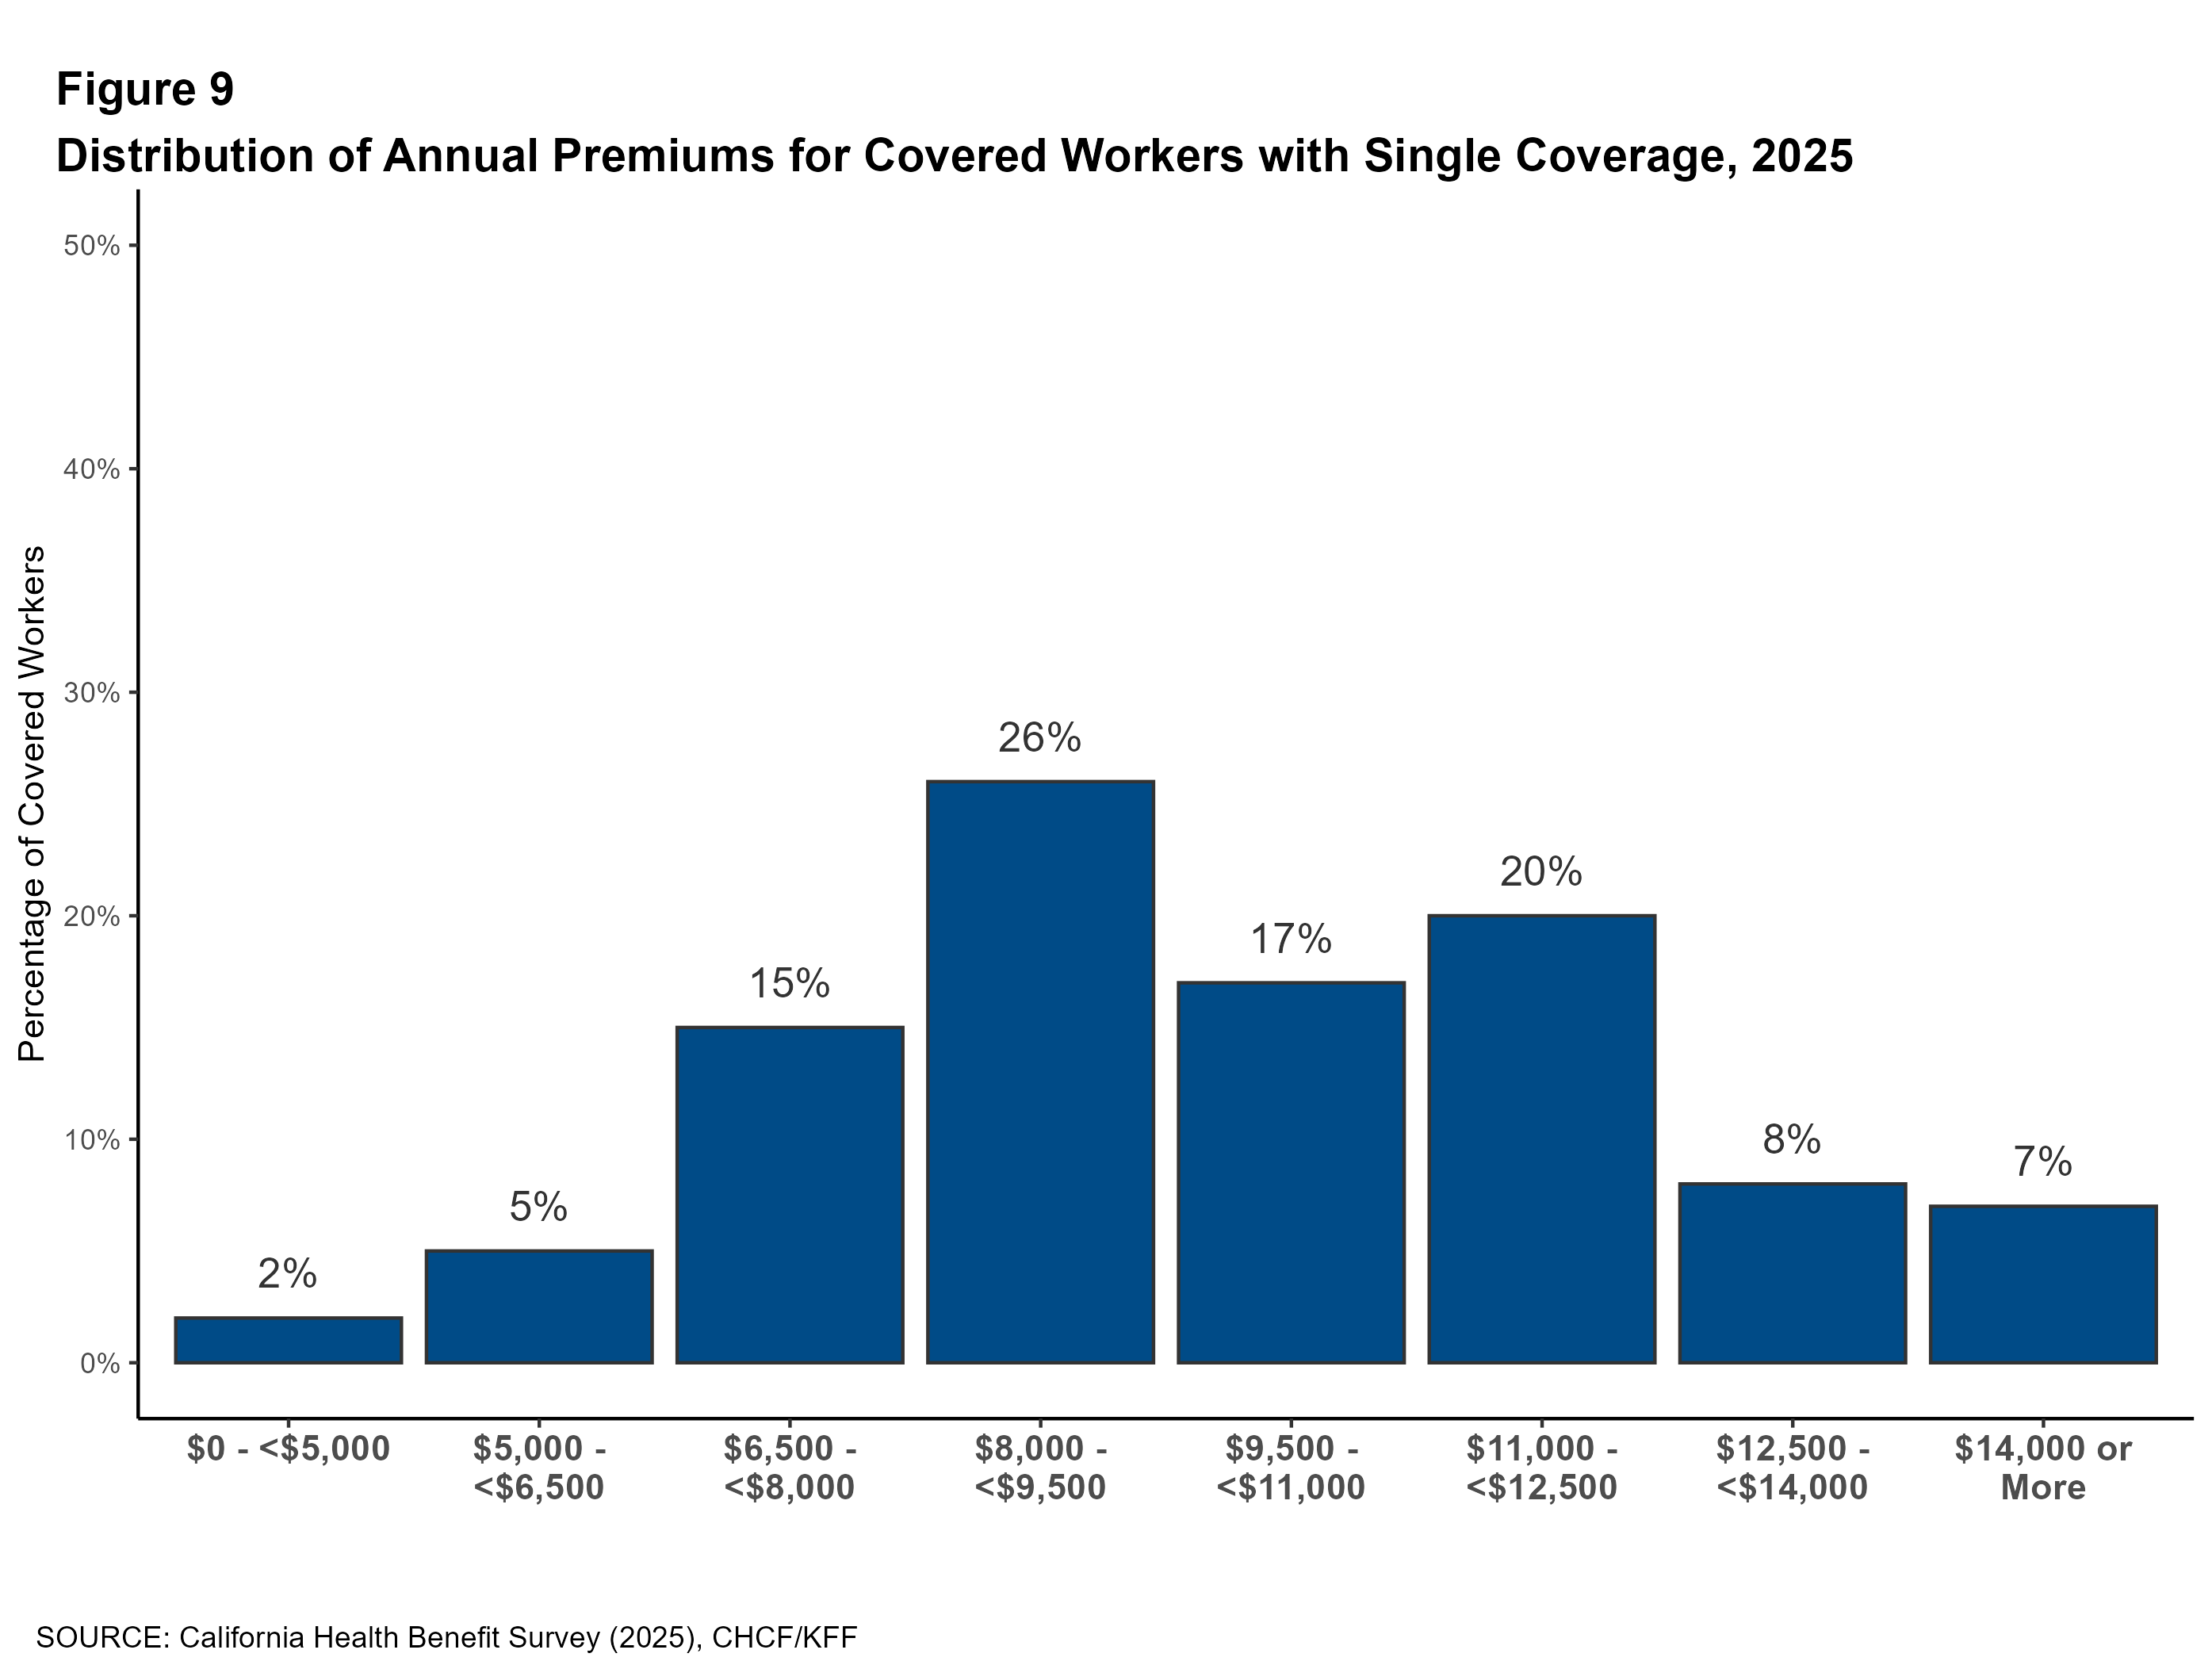
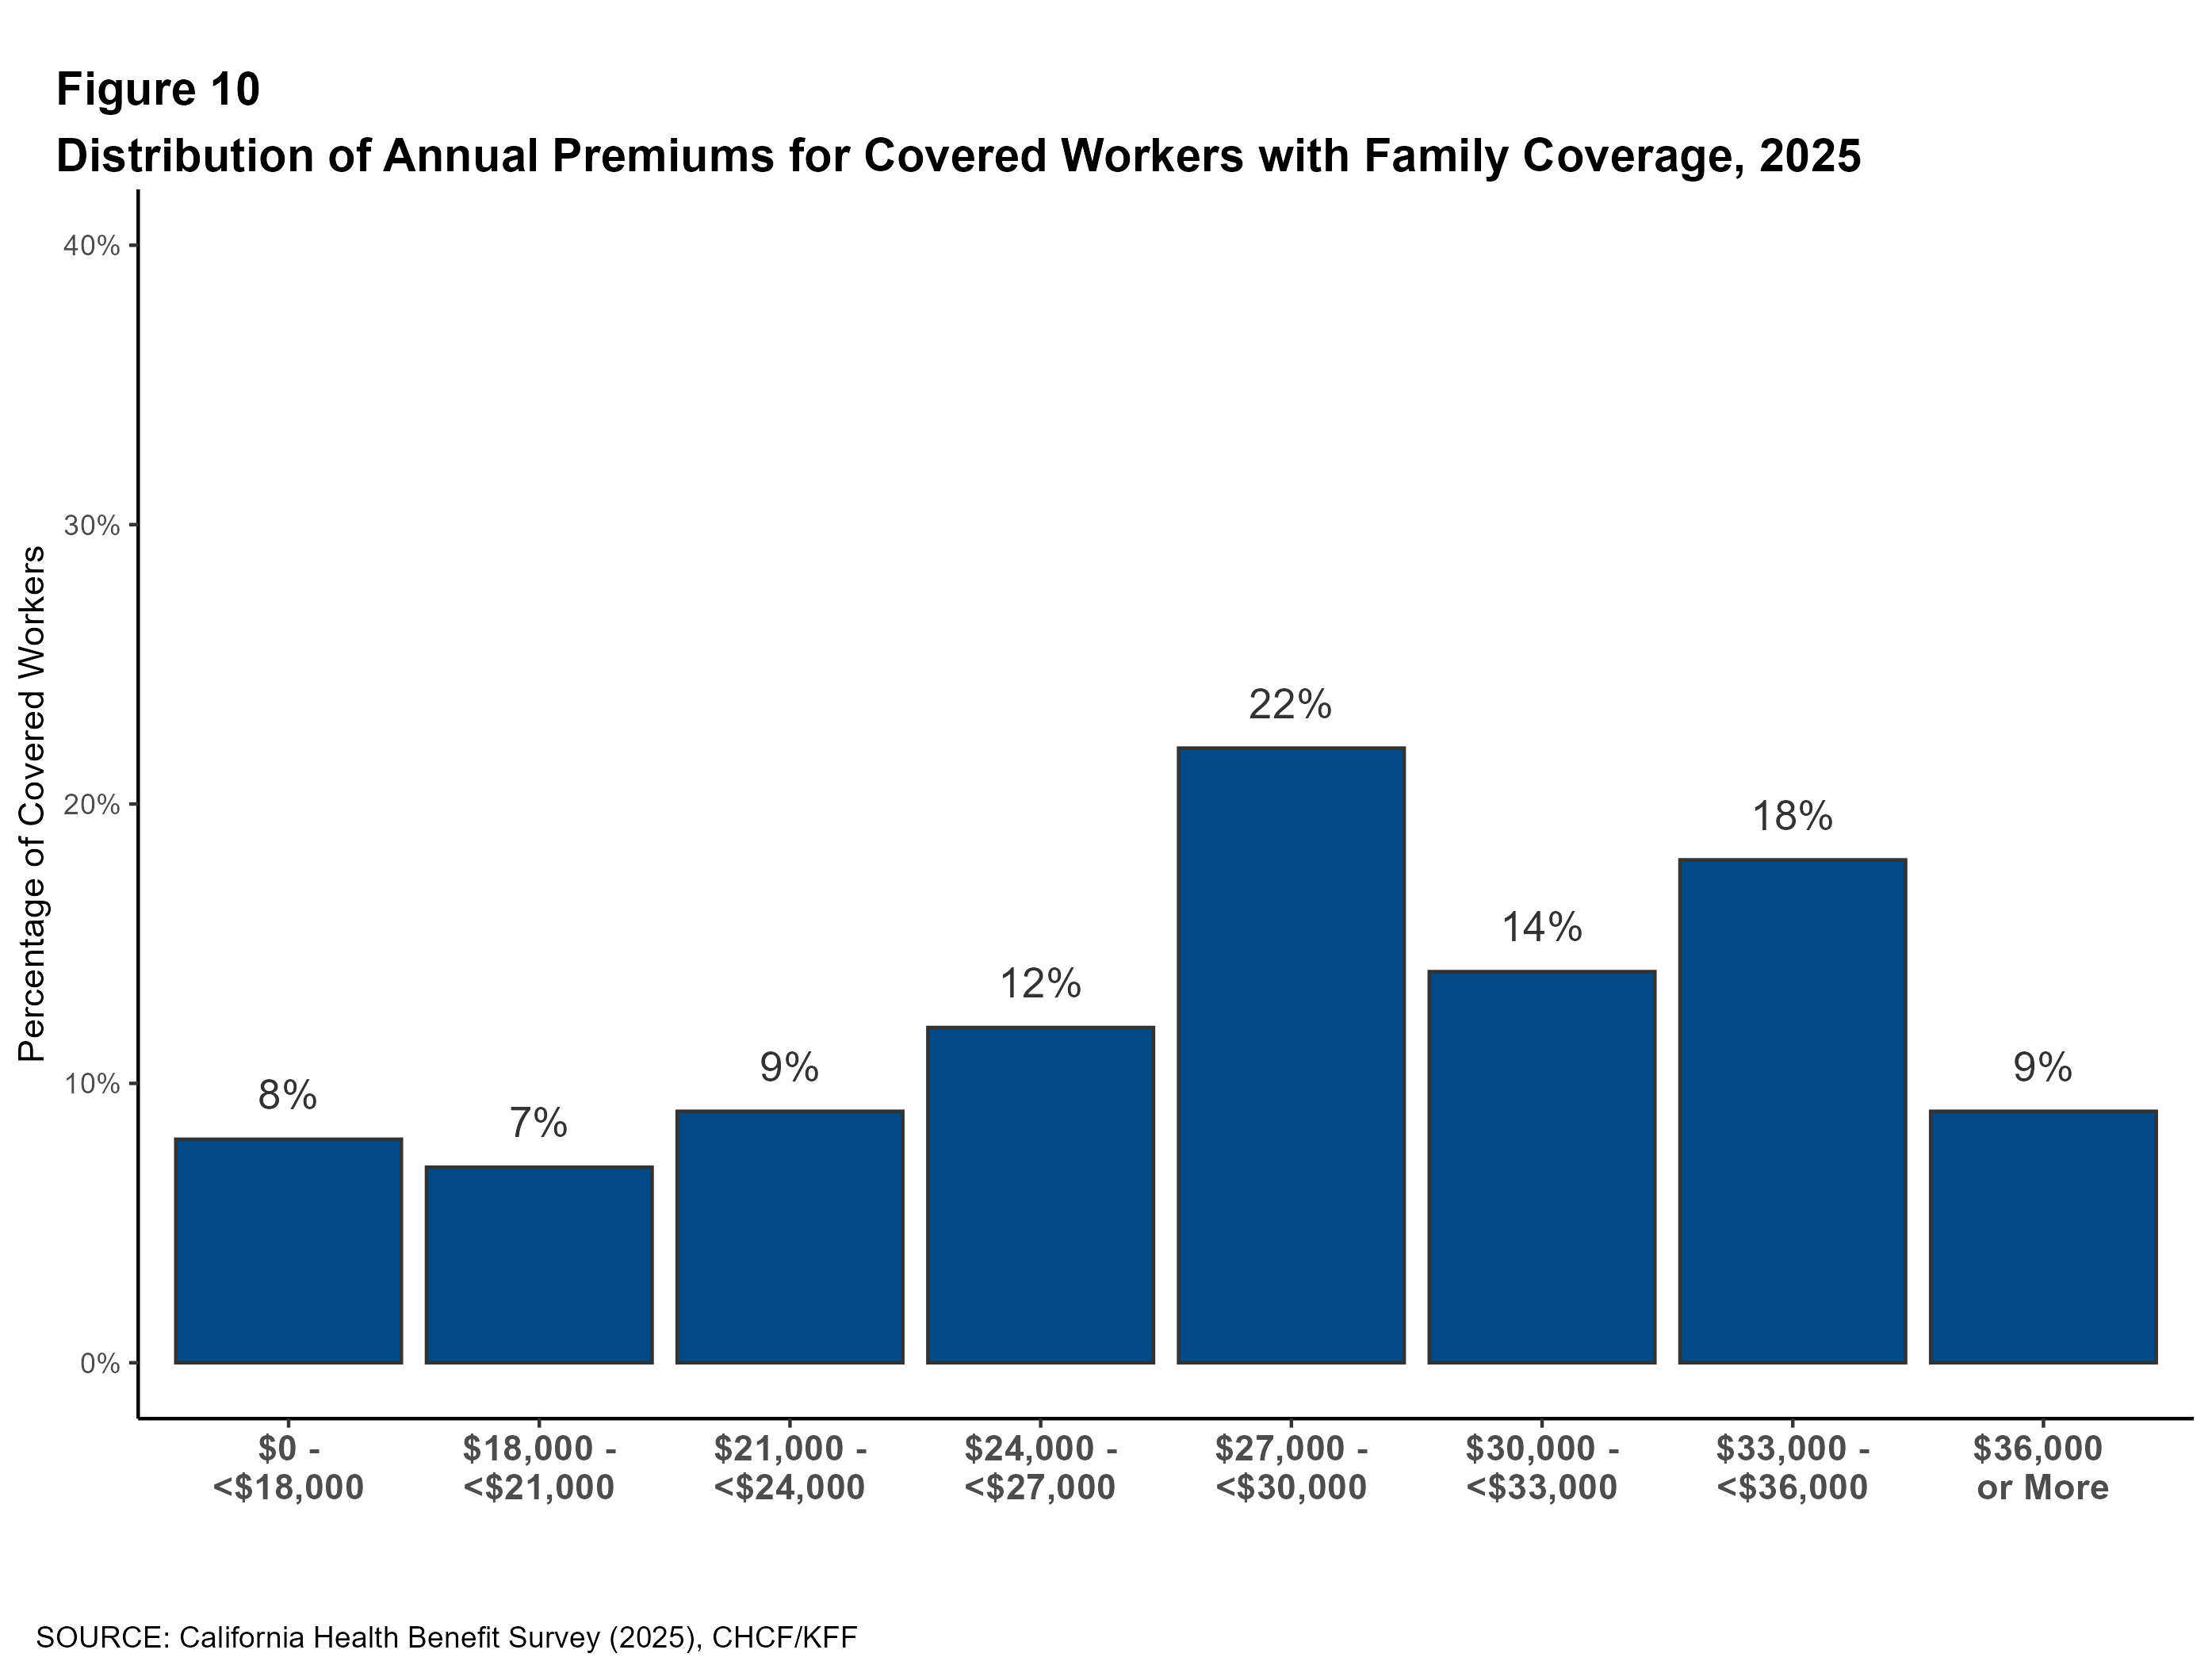
Distribution of Premiums: Premiums for family coverage in California vary considerably. Premiums are set based on a variety of factors, including the cost of providers in the network, the extent of covered benefits, the cost sharing structure, and the number of health services used by enrollees. Among California workers with single coverage, 15% are employed at a firm with an average annual premium of at least $12,500. Fifteen percent of covered workers are in a plan with a family premium of less than $21,000, while 27% are in a plan with a family premium of $33,000 or more.
Worker Contributions to the Premium
For many workers, health insurance is an important component of their total compensation. At the same time, most workers are required to contribute directly to the cost of their health insurance premiums, usually through payroll deductions. The average worker contribution for covered workers in California in 2025 is $1,303 for single coverage and $7,312 for family coverage. On average, covered workers in California contribute a similar amount to the national average to enroll in single or family coverage.
Employers contribute more to the cost of single coverage for covered workers in California than employers do nationally ($8,730 vs. $7,884).
Change Over Time: Compared to 2022, California covered workers contribute a similar amount to enroll in single coverage ($1,192 vs. $1,303) and family coverage ($6,735 vs. $7,312). Since 2022, the average contribution for family coverage in California has increased by about 9%, or roughly 3% per year, but this does not represent a statistically significant change.
Firm Size: In California, the average family coverage premium contribution for covered workers in smaller firms (10 to 199 workers) is much higher than the average for covered workers in larger firms ($9,980 vs. $6,374).
Firm Characteristics: In California, while the average premiums and worker contributions are similar between firms with a large share of lower-wage workers and those with fewer lower-wage workers, the average employer contribution differs. Firms with many lower-wage workers contribute less toward the cost of family coverage ($21,409 vs. $18,001).
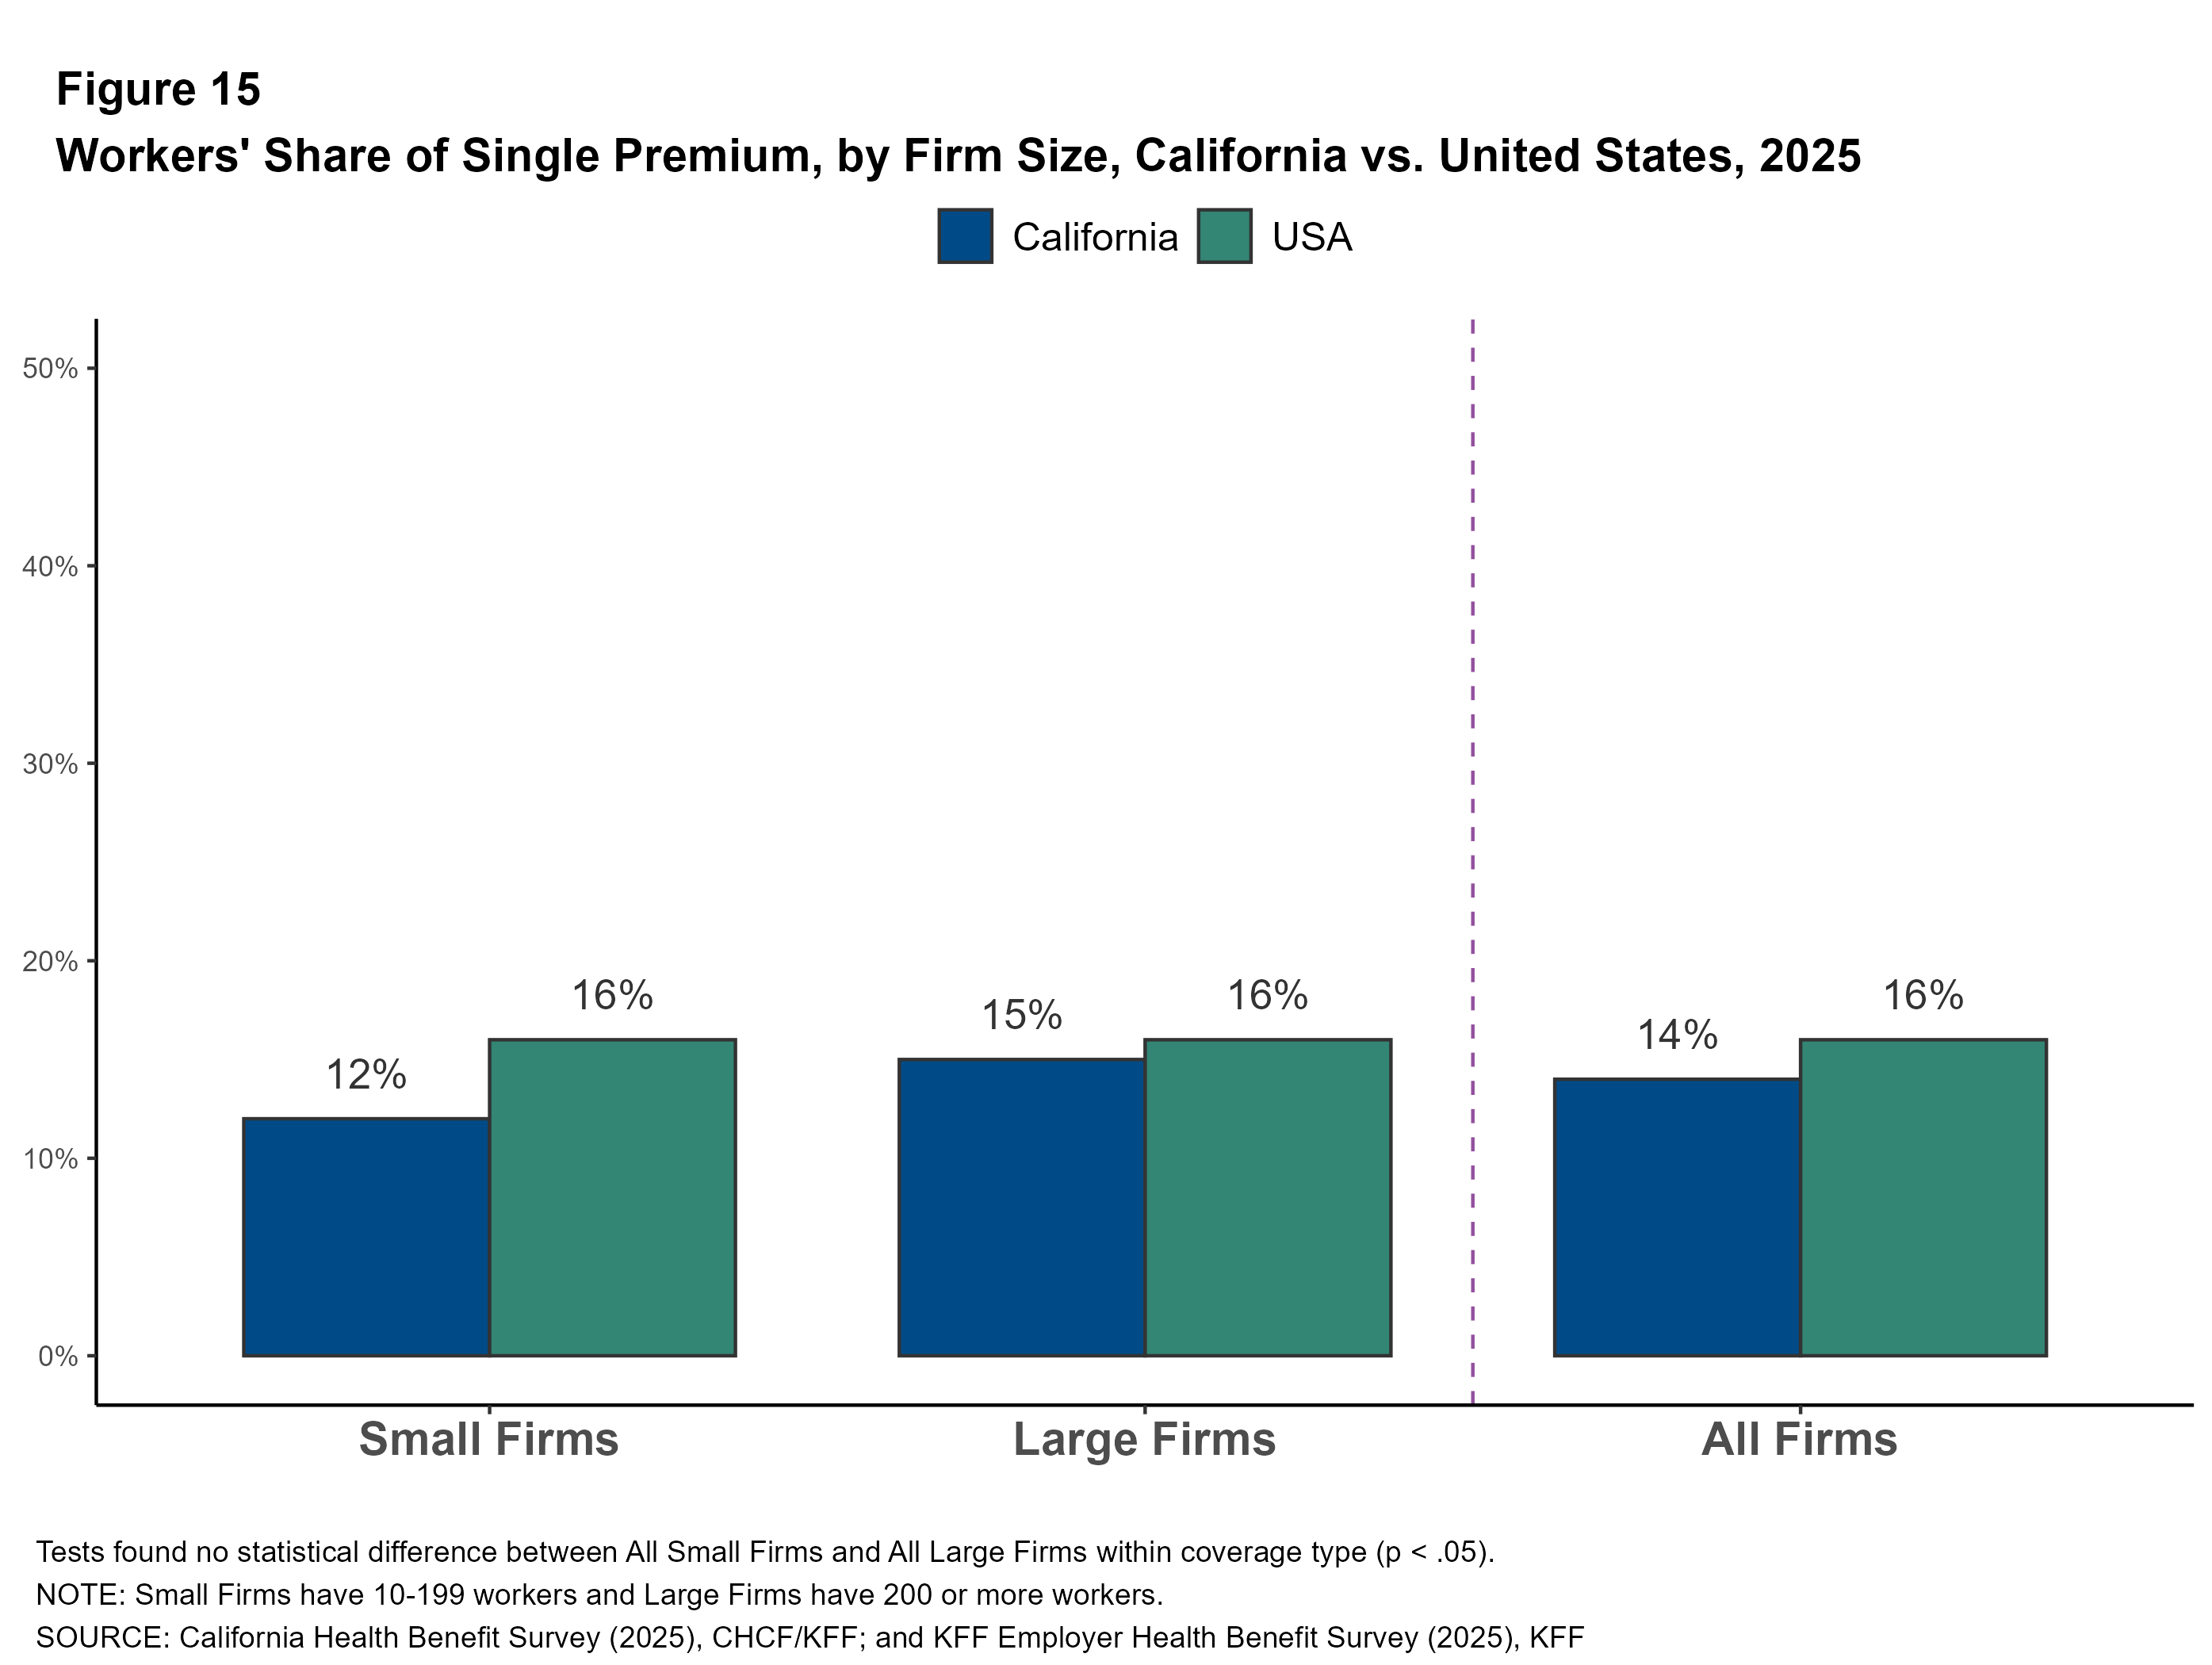
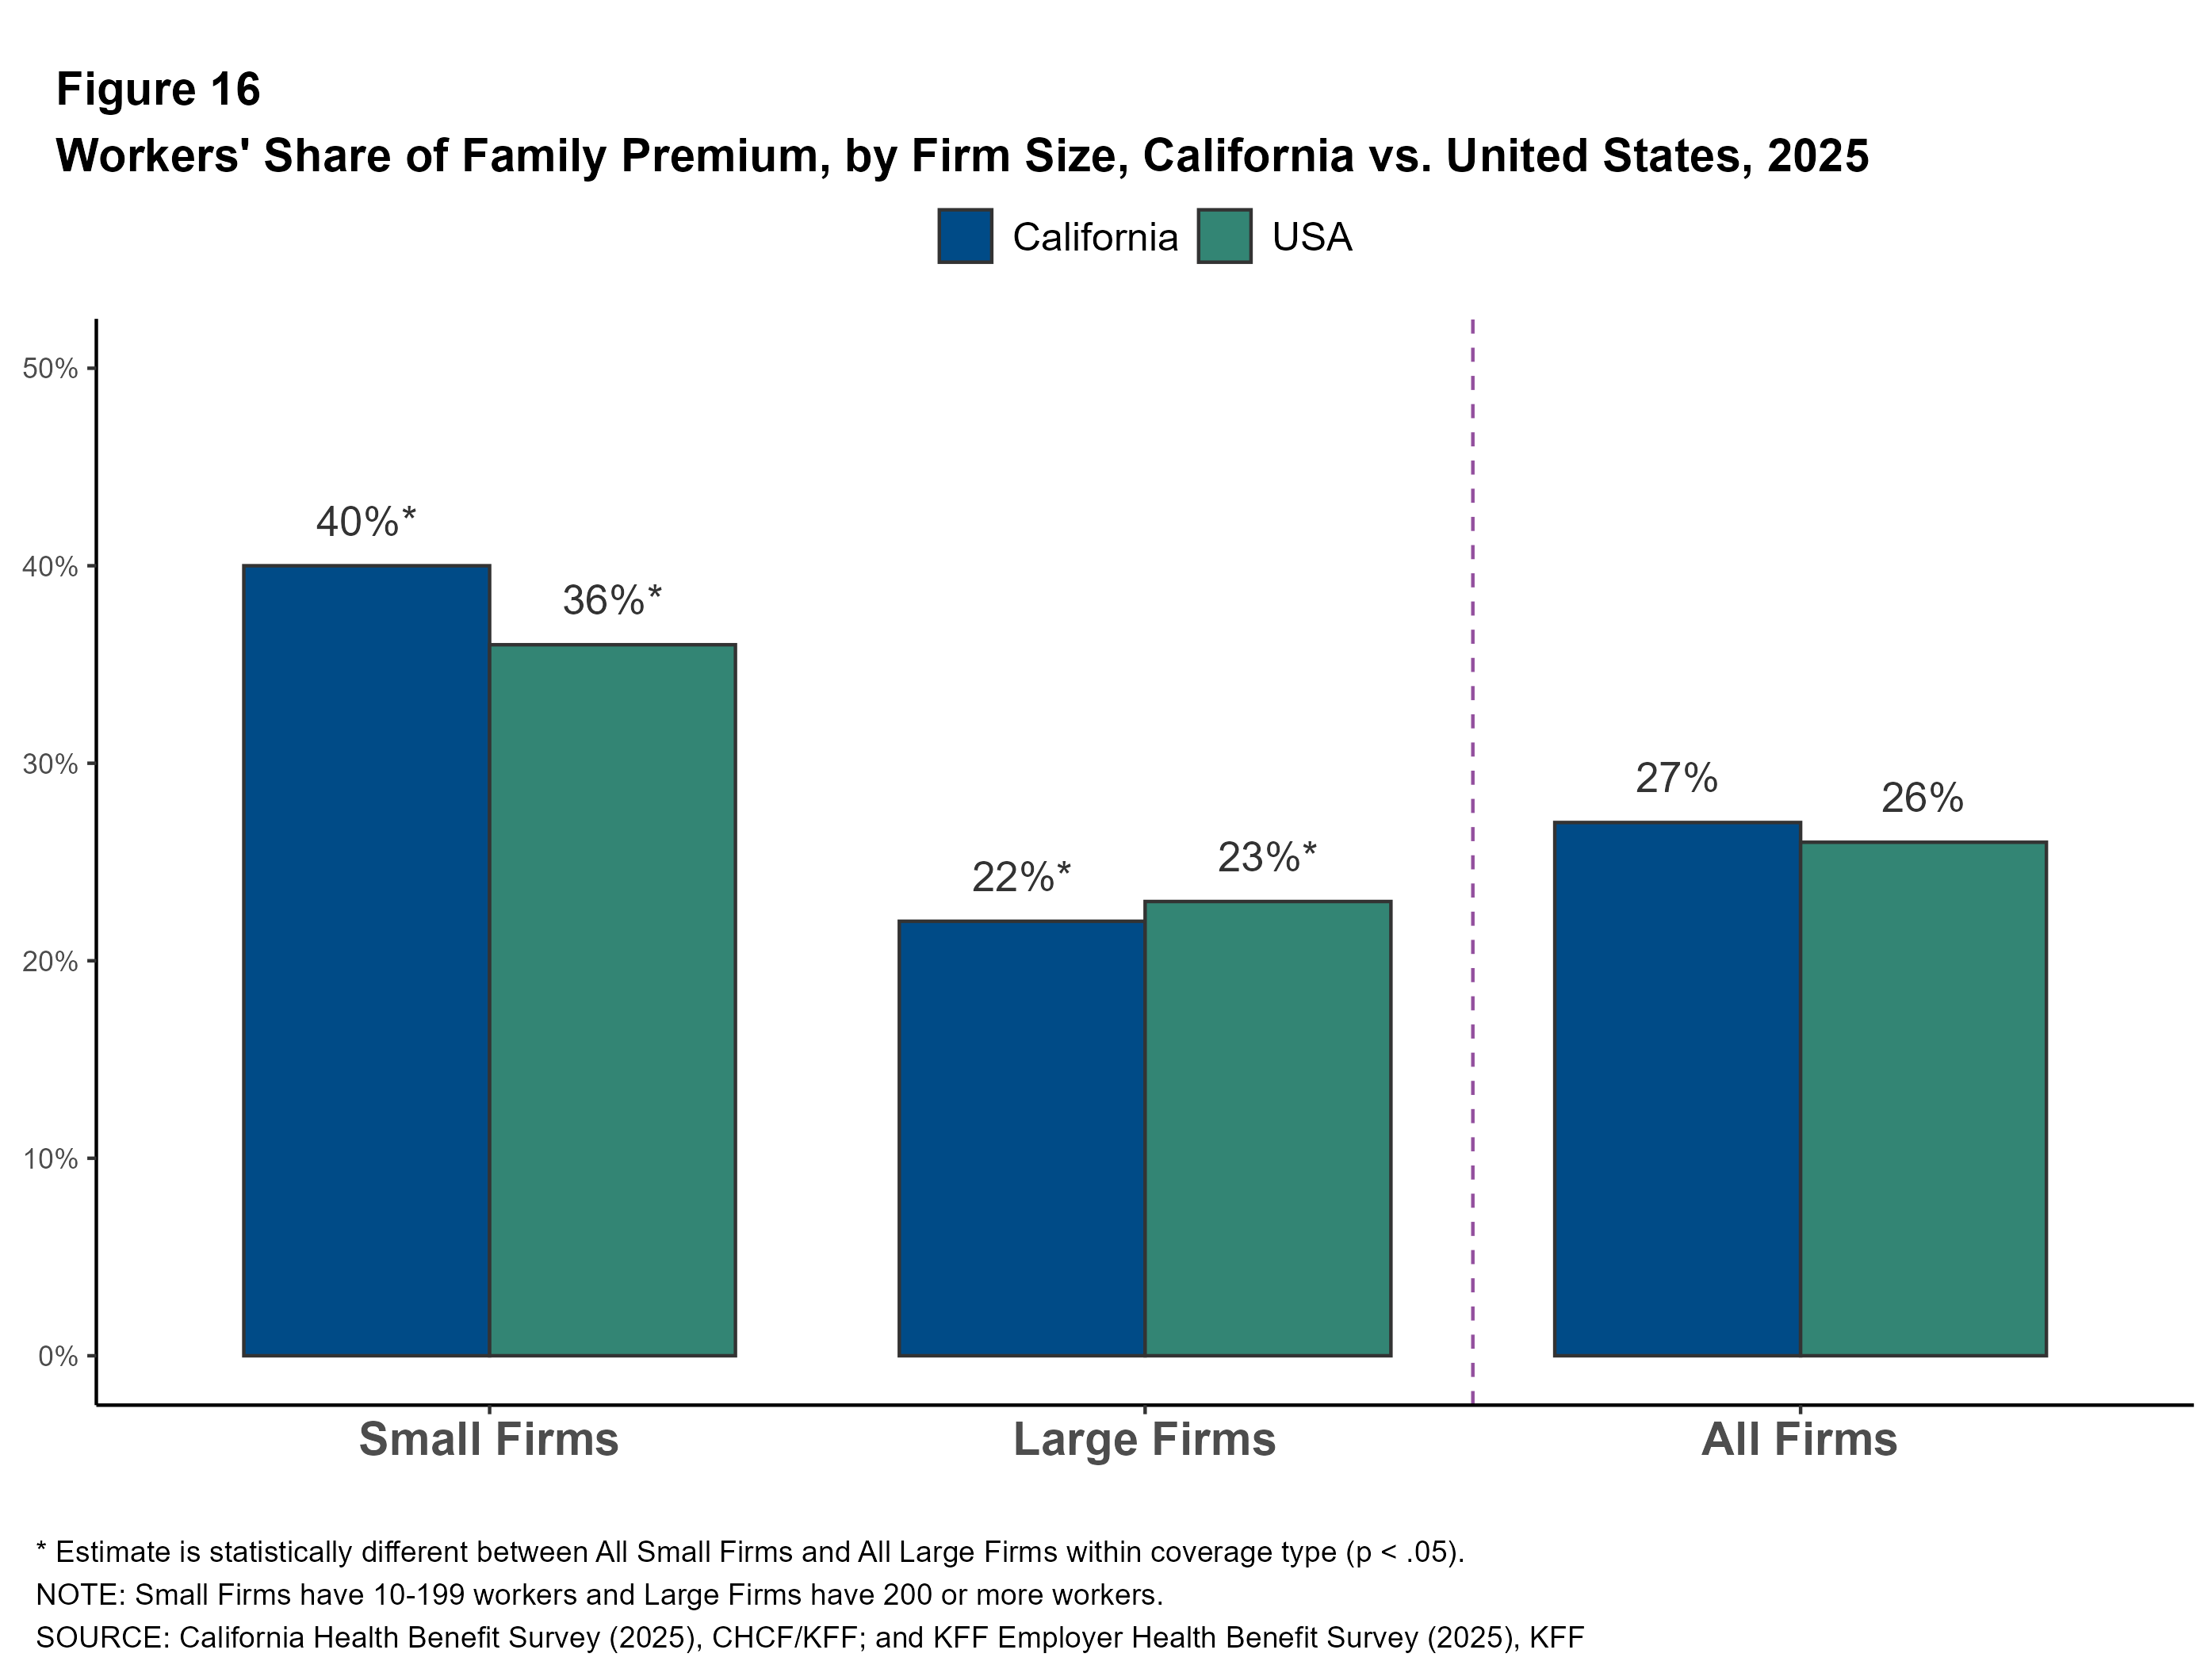
Share of the Premium Paid for by Workers: On average, covered workers in California contribute 14% of the premium for single coverage and 27% of the premium for family coverage, similar to the national averages.
Firm Size: Covered workers in California in small firms contribute a higher percentage of the family premium than those in larger firms, 40% vs. 22%.
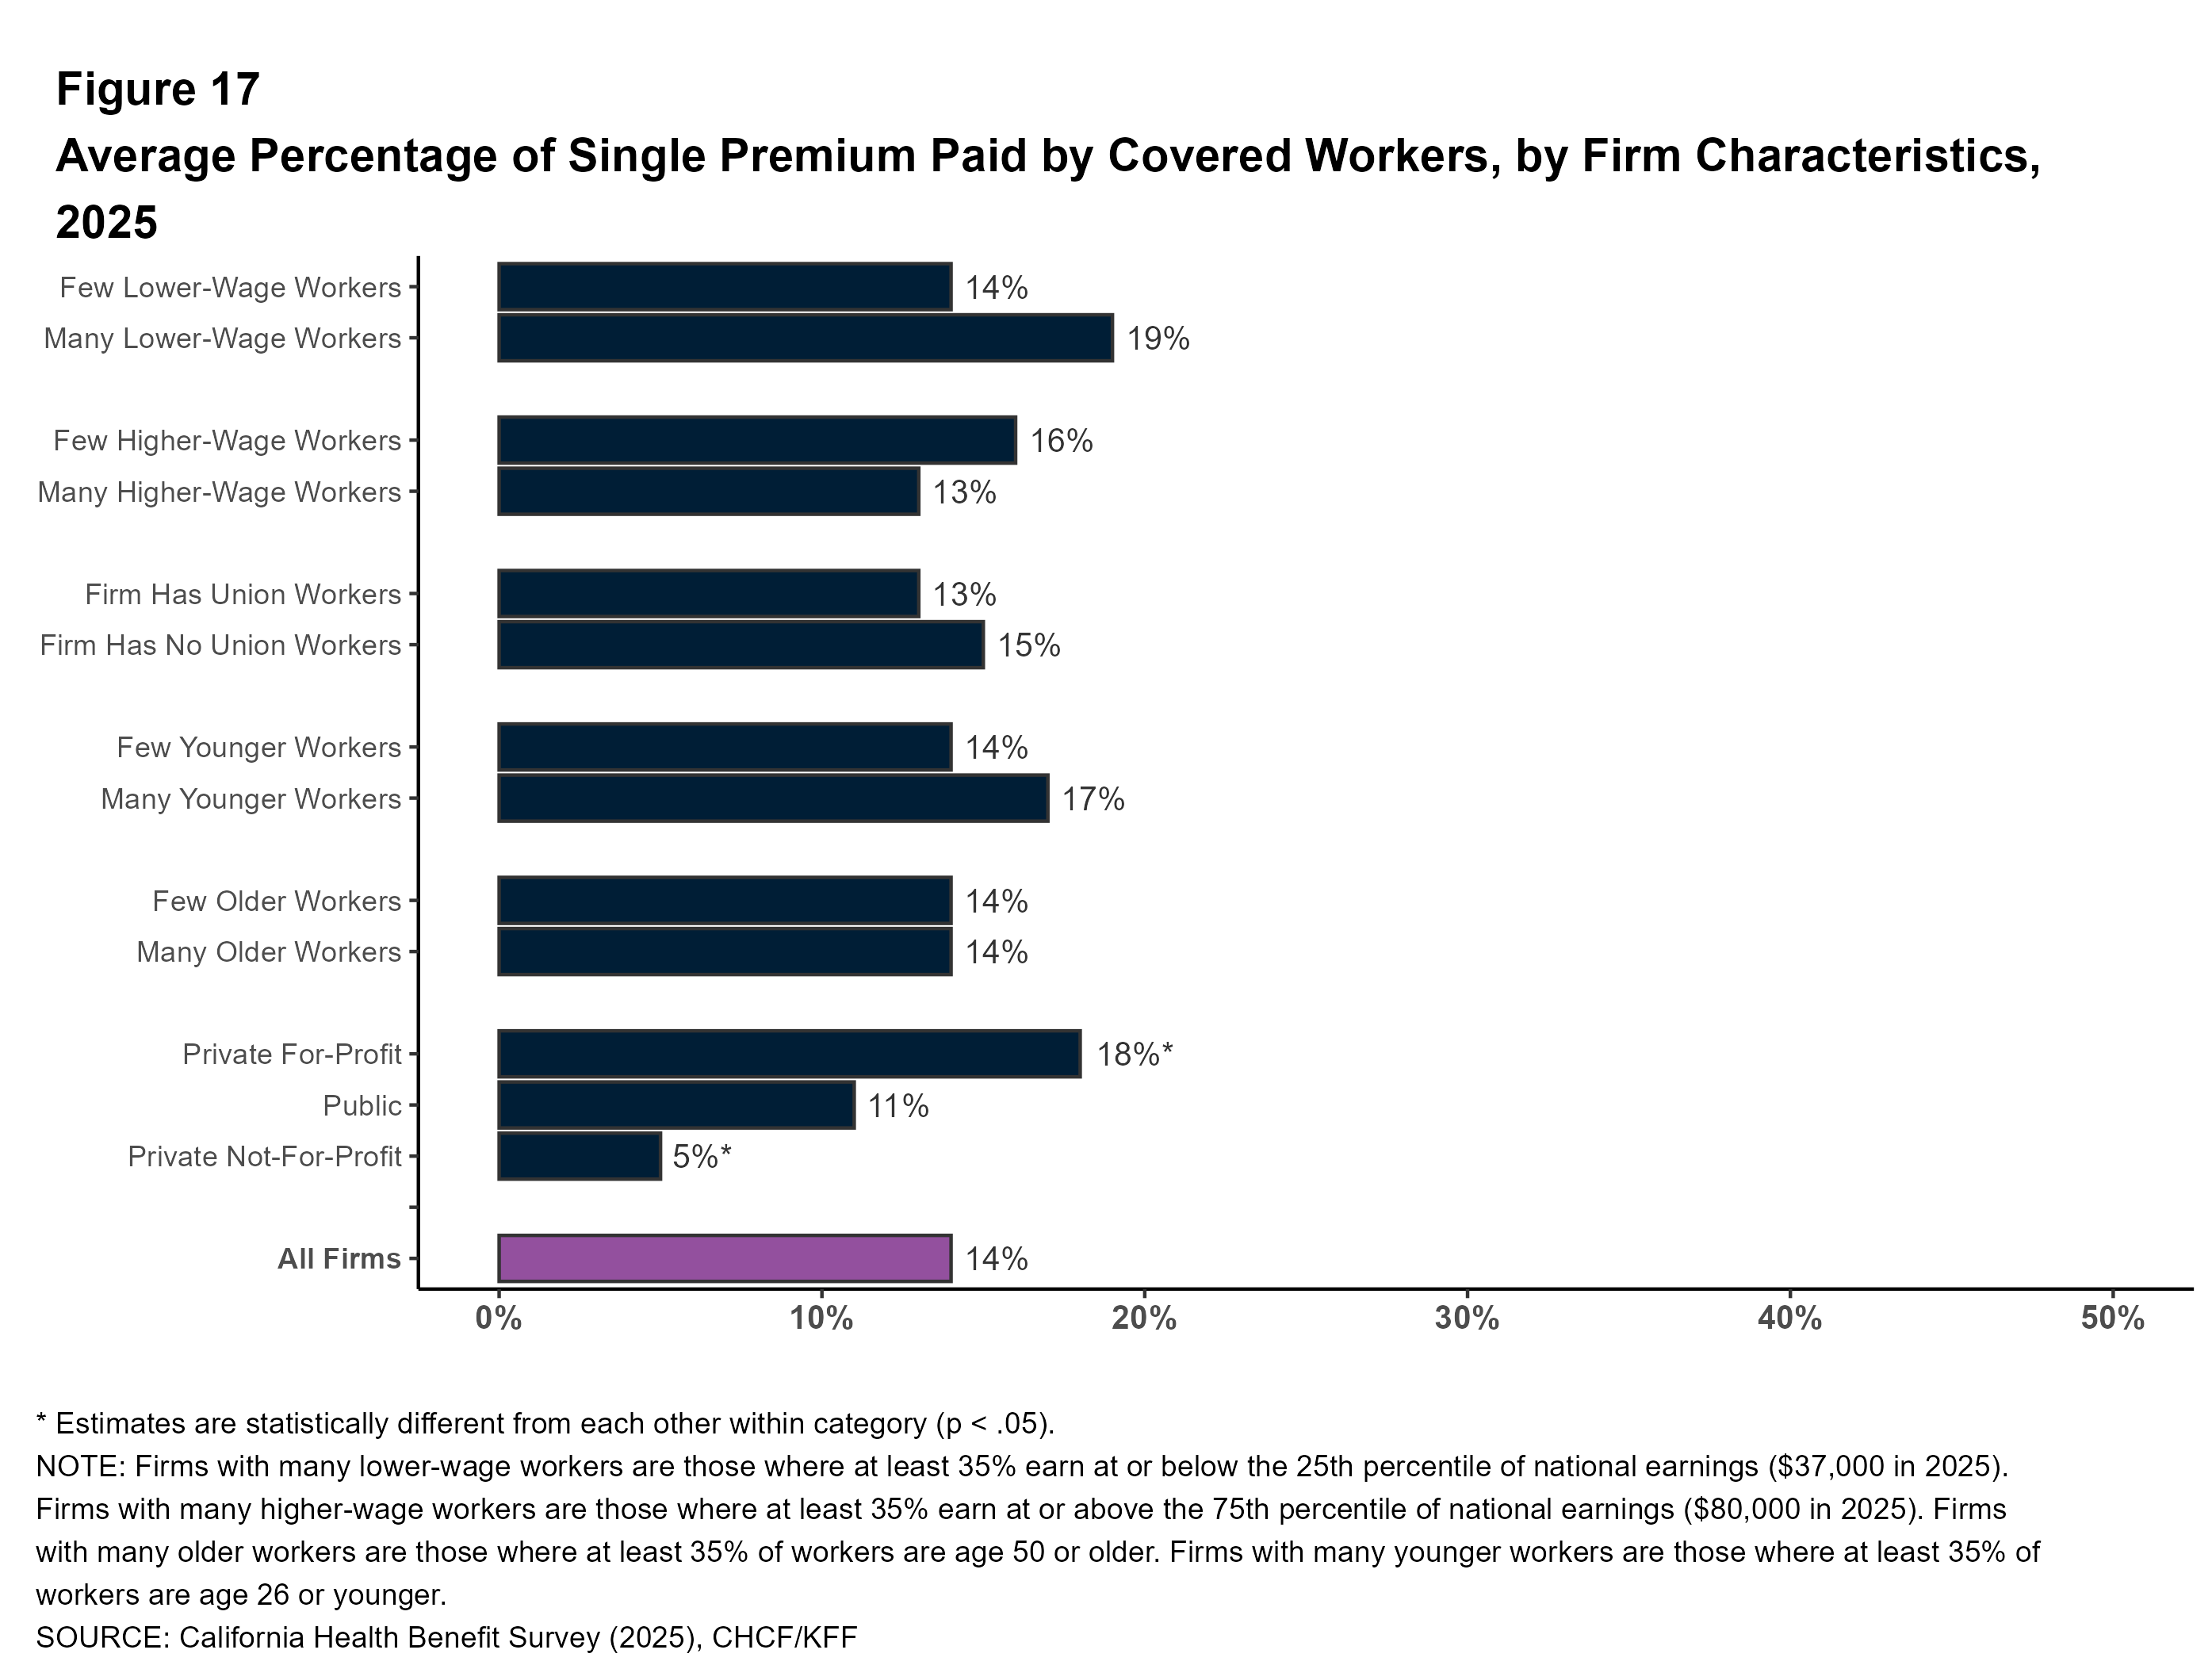
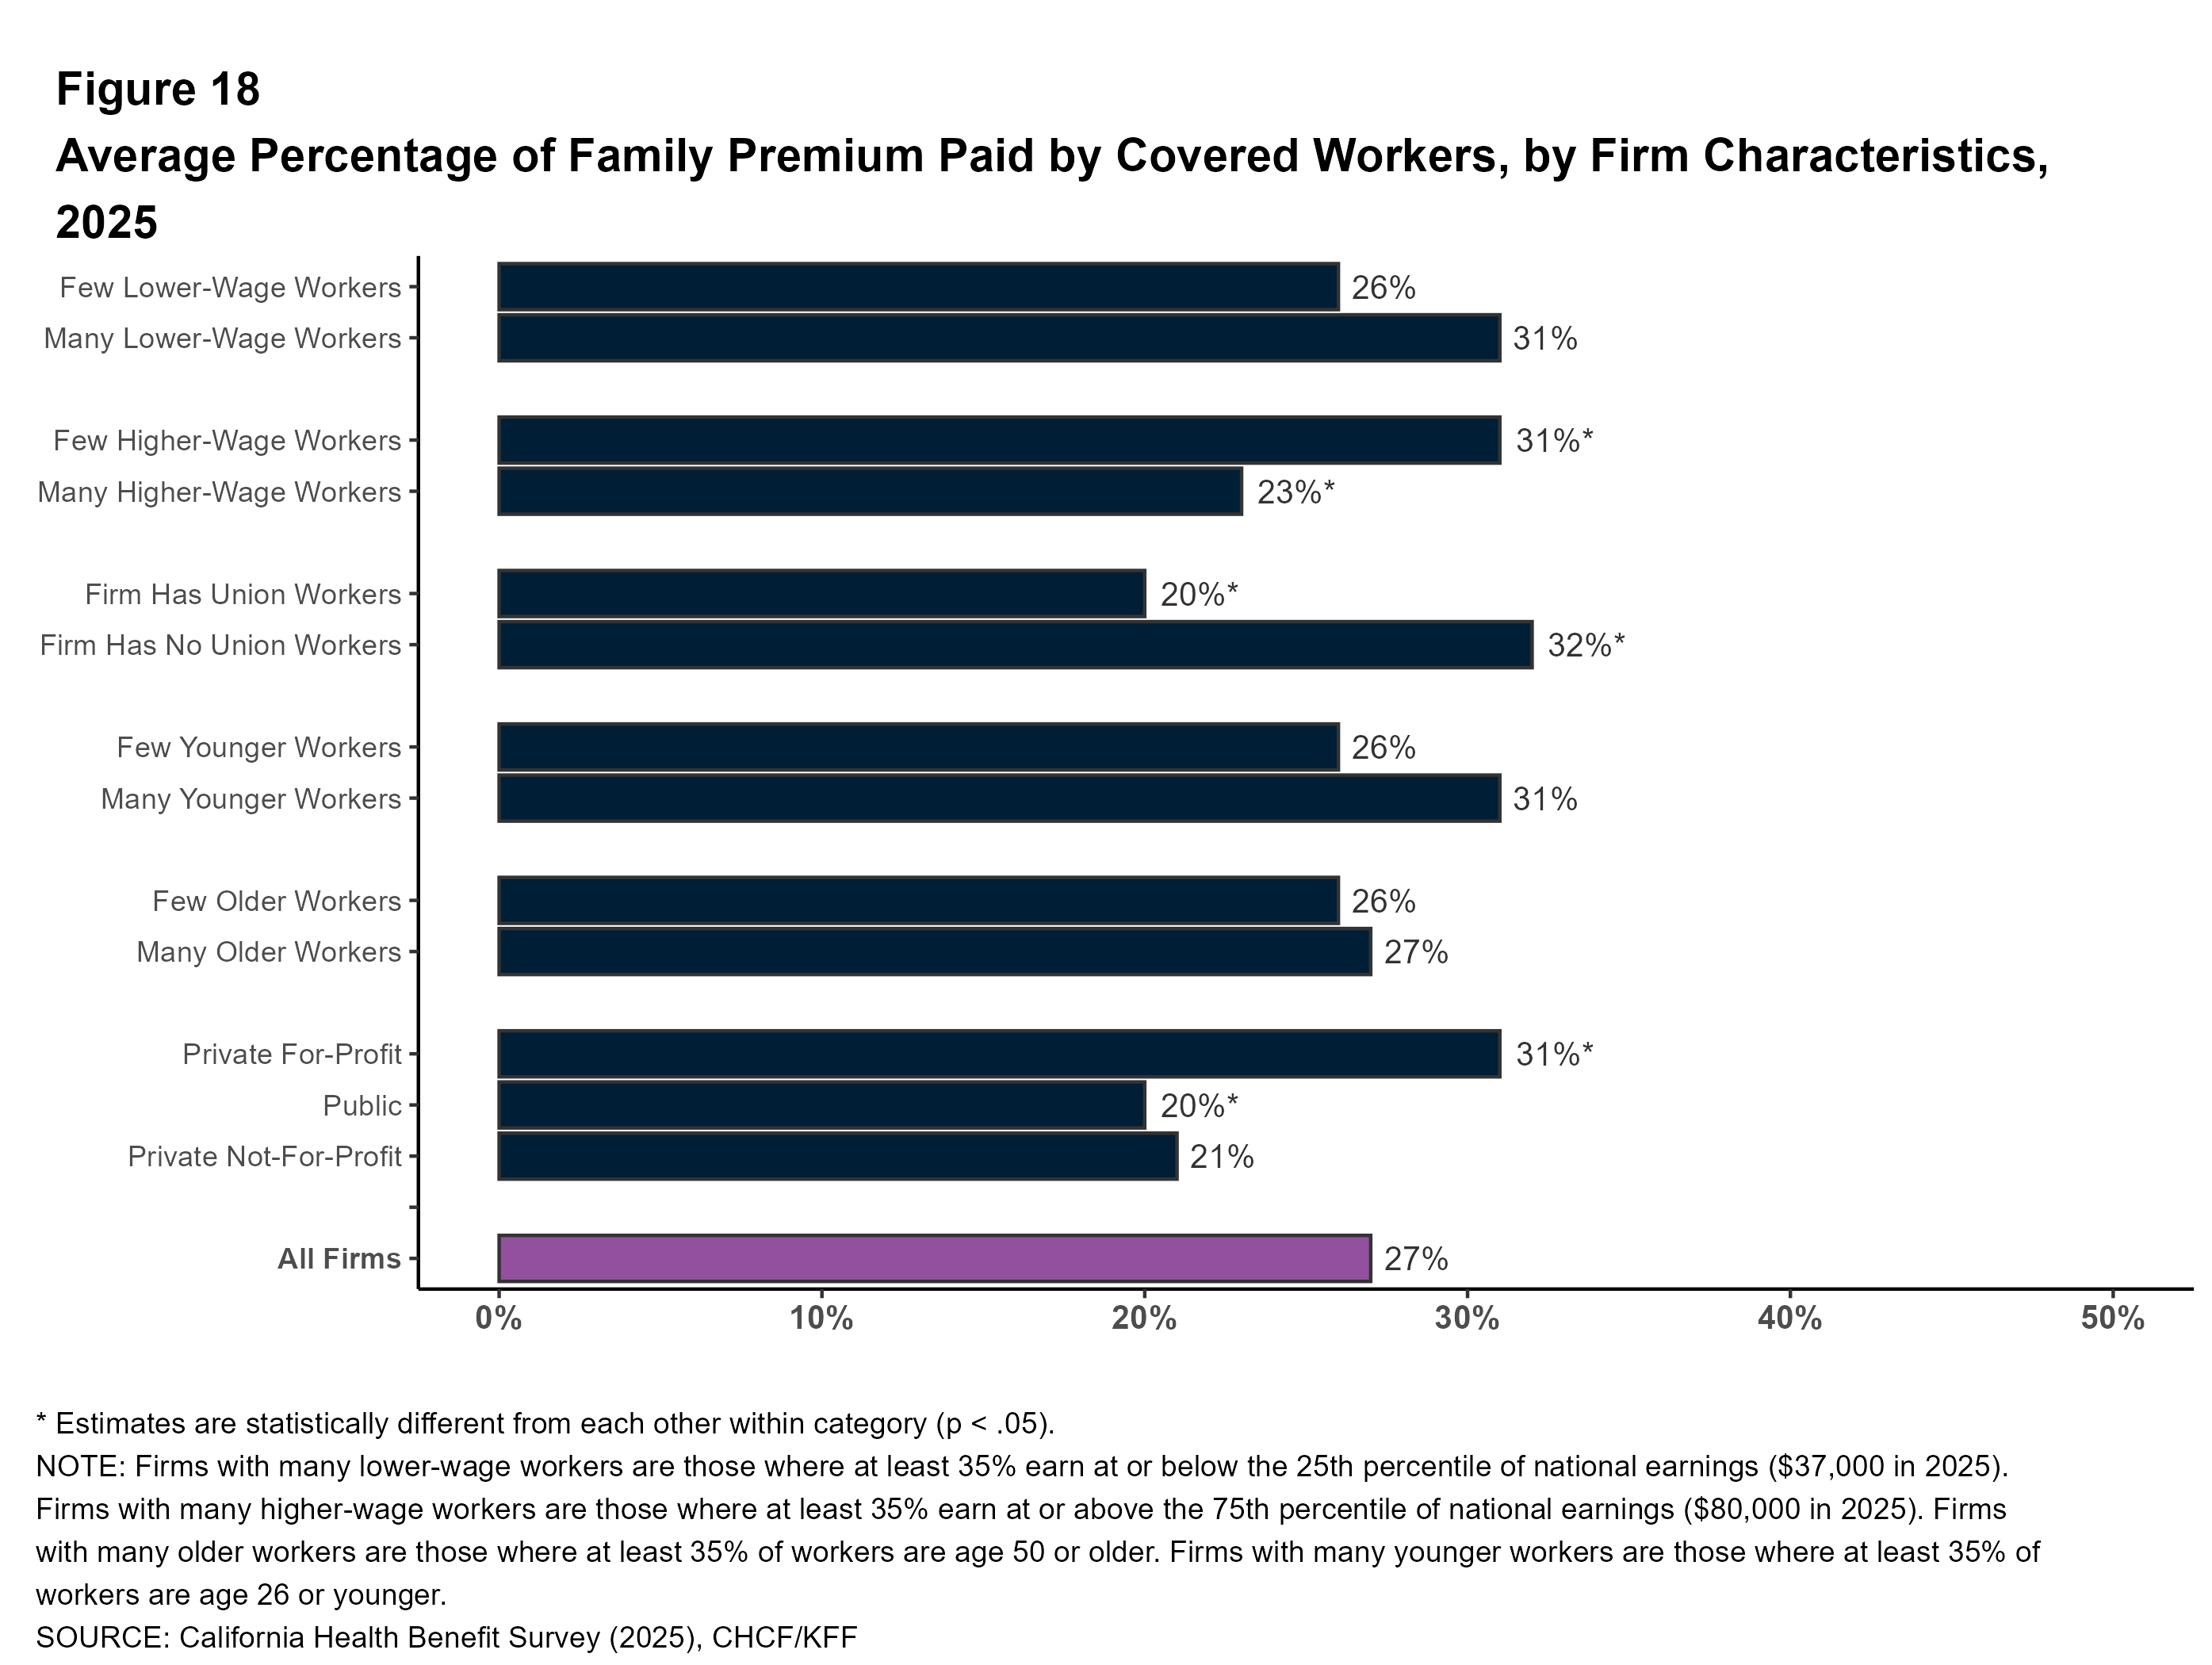
Share of the Premium Paid for by Workers by Firm Characteristics: The average share of the premium paid directly by covered workers differs across types of firms in California.
- Covered workers in private, for-profit firms have relatively high average contribution rates for single coverage (18%) and for family coverage (31%) coverage. Covered workers in public firms have relatively low average premium contribution rates for family coverage (20%). Covered workers in private not-for-profit firms have relatively low average premium contribution rates for single coverage (5%).
- Covered workers in firms with many higher-wage workers (where at least 35% earn $80,000 or more annually) have a lower average contribution rate for family coverage than those in firms with a smaller share of higher-wage workers (23% vs. 31%).
- Covered workers in firms that have at least some union workers have a lower average contribution rate for family coverage than those in firms without any union workers (20% vs. 32%).
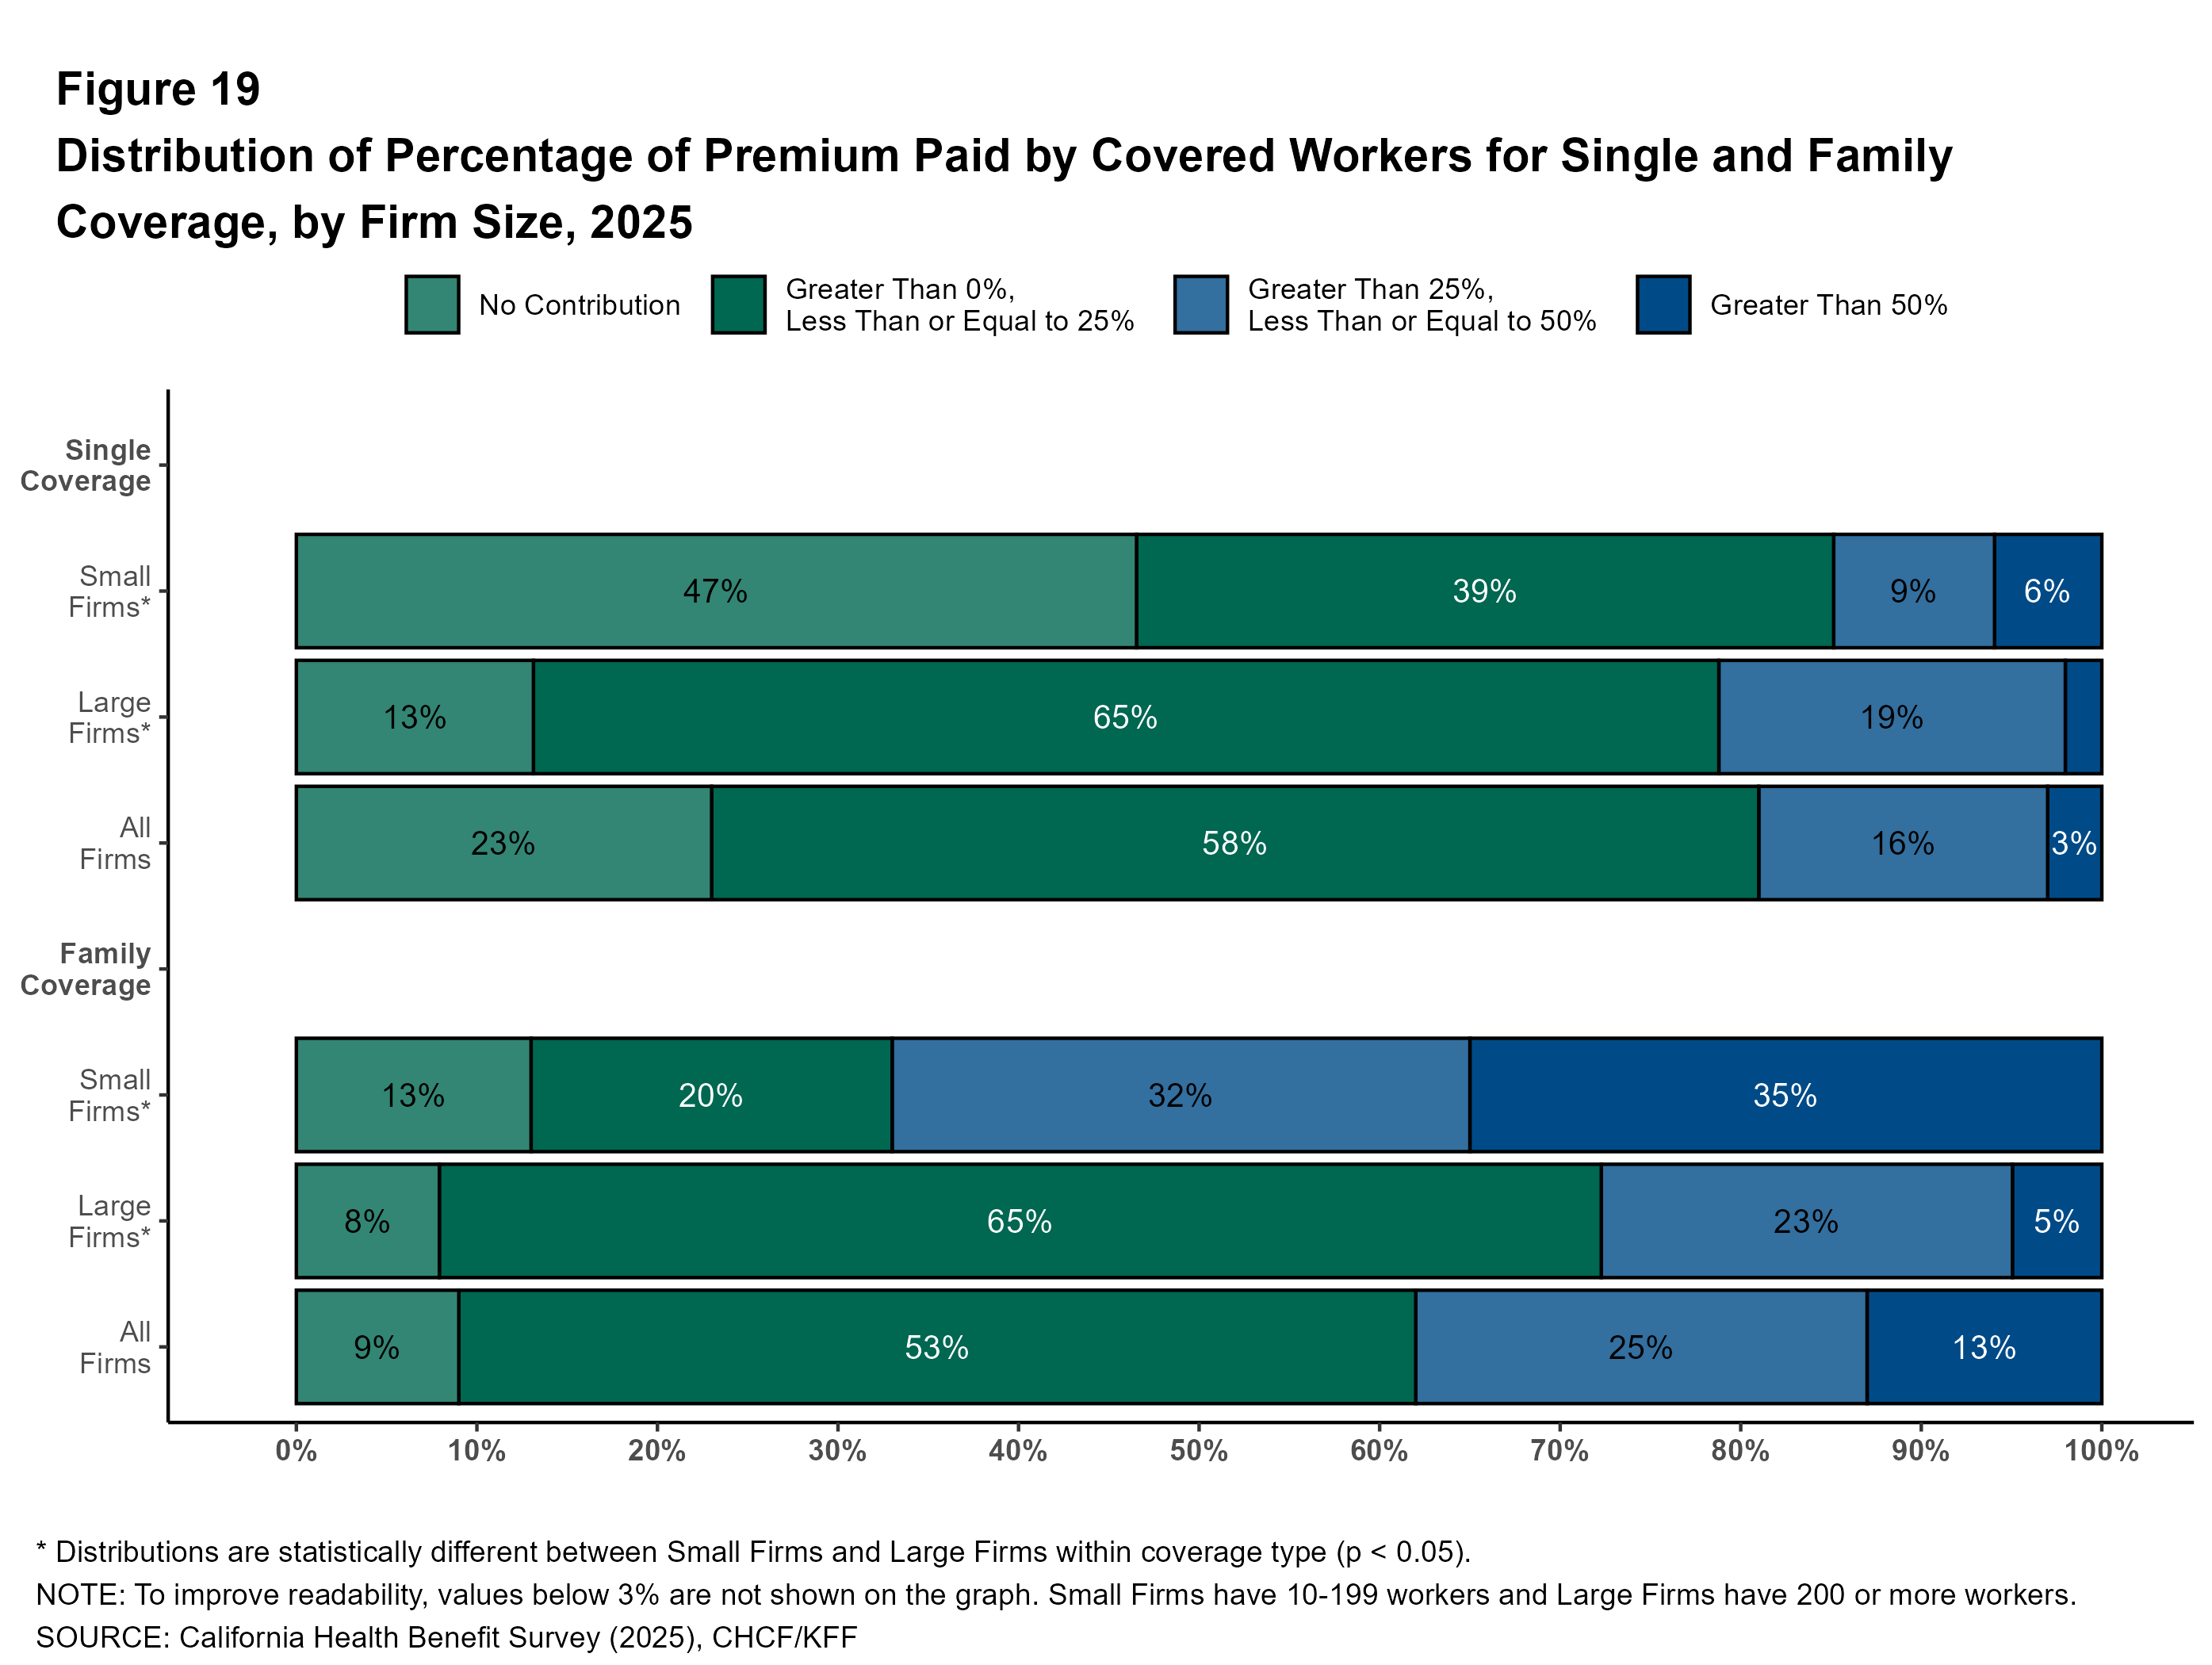
Distribution of Worker Contributions: In California, for single coverage, 47% of covered workers at small firms are enrolled in plans with no premium contribution, compared to only 13% of covered workers at large firms. For family coverage, 35% of covered workers at small firms are enrolled in plans with a worker contribution of more than half the premium, compared to only 5% of covered workers at large firms.
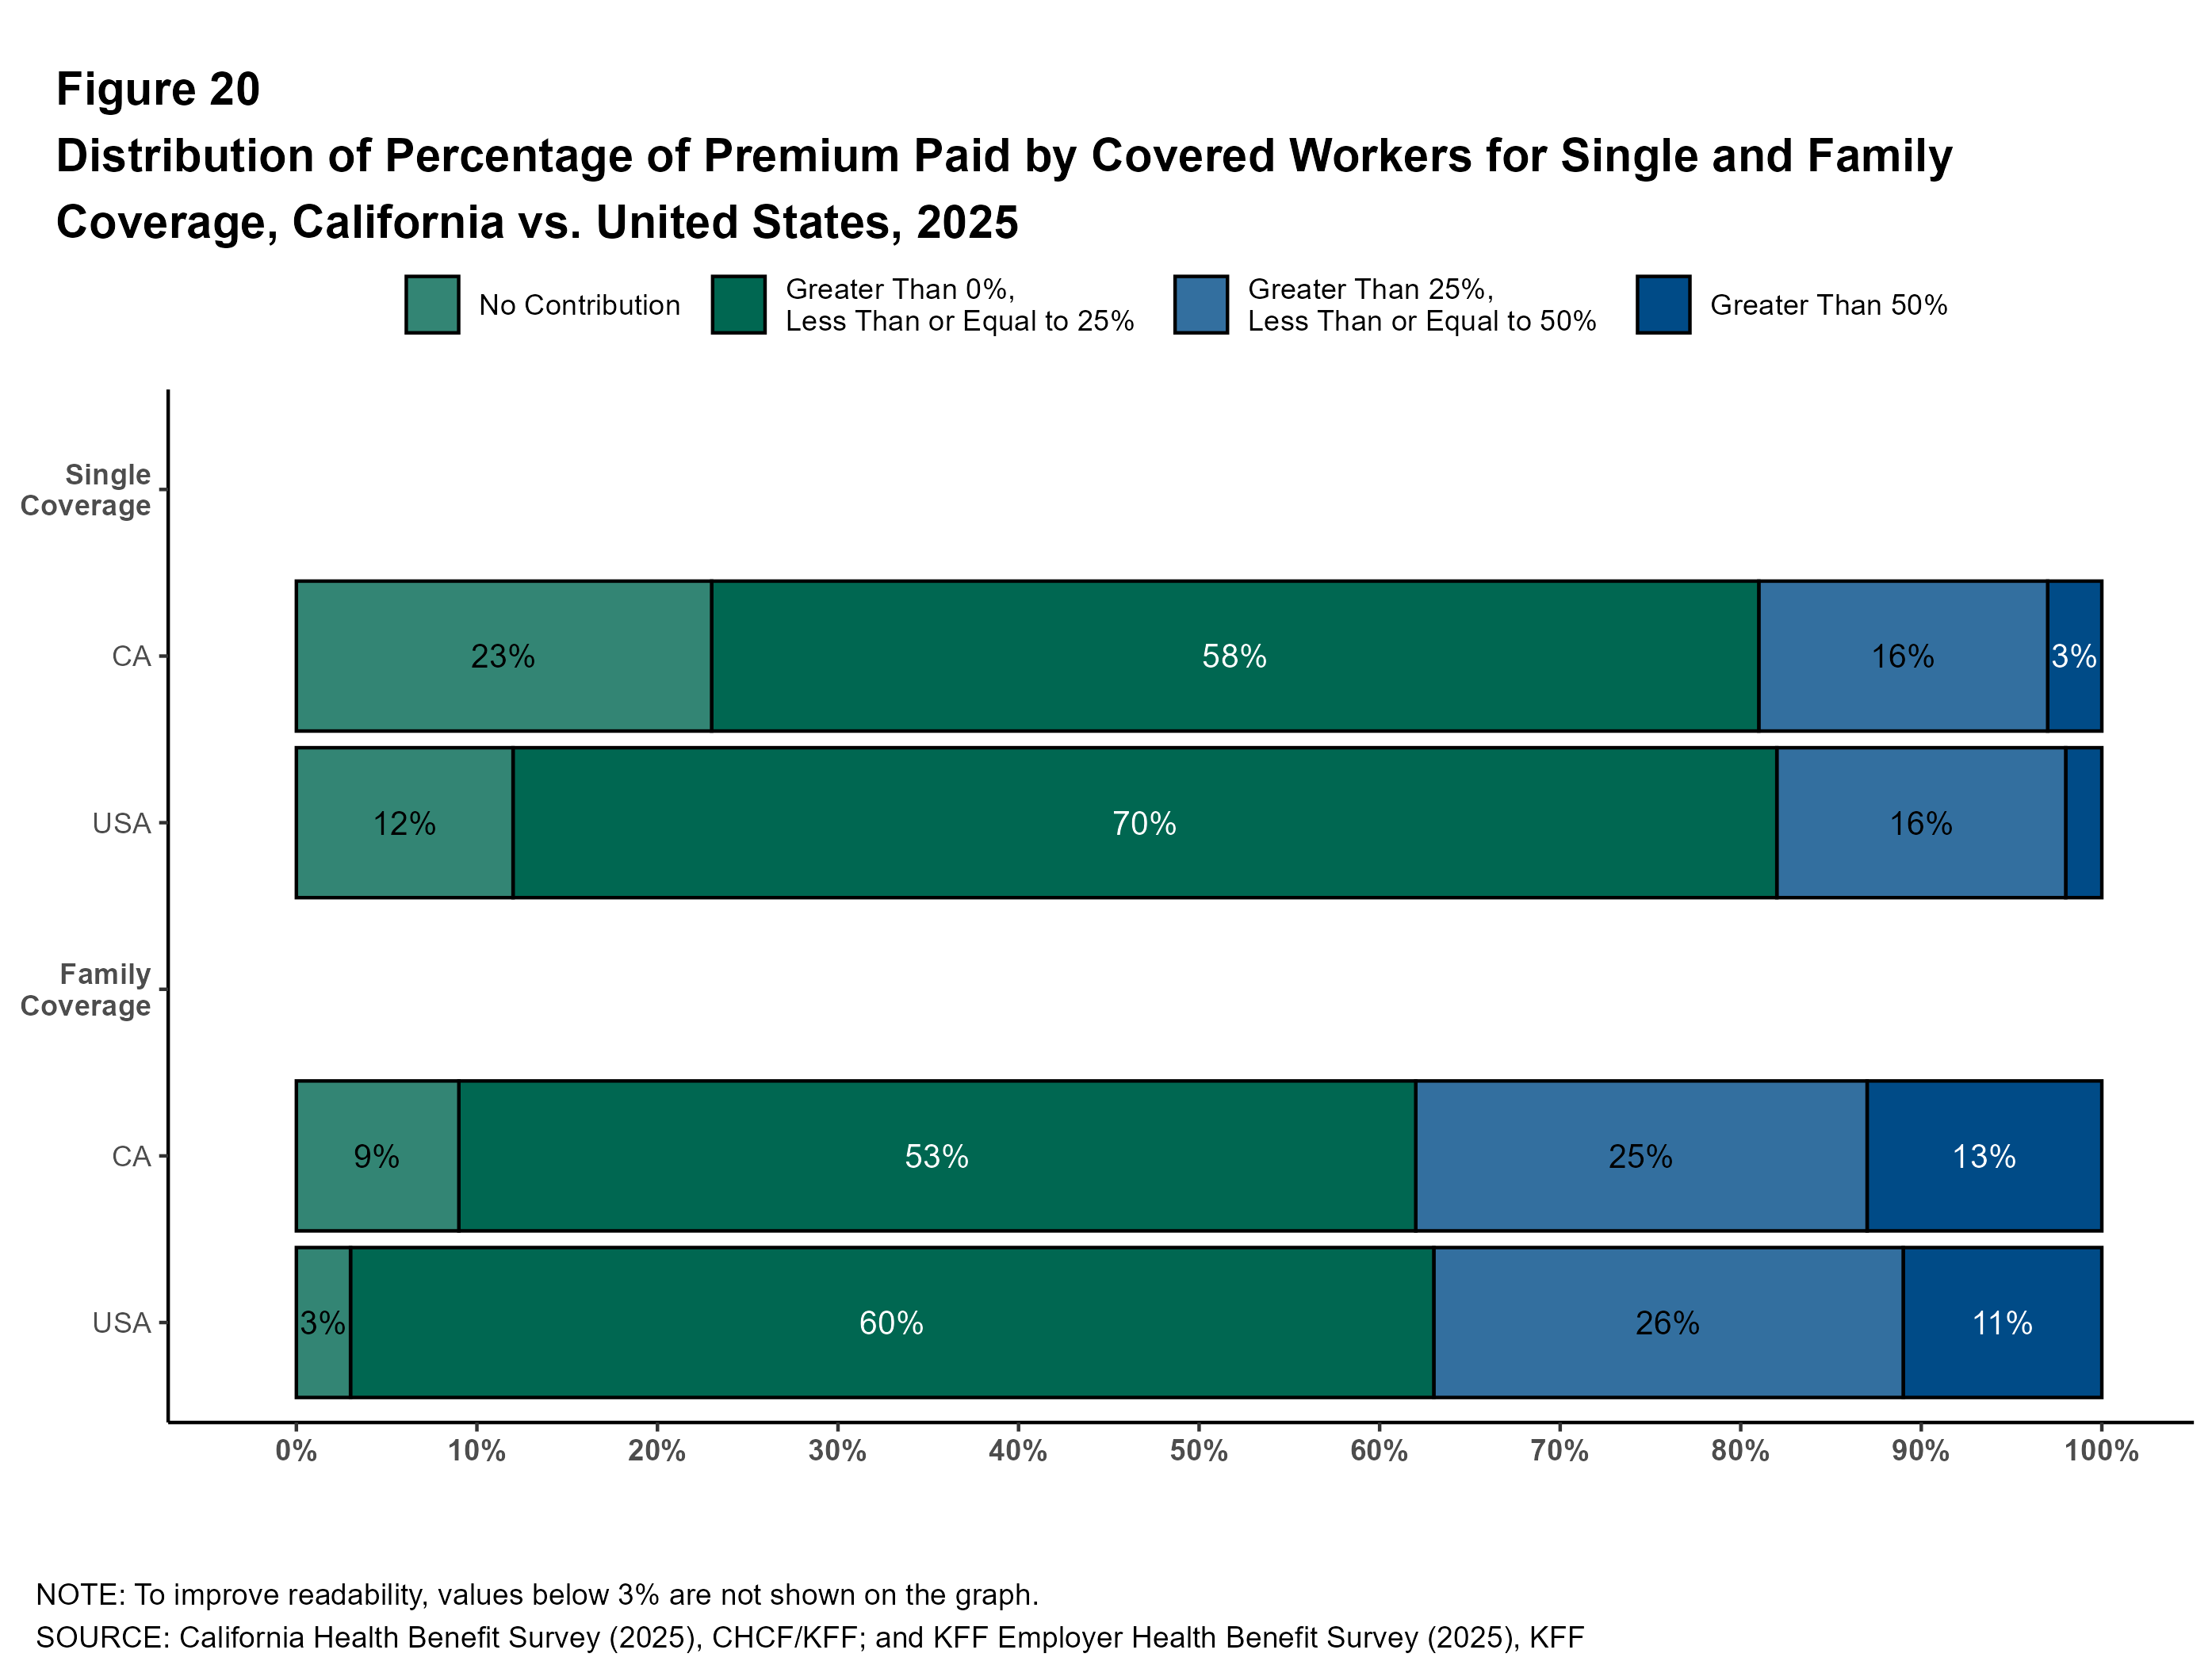
A larger share of covered workers in California are enrolled in a single coverage plan without a premium contribution than covered workers nationally (23% vs. 12%). This pattern also holds among covered workers at small firms (13% vs. 7%).
Another way to illustrate the high cost of family coverage for some workers is to examine the share of workers facing large annual premium contributions. Many workers at small firms encounter substantial costs if they choose to enroll dependents. Among firms offering family coverage, 38% of covered workers in small firms are enrolled in a plan with a premium contribution exceeding $10,000, compared to 12% of covered workers in large firms.
Coverage and Offering
Firms Offering Health Benefits
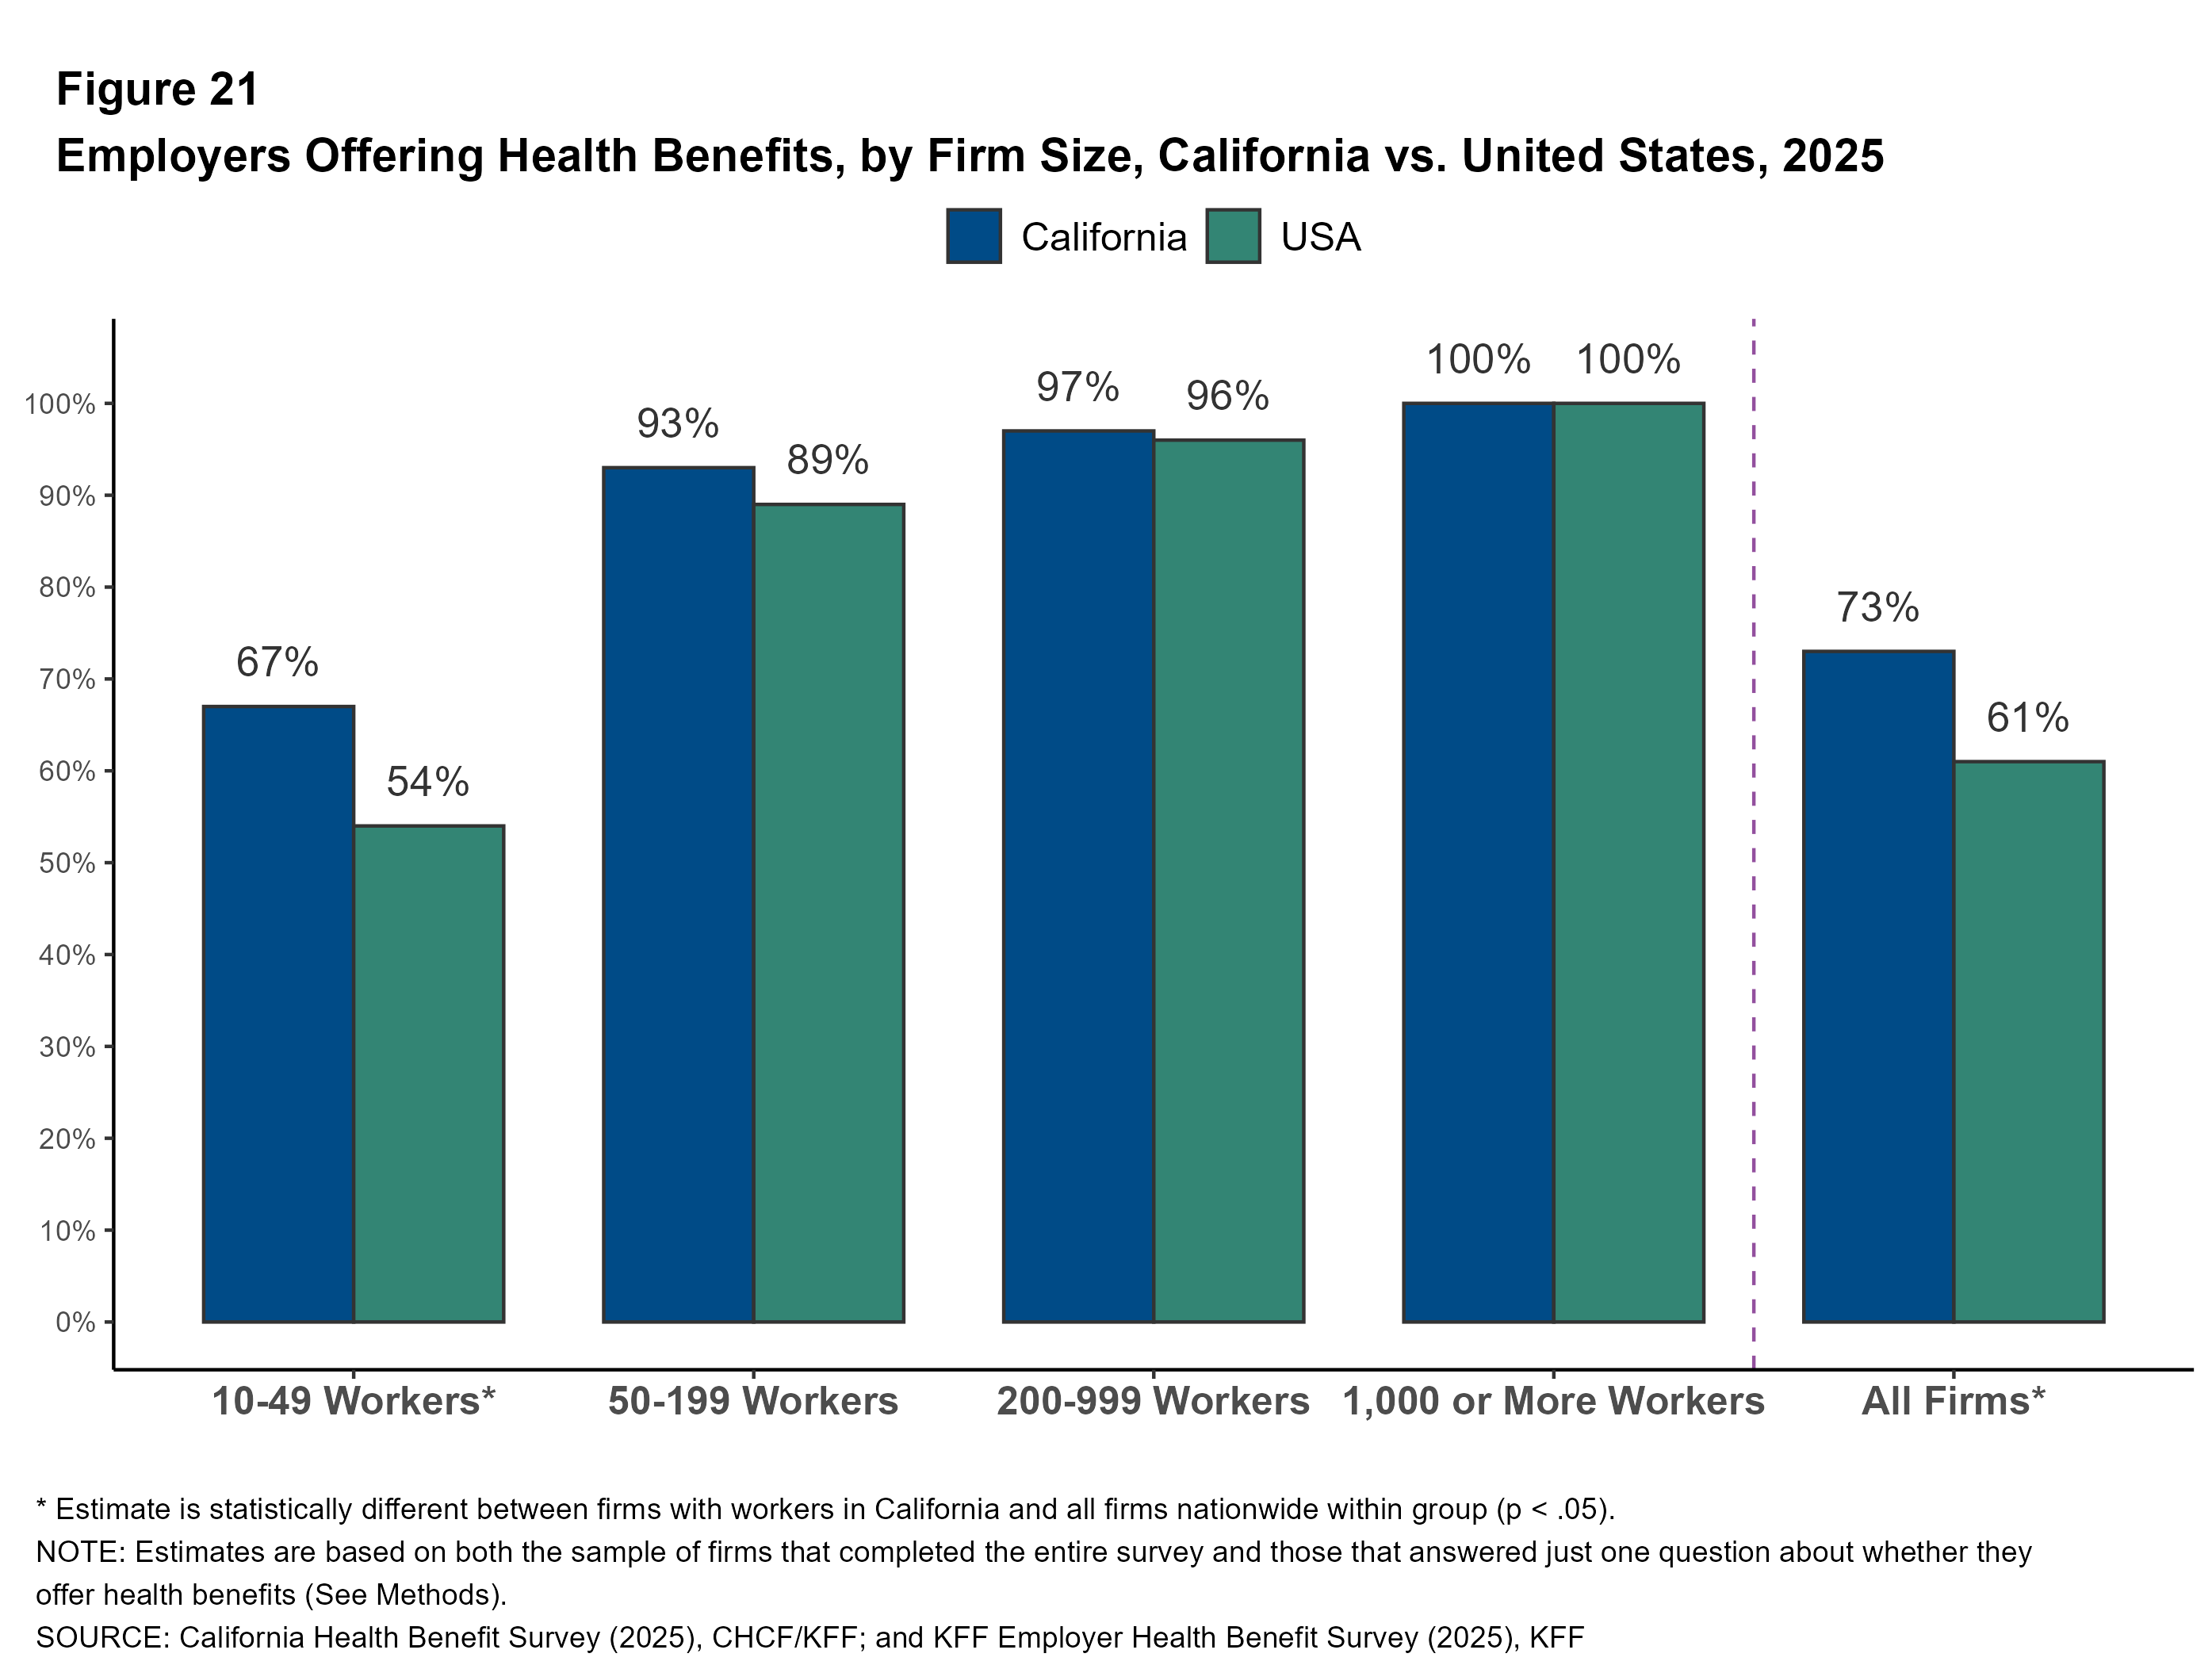
In 2025, 73% of employers with ten or more workers in California offered health benefits to at least some of their employees, higher than the national average (61%). Virtually all large firms offer health benefits to at least some of their workers, but fewer firms with 10–49 employees (67%) or 50-199 employees (93%) offer coverage. The share of employers offering health benefits to at least some workers in California is similar to 2022 (78%)
Because most workers are employed by larger firms, most workers work at a firm that offers health benefits to at least some of its employees. In 2025, 94% of California workers are employed by a firm that offers health benefits to at least some of its workers, more than the share nationally (91%).
Workers Covered by Firm Benefits
Not all workers at a firm offering health benefits are covered by those benefits. Some workers may be ineligible because they are temporary or part-time, they have to satisfy a waiting period, or they work in a job class that is not offered coverage. Other workers may decline coverage because they are covered under another plan, or believe the coverage is unaffordable.
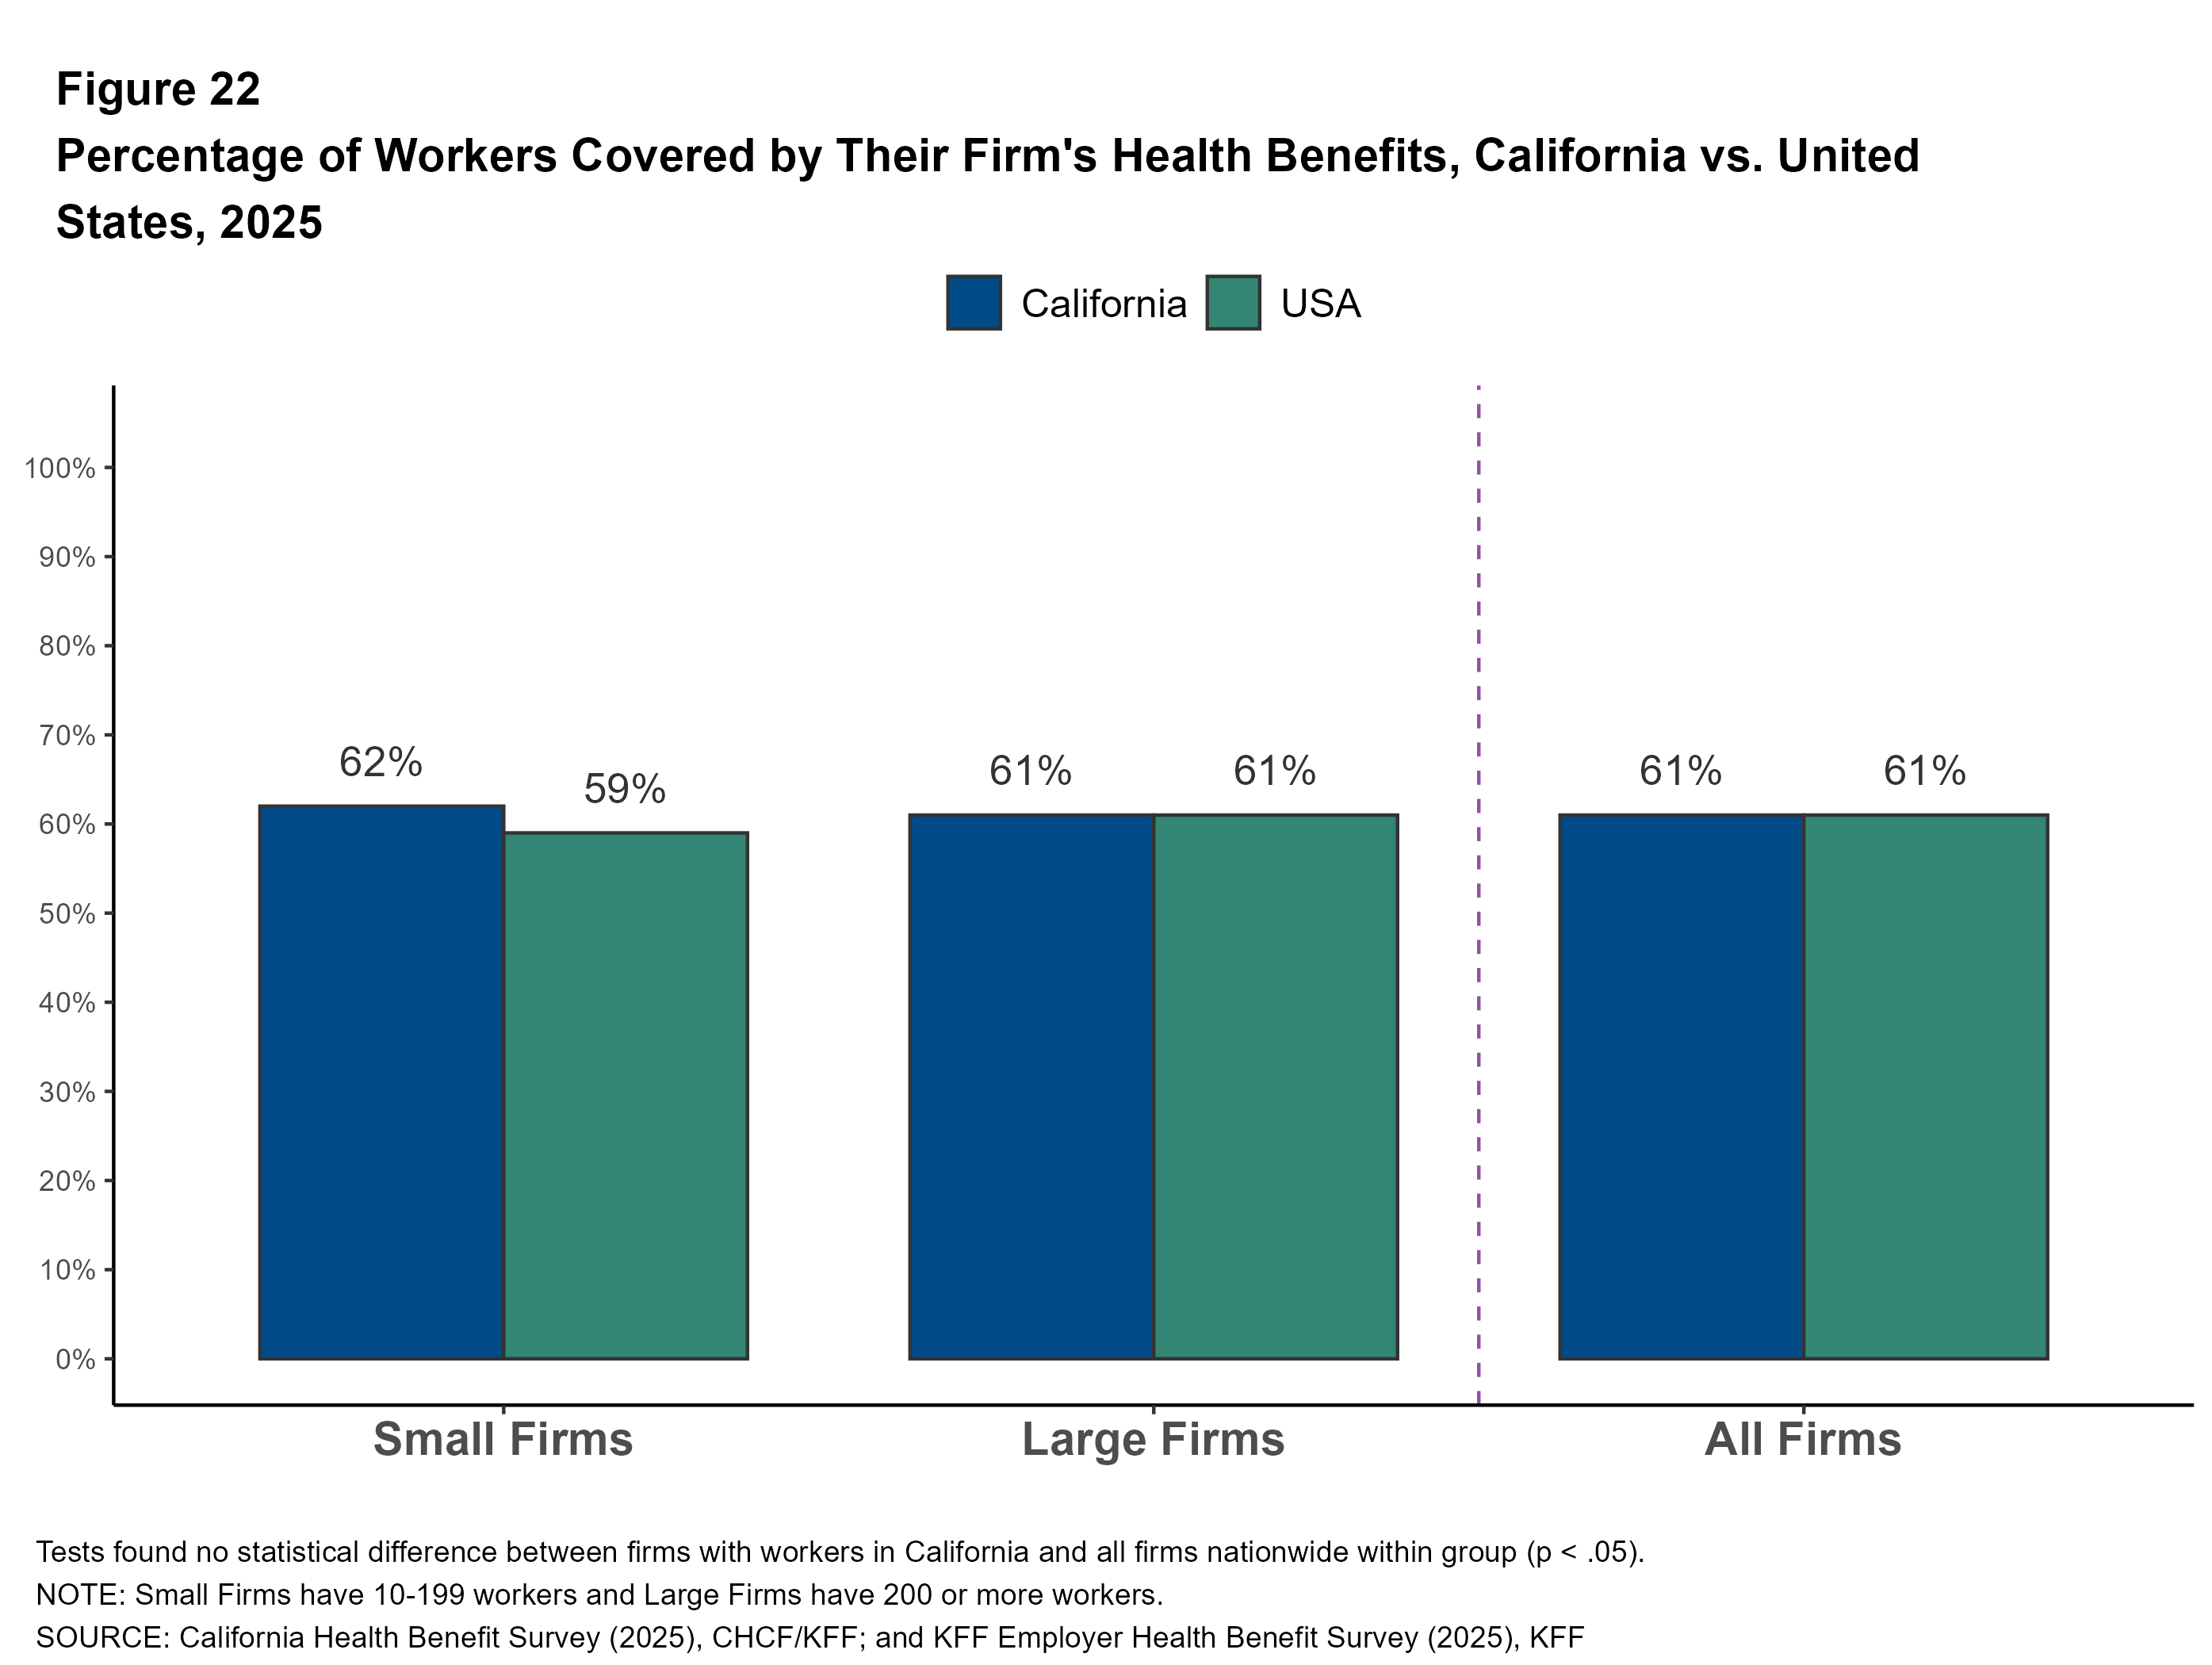
Among firms that offer health benefits, 61% of workers are enrolled, both in California and nationally. The percentage of workers at California firms offering health benefits who are covered by their firm’s health plan is similar to 2022 (60%). The coverage rate at firms offering health benefits is similar for smaller firms and larger firms in 2025.
In 2025, 56% of California covered workers are at firms that offer health benefits to part-time employees.
Sixty-two percent of covered workers in California work at firms that impose a waiting period before coverage is available. Waiting periods are the time after being hired before a worker becomes eligible to enroll in health benefits.
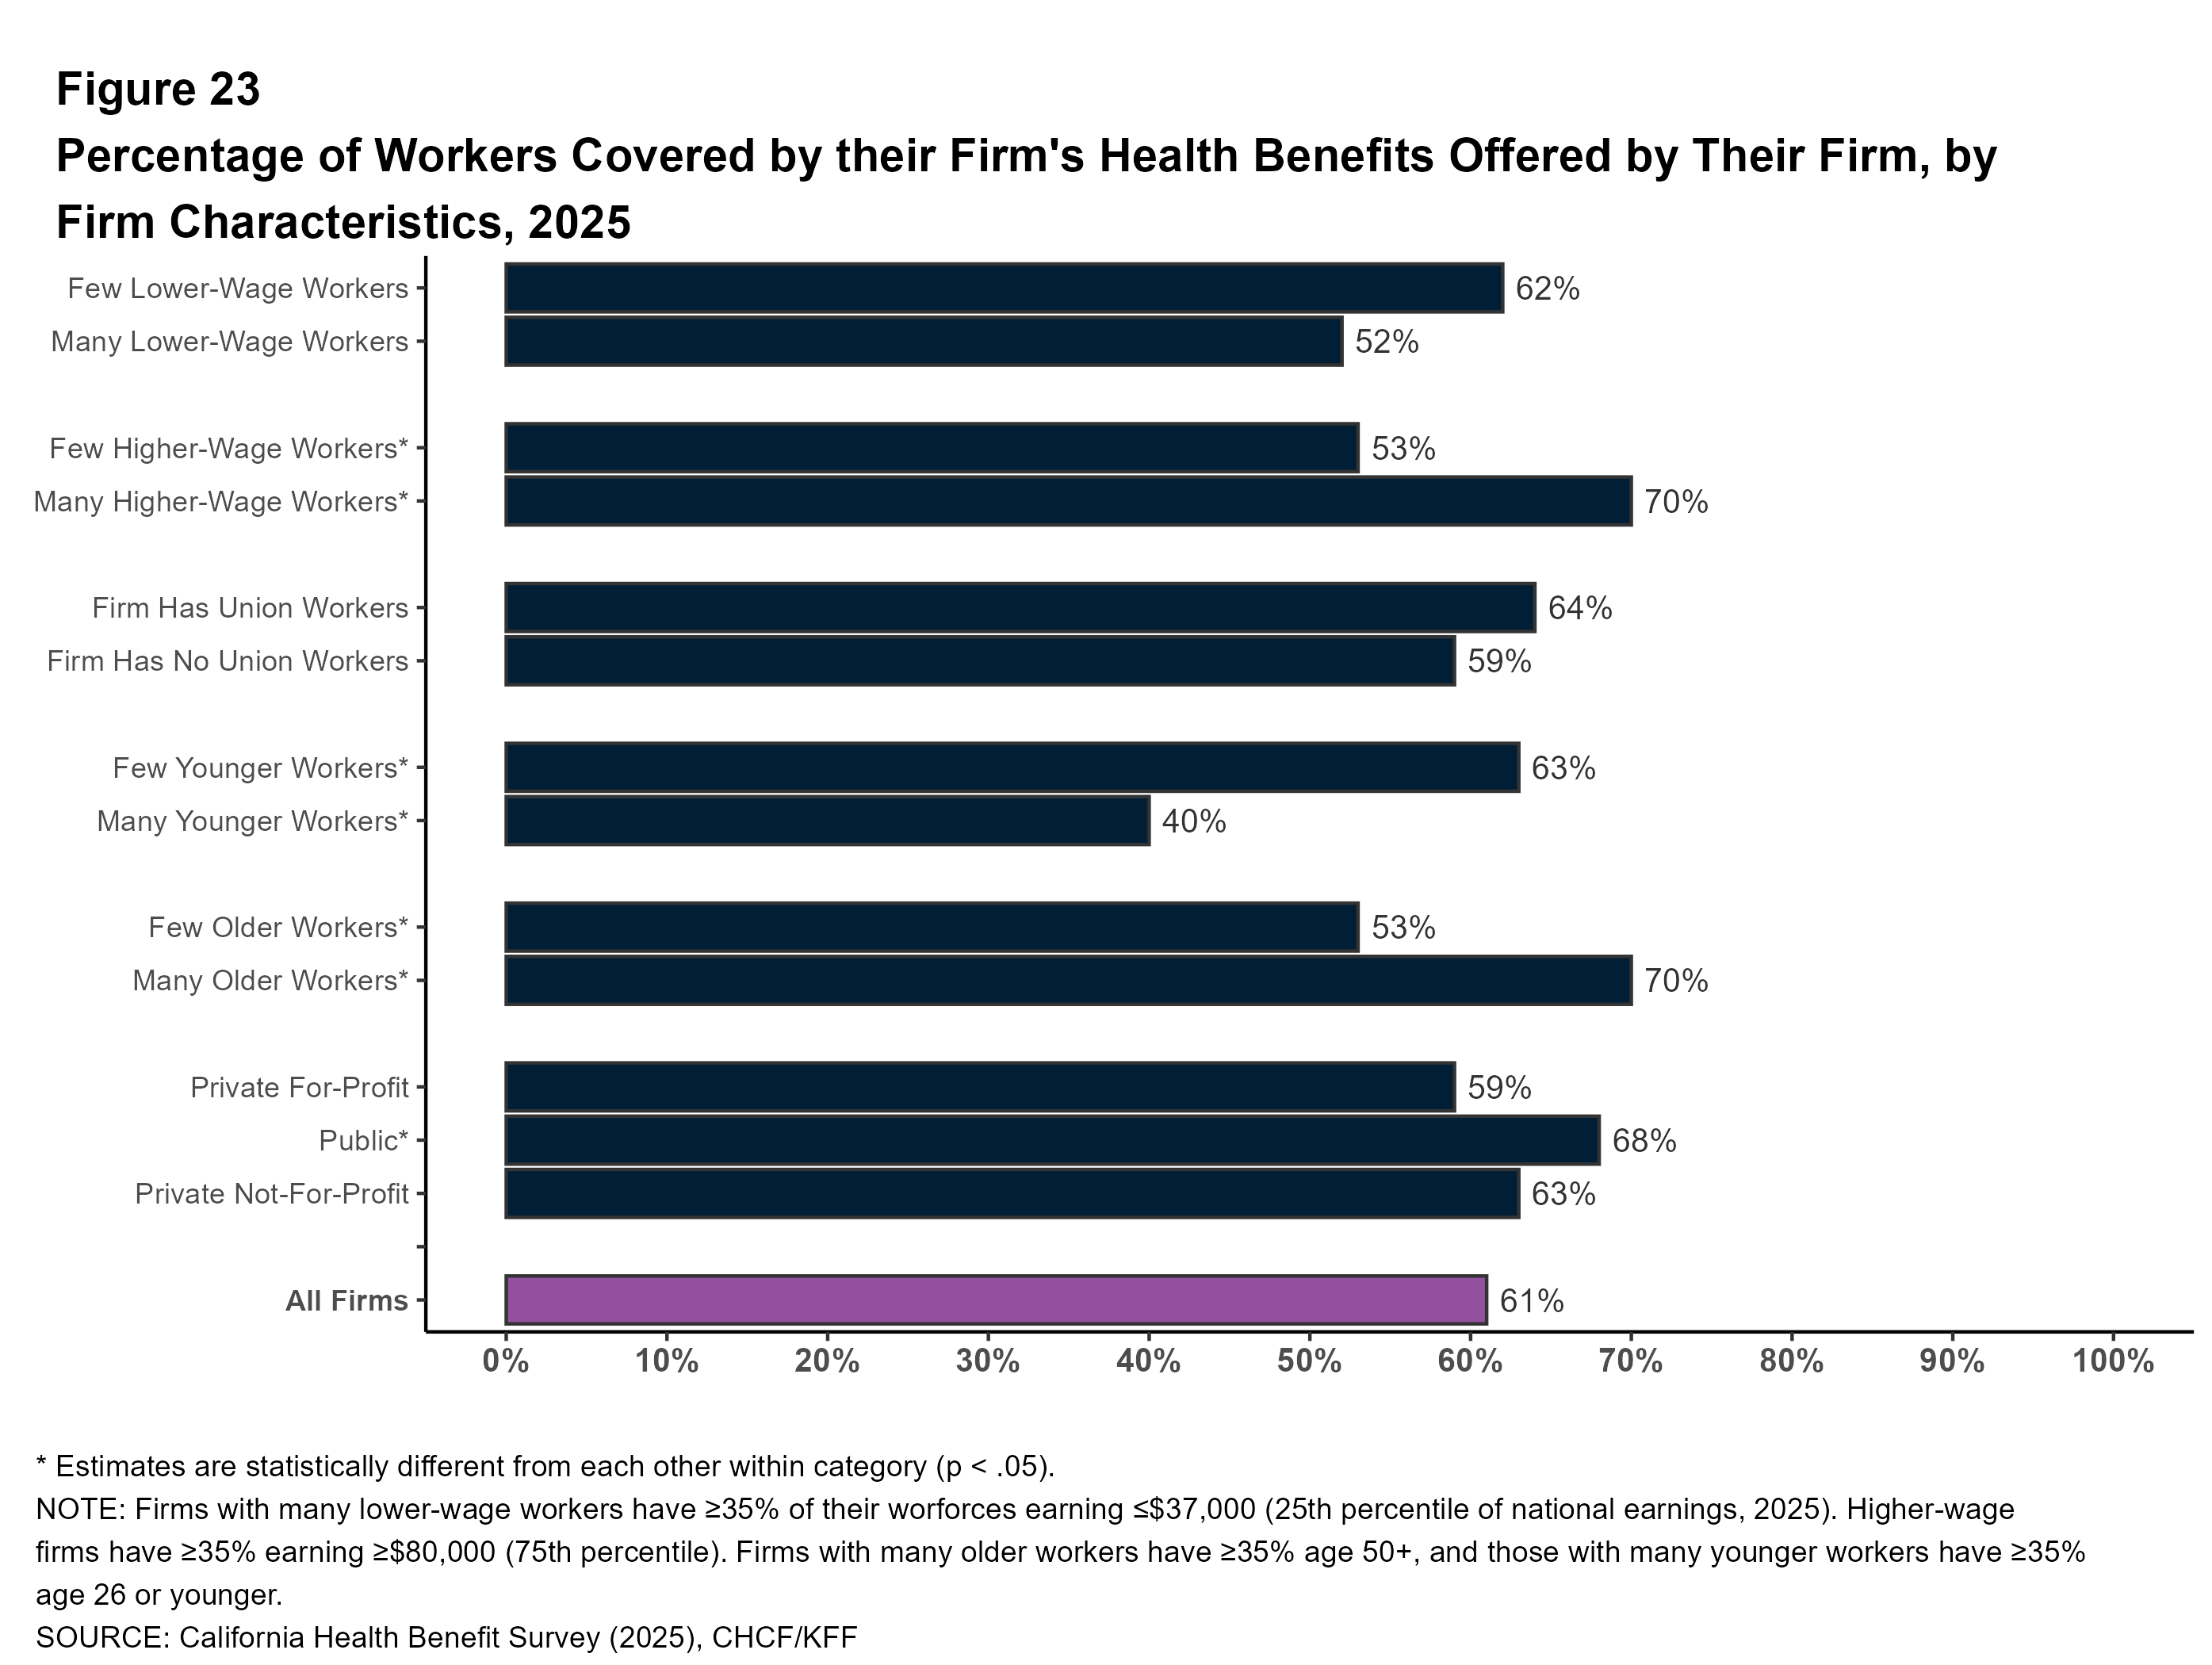
Firm Characteristics:
- Among workers in California firms offering health benefits, those in firms with many higher-wage workers are more likely to be covered than those in firms with few higher-wage workers (70% vs. 53%).
- Among workers in California firms offering health benefits, those in firms with a small share of younger workers are more likely to be covered by their own firm than those in firms with a larger share of younger workers (63% vs. 40%).
- Similarly, workers in California firms offering health benefits with a large share of older workers are more likely to be covered by their own firm than those in firms with a smaller share of older workers (70% vs. 53%).
Enrollment by Plan Type
Health plans are often categorized into plan types based on coverage for out-of-network services and use of primary care gatekeeping. This survey defines four distinct plan types:
- HMO (Health Maintenance Organization): A plan that does not cover non-emergency services provided out of network.
- PPO (Preferred Provider Organization): A plan that allows use of both in-network and out-of-network providers, with lower cost sharing for in-network services and no requirement for a primary care referral.
- POS (Point-of-Service Plan): A plan with lower cost sharing for in-network services, but that requires a primary care gatekeeper for specialist or hospital visits.
- HDHP/SO (High-Deductible Health Plan with a Savings Option): A plan with a deductible of at least $1,000 for single coverage or $2,000 for family coverage, paired with a health reimbursement arrangement (HRA) or a plan which is health savings account (HSA)-qualified.
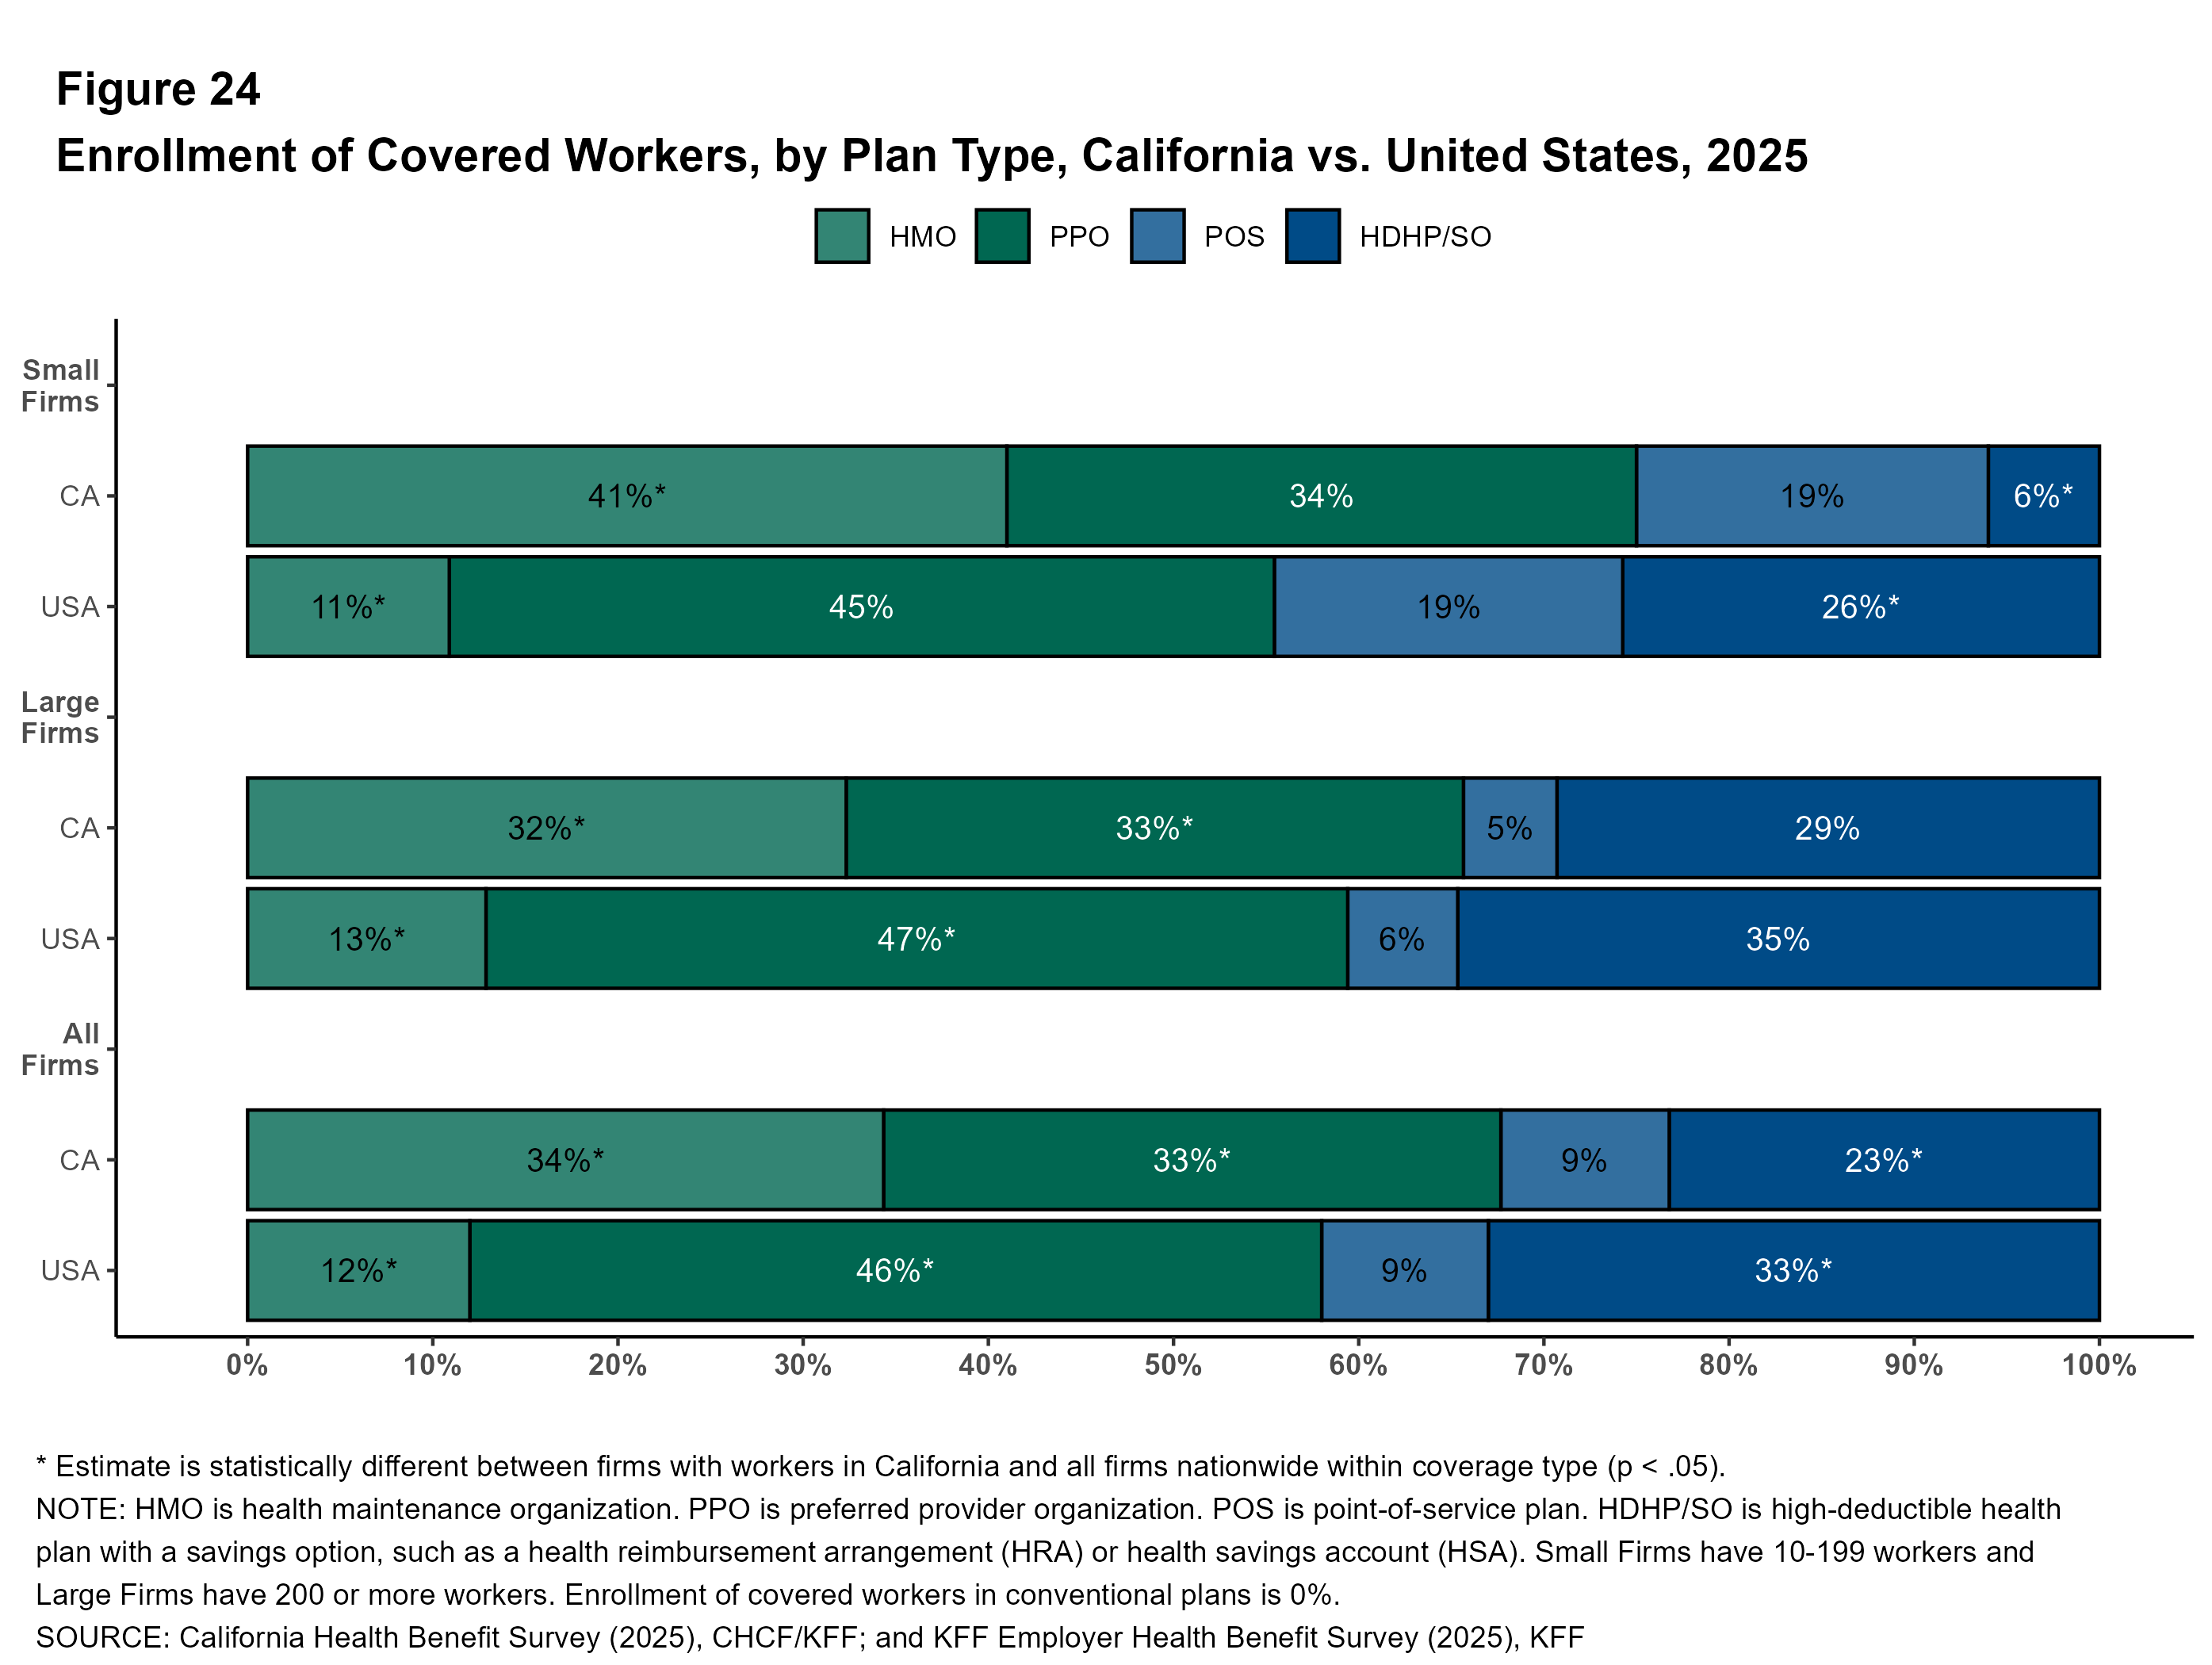
Among covered workers in California, about a third are enrolled in PPOs (33%) and in HMOs (34%). About a quarter are enrolled in an HDHP/SO (23%) and the remainder are enrolled in POS plans (9%). Covered workers in small firms are more likely to be enrolled in a POS plan than those at larger firms (19% vs. 5%).
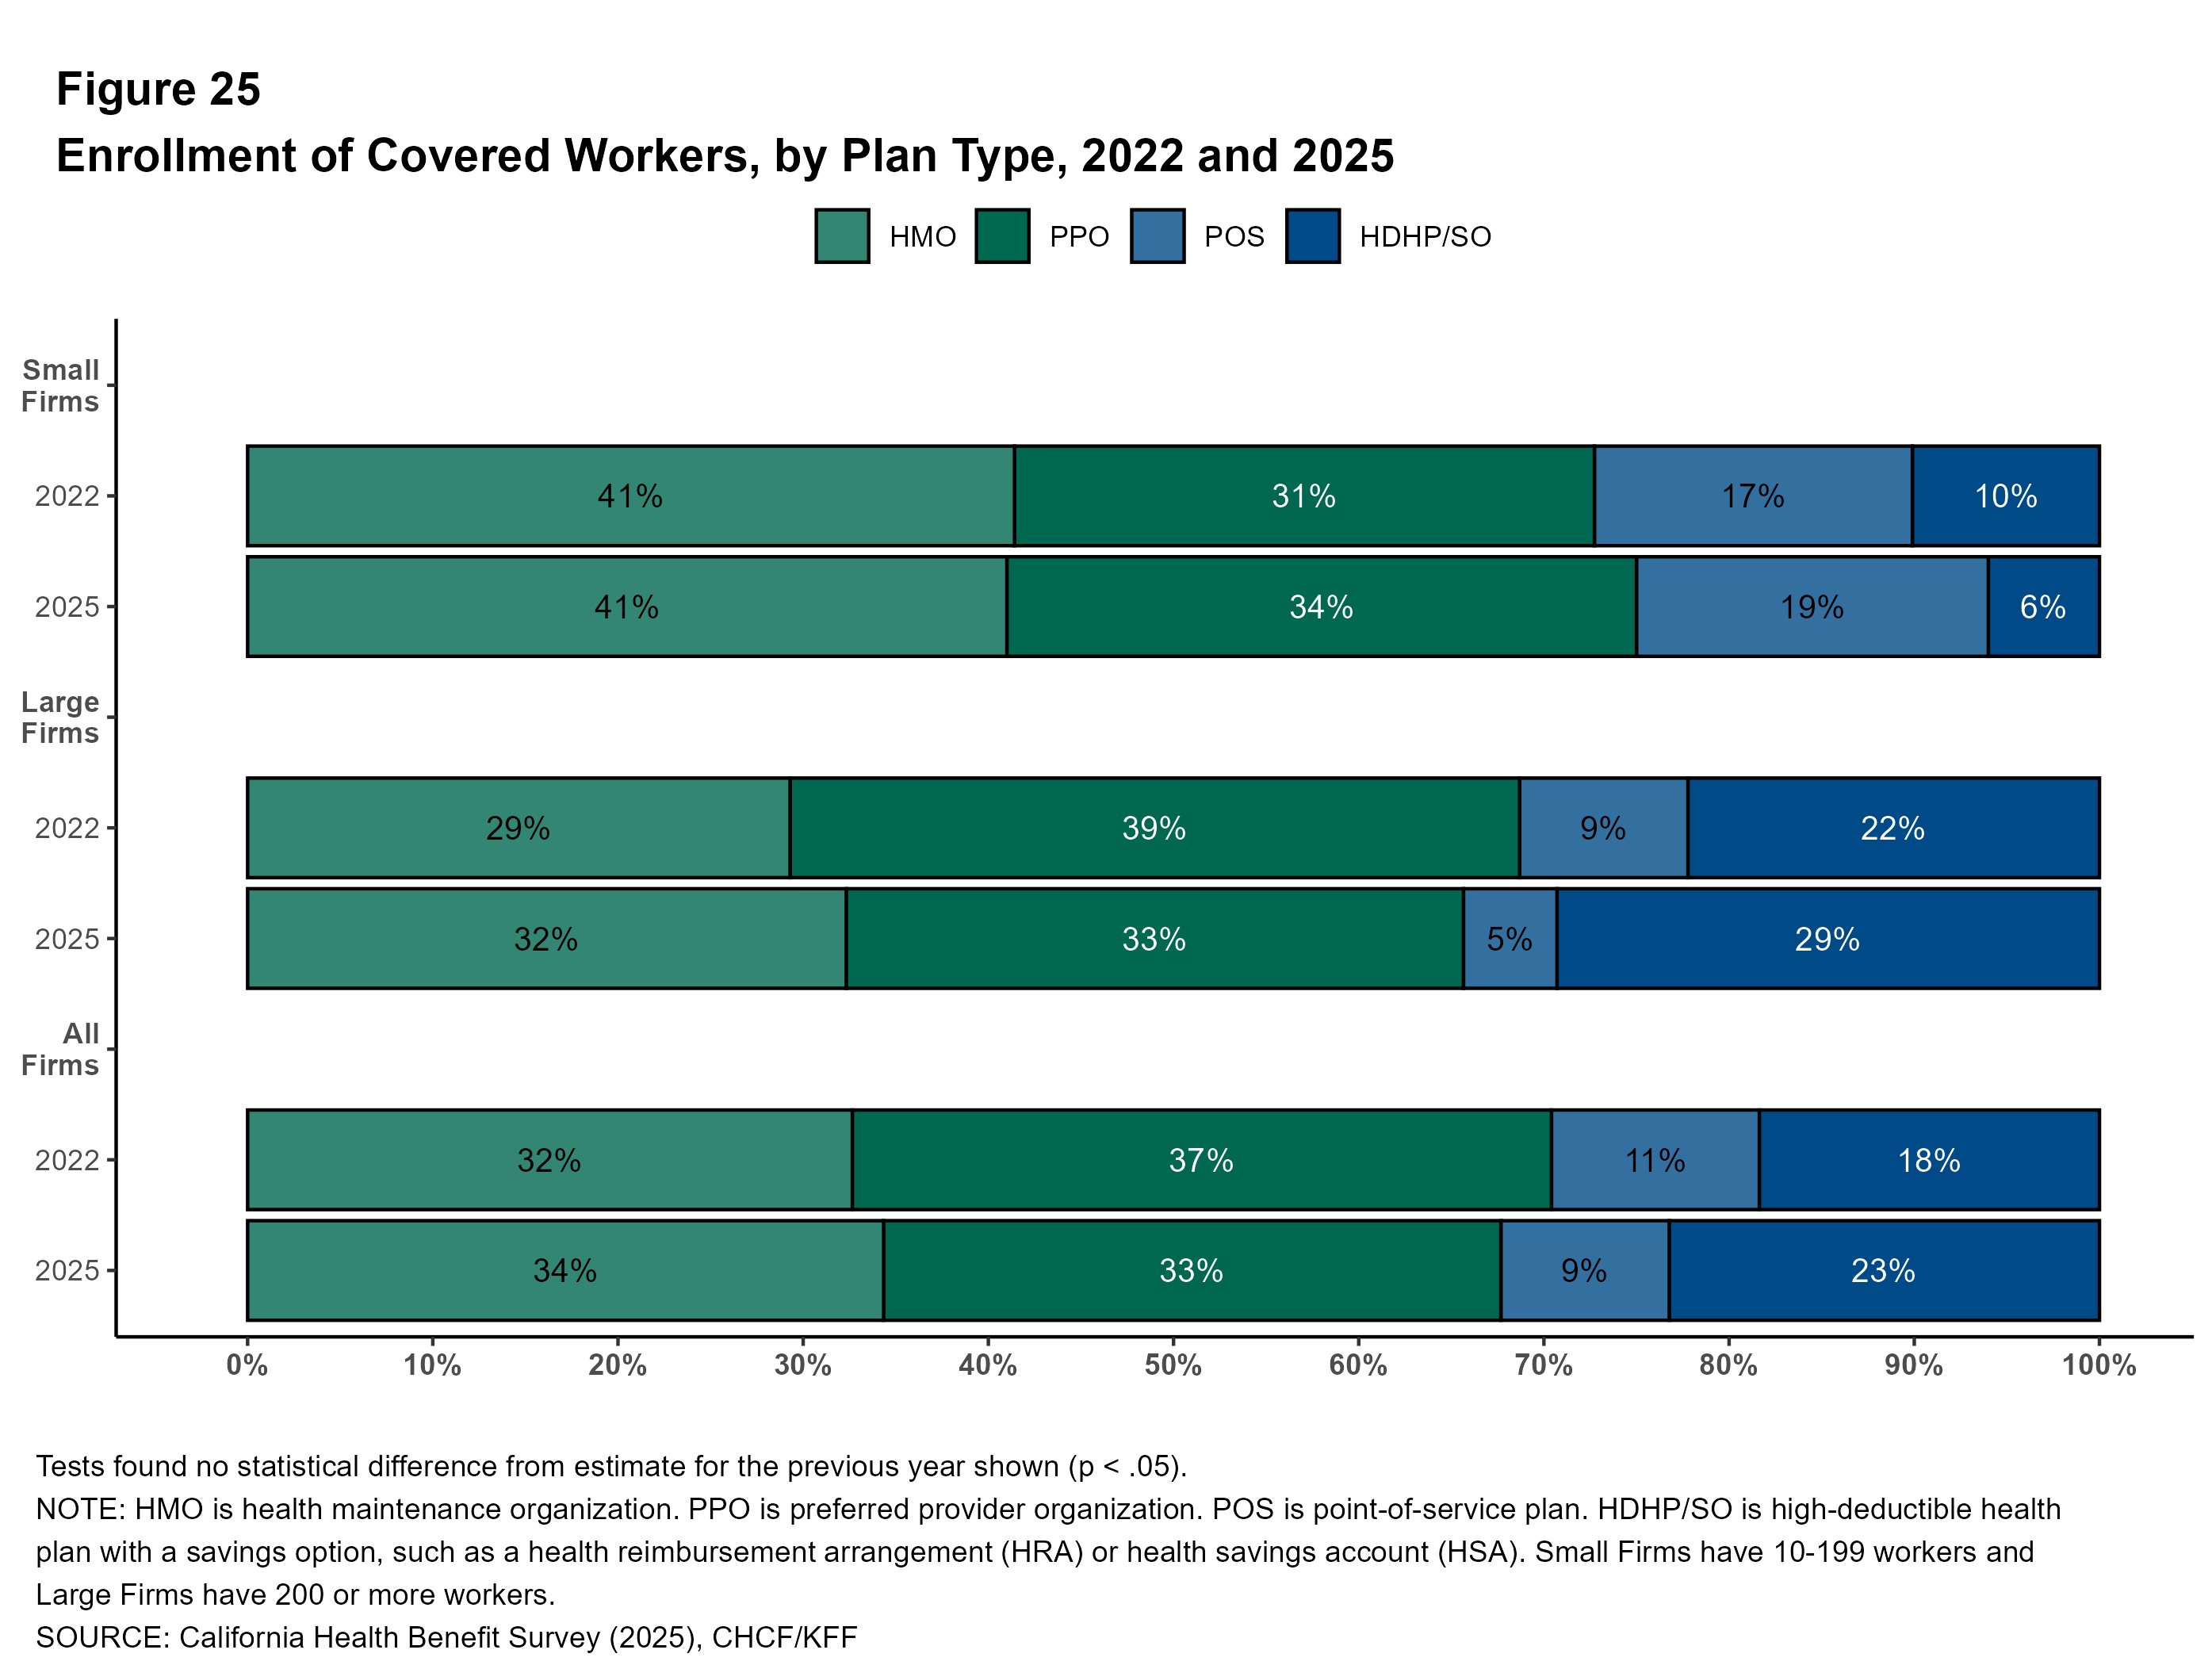
HMOs have long played a prominent role in California. Since 2022, the share of covered workers enrolled in HMOs has been relatively stable (32% in 2022 and 34% in 2025). In 2025, 41% of covered workers in small firms and 32% of covered workers in large firms are enrolled in HMOs.
The distribution of workers across plan types differs considerably from the national distribution, particularly for smaller firms. Covered workers in California are more likely to be enrolled in HMO plans and less likely to be enrolled in a PPO plan or an HDHP/SO than their counterparts nationally.
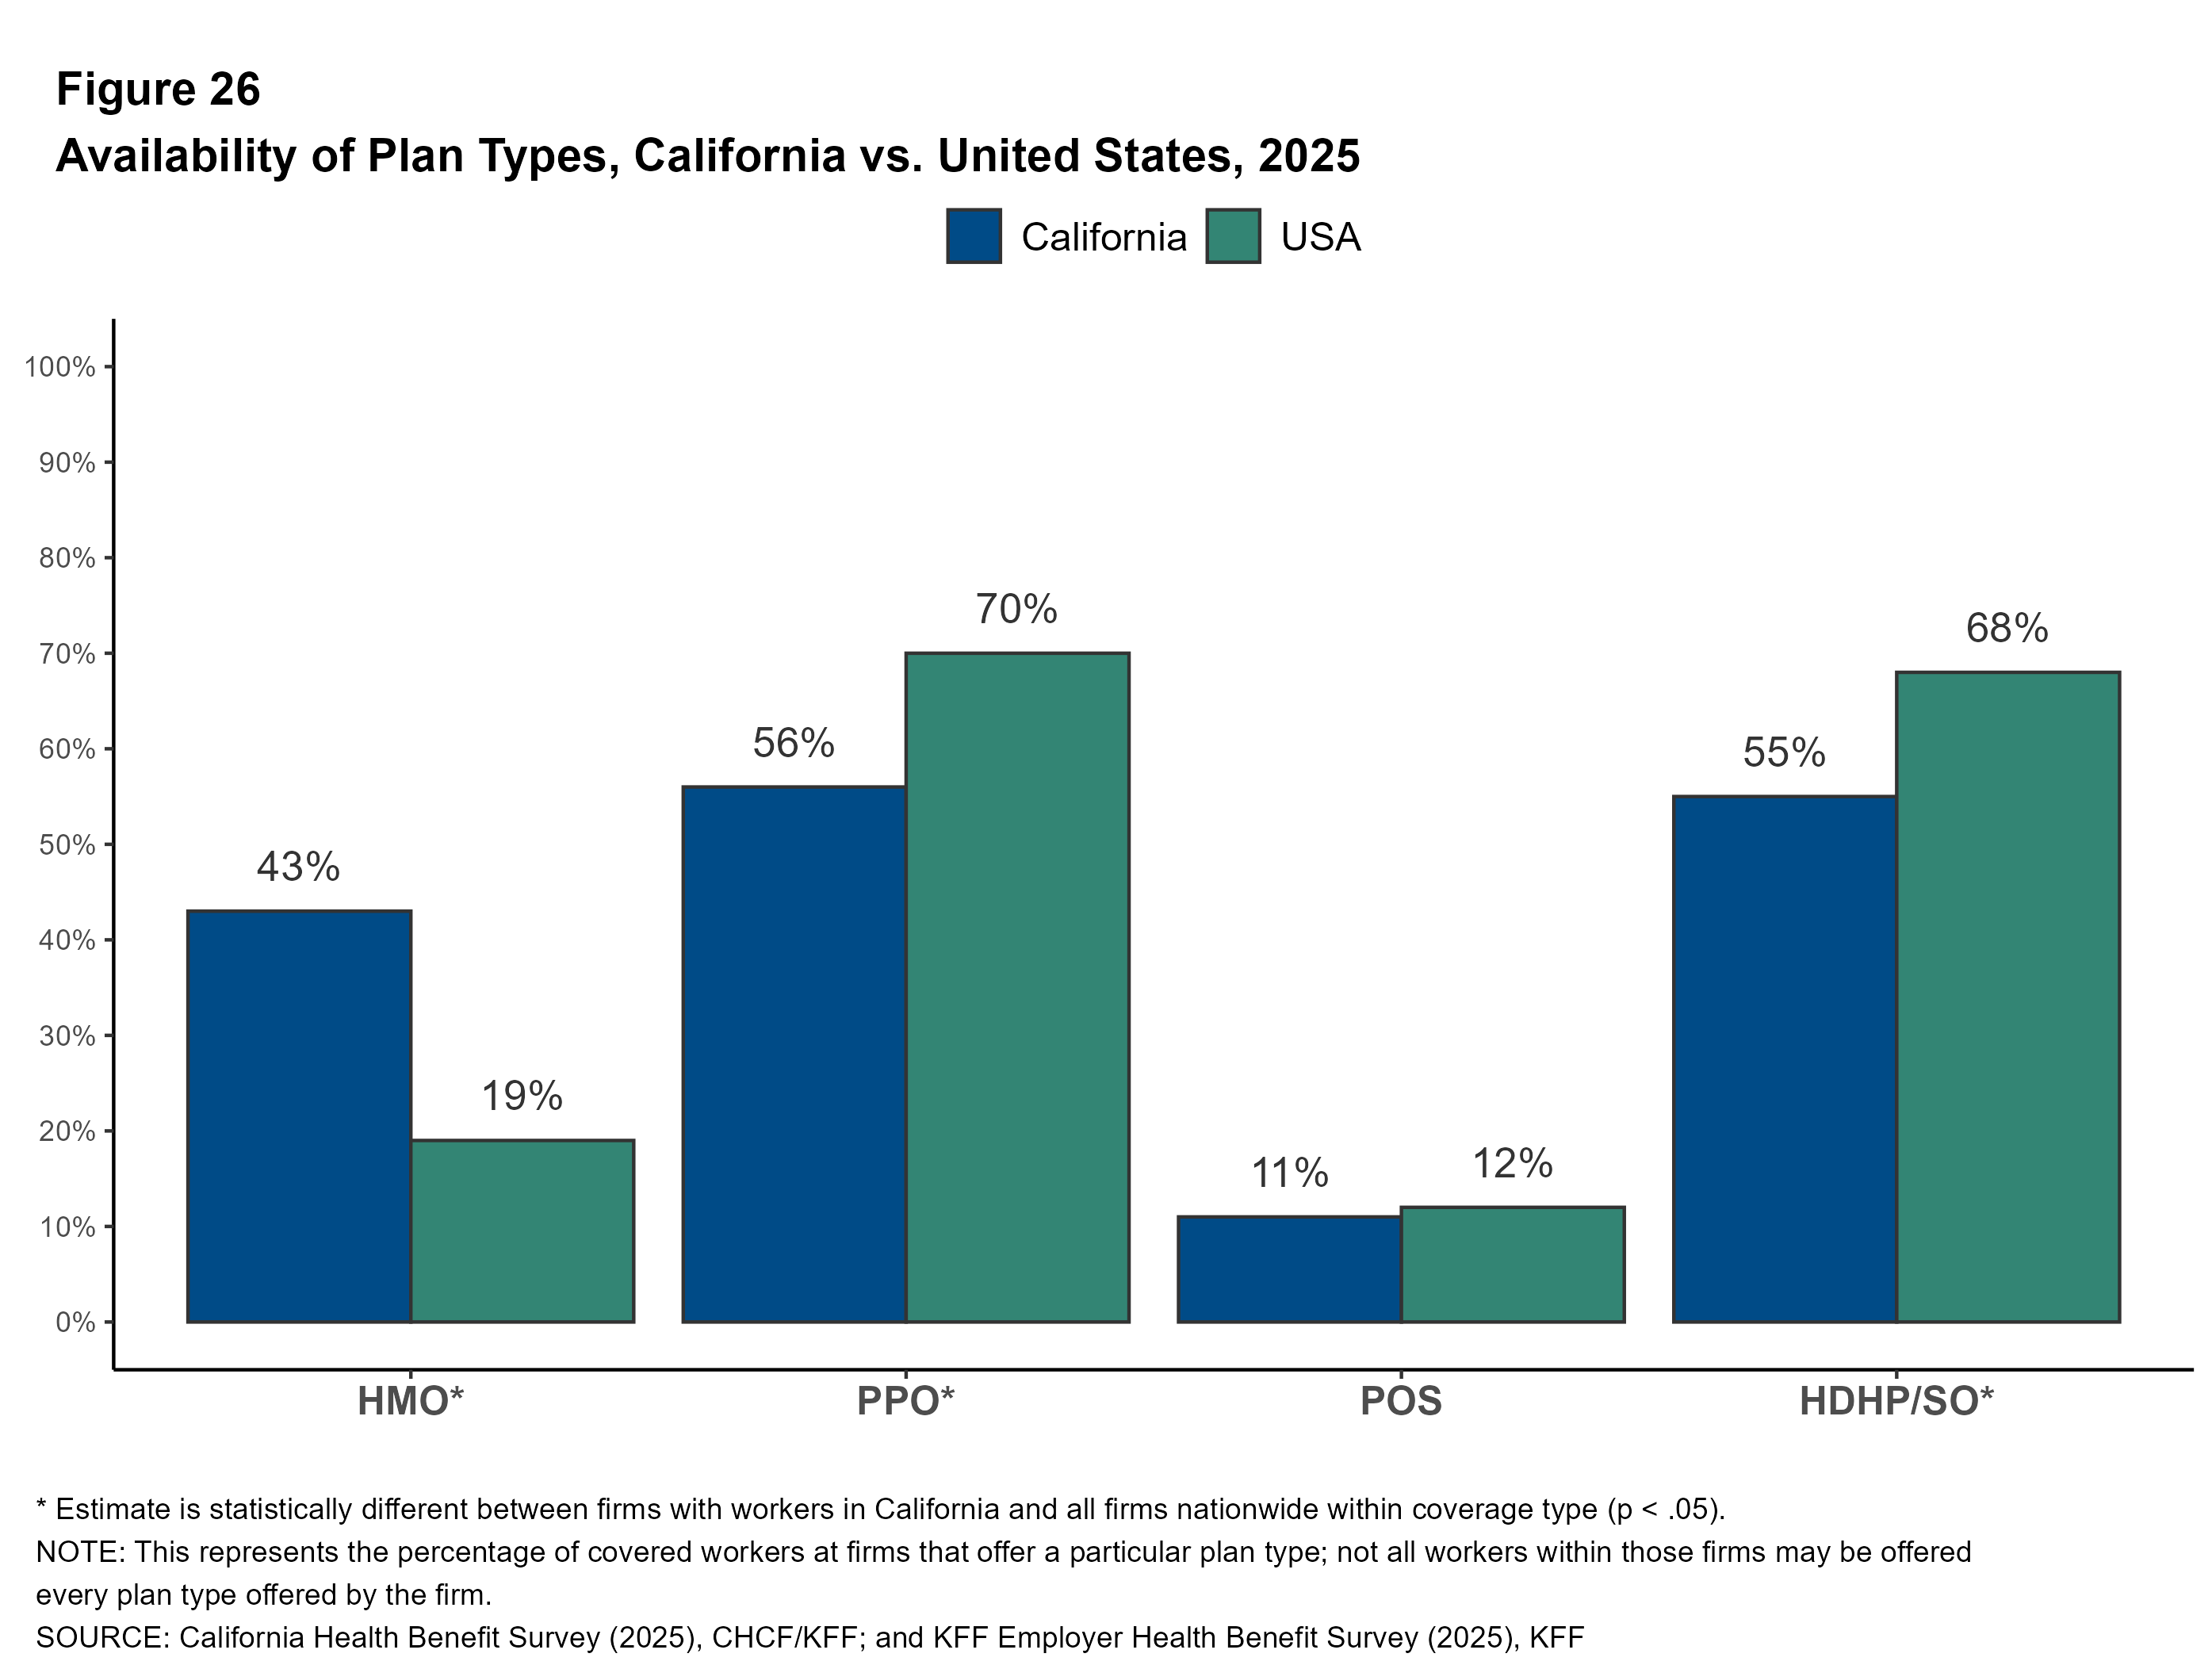
Availability of Plan Types
Many employers may consider offering a variety of plans, with different balances of cost sharing and premium contributions, to make offerings attractive and affordable to a range of employees. In some cases, workers may be able to choose between different plan type options. In other cases, some workers might be offered one type of plan at one location, while workers at another location are offered a different type of plan.
Covered workers in California are more likely to work at a firm that offers an HMO plan, and less likely to work at a firm that offers an HDHP/SO or PPO plan, compared to covered workers nationally. Plans offered by a given firm may not be available to all workers at that firm.
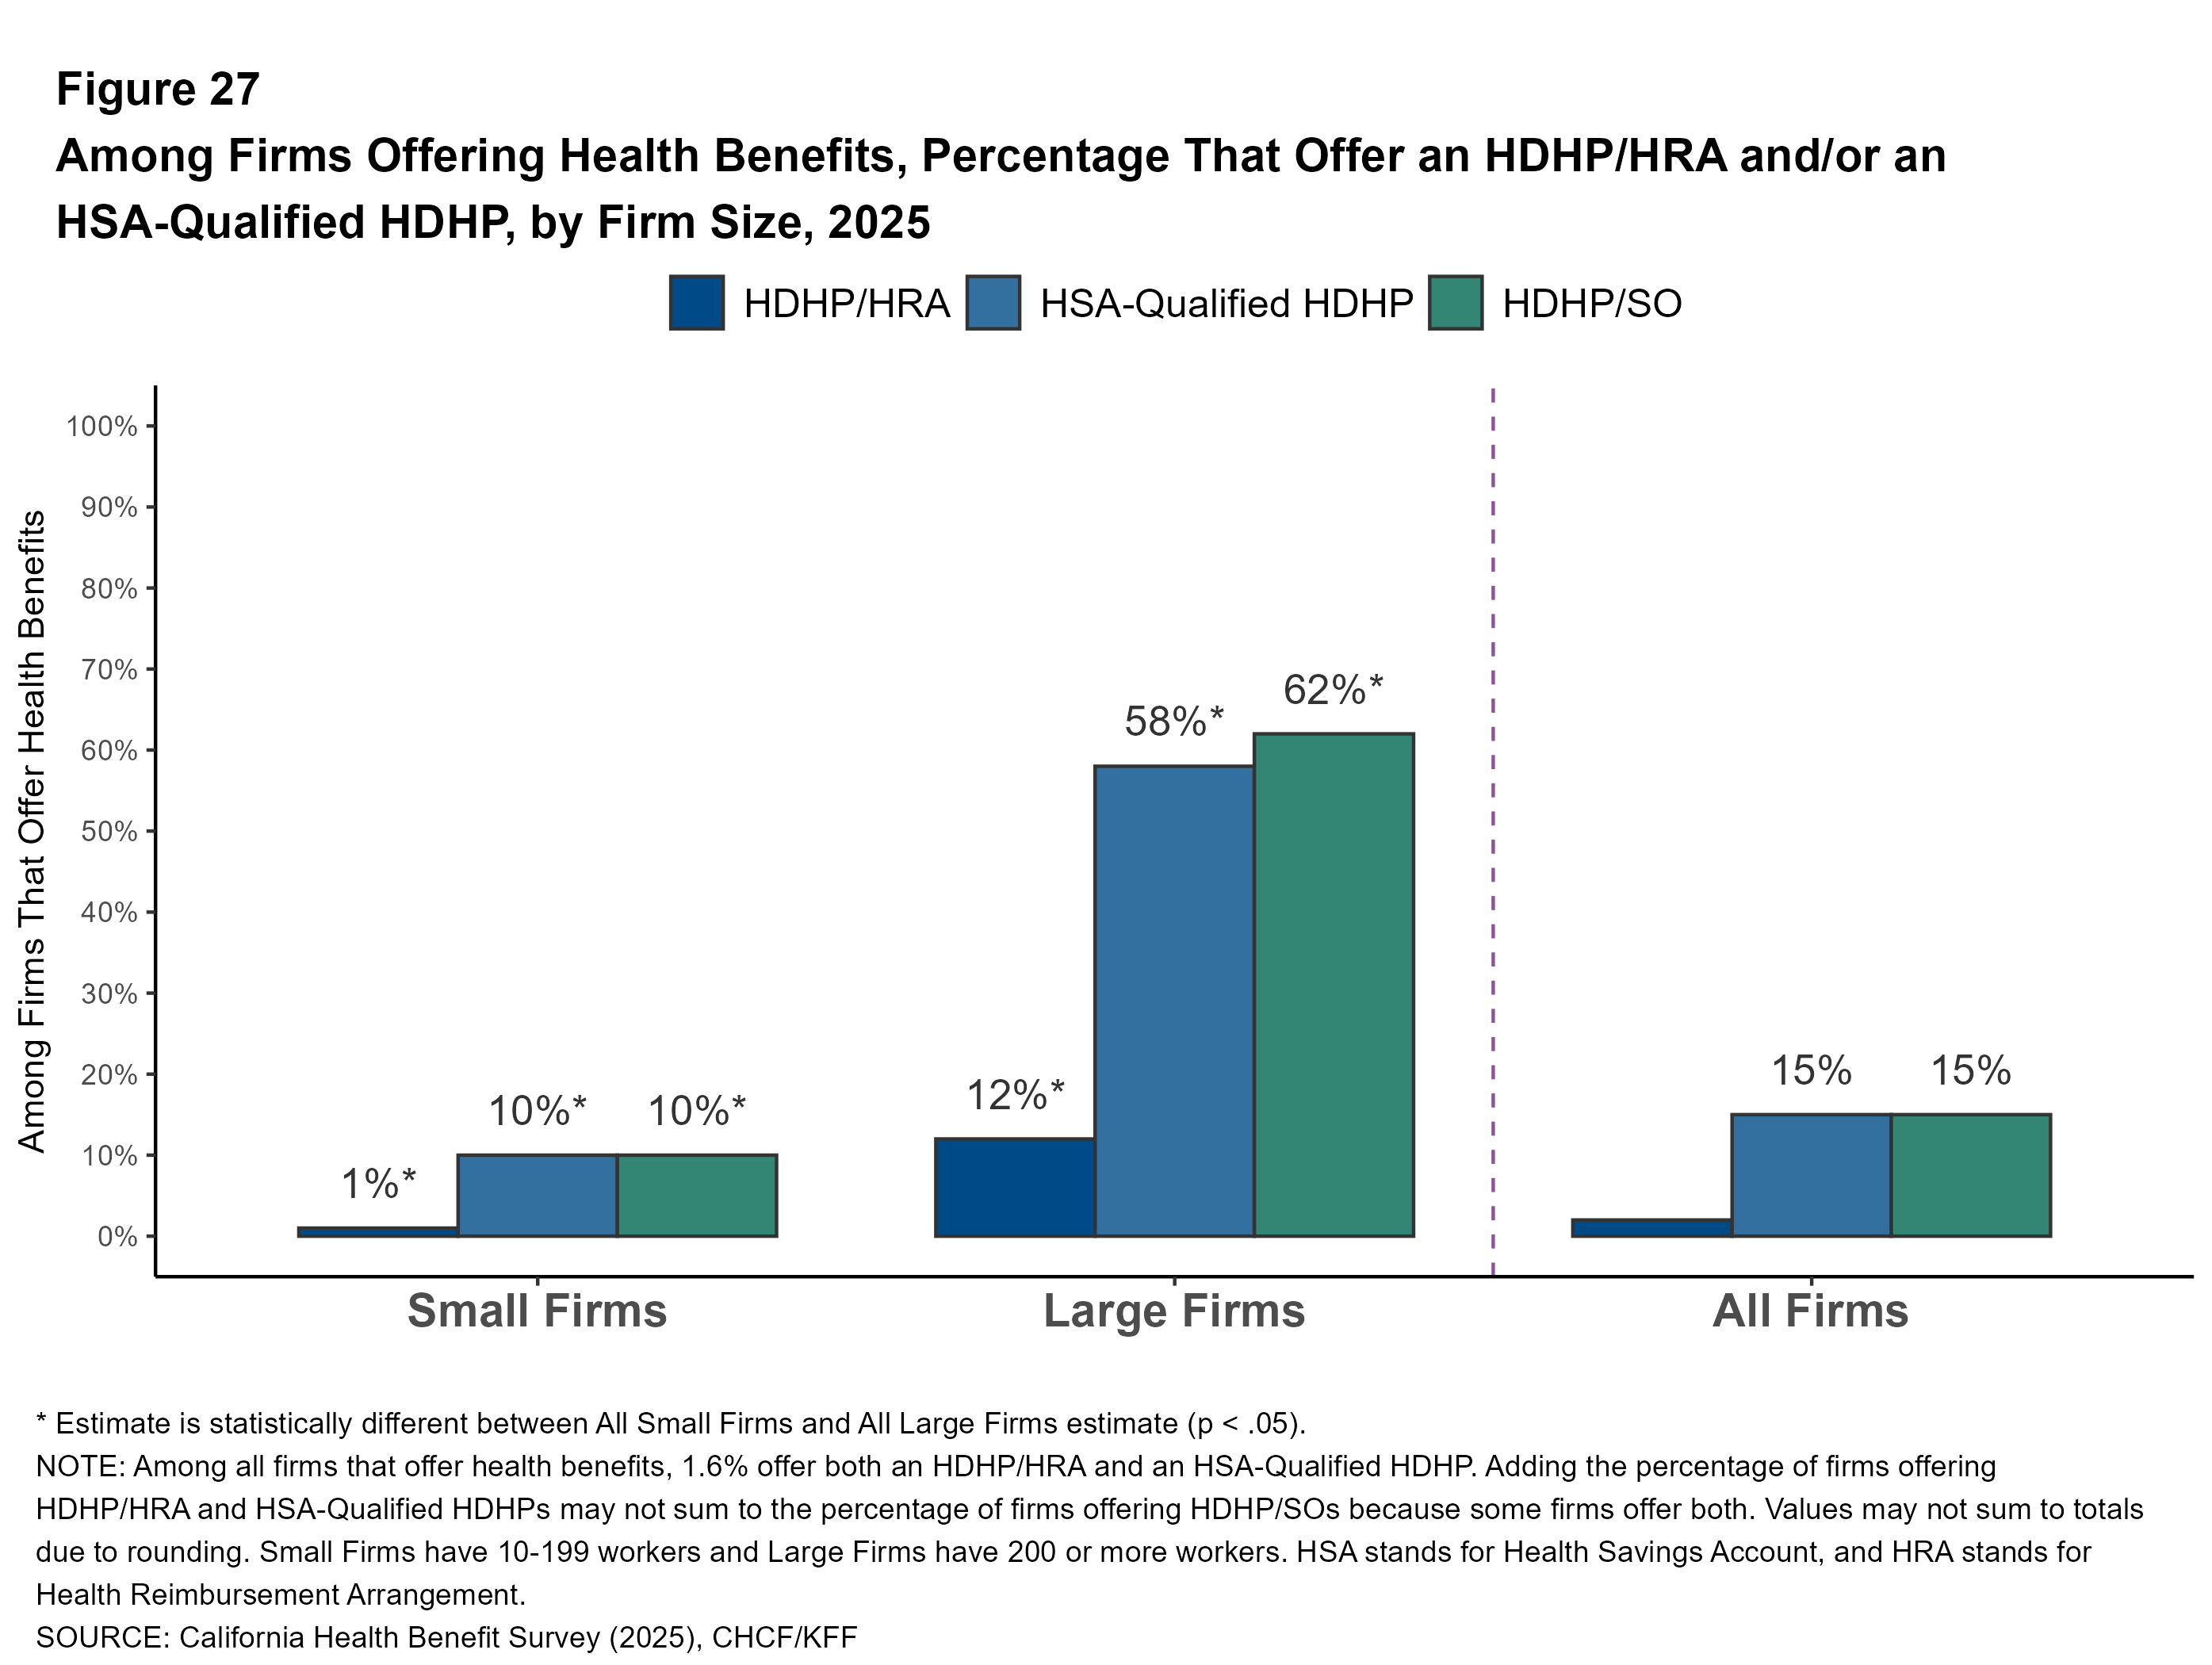
Availability of HSA-Qualified Plans: Health Savings Accounts (HSAs) are individual savings accounts used to pay for health care expenses. Individuals can open an HSA if they are enrolled in a qualified high-deductible health plan, one with a deductible of at least $1,600 for single coverage and $3,200 for family coverage in 2025. HSA-qualified plans have higher deductibles on average, and sometimes lower premiums, than other plan types. In some cases, employers make a contribution to the savings account, which the enrollee can use to offset cost sharing or other health spending. Over half of large firms in California offer an HSA-qualified plan to some workers, compared to just one in 10 smaller firms.
Cost Sharing
Employer-based health coverage typically requires a portion of costs to be paid out of pocket when health services are used. Most health plans have a deductible that enrollees must meet before the plan pays for the majority of care. After the deductible is met, plans typically require enrollees to pay a copayment (a specified dollar amount) or coinsurance (a percentage of the cost of services) for each service they use. The reported cost sharing figures are for covered workers using in-network services. Plan enrollees receiving services from providers that do not participate in plan networks often face higher cost sharing and may be responsible for charges that exceed the plan’s allowable amounts. Many plans may have complex plan designs, with different tiers of cost sharing for different providers.
General Annual Deductibles
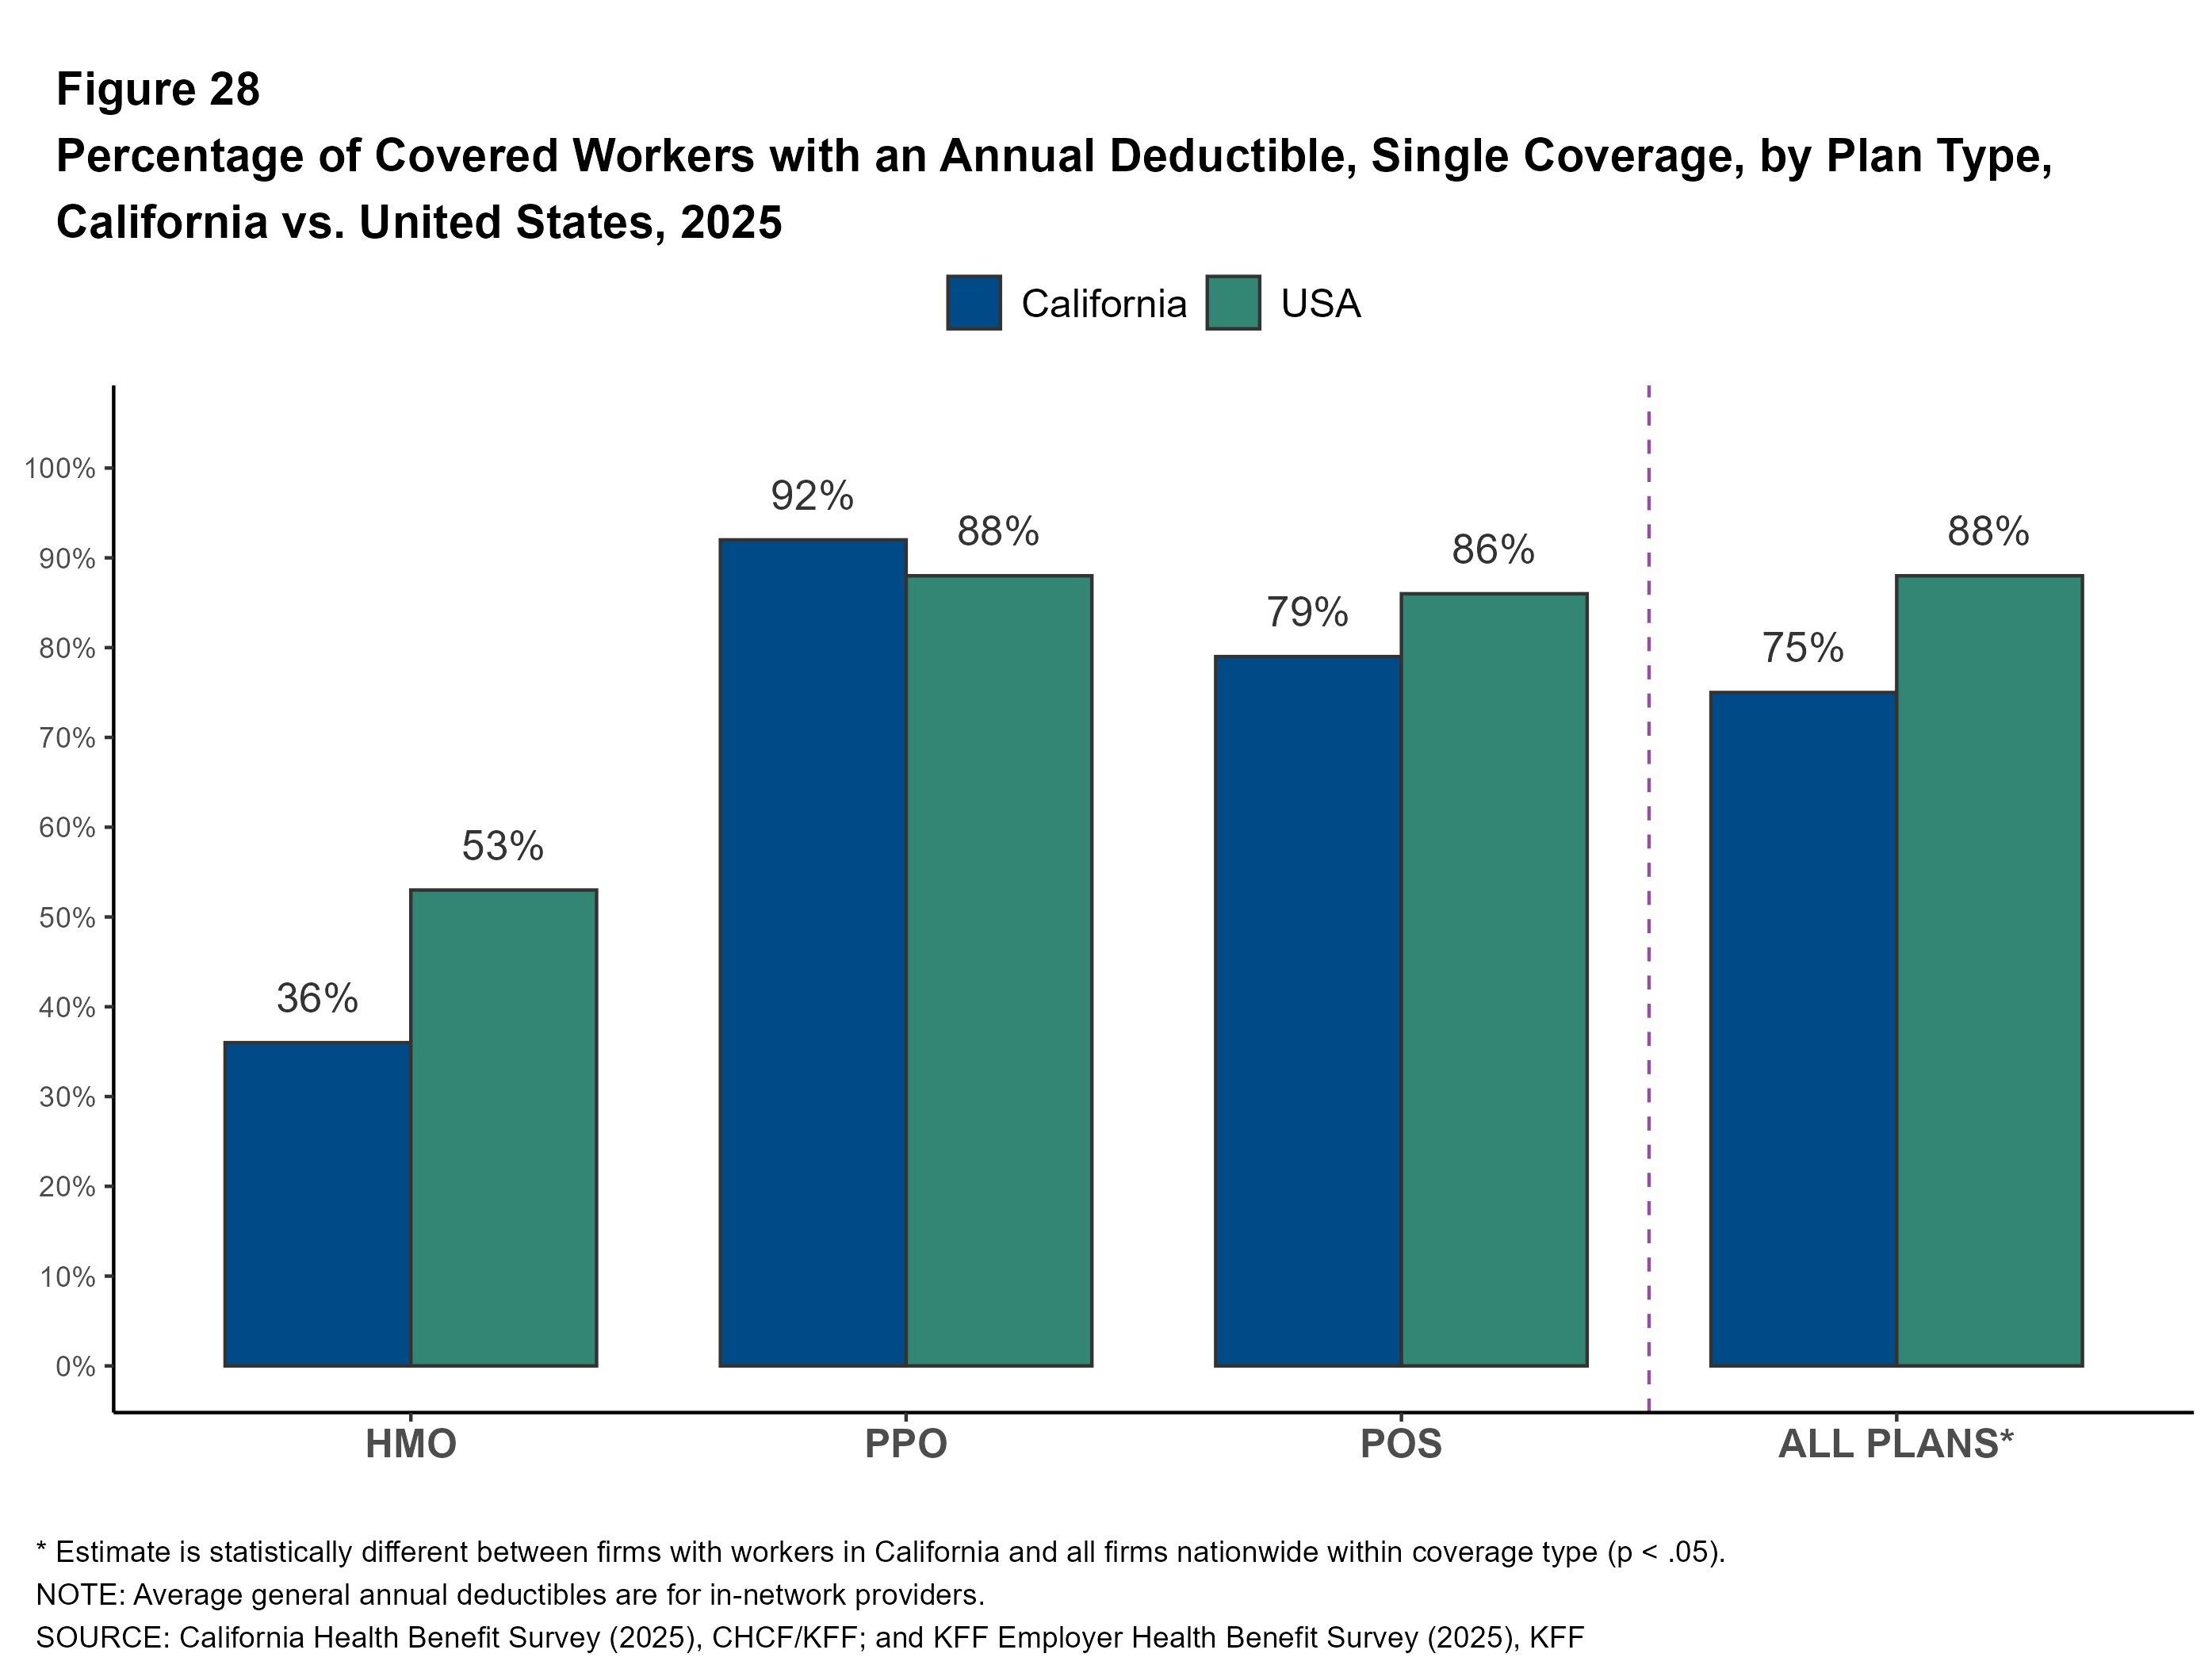
Prevalence of Deductibles: One feature of employer-sponsored plans that has gained prominence in recent years is deductibles. Seventy-five percent of covered workers in California are enrolled in a plan with a general annual deductible for single coverage, up from 68% in 2022. Similar shares of covered workers at small (76%) and large firms (75%) must meet a general annual deductible before the plan covers most services.
Covered workers in California are still less likely to be enrolled in a plan with a deductible than covered workers nationally (88% vs. 75%).
The likelihood of a plan having a general annual deductible varies by plan type. Thirty-six percent of California covered workers in HMOs have a general annual deductible for single coverage, compared to 79% of workers in POS plans and 92% of workers in PPO plans. A relatively small share of California covered workers enrolled in HMO plans sponsored by large firms are required to meet a deductible (25%).
Across plan types, the share of covered workers with a deductible is similar in California and nationally. However, lower enrollment in HDHP/SOs and higher enrollment in HMOs in California contributes to the overall lower prevalence of deductibles in the state compared to the national average.

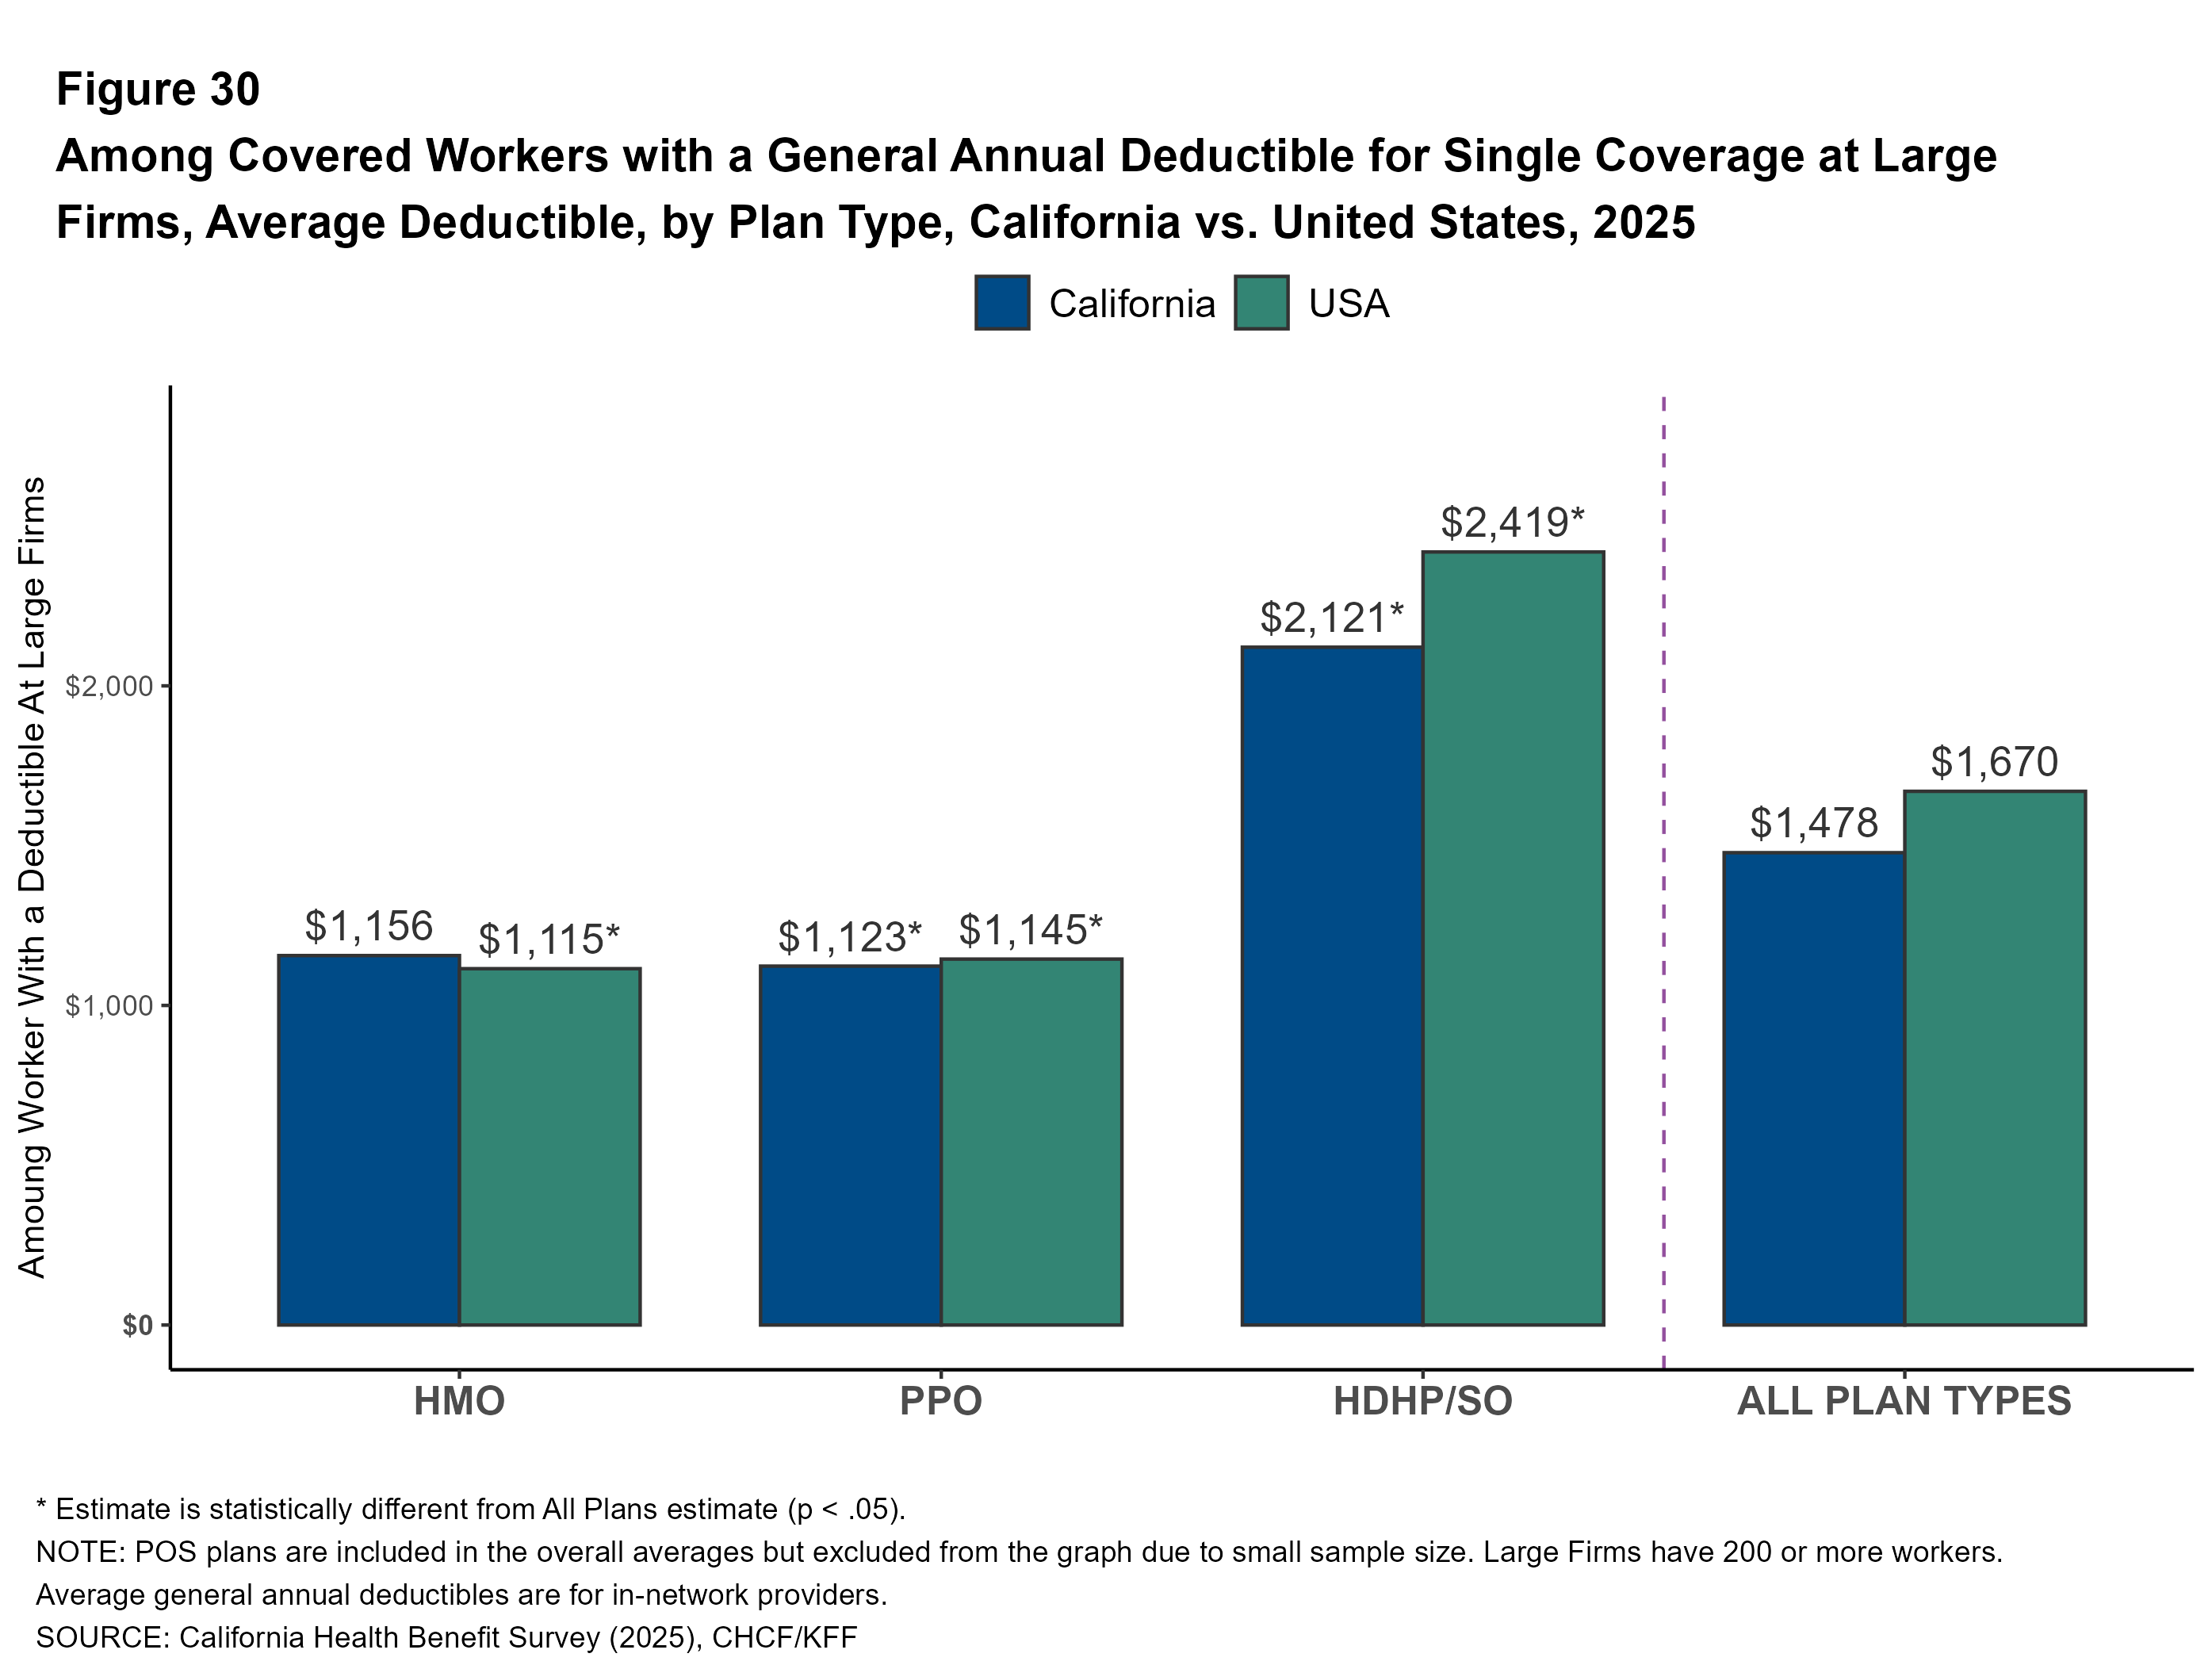
Average General Annual Deductible Amounts: For workers in California with single coverage in a plan with a general annual deductible, the average annual deductible is $1,620, similar to the average deductible in 2022 ($1,466).
Covered workers in HDHP/SO plans typically face higher deductibles than covered workers in other plan types, both in California and across the country. For covered workers in California at large firms, the average deductibles for single coverage are $1,156 in HMOs, $1,123 in PPOs, and $2,121 in HDHP/SOs.
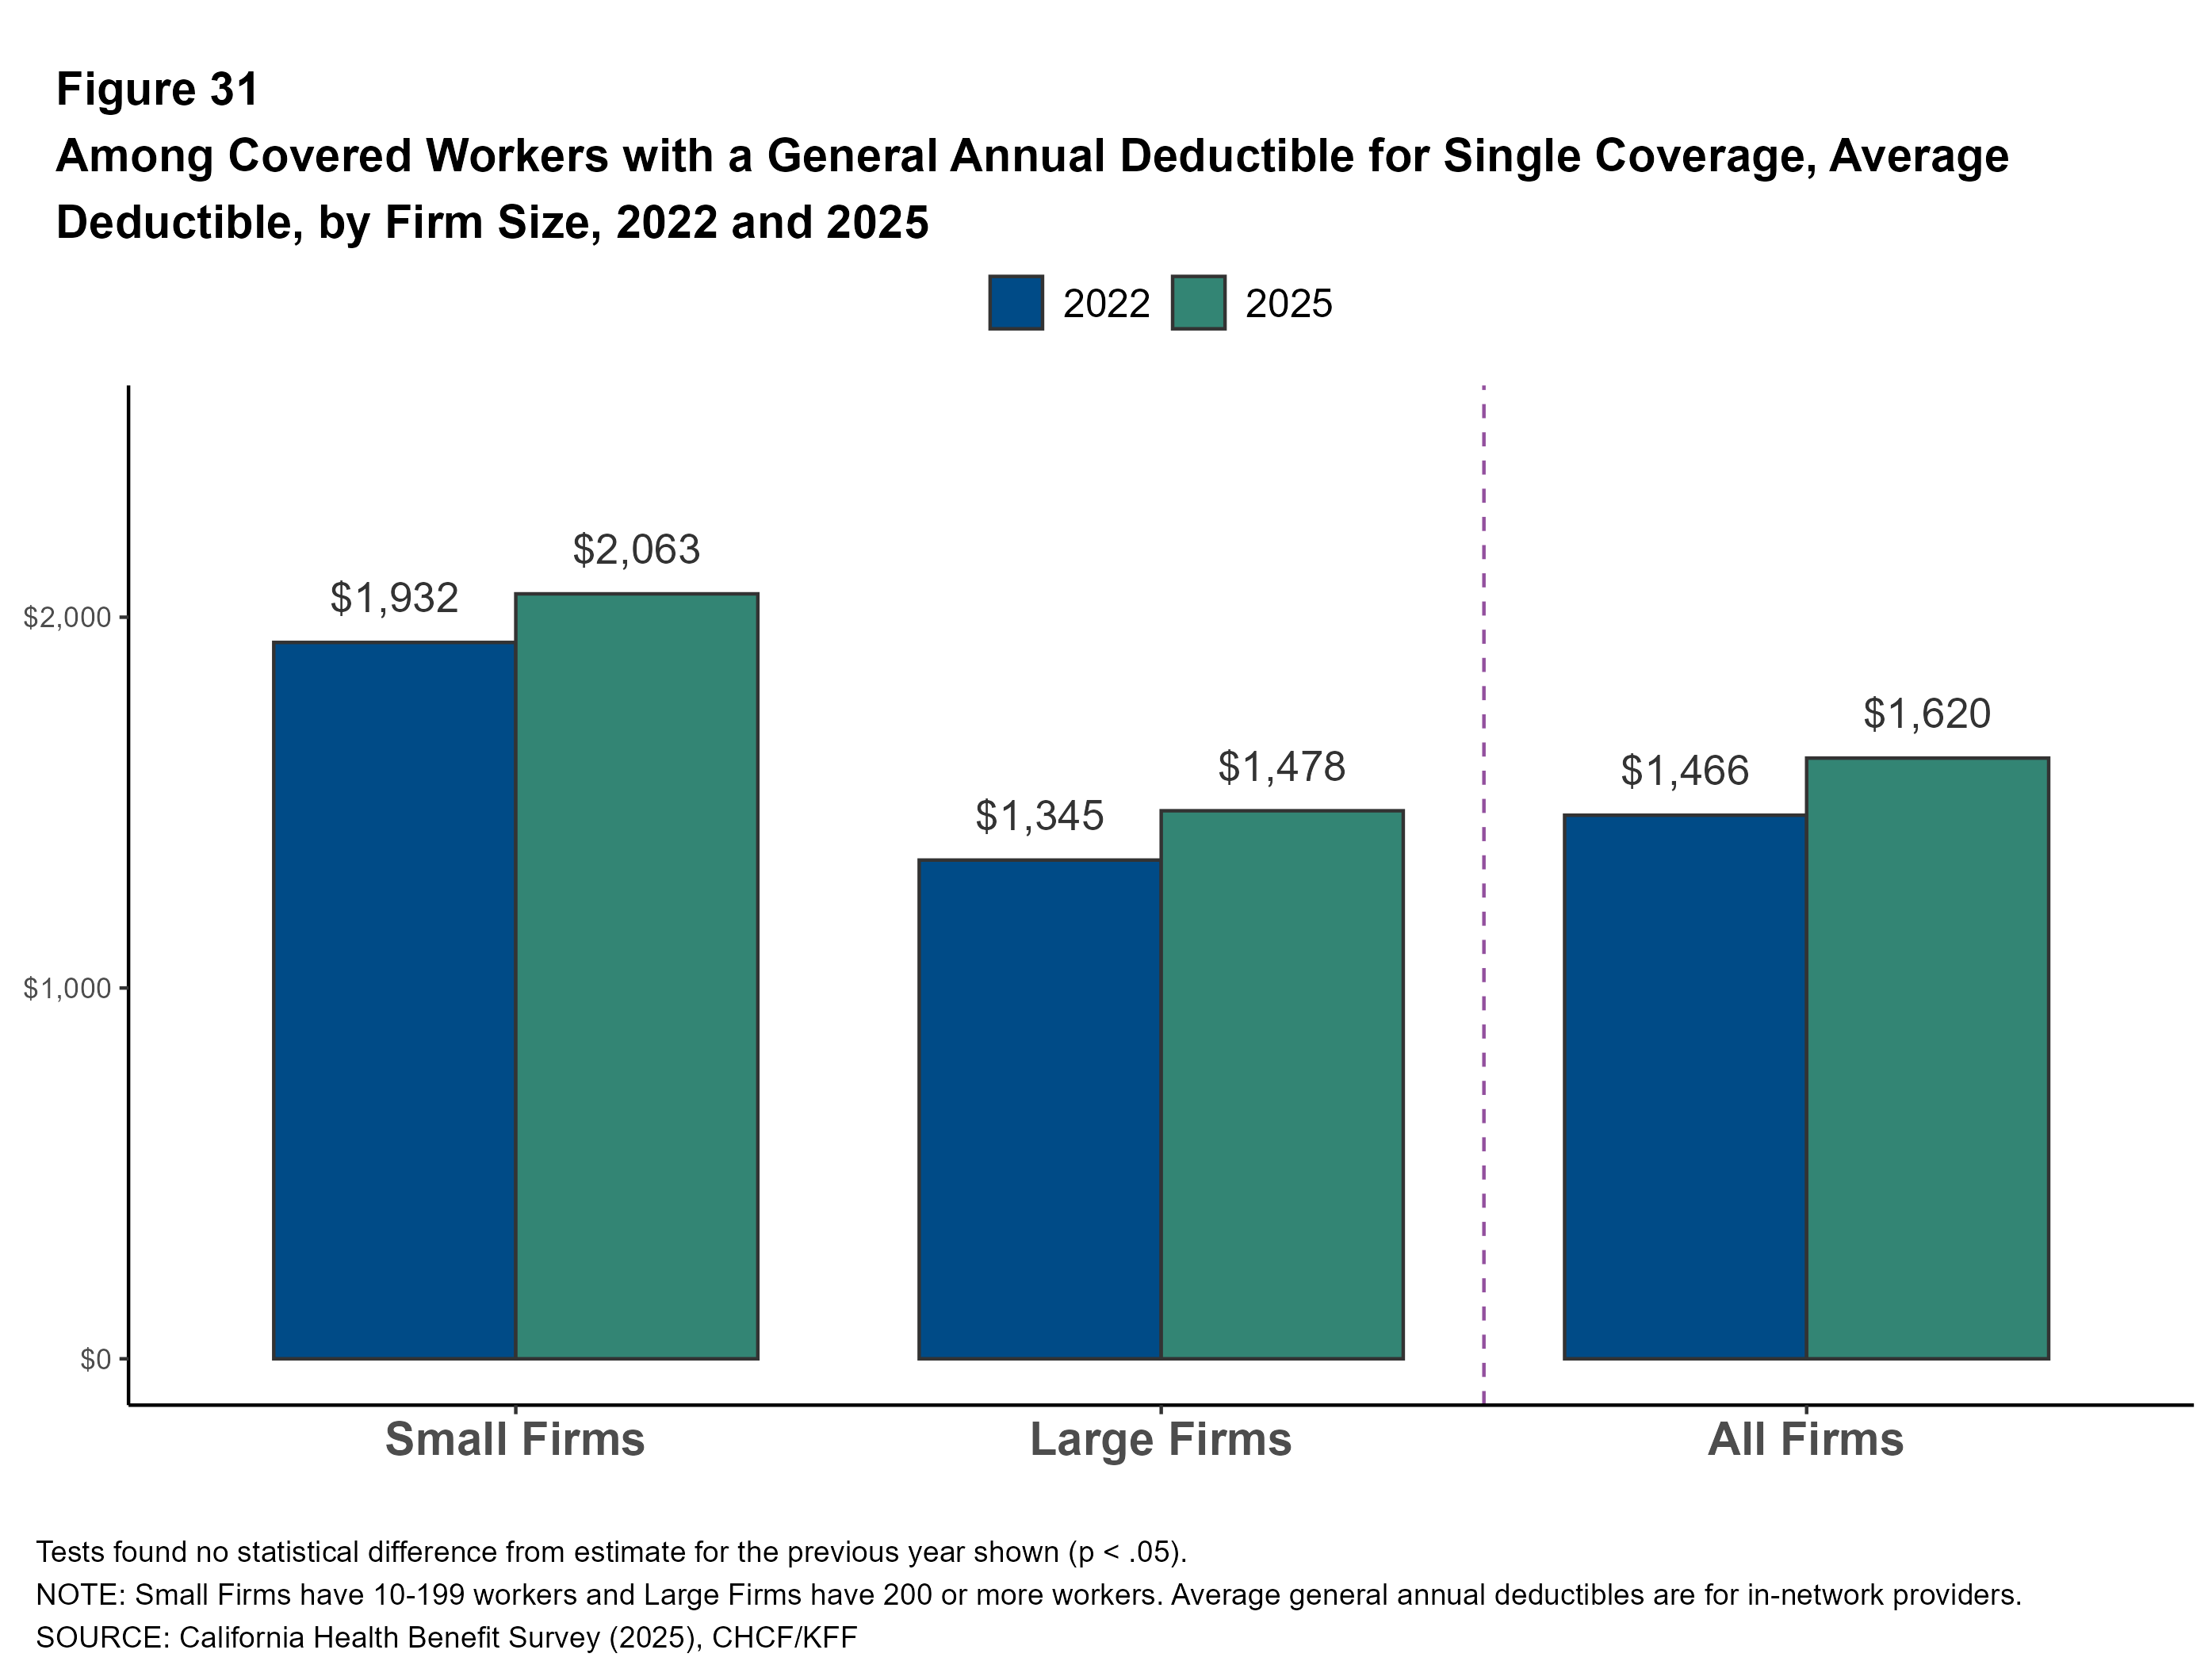
Though covered workers at small and large firms are similarly likely to face a deductible, average deductibles are significantly higher at small firms. Across all plan types, for California covered workers in plans with a general annual deductible, the average deductible for single coverage at firms with 10 to 199 workers is $2,063, higher than the average deductible at larger firms ($1,478).
California covered workers are both less likely to face a deductible and more likely to pay a lower average deductible (when they have one) for single coverage, compared to workers nationally ($1,620 vs. $1,886). Covered workers at small California firms who face a deductible also have lower average deductibles than workers at small firms nationally ($2,063 vs. $2,631).
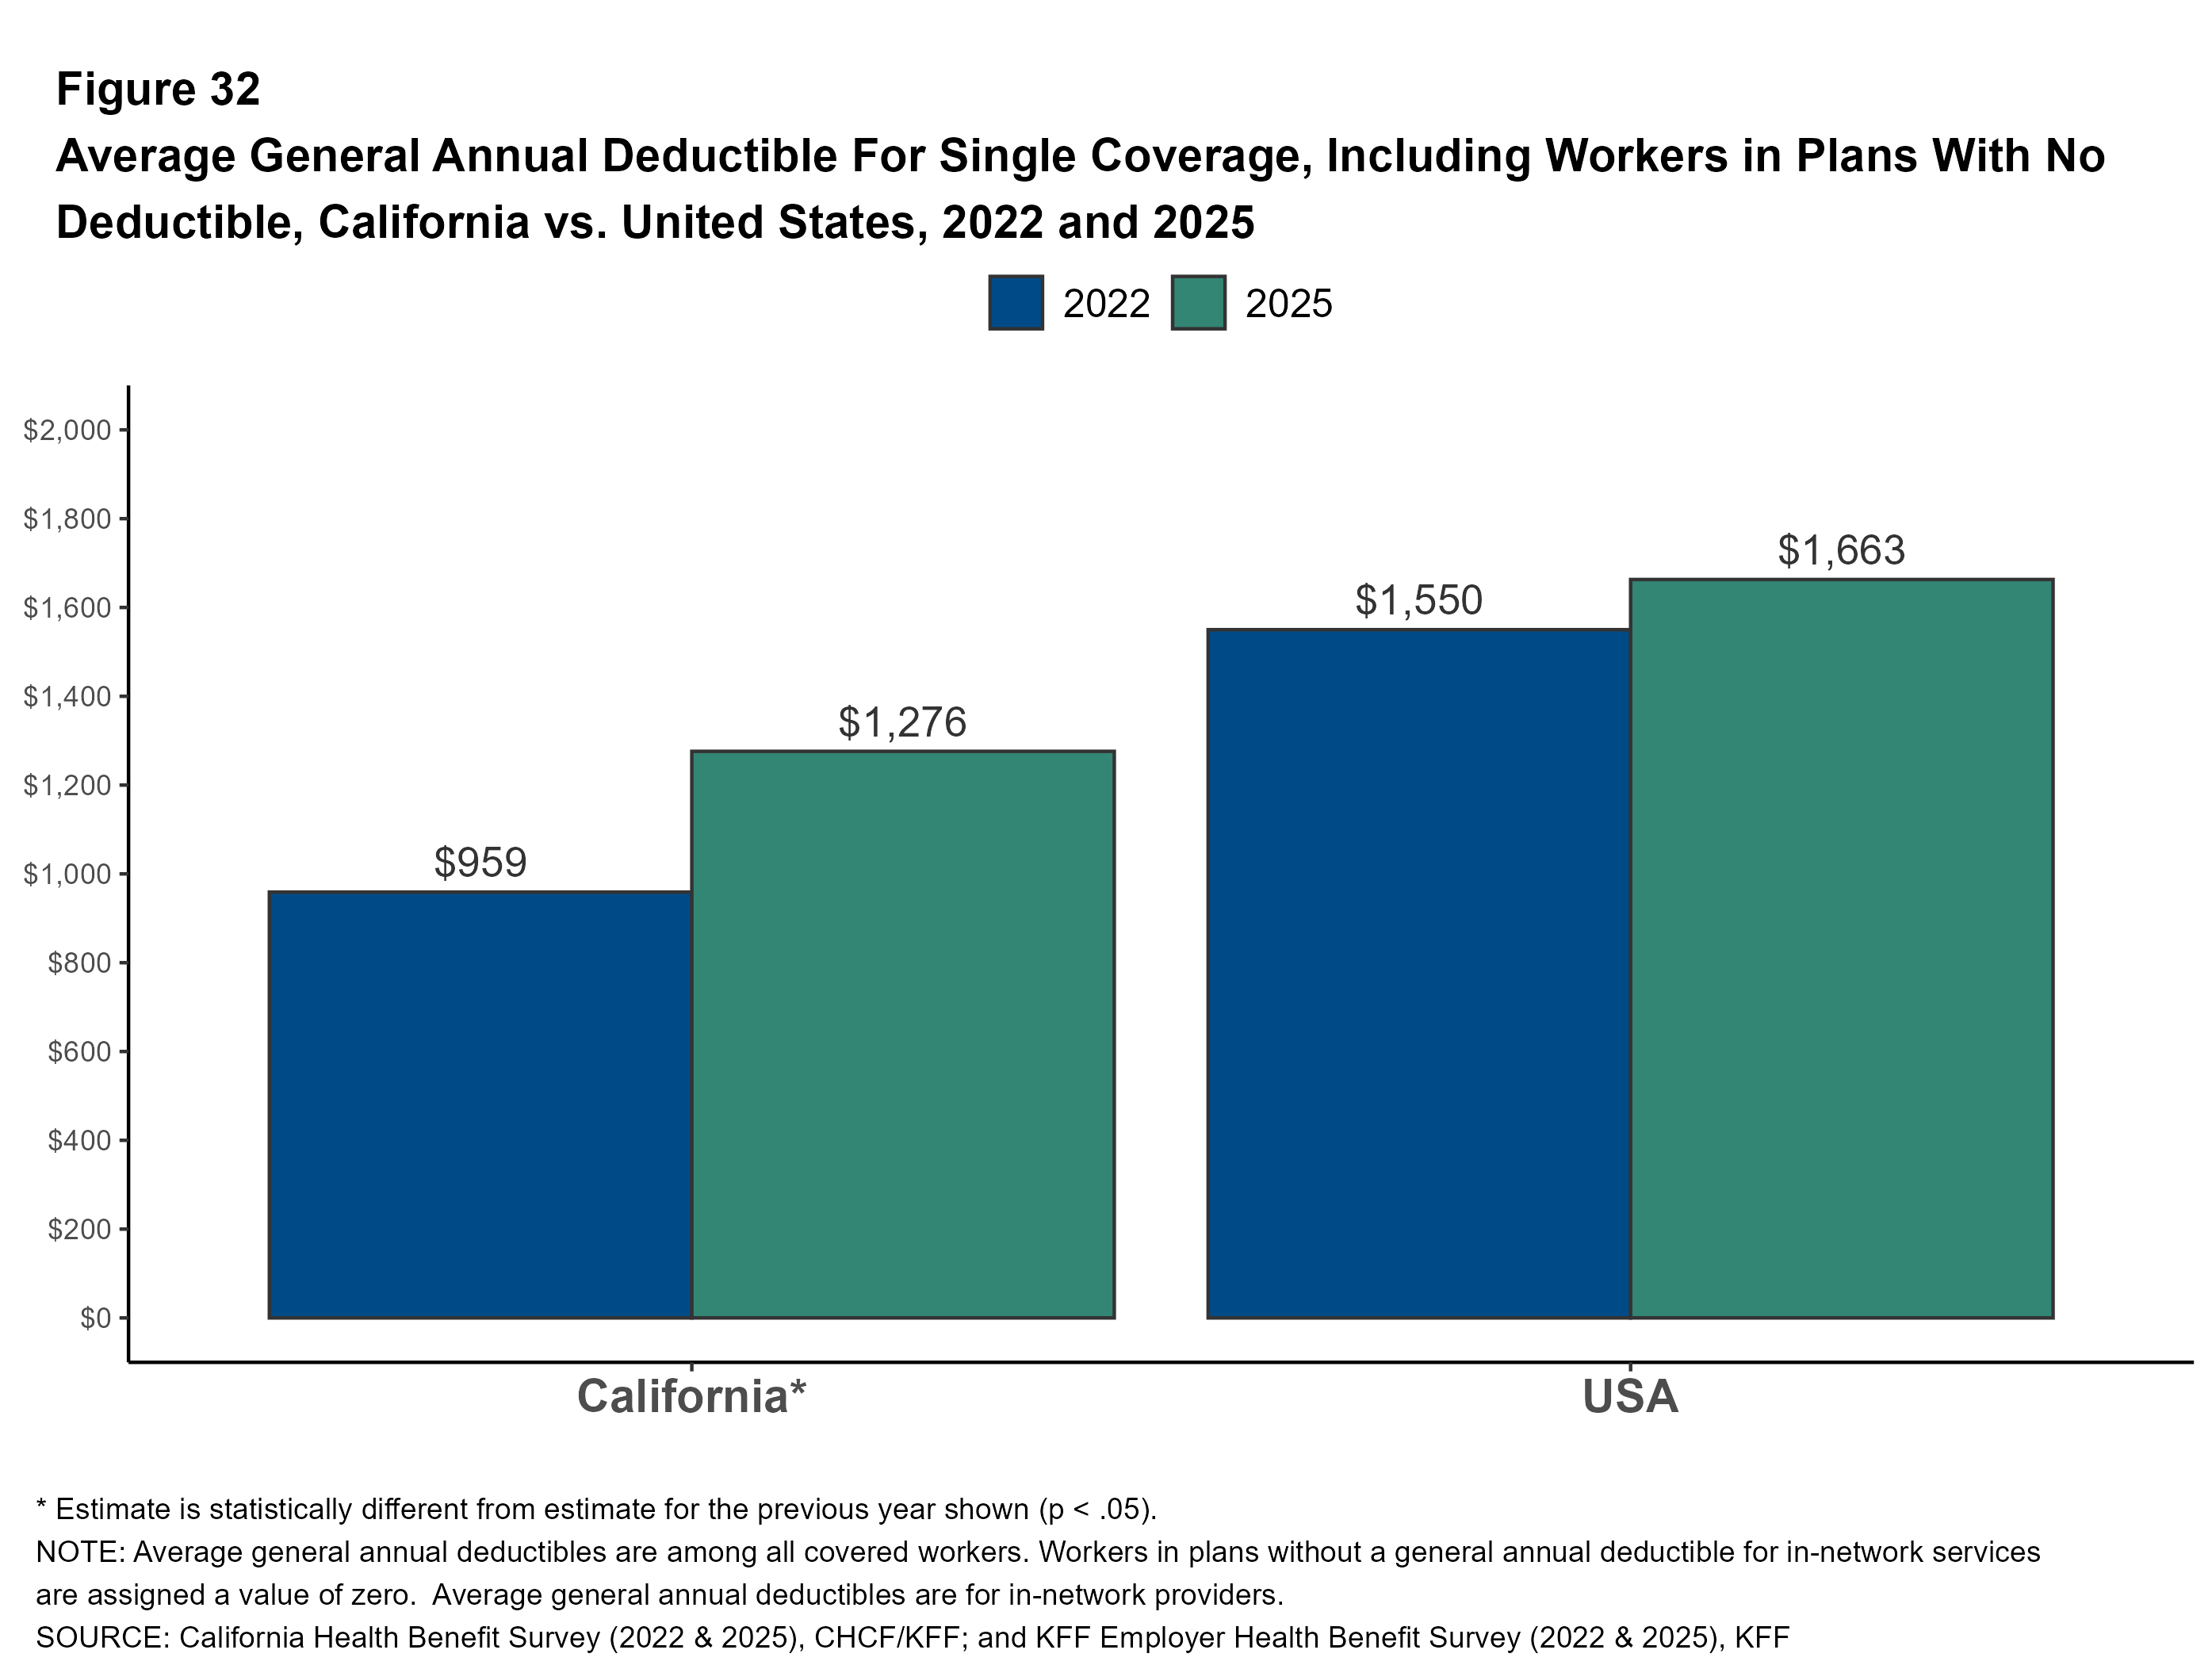
The lower prevalence of deductibles and the lower average deductible amount in California can be assessed by assigning a value of zero to covered workers enrolled in plans without a deductible and calculating the resulting average. This measure reflects both the share of workers facing deductibles and the size of those deductibles. Using this approach, the average general annual deductible for single coverage among all covered workers (including those without a deductible) in California is $1,276, compared to $1,663 nationally. In California, this average increased 10% annually, rising from $959 to $1,276 since 2022. This change represents a 33% increase in the average deductible among all covered workers.
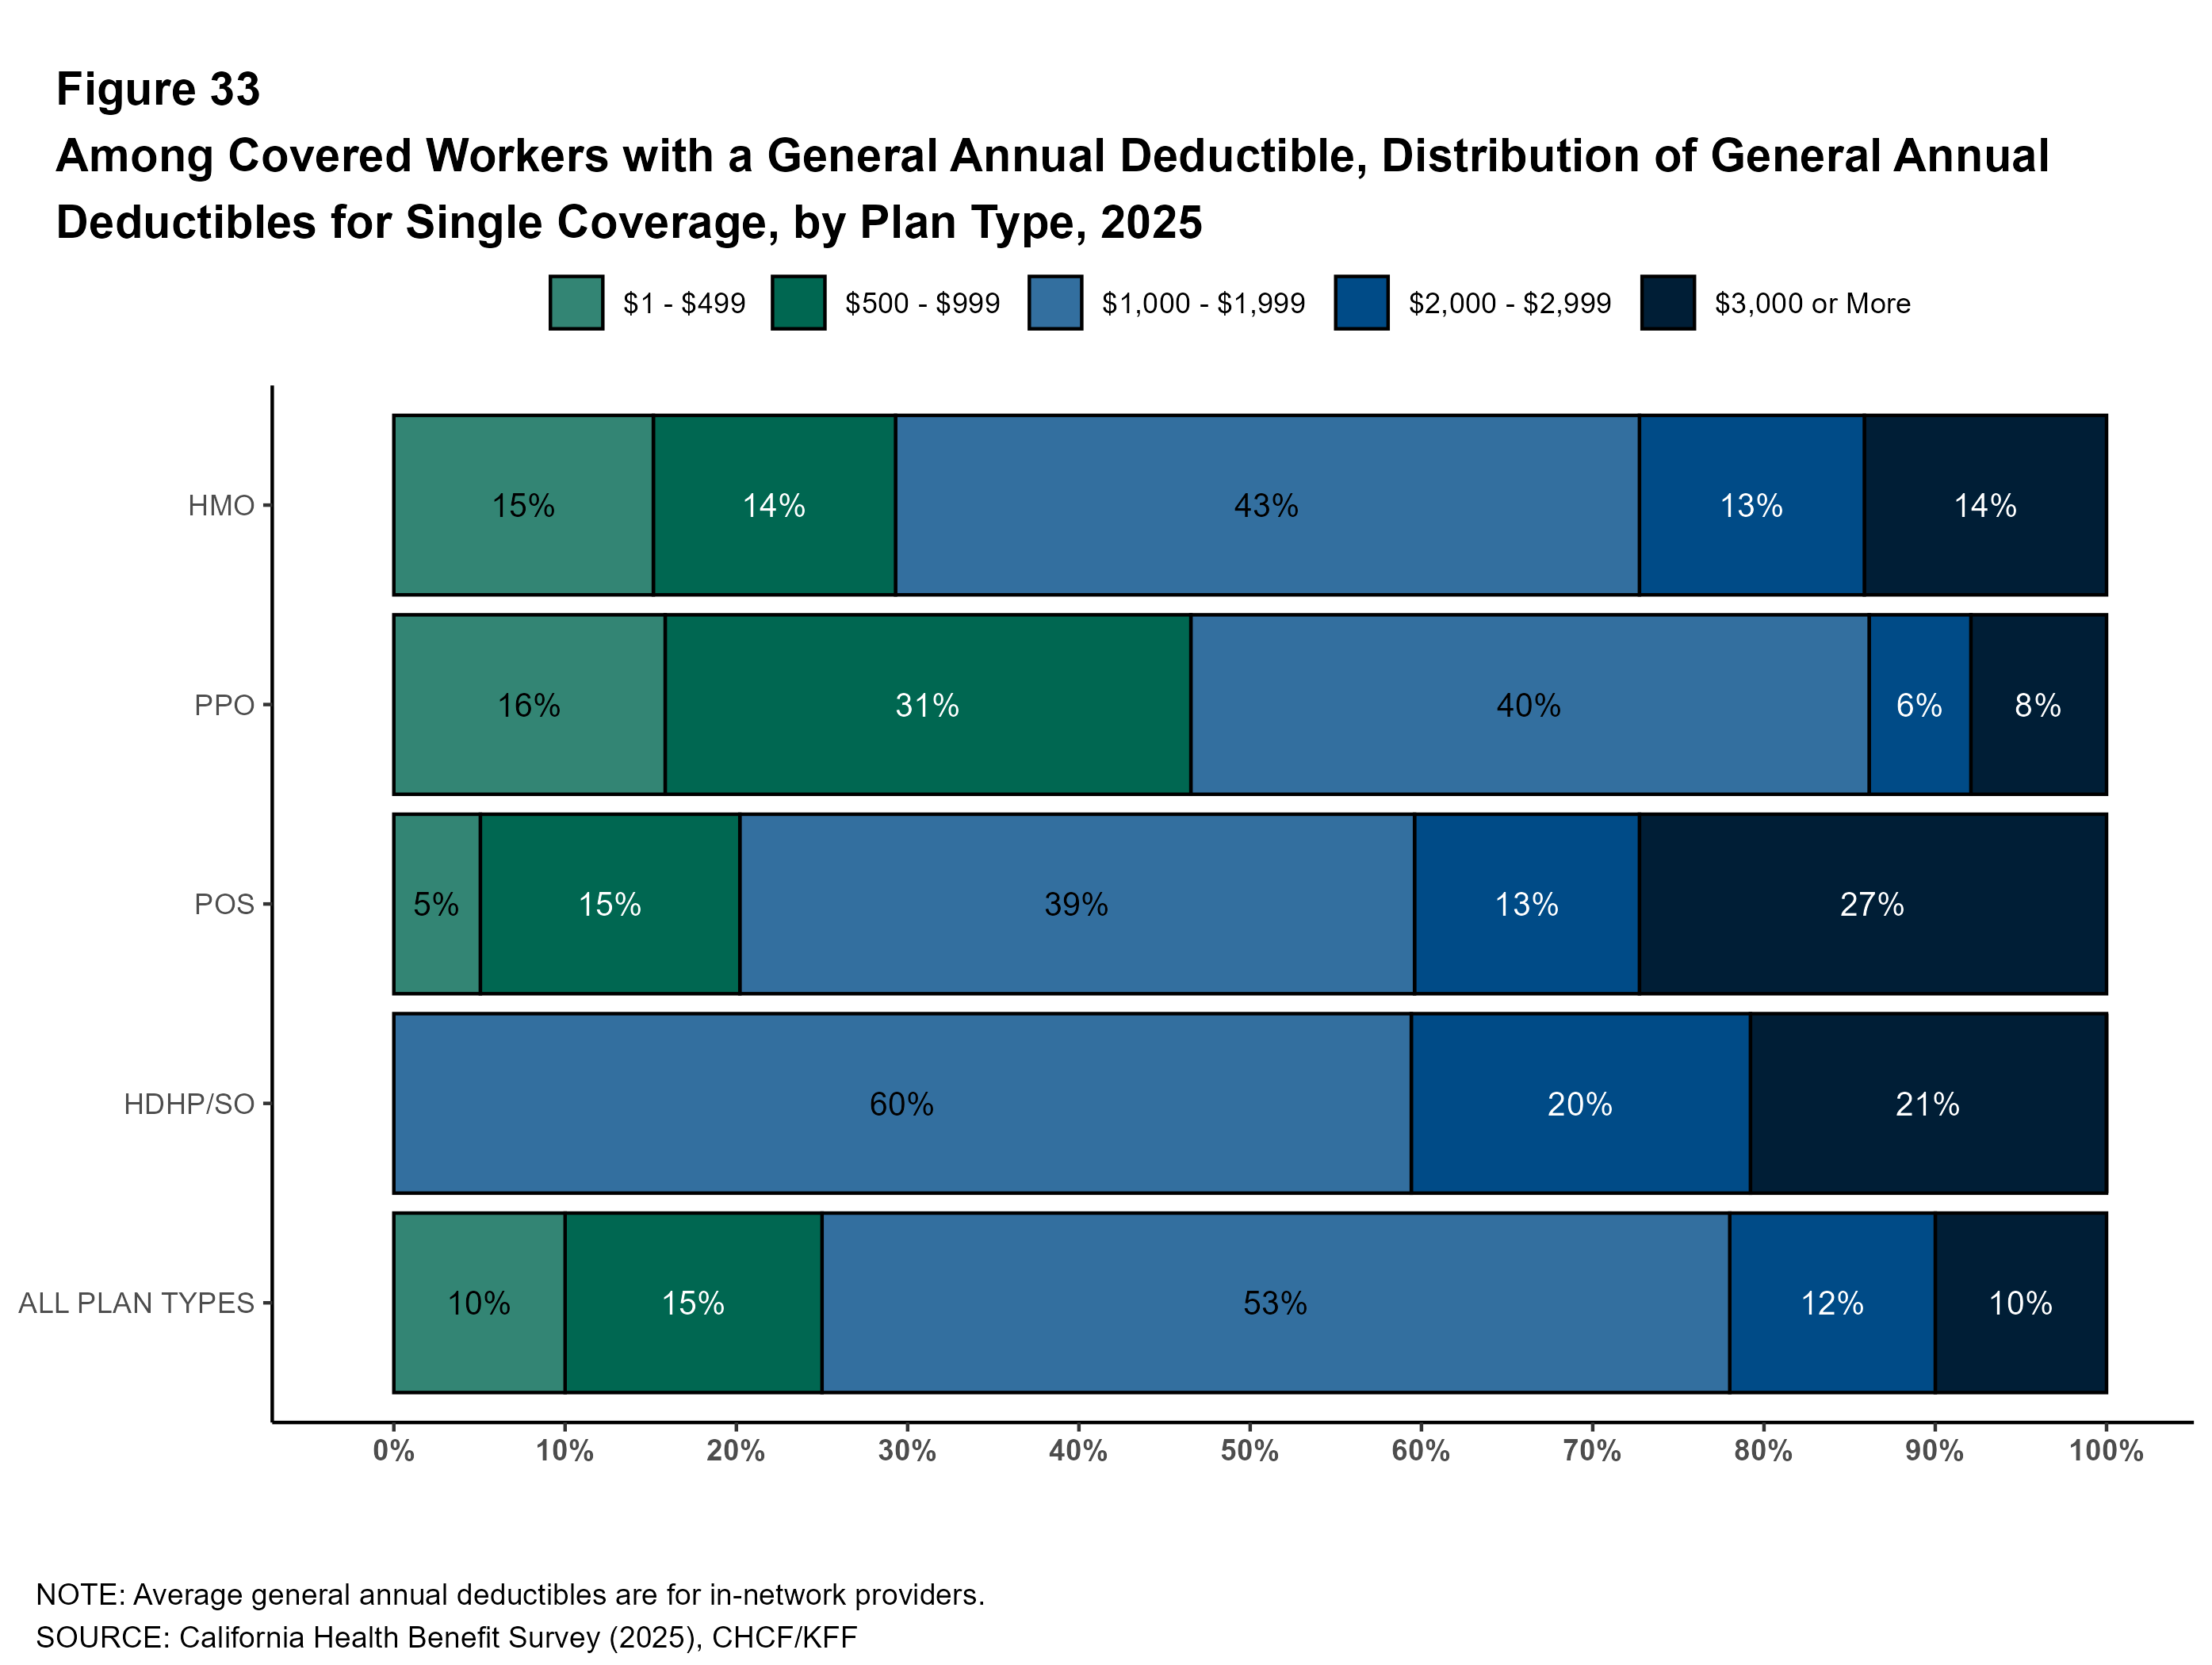
Distribution of Deductibles: Some covered workers face much higher deductibles. Among covered workers in California with a general annual deductible, 14% in an HMO, 8% in a PPO, and 21% in an HDHP/so have a deductible of $3,000 or more for single coverage.
Deductibles may present an affordability challenge for those enrolled in family plans, where multiple family members have to meet individual deductibles, or where an entire family’s spending is counted against a typically higher aggregate deductible. Among those with an aggregate family deductible, many covered workers face a deductible of $5,000 or more, including 22% of those enrolled in HMOs, 7% enrolled in PPO plans, 24% enrolled in POS plans, and 24% enrolled in HDHP/SOs.

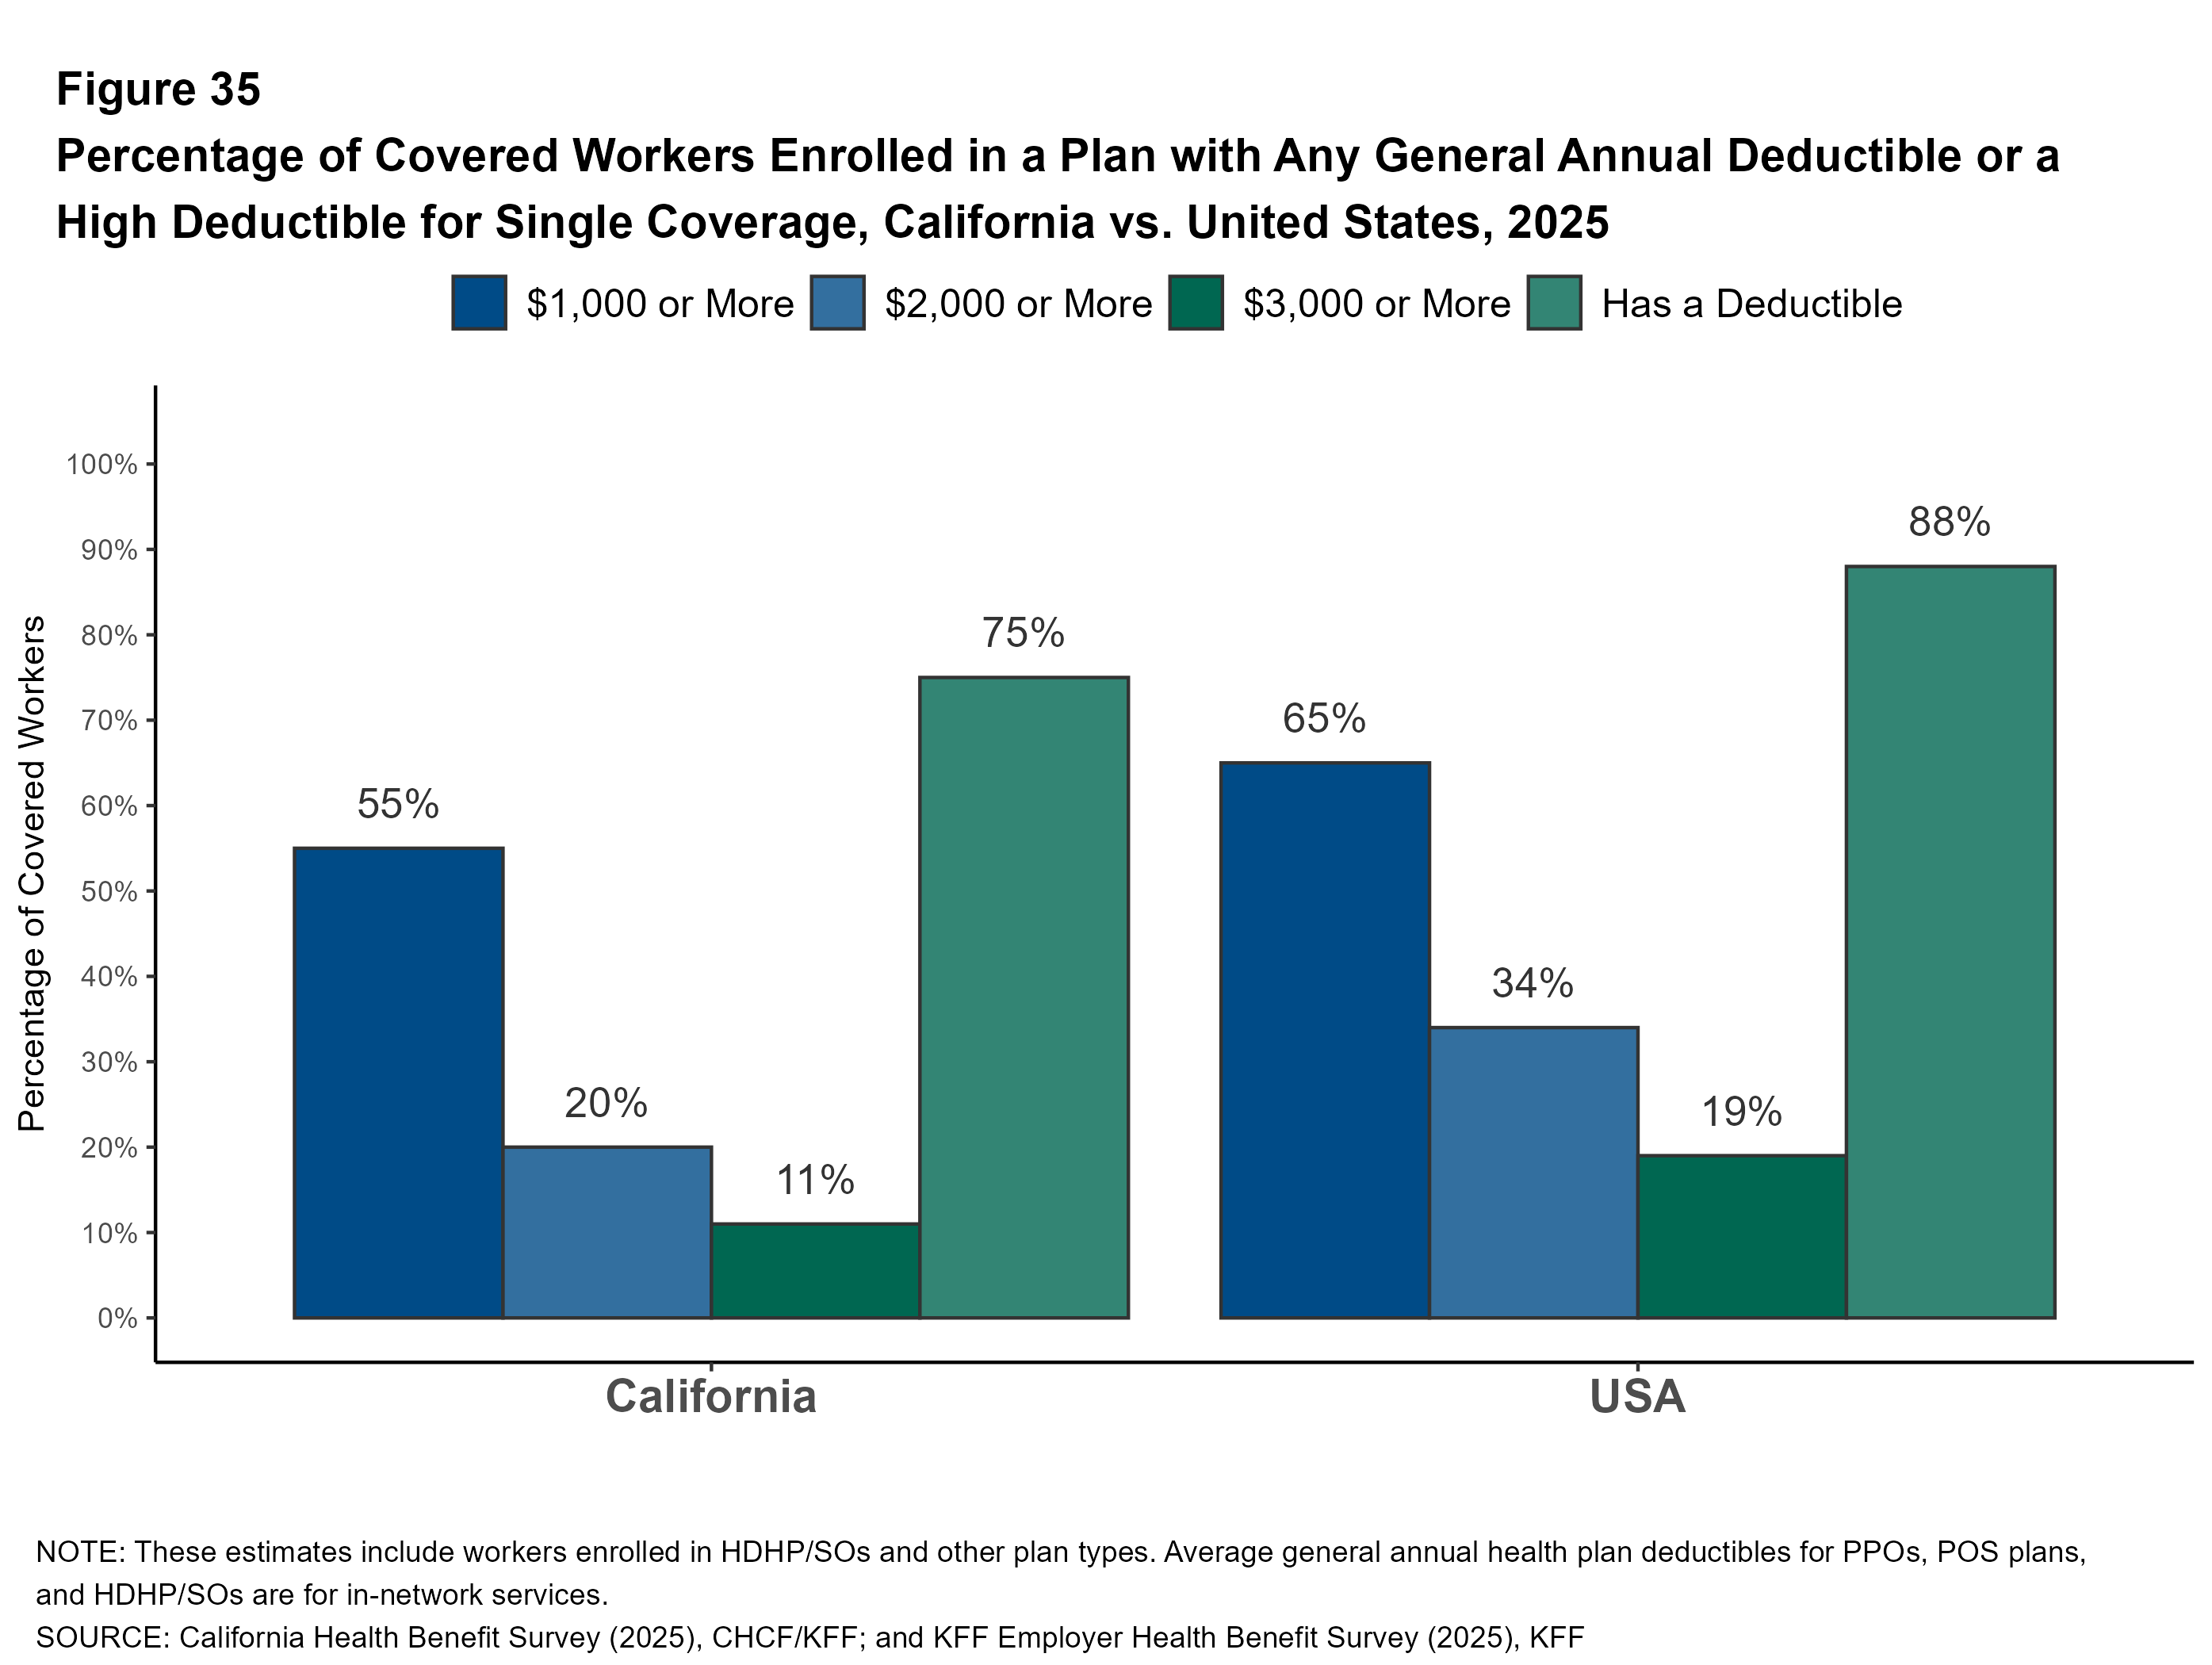
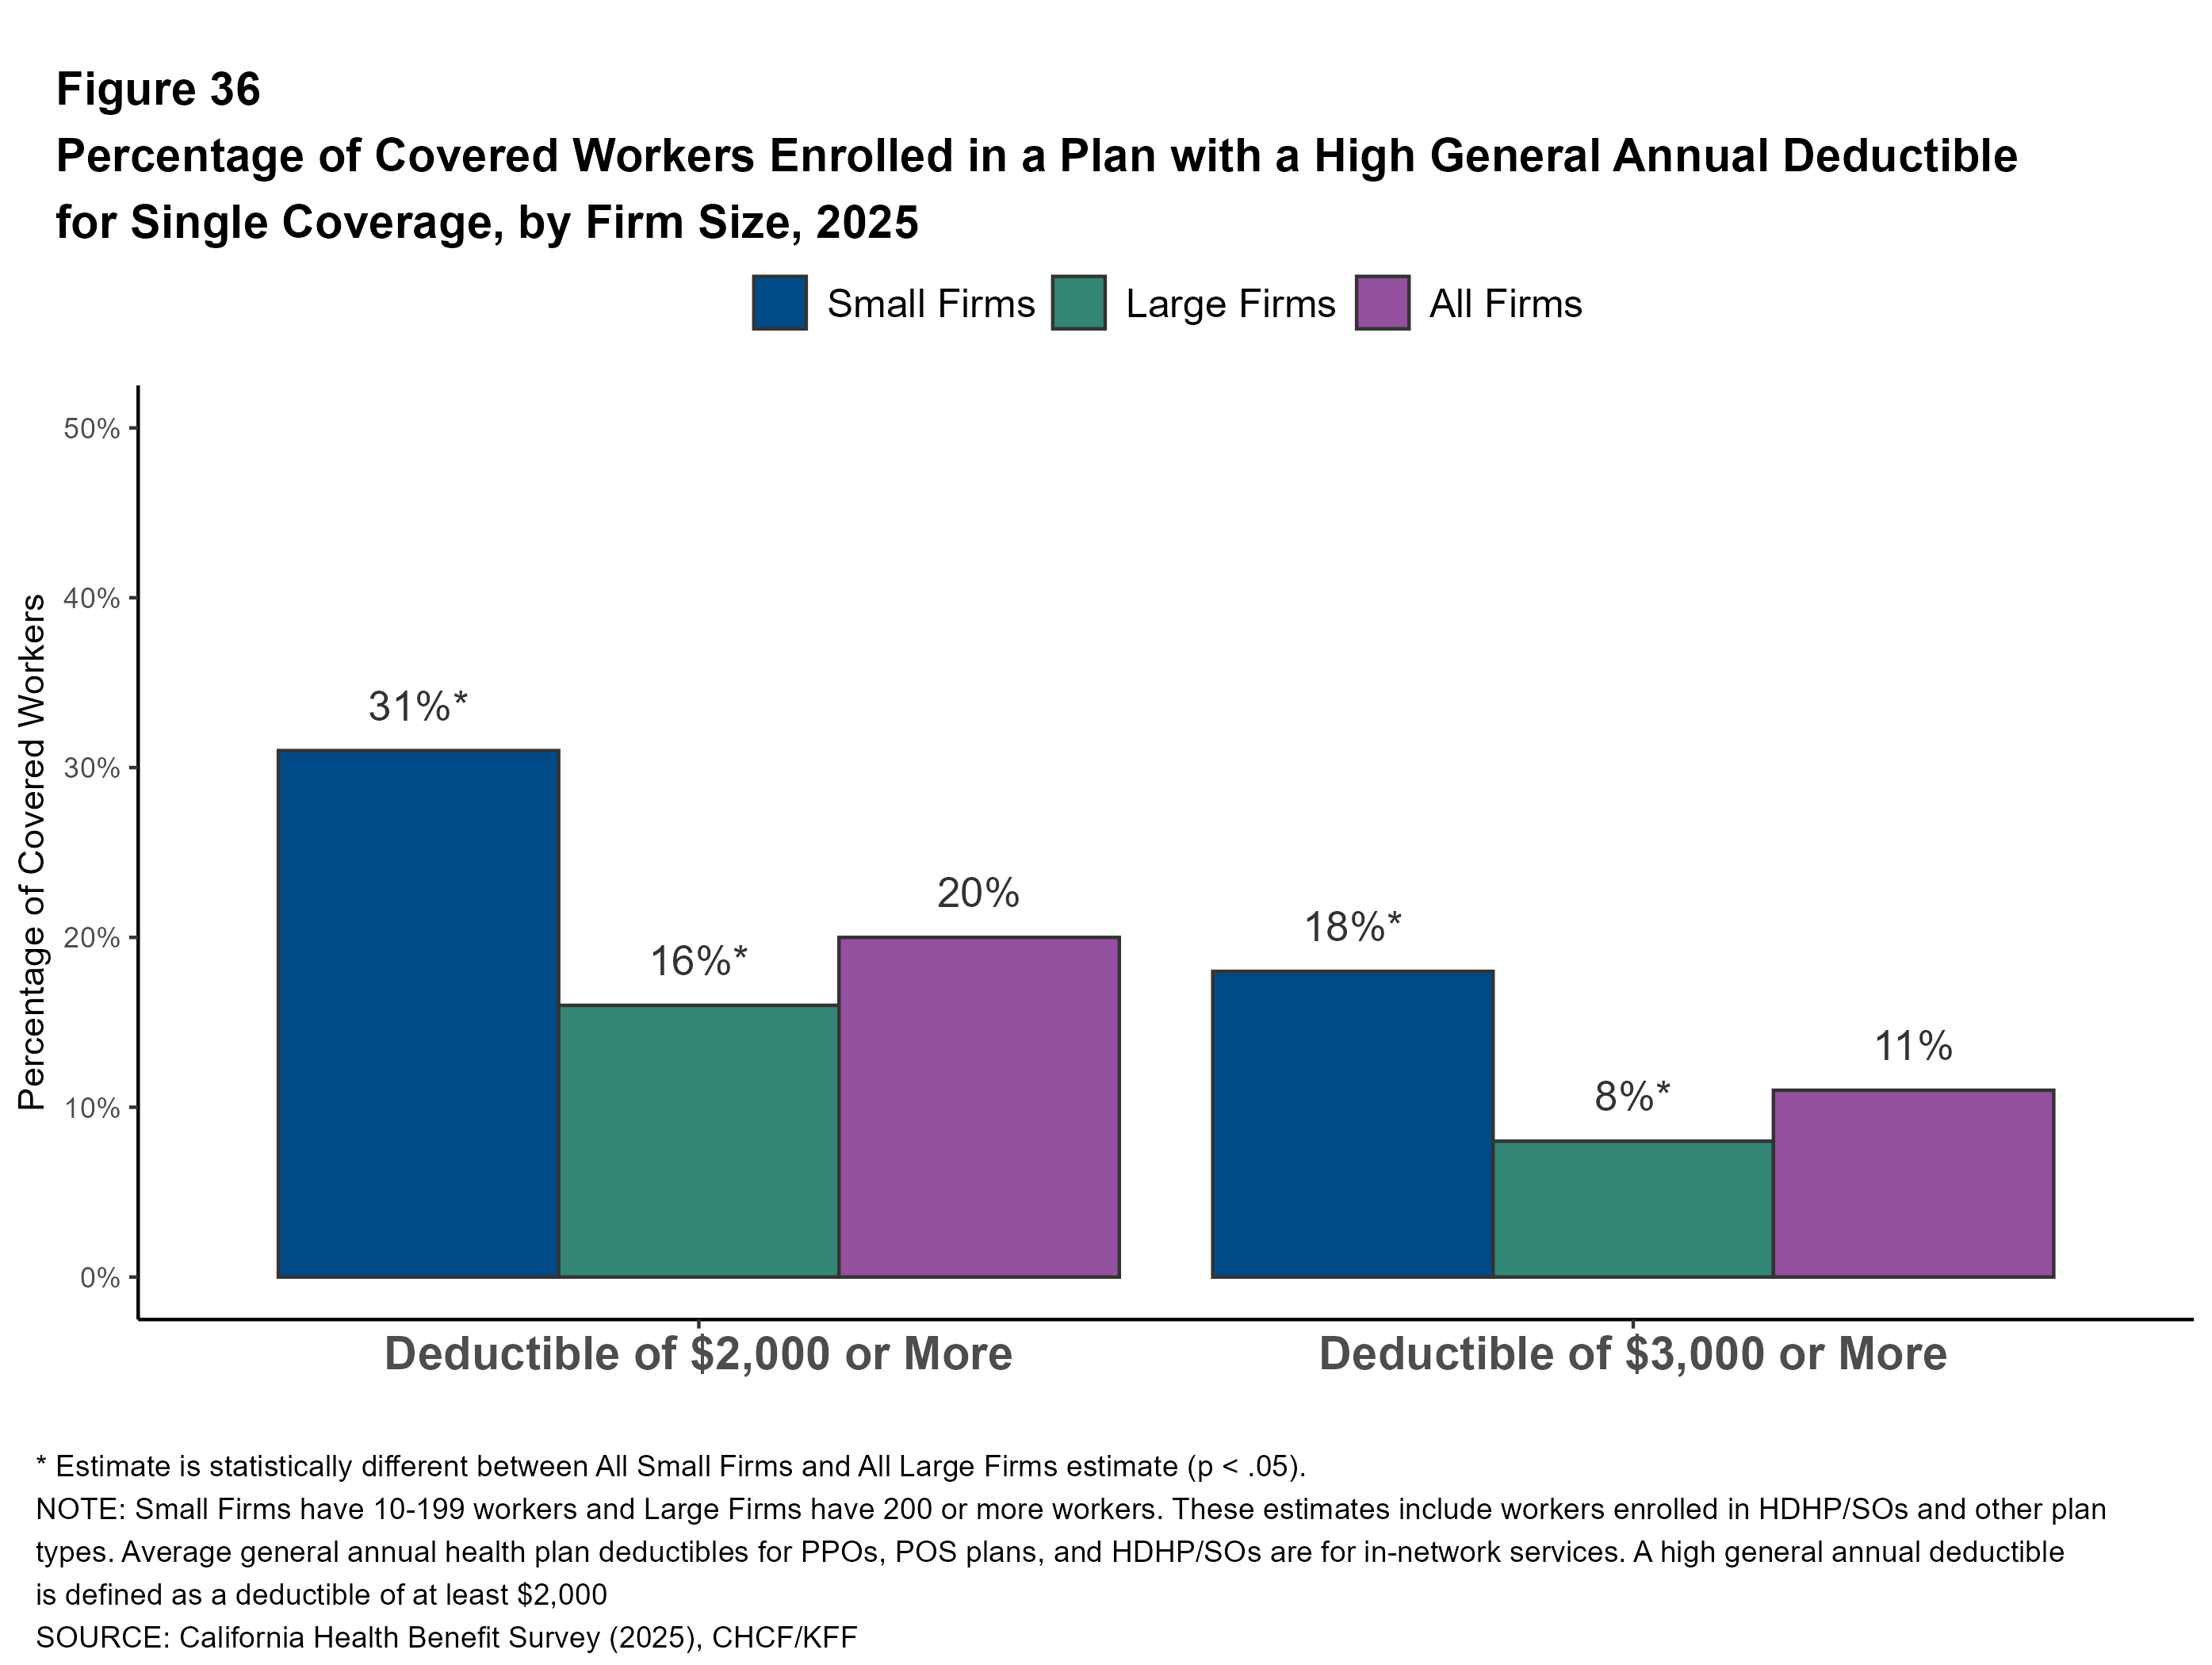
Share of Covered Workers Enrolled in High-Deductible Plans: In California, 20% of covered workers are in plans with a general annual deductible of $2,000 or more for single coverage, similar to the share in 2022 (19%).
In total, 11% of covered workers in California face a deductible of $3,000 or more for single coverage. Covered workers in the state have a deductible of $3,000 or more at a rate higher than workers nationally (11% vs. 19%).
Firm Size: California workers at firms with 10 to 199 workers are considerably more likely to have a general annual deductible of $2,000 or more for single coverage than workers at larger firms (31% vs. 16%). Many covered workers at small firms face even higher deductible thresholds for single coverage. Almost one in five covered workers (18%) in small firms in California have a general annual deductible of $3,000 or more.
Copays and Coinsurance for Office Visits
The majority of covered workers in California are enrolled in health plans that require cost sharing for an in-network physician office visit, in addition to any general annual deductible.
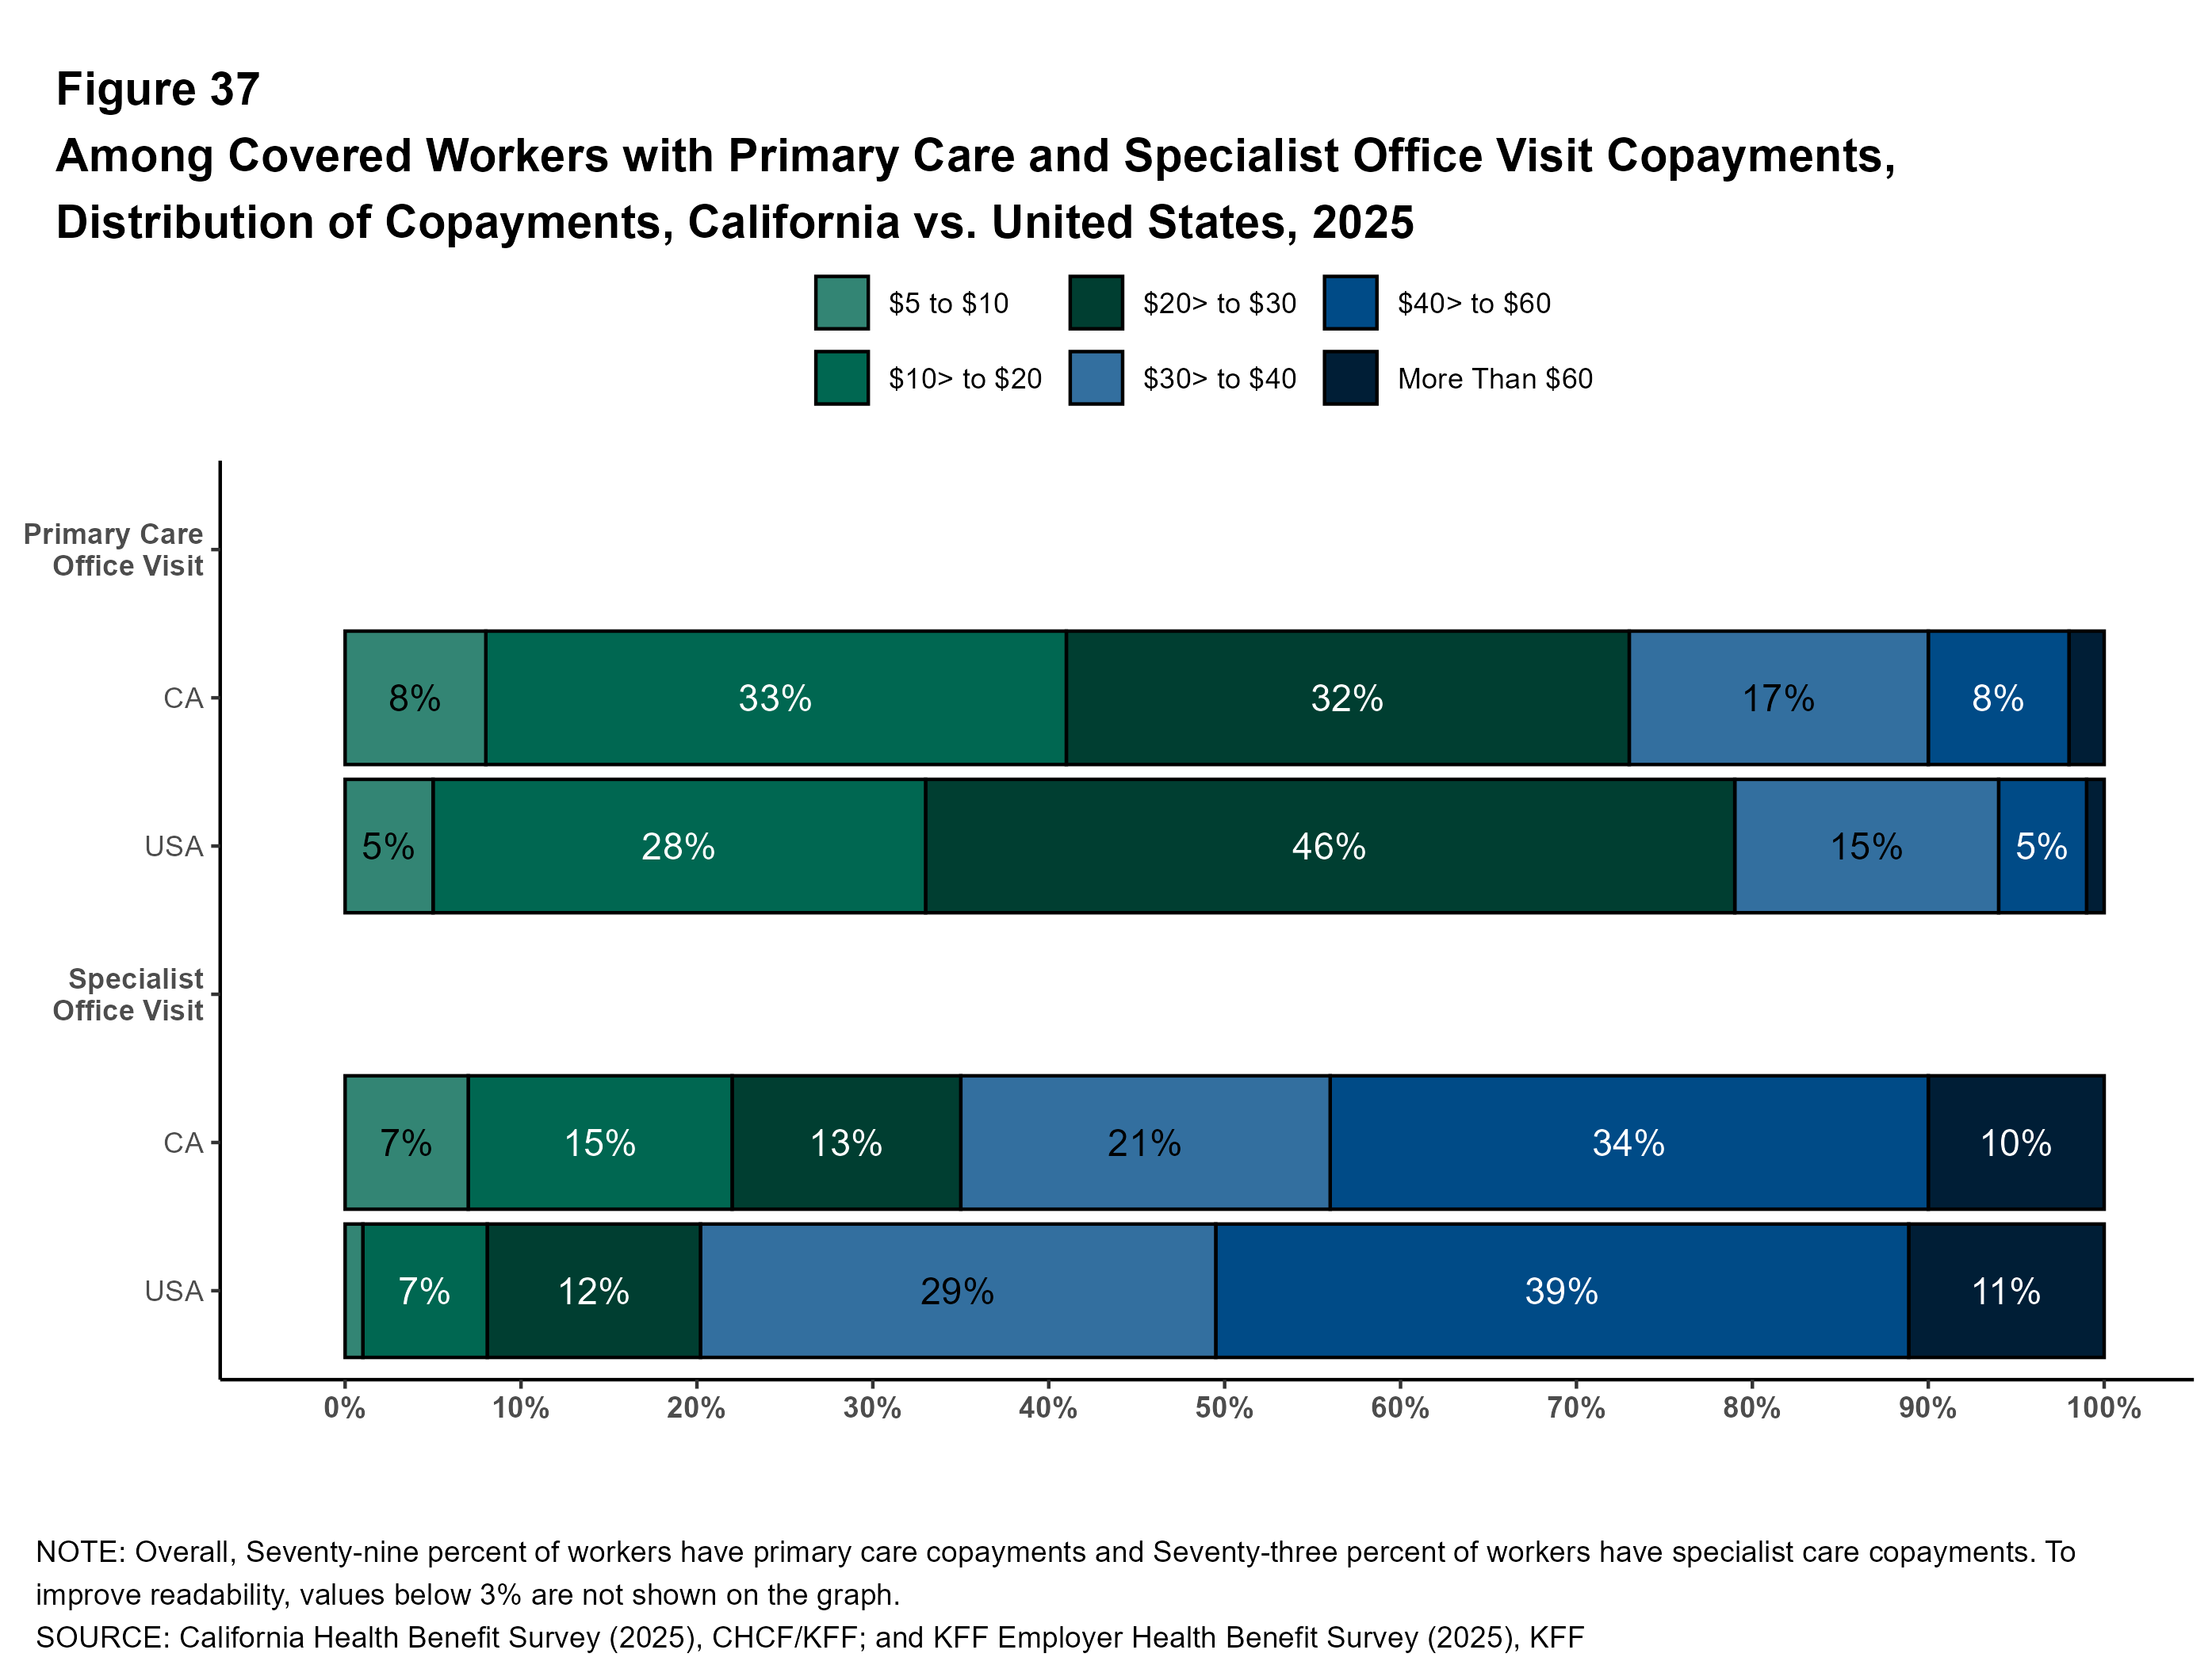
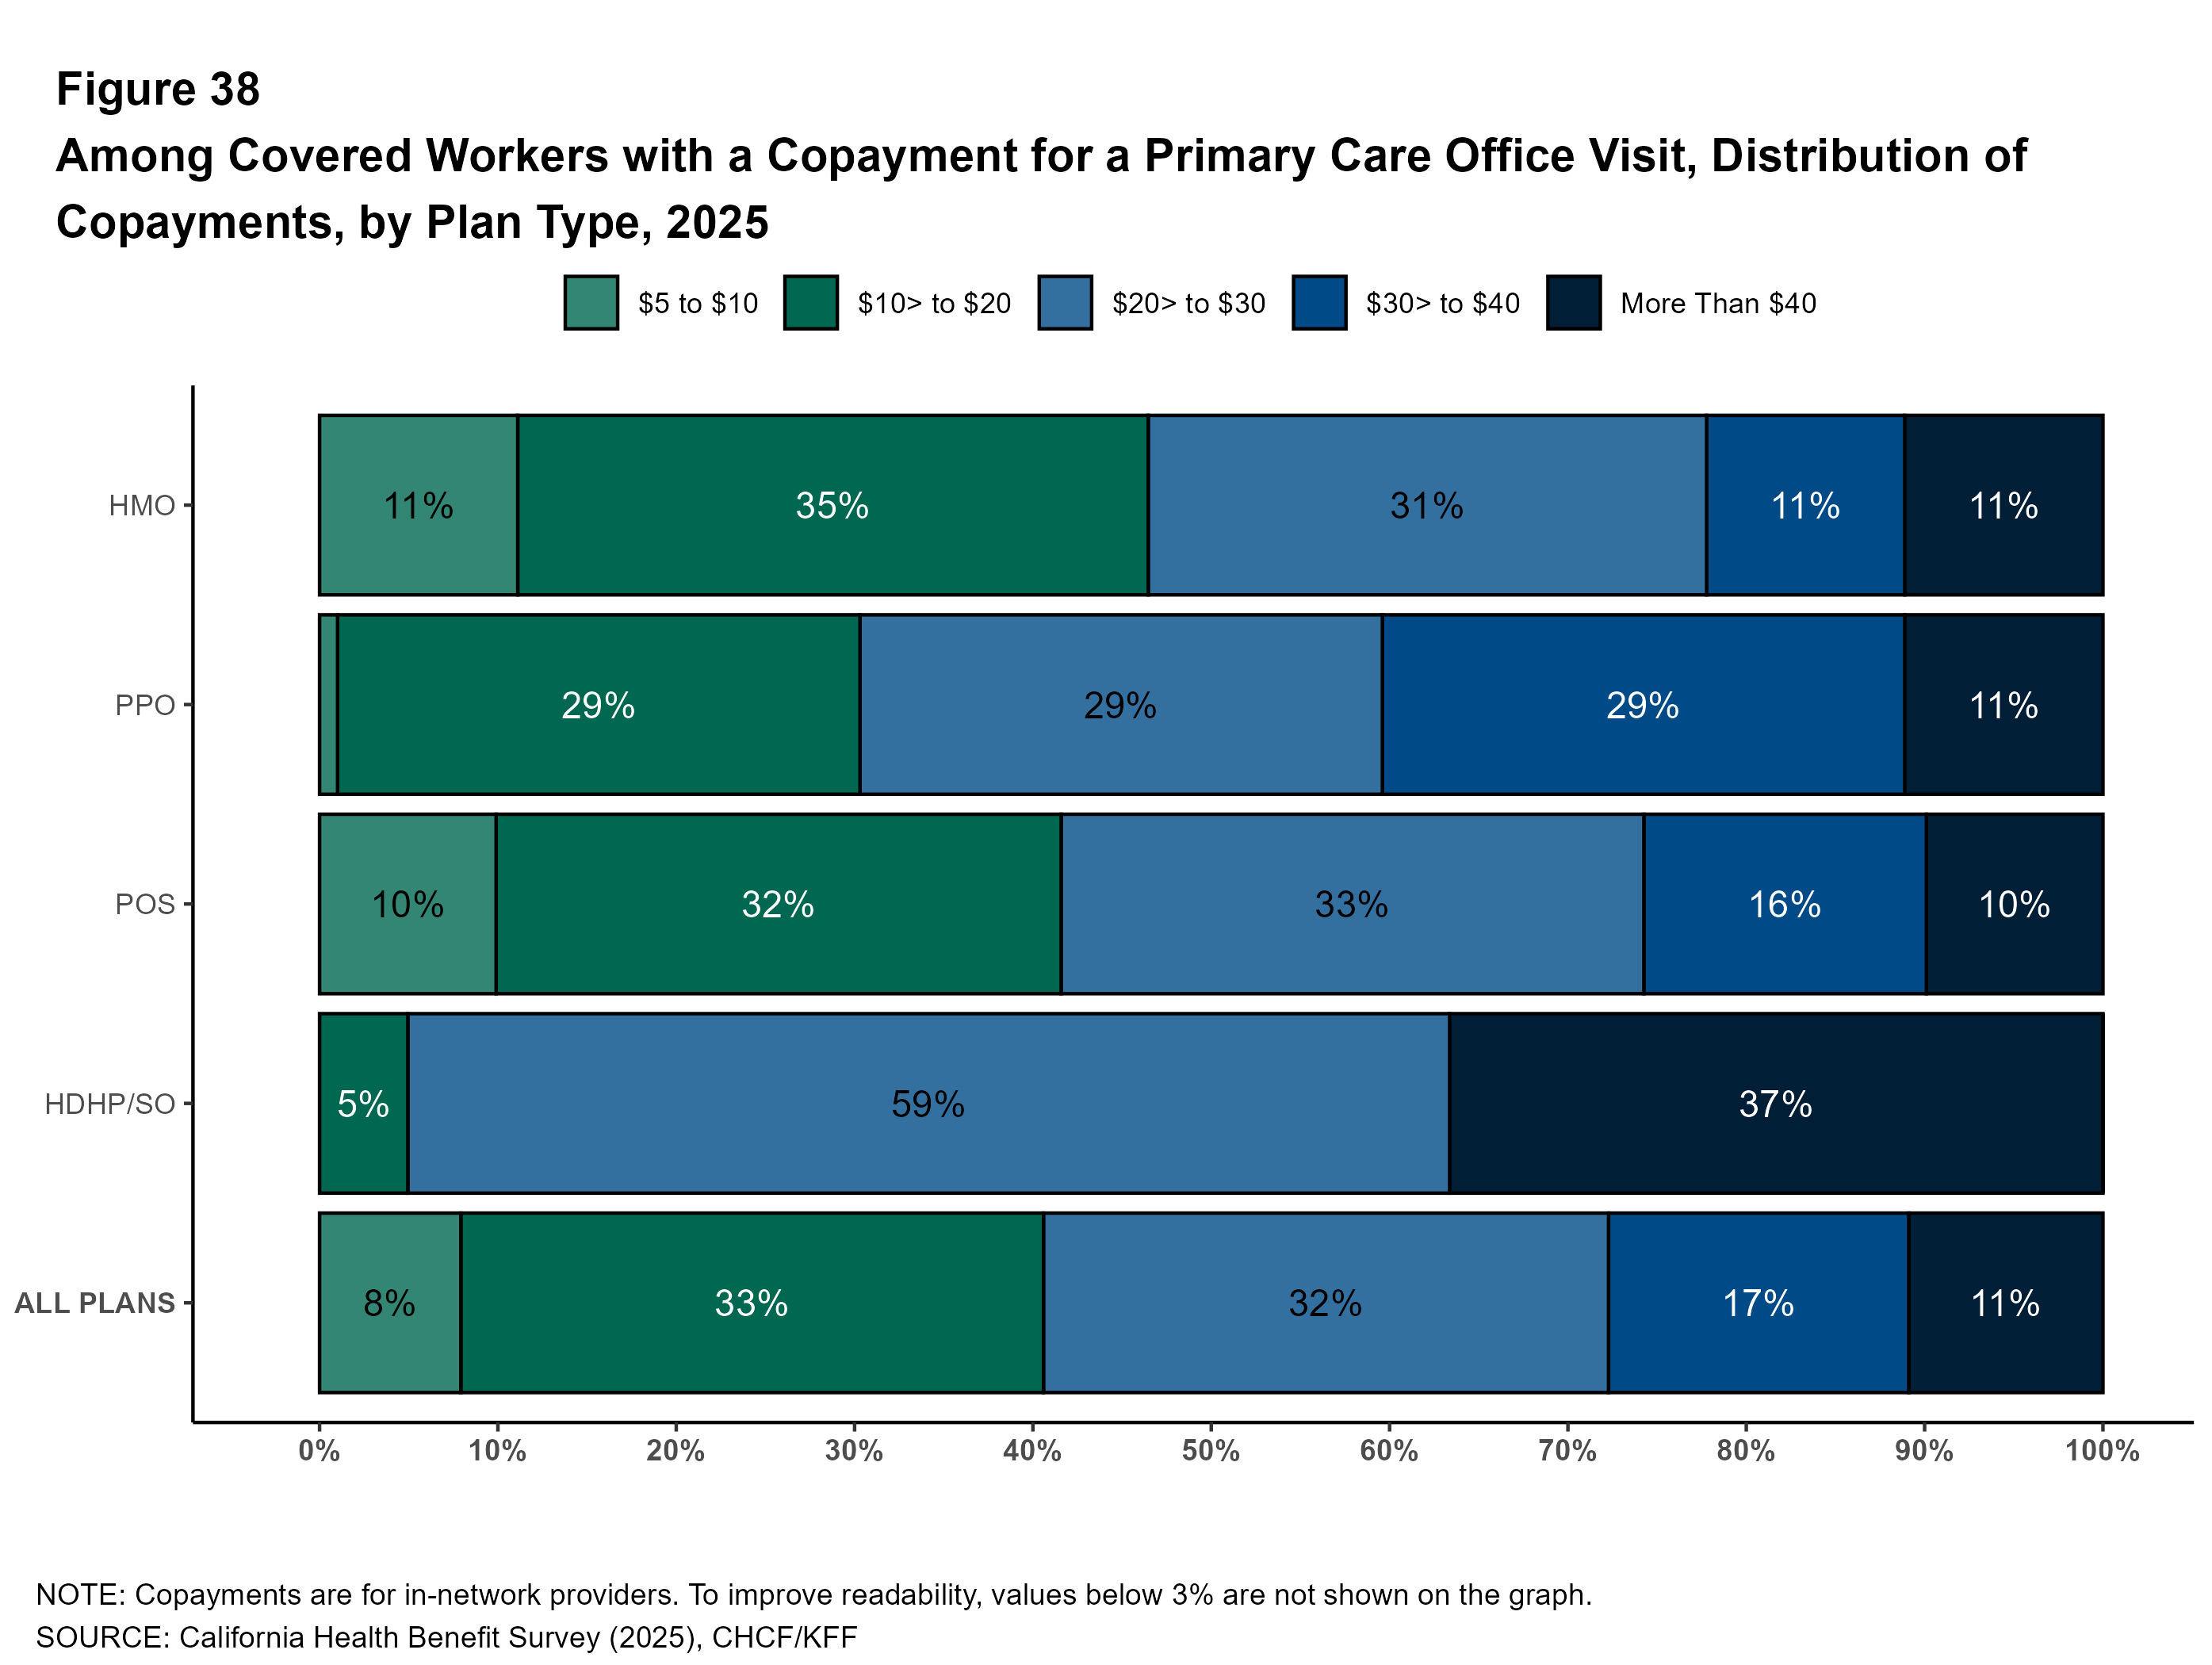
Primary Care Visits: Seventy-nine percent of workers in California had a copay for primary care office visits. Among covered workers with a copayment for an in-network office visit, the average copayment is $28.
Specialist Office Visits: For specialist office visits 73% of covered workers in California had a copay, averaging $42.
The distribution of copays is similar for covered workers in California and nationally, with about one in ten facing a copay of more than $60 a for specialist office visit.
California covered workers in HDHP/SO plans are much more likely to face a coinsurance amount for both primary care visits (80%) and specialist visits (80%) than covered workers in other plan types.
Out-of-Pocket Maximum
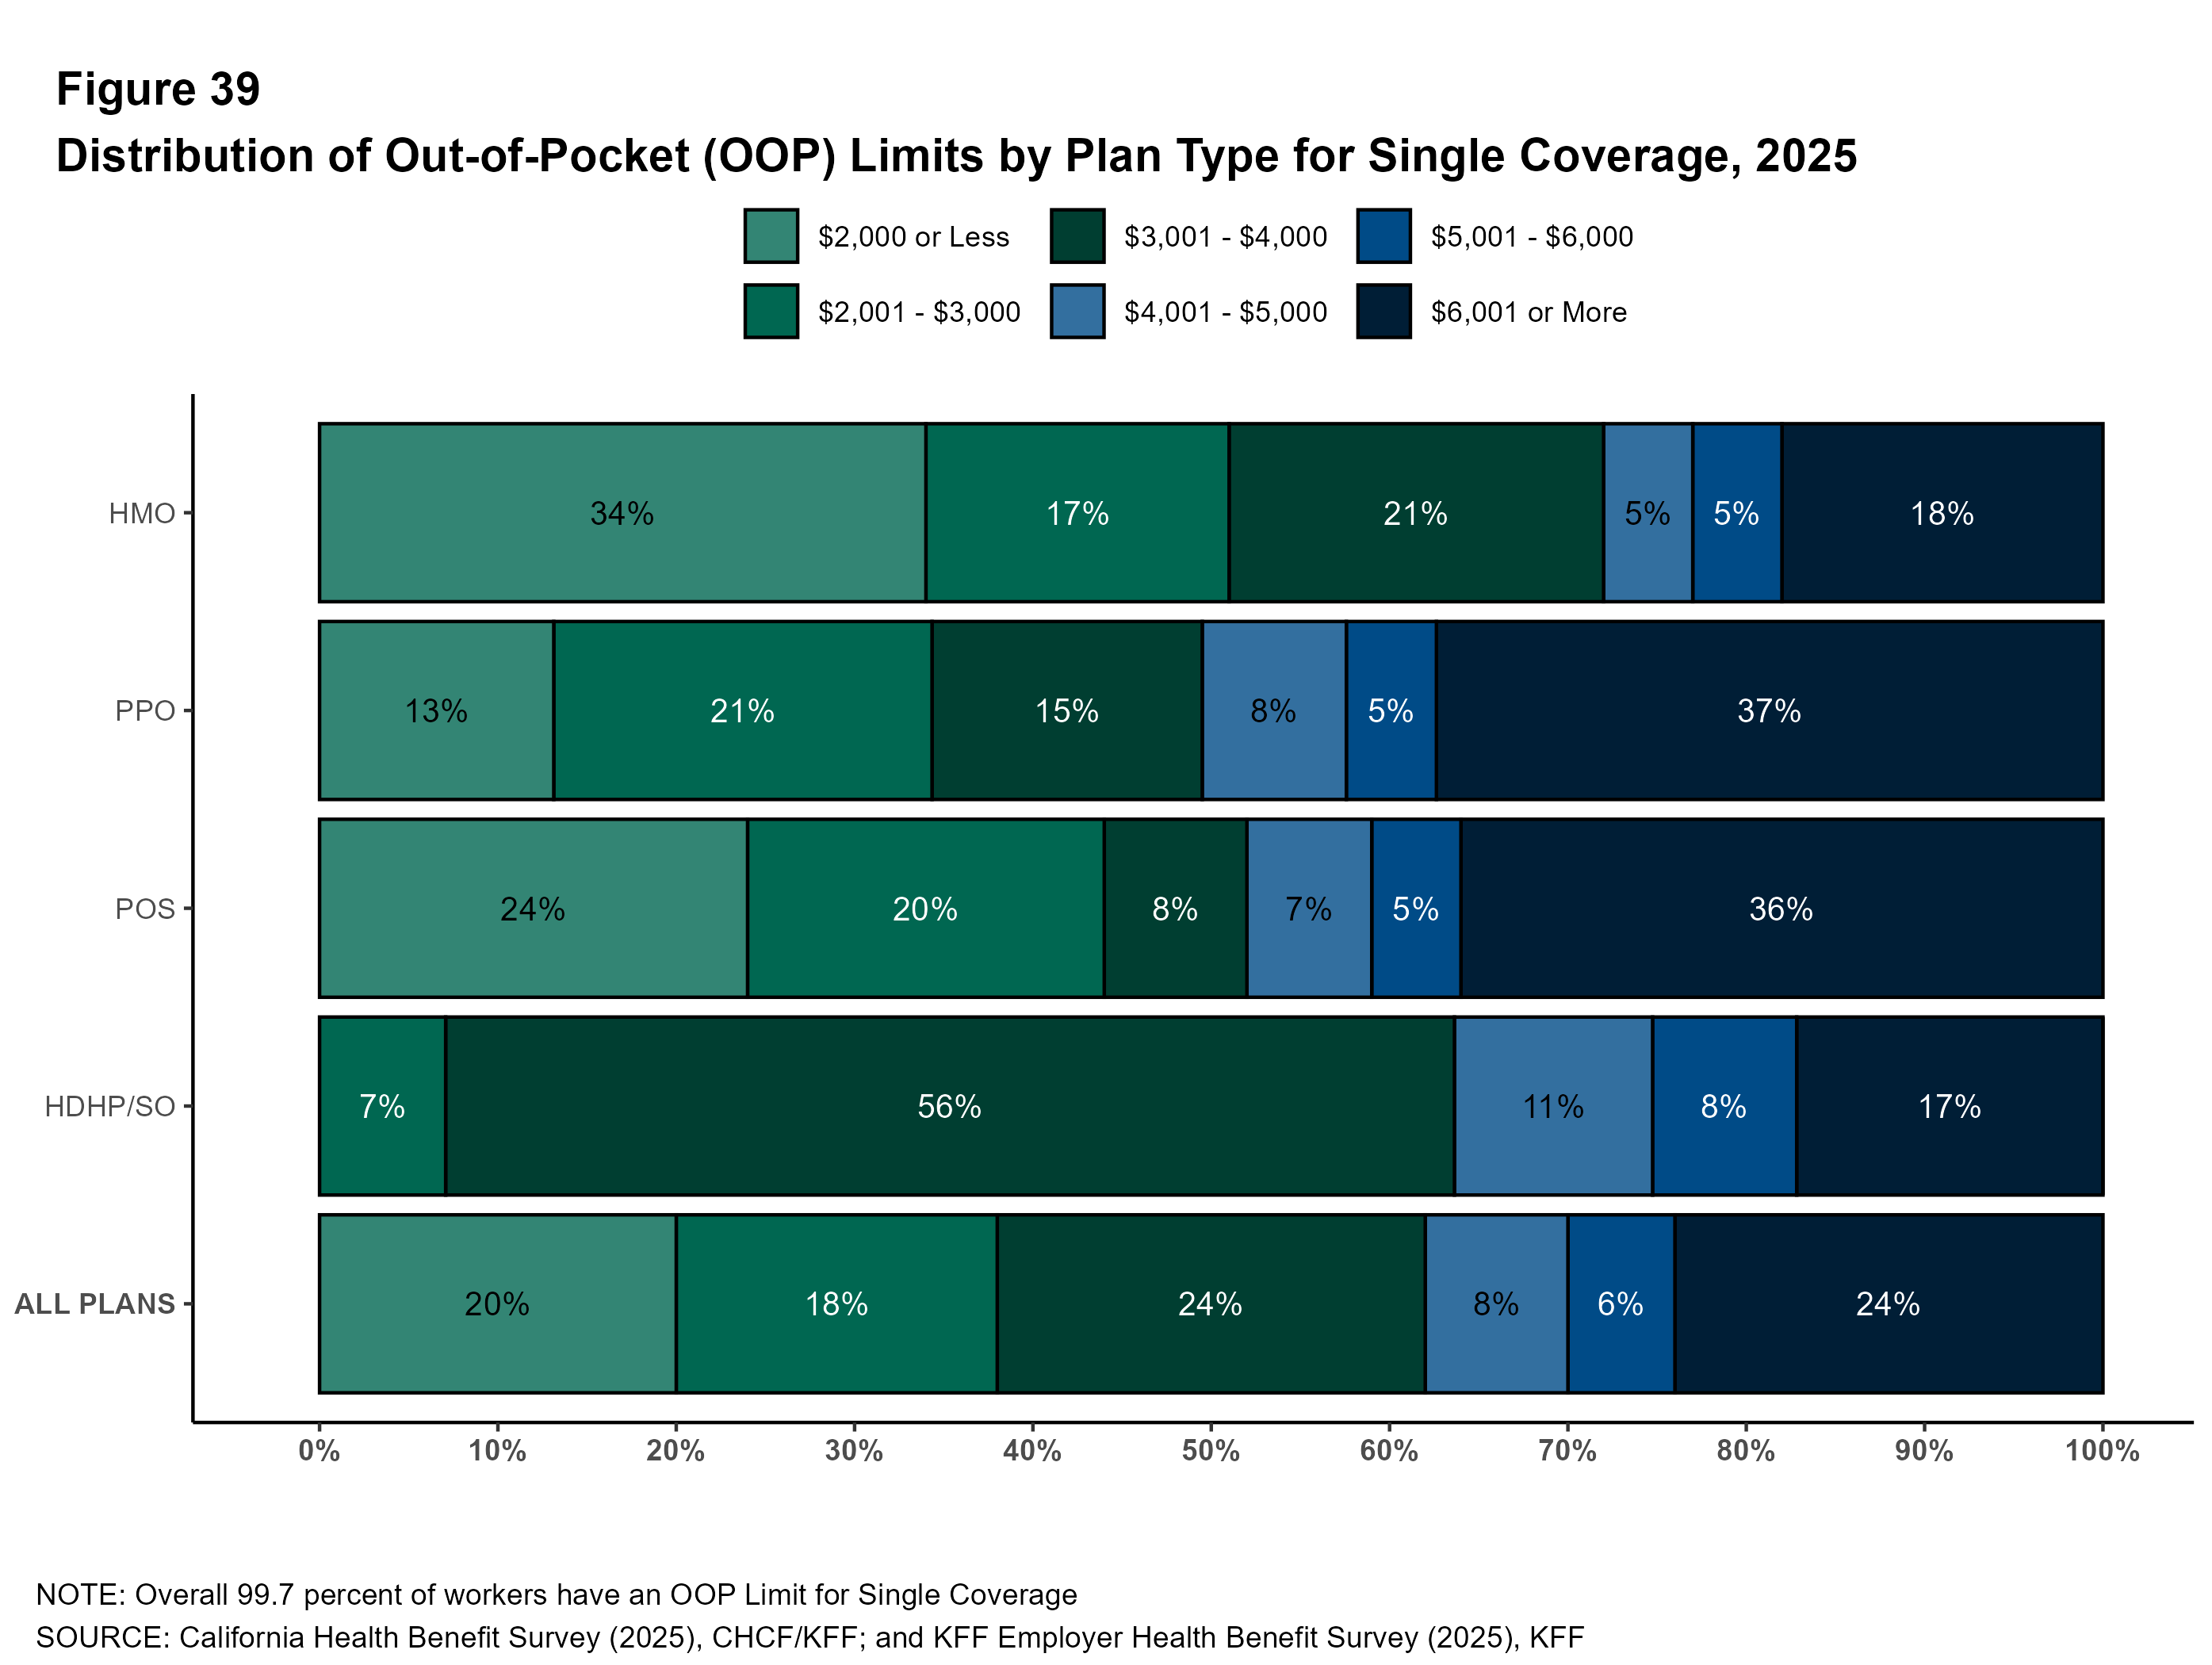
Out-of-pocket limits are the maximum amount an enrollee is required to spend on cost sharing for in-network services in a year. After the enrollee reaches this limit, the plan pays for all covered expenses for the remainder of the plan year. Virtually all California covered workers are in a plan with an out-of-pocket limit, but the actual limits vary considerably: 20% of covered workers with an out-of-pocket maximum have an out-of-pocket maximum of $2,000 or less for single coverage, while 24% have an out-of-pocket maximum above $6,000. Workers with family coverage may face higher out-of-pocket limits, or individual limits for each plan enrollee.
Plan Funding
Many firms, particularly larger firms, choose to pay the cost of the health services for covered workers directly from their own funds, rather than purchasing health insurance. These self-funded plans are often administered by an insurer or other entity, which processes claims and pays providers on behalf of the firm. Self-funded plans established by private employers are exempt from most state insurance laws, including reserve requirements, mandated benefits, premium taxes, and certain consumer protection regulations.
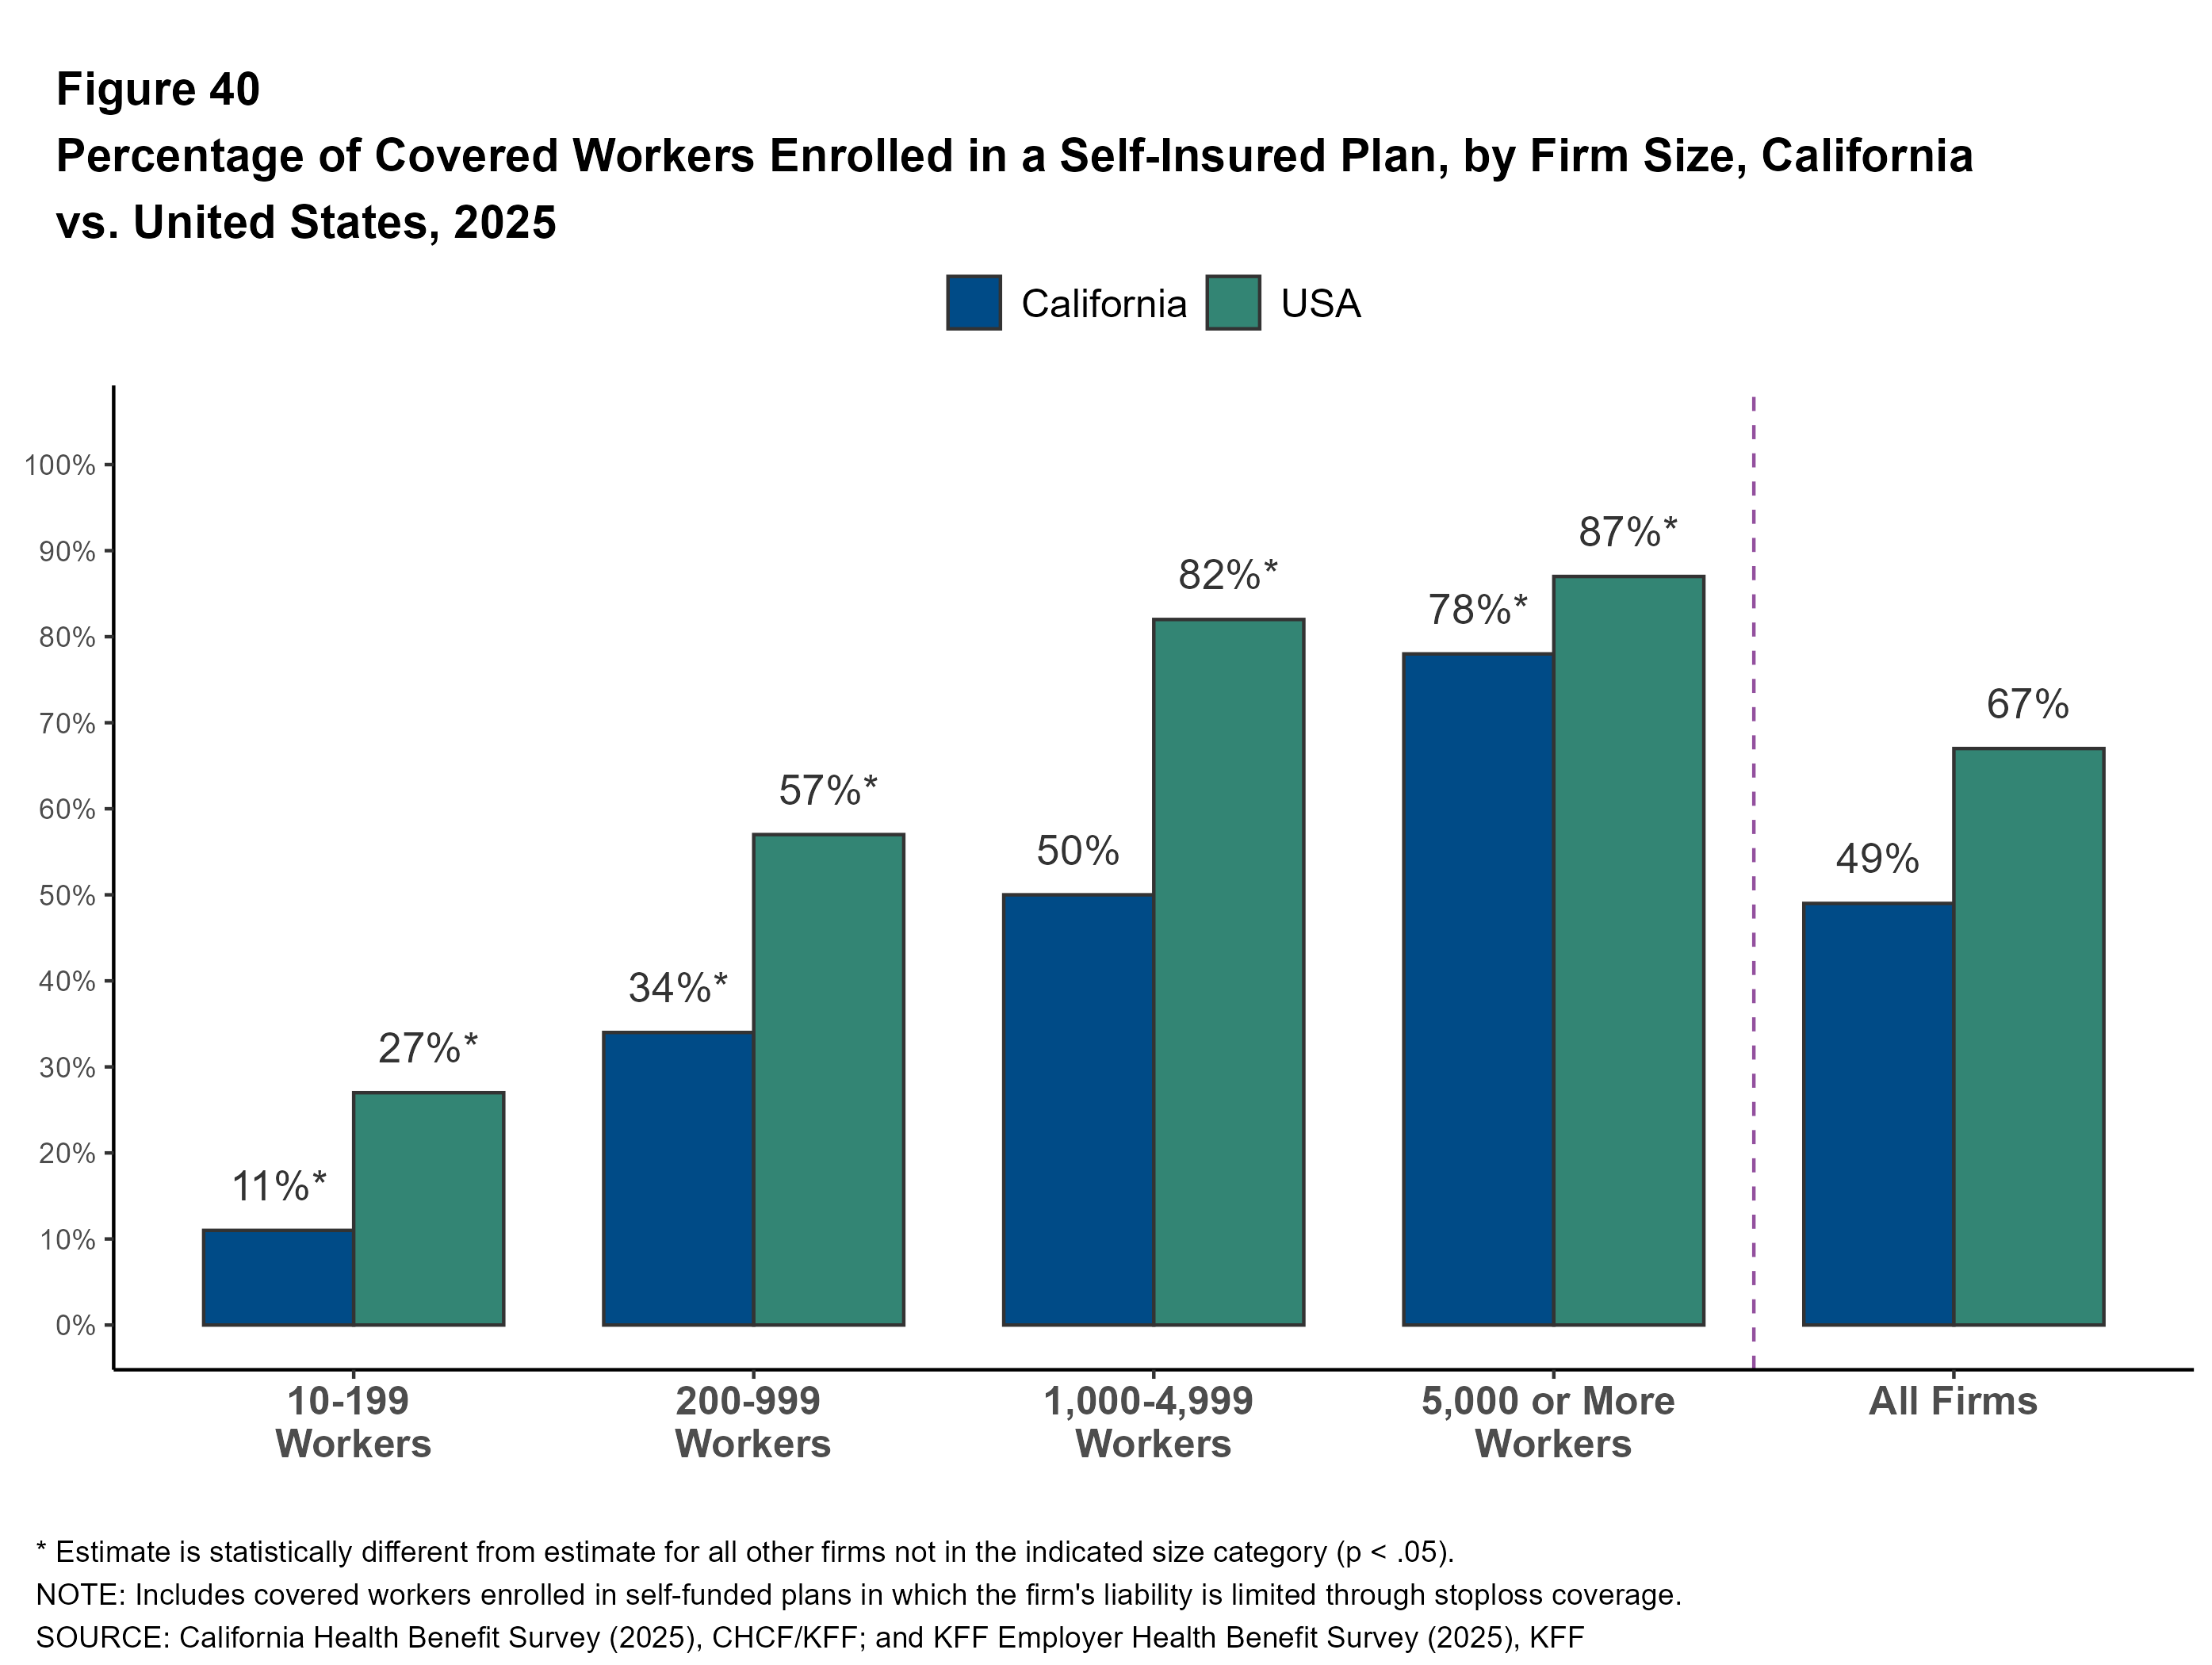
Forty-nine percent of covered workers in California are in a plan that is self-funded, the same percentage as 2022. Covered workers in California are less likely to be in a self-funded plan than covered workers nationally (49% vs. 67%). This can be partially attributed to HMOs being more common in California than they are nationally. Both in California and nationally, covered workers enrolled in HMOs are less likely to be in self-insured plans than workers in other plan types (22% in California vs. 42% nationally).
California covered workers in firms with 200 or more workers are much more likely to be in a self-funded plan. About three-quarters of covered workers in firms with 5,000 or more workers (78%) are in self-funded plans, compared to 11% of covered workers in firms with 10-199 workers.
Stop Loss: Many firms with self-funded plans purchase insurance, often referred to as “stop loss” insurance, to protect themselves from unexpected losses. At firms with 200 or more workers, 70% of California covered workers in self-funded health plans are in plans that have stop loss insurance.

Wellness and Health Screening
Health Screening
Many large firms offer health screening programs to help identify health risks and health problems among enrollees. Health risk assessments are questionnaires asking about physical health, lifestyle, stress, or other activities. Biometeric screenings are in-person health examinations conducted by a medical professional to measure certain health metrics, such as weight, blood pressure, or cholesterol. Firms and insurers use the health information collected during screenings to target wellness offerings, manage cases, or offer health services or supports to enrollees before their health conditions worsen.
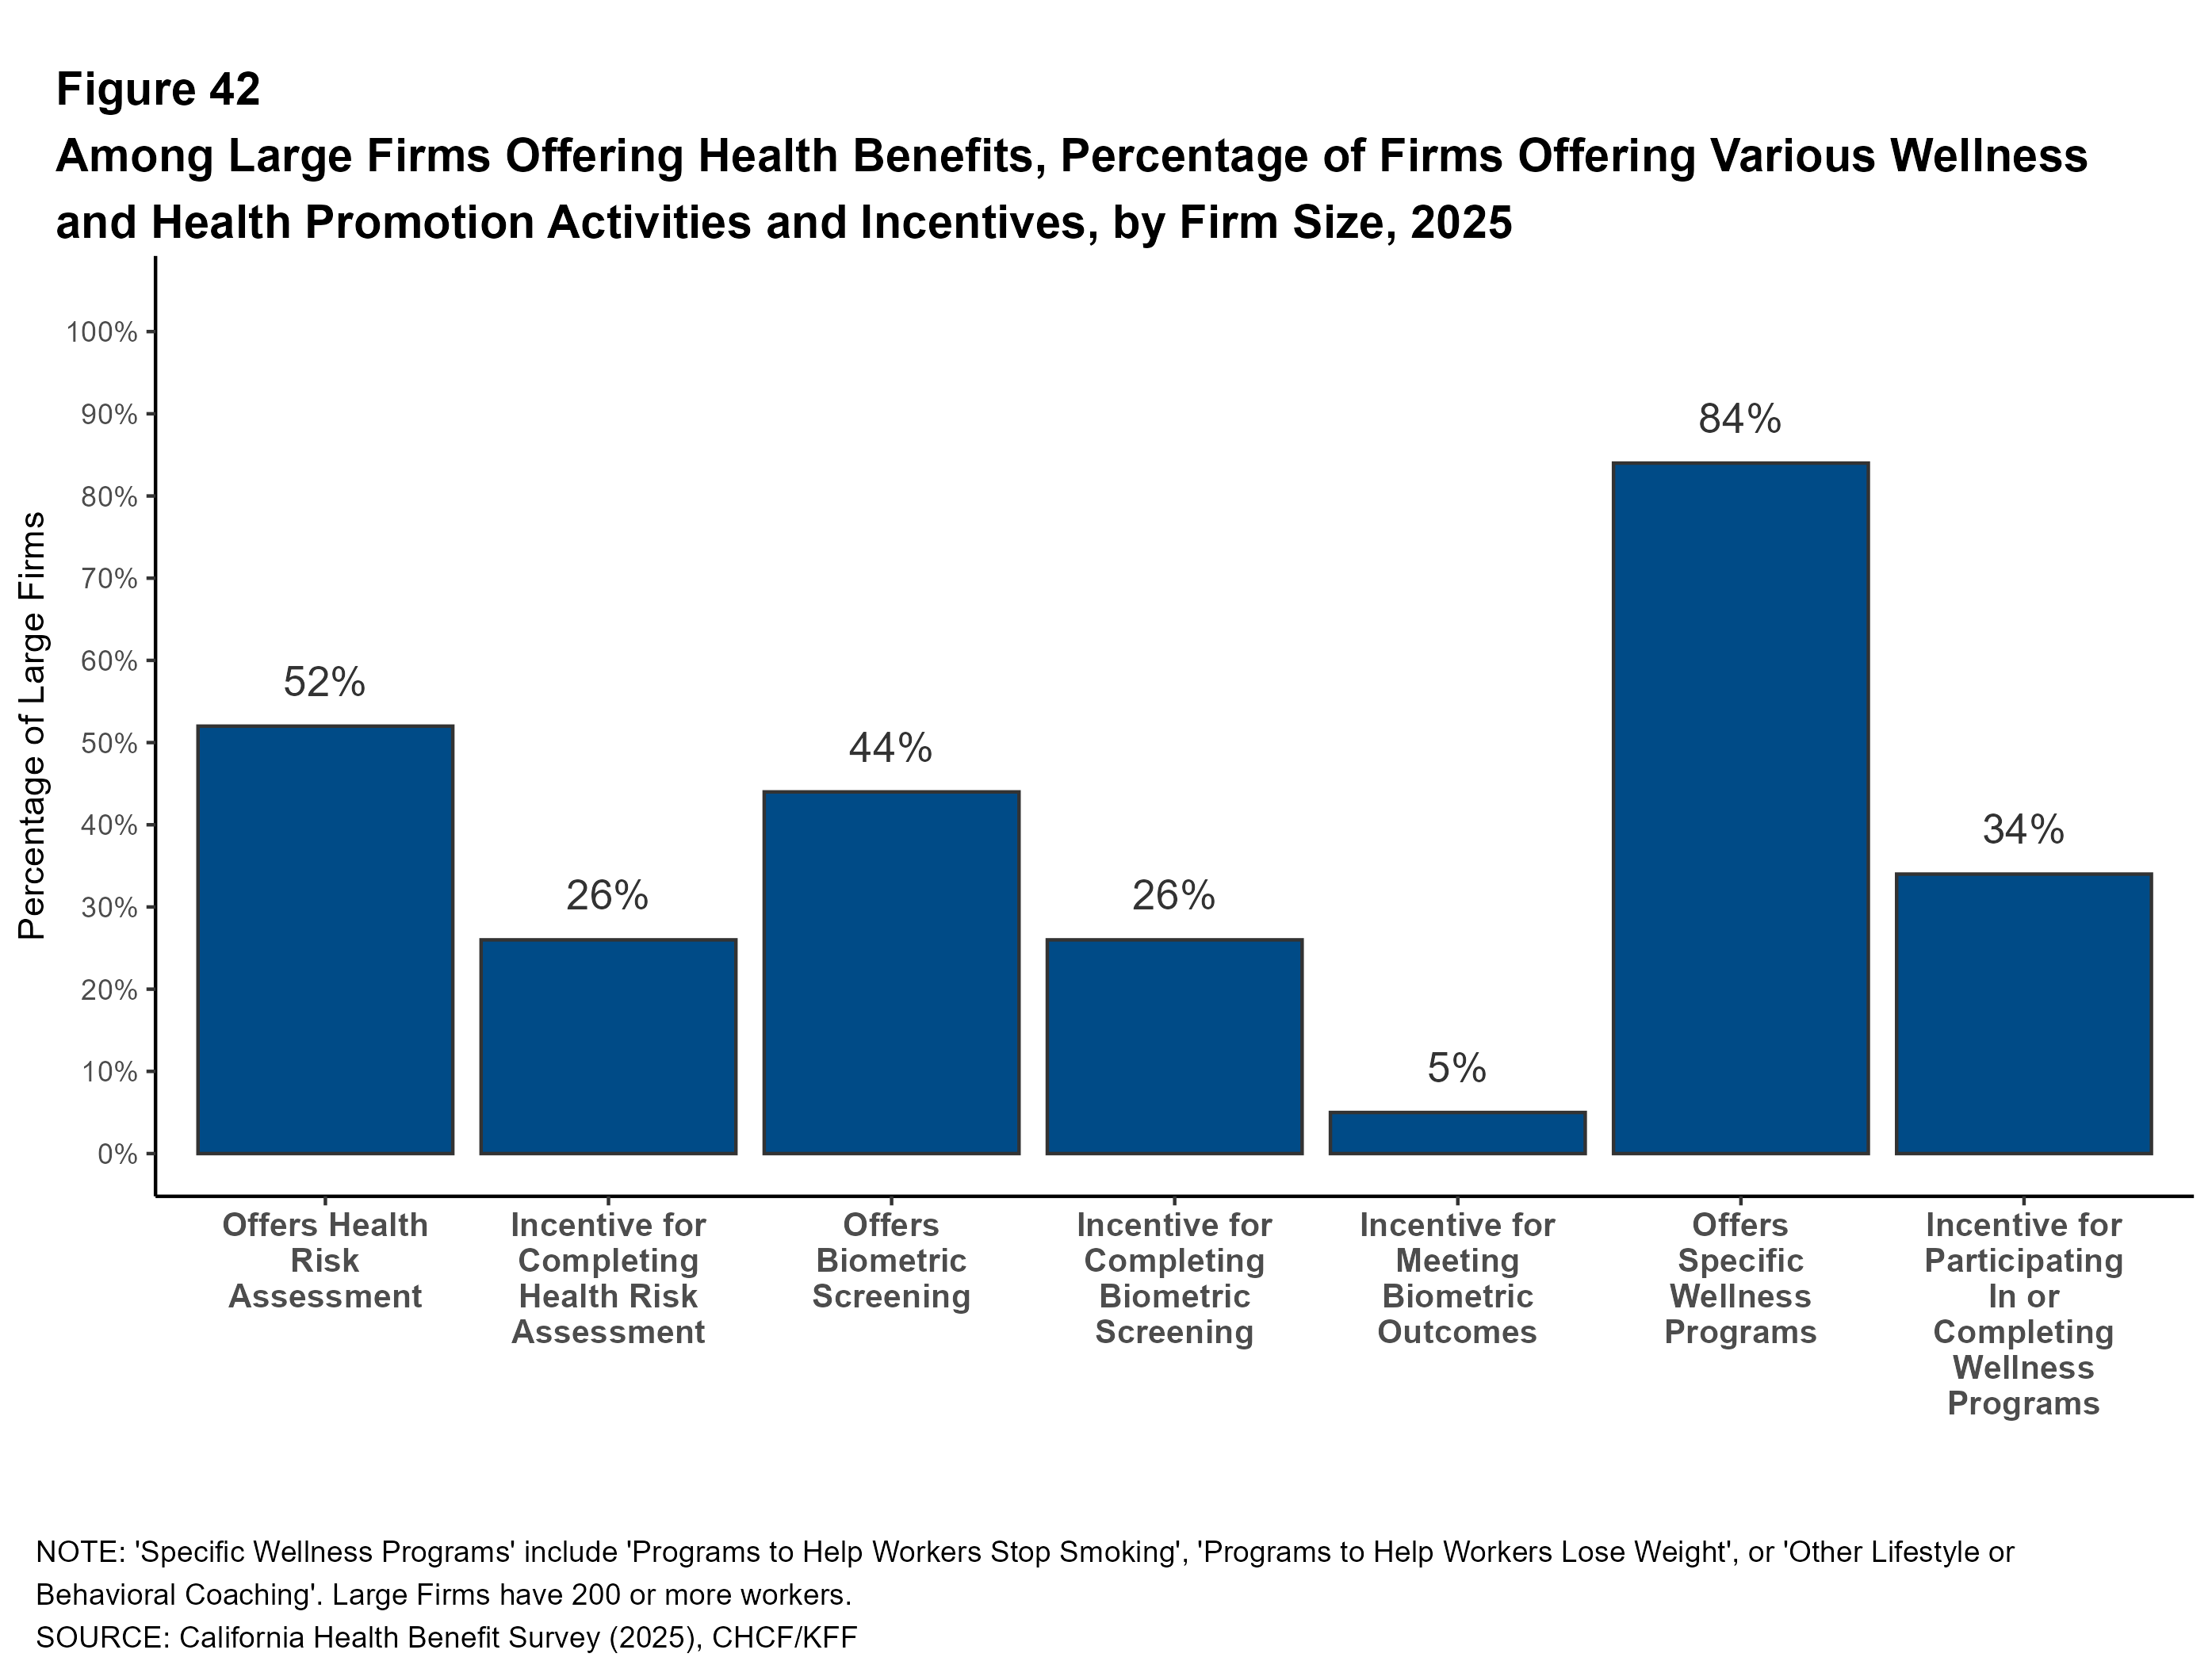
Health Risk Assessments: Fifty-two percent of California firms with 200 or more workers provide workers the opportunity to complete a health risk assessment in 2025. Among these large firms with a health risk assessment program, 49% use incentives or penalties to encourage workers to complete the assessment.
Biometeric Screening: Forty-four percent of California firms with 200 or more workers provide workers the opportunity to complete a biometric screening in 2025. Among these large firms with a biometric screening program, 59% use incentives or penalties to encourage workers to complete the screening. Among these large firms with a biometric screening program, 12% have incentives or penalties tied to whether enrollees meet or achieve specified biometric outcomes, such as maintaining a certain cholesterol level or body weight.
Taken together, 63% of California firms with 200 or more workers offering health benefits offer at least one of these health screening programs, including 81% of firms with 5,000 or more workers.
Wellness and Health Promotion
Many California firms with 200 or more workers offering health benefits also offer programs to encourage workers and their dependents to improve their health, including programs to help them to stop smoking or using tobacco (47%), or lose weight (47%), or other lifestyle or behavioral coaching (52%).
Overall, 84% of California firms with 200 or more workers offering health benefits also offer at least one of these three types of programs to their workers, including 96% of firms with 5,000 or more workers. Employers may offer incentives to encourage employees to participate in these programs.
Policy, Employer Perspectives and Strategies
Employers offering health benefits were asked about several aspects of their plan designs, network and coverage.
Provider Networks and Access to Primary Care
The design and structure of an employer’s provider network plays a significant role in the access to health services granted by their health plans. In their role as health care purchasers, employers may design networks to reduce costs by steering enrollees toward more efficient providers. Employers also may develop programs intended to supplement enrollee access to care.
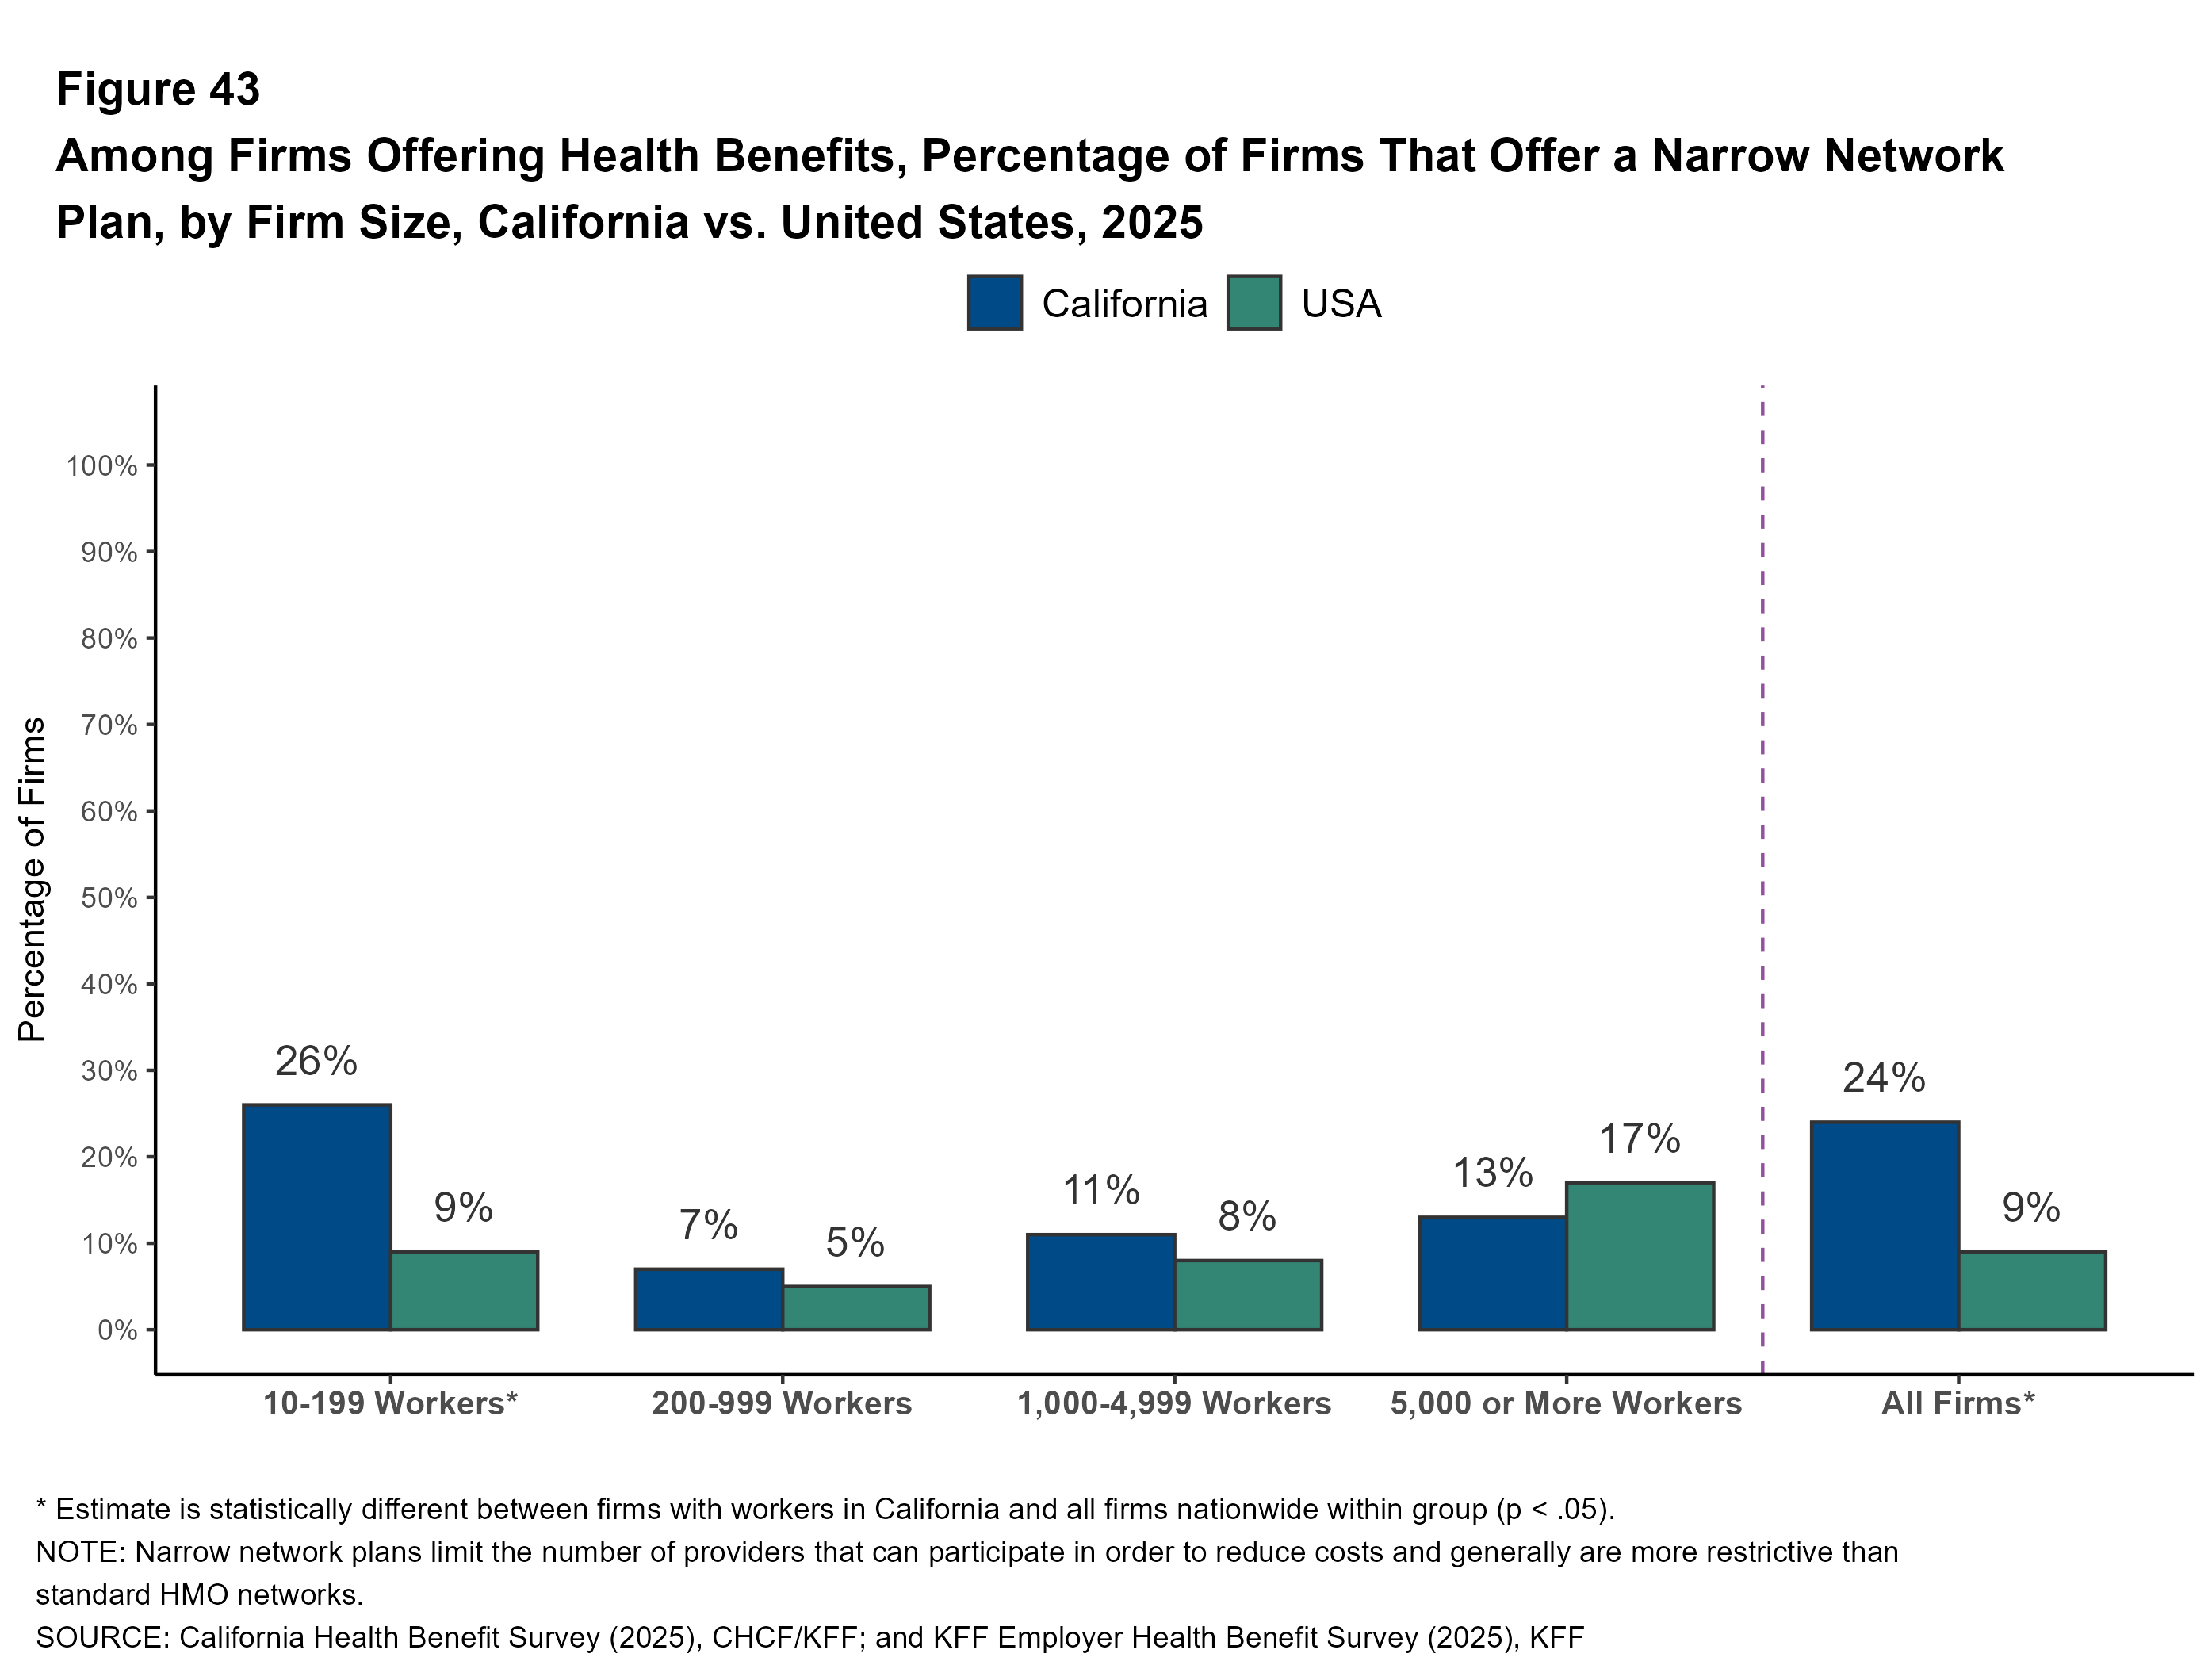
Narrow Networks: Some employers offer their employees a health plan with a narrow, or relatively small, network of providers. Narrow network plans limit the number of providers that can participate in order to lower premiums and reduce costs. These networks are generally more restrictive than standard HMO networks.
- Twenty-four percent of California firms offering health benefits offered at least one narrow network plan to their workers in 2025.
- Firms with 10-199 workers in California are more likely to offer at least one plan with a narrow network than small firms nationally (26% vs. 9%).
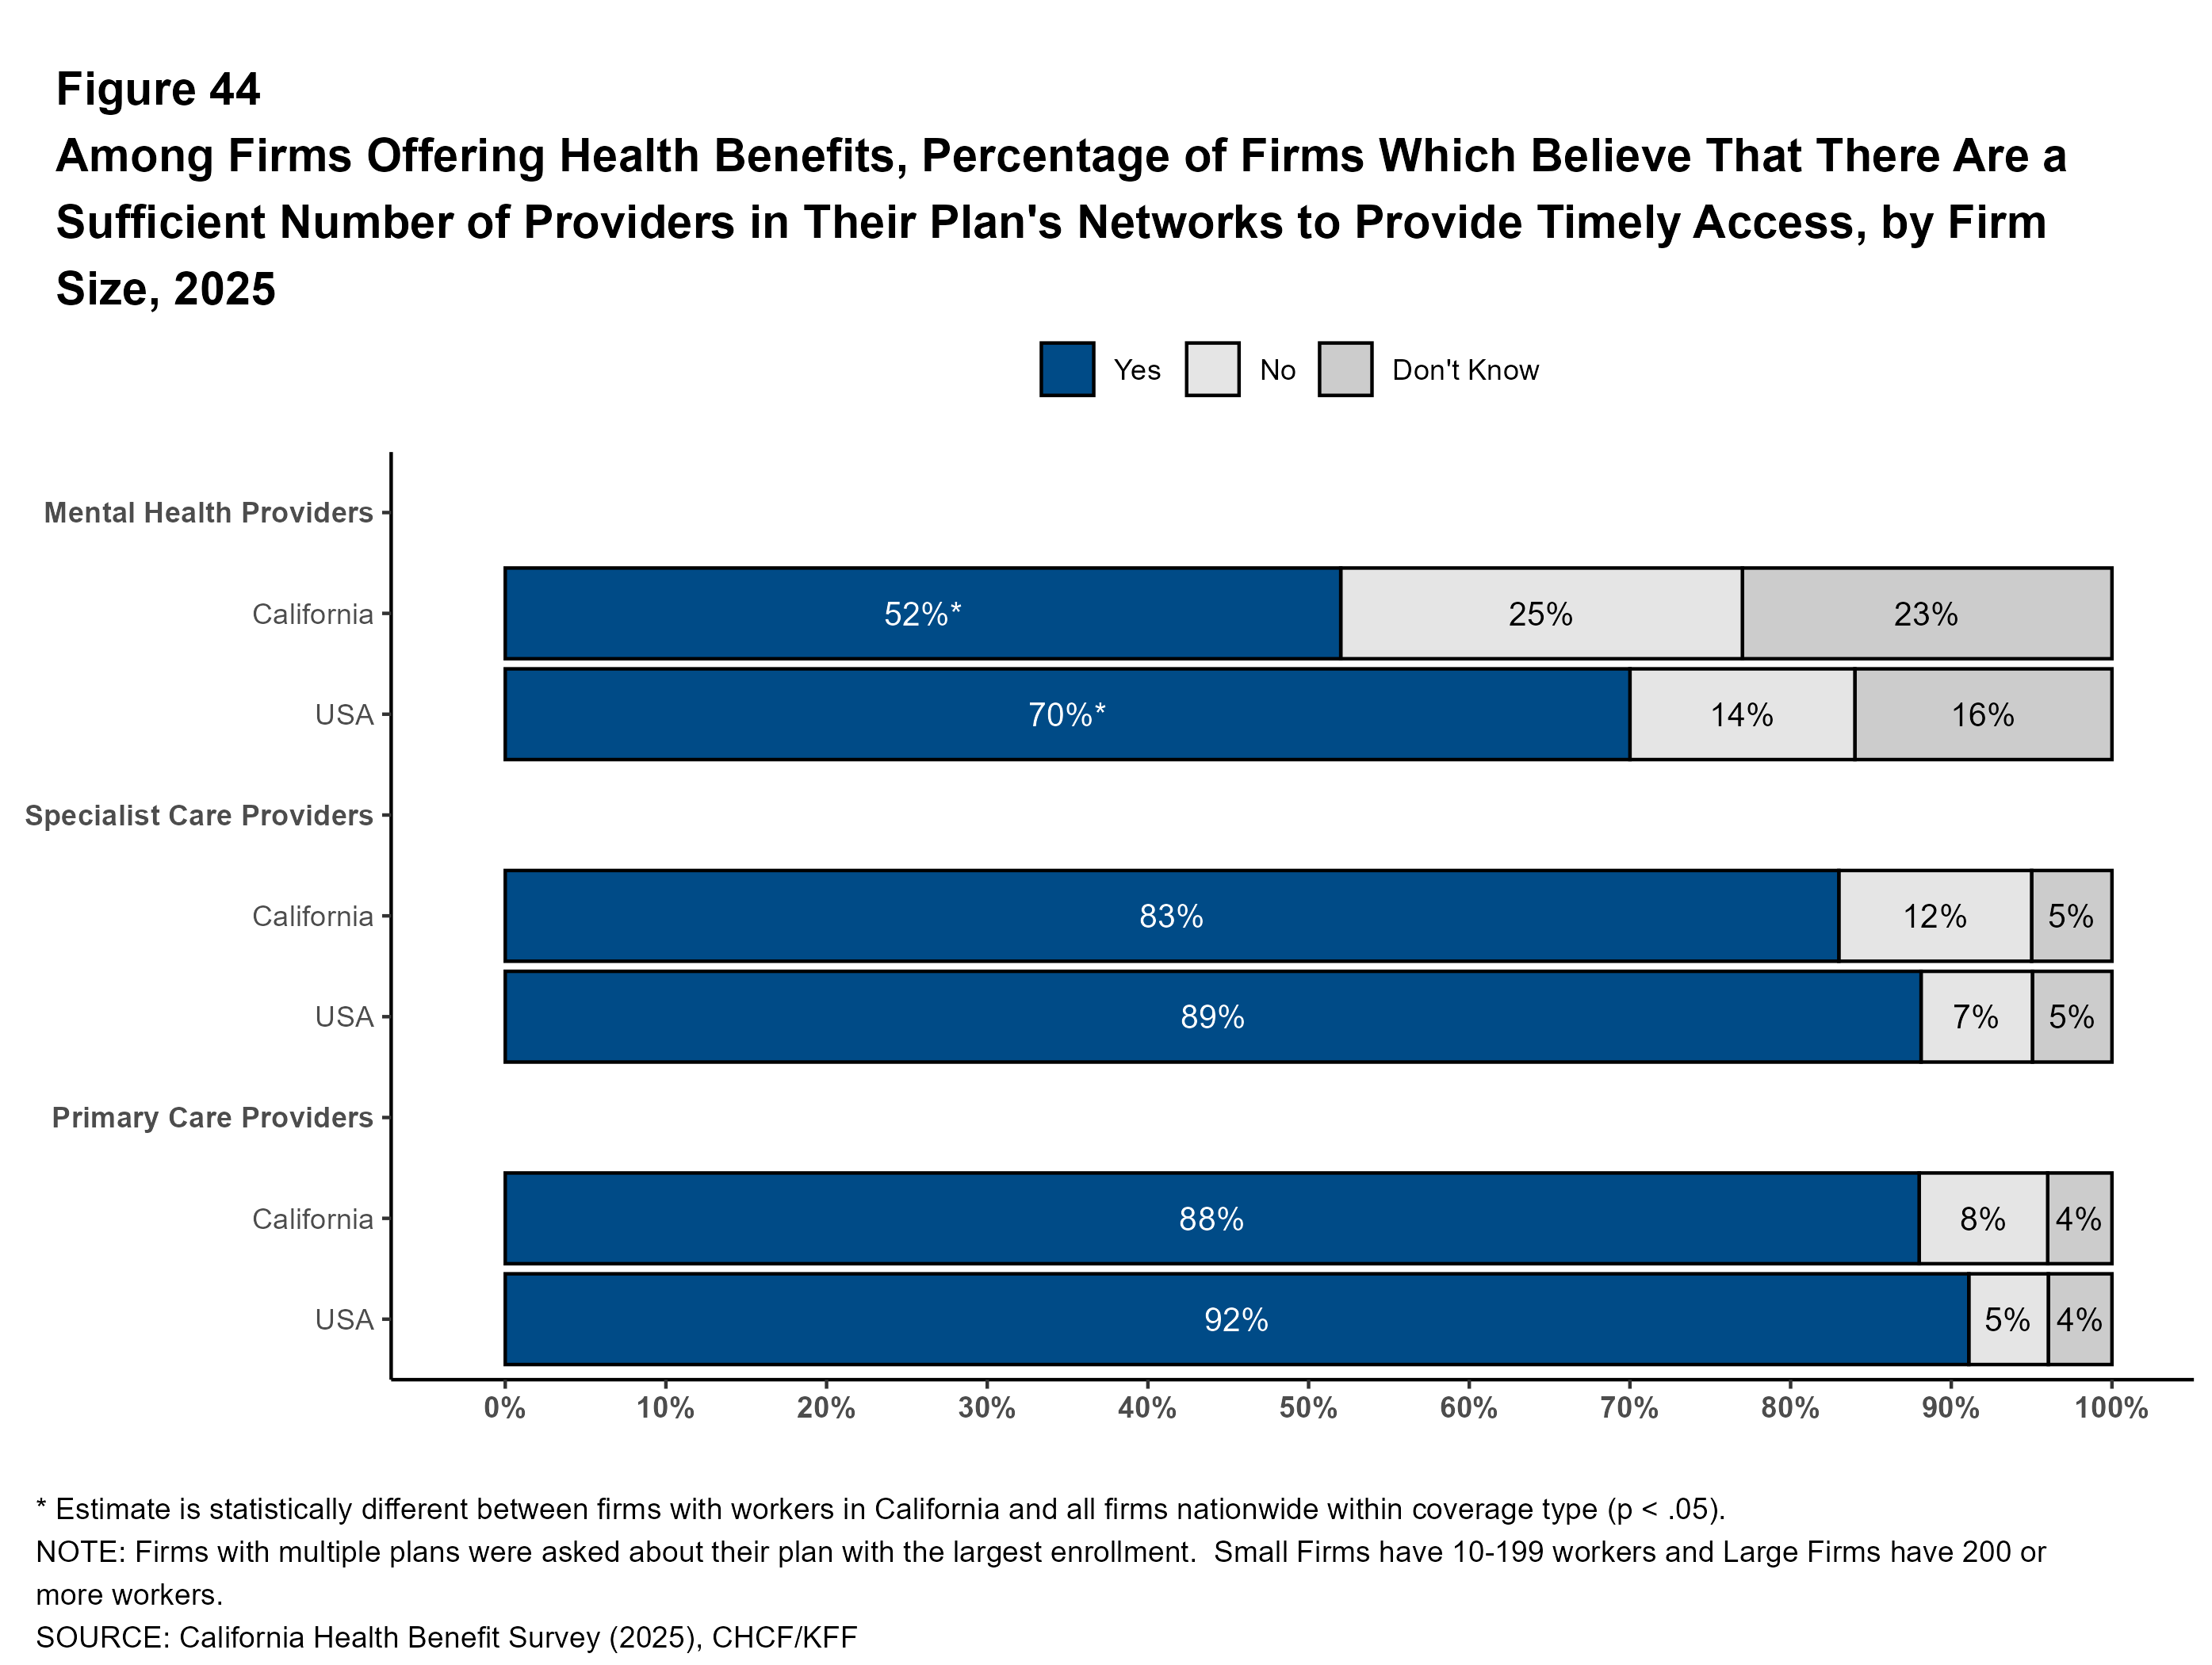
Sufficiency of Networks: Provider shortages or restricted provider networks may mean there may not be enough available providers in plan networks to ensure enrollees have timely access to care. Firms offering health benefits were asked whether they believed that the provider network for their health plan with the largest enrollment had a sufficient number of providers to provide timely access to primary care, specialty care, and mental health services.
Among firms offering health benefits, 88% say that there is a sufficient number of providers in their health plan with the largest enrollment to provide timely access to primary care services and 83% say there is a sufficient number of specialist providers.
Conversely, only 52% of California firms that offer health benefits say that there is a sufficient number of providers in their health plan with the largest enrollment to provide timely access to mental health services for plan enrollees.
California employers are less likely than employers nationally to report having a sufficient number of mental health providers in their networks in their plan with the largest enrollment. Among firms with 10 to 199 workers offering health benefits in California, 52% indicate there are enough mental health providers, compared to 70% nationally. Among larger employers in California, 60% report having a sufficient number of mental health providers, compared to 68% nationally.
Other Network Strategies: Employers may work with health plans or vendors to modify or supplement plan networks to reduce costs or improve access. Employers were asked about a range of provider network strategies they had implemented.
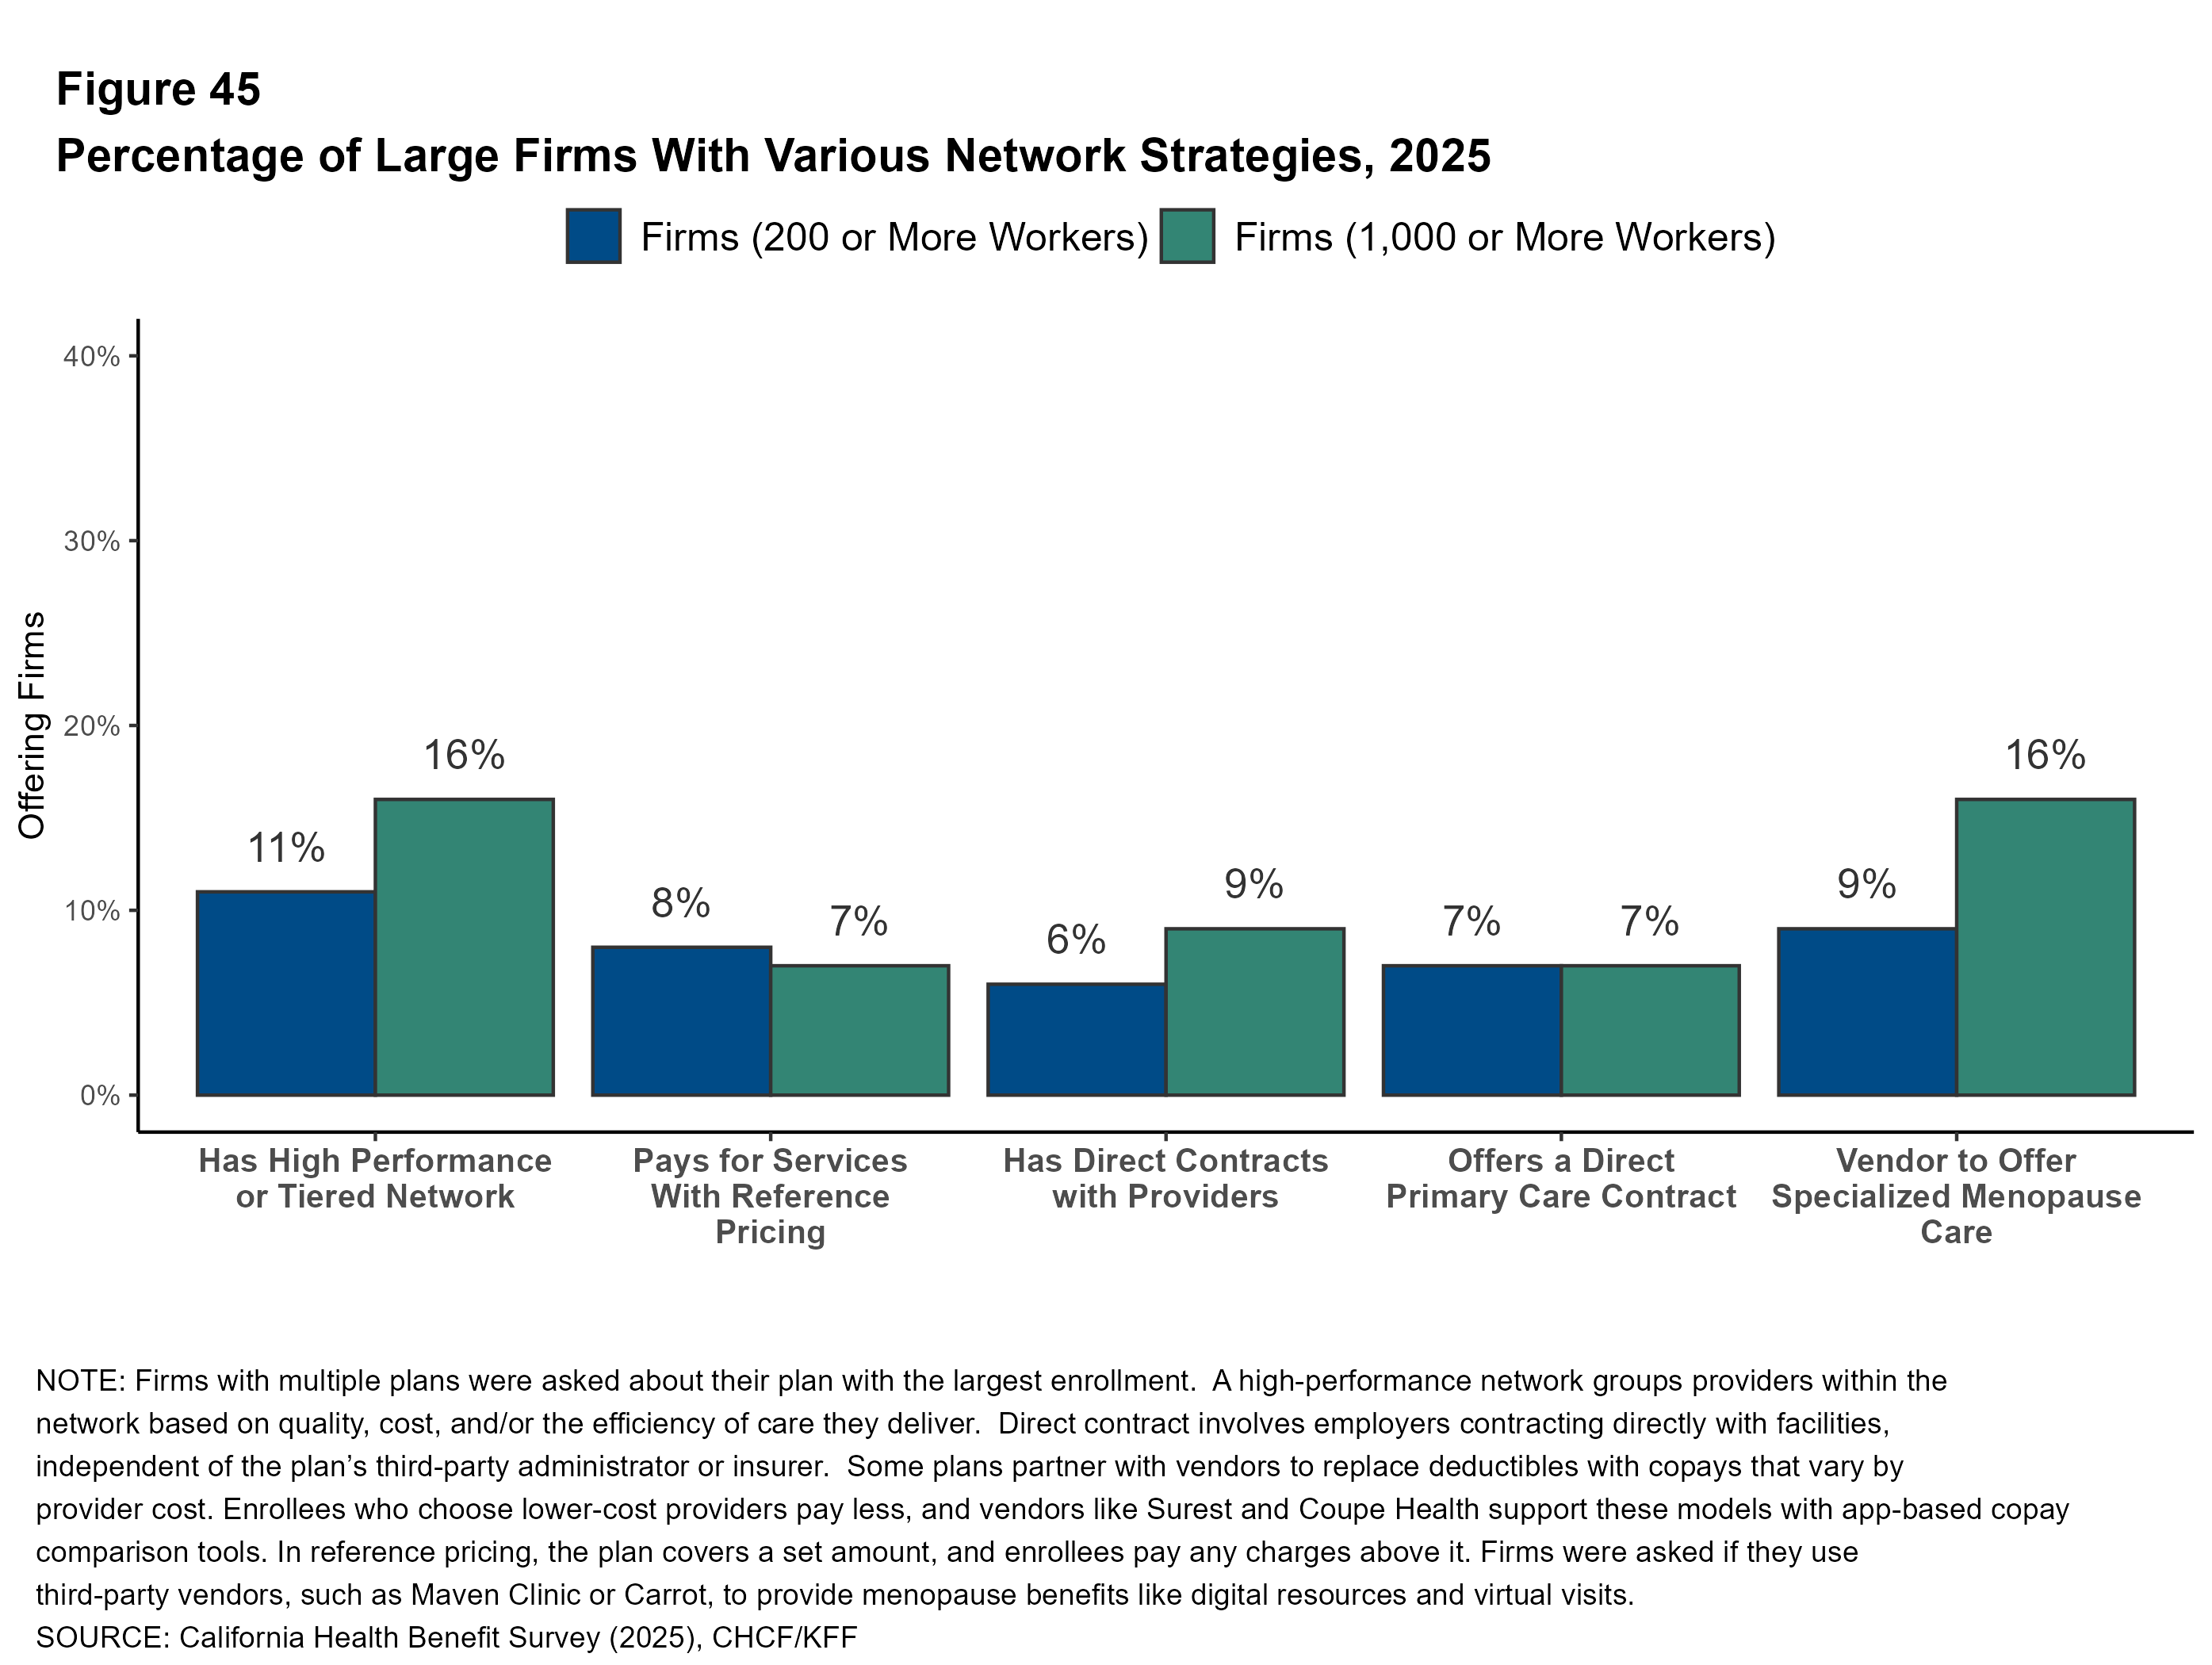
- A small percentage of large employers contract directly with providers, such as hospitals or health systems, to provide for their employees outside of their health plan’s network. Among large California firms that offer health benefits 6% directly contract with a provider, including 15% of firms with 5,000 or more workers.
- Some firms offer plans with high-performance networks or tiered networks. These plans use cost sharing or other incentives to encourage enrollees to use in-network providers that have better performance or lower costs. Among California firms with 200 or more workers that offer health benefits, 11% offer a health plan with a high-performance or tiered network, including 16% of firms with 5,000 or more workers.
- Some employers may contract with a vendor to offer specialized care or a virtual care benefit for enrollees during menopause. These services may include education, access to specialty care and mental health support. Among California employers with 200 or more workers that offer health benefits, 9% have vendor contracts to provide support for workers or their dependents during menopause, including 19% of firms with 5,000 or more workers.
Primary Care
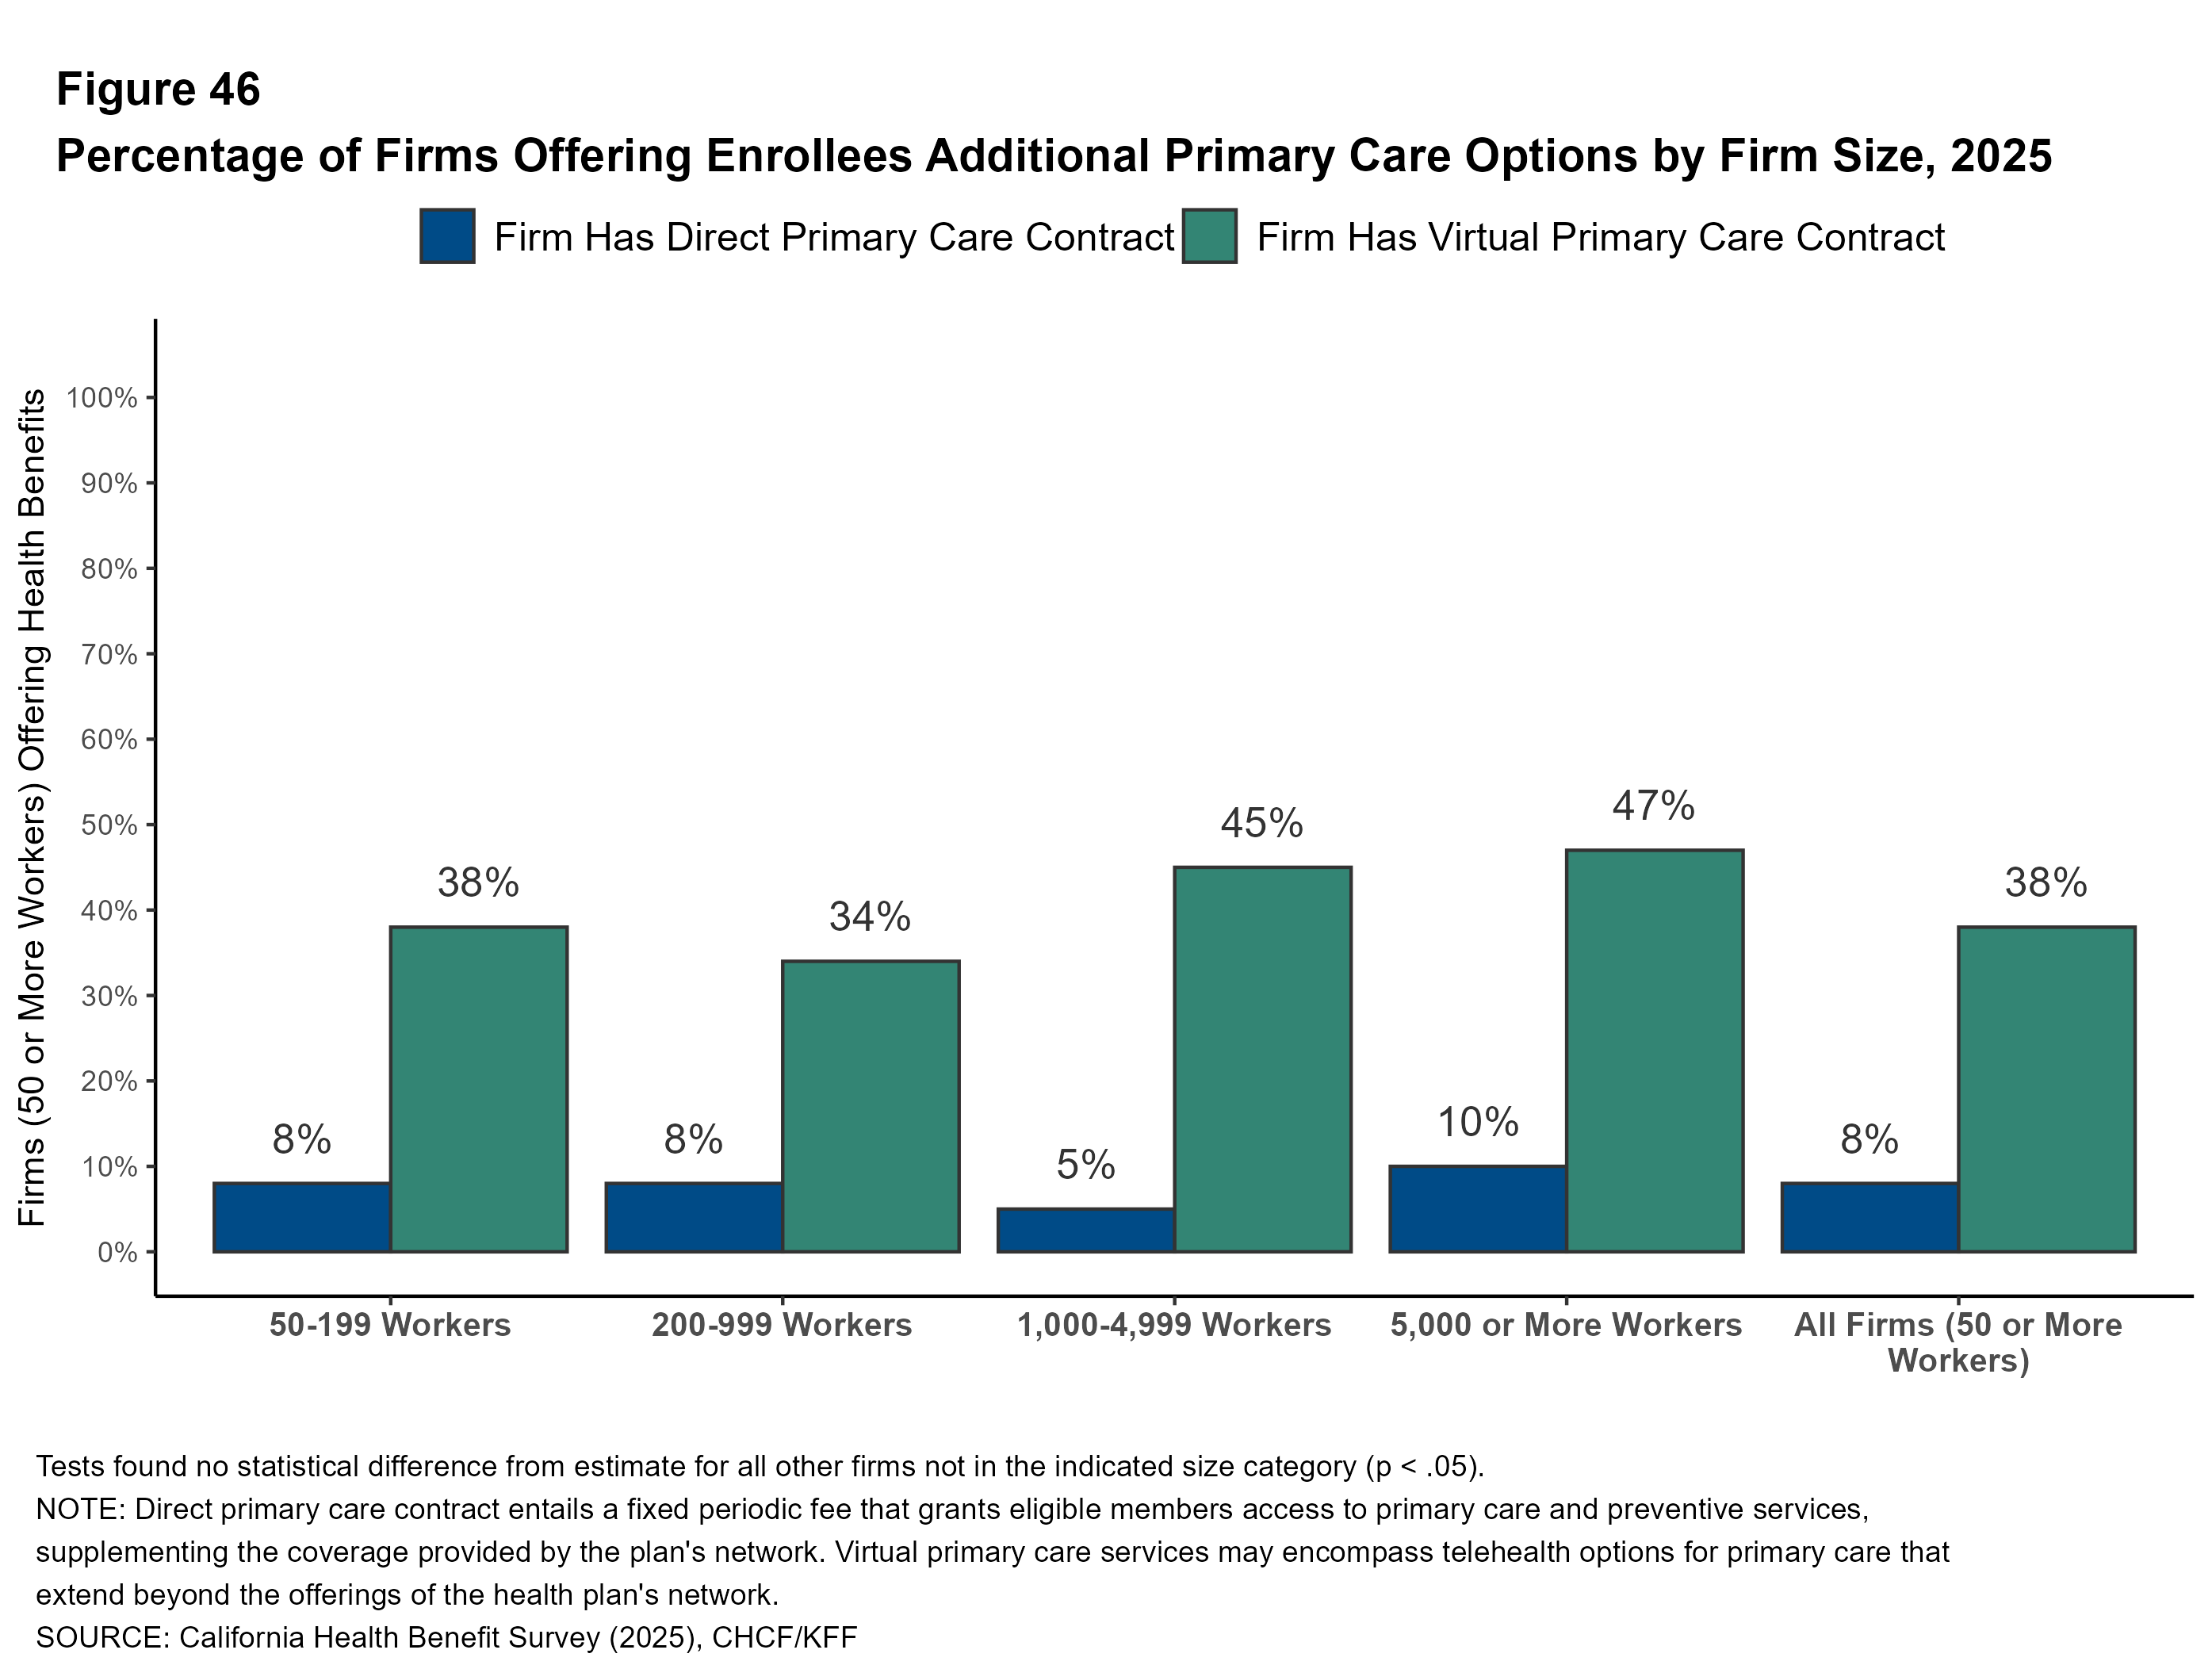
Alternative approaches to provide primary care, such as virtual care and direct primary care contracts, are sometimes offered by employers.
Among California firms with 50 or more workers that offer health benefits, 38% have a contract to provide virtual primary care services, including telehealth, that go beyond the services provided in their health plan networks. Firms with 1,000 or more workers are more likely than smaller firms to have a contract for virtual primary care services (46% vs. 37% respectively).
A direct primary care contract entails a fixed periodic fee that grants eligible members access to primary care and preventive services, supplementing the coverage provided by the plan’s network. Among firms in California with 50 or more employees that offer health benefits, 8% have a direct primary care contract in addition to the providers in the health plan networks.
Factors Contributing to Rising Premiums
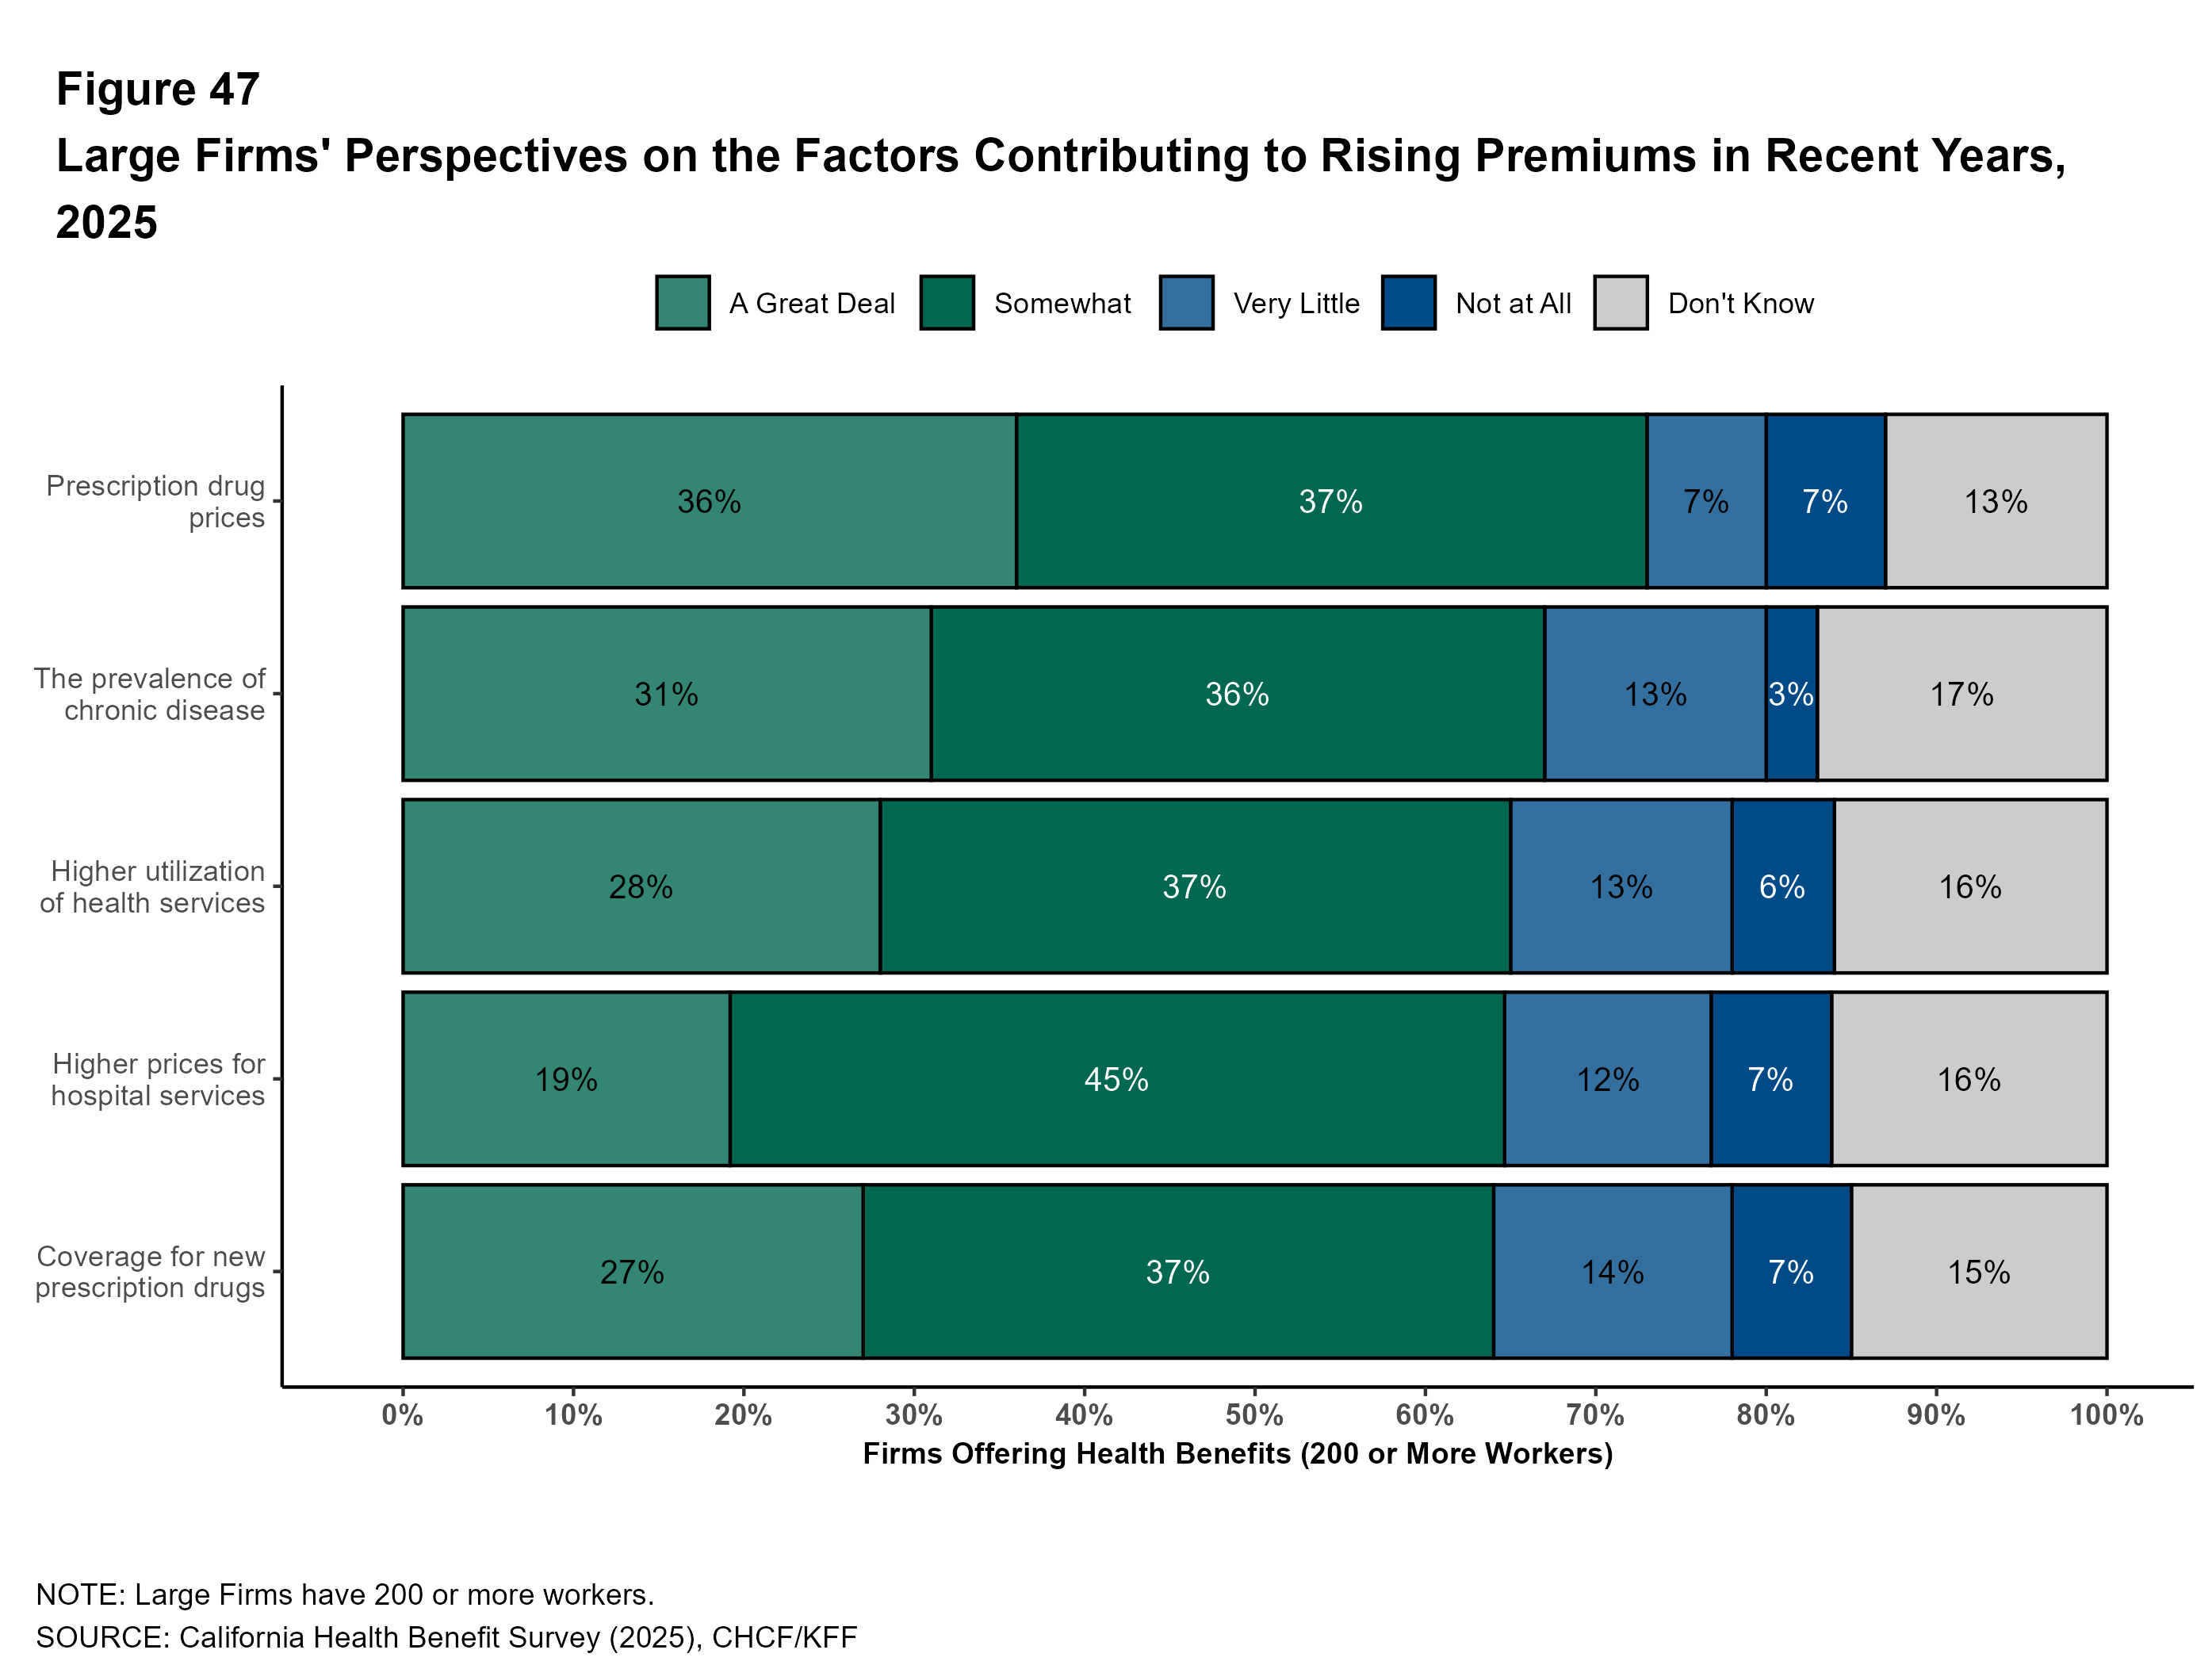
Firms that offer health benefits report on the factors that they believe have contributed to higher health plan premiums in recent years. Employers were asked about the impact of prescription drug prices, coverage for new prescription drugs, higher prices for hospital services, higher utilization of health services, and the prevalence of chronic disease.
Among California firms with 200 or more workers offering health benefits:
- Thirty-six percent say that prescription drug prices contributed “a great deal” to higher premiums; this includes 63% of firms with 5,000 or more workers.
- Thirty-one percent say that the prevalence of chronic disease contributed “a great deal” to higher premiums; this includes 46% of firms with 5,000 or more workers.
- Twenty-eight percent say that higher utilization of health services contributed “a great deal” to higher premiums; this includes 18% of firms with 5,000 or more workers.
- Twenty-seven percent say that the use of new prescriptions contributed “a great deal” to higher premiums; this includes 40% of firms with 5,000 or more workers.
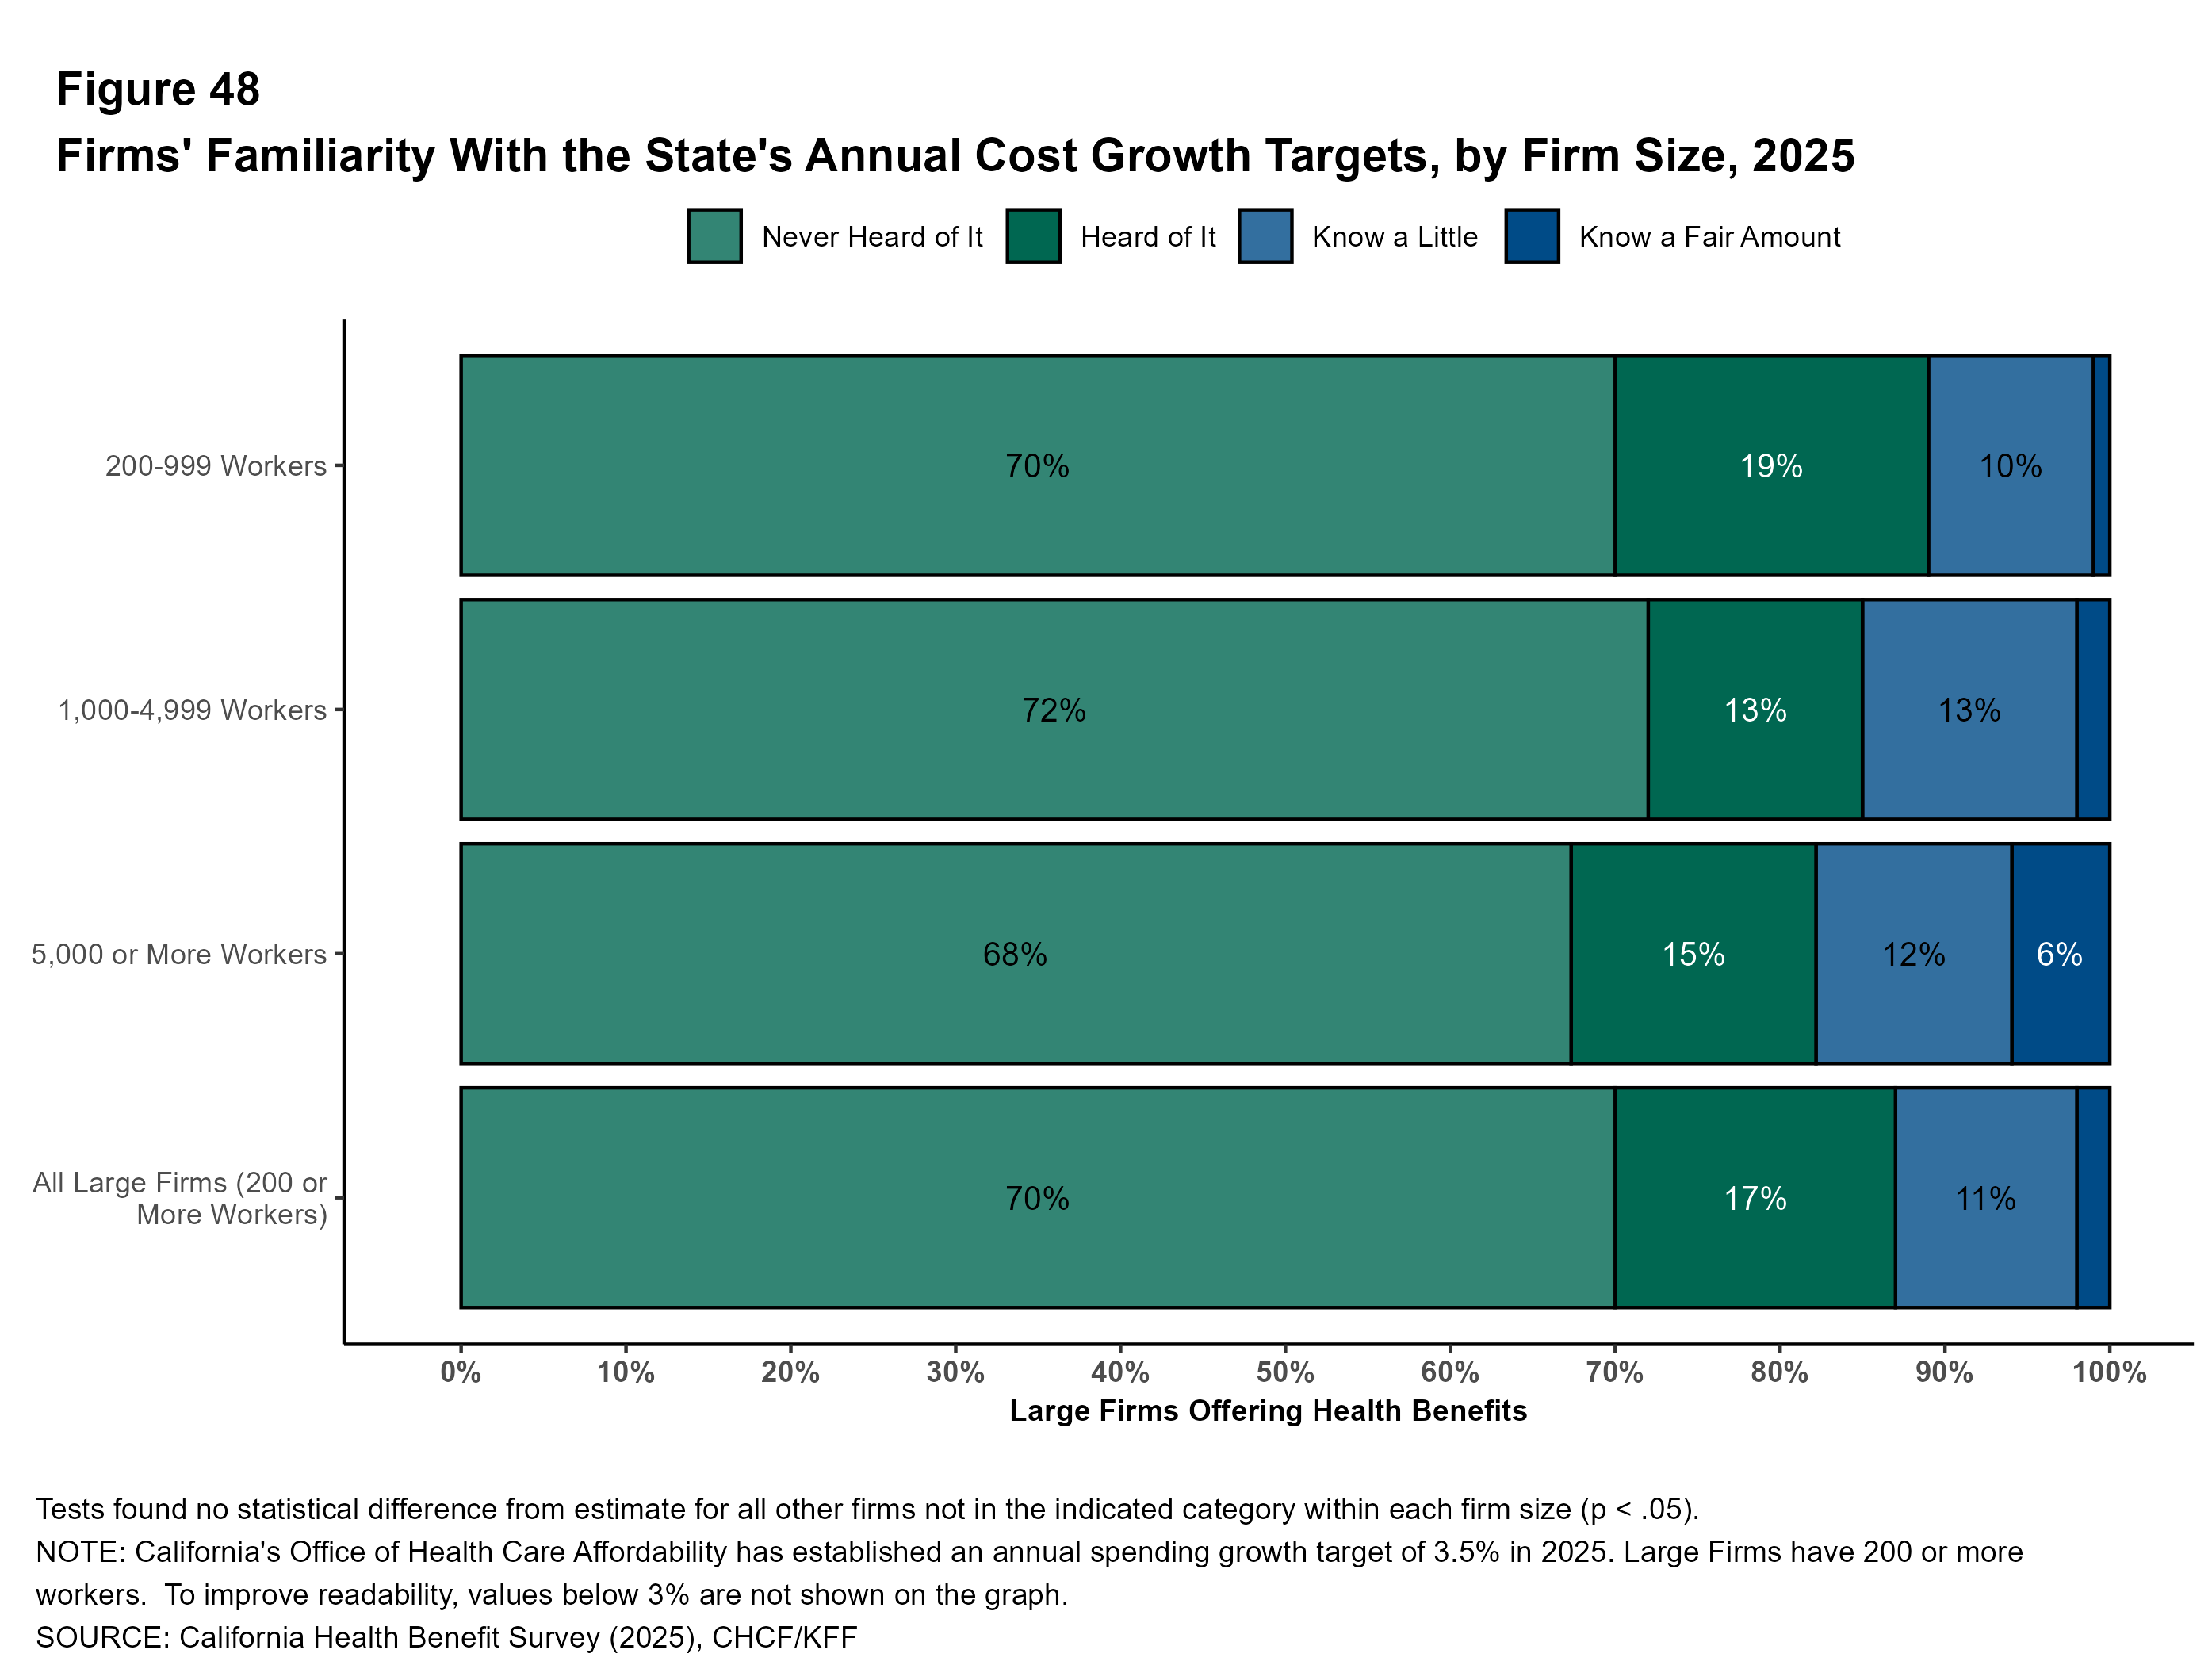
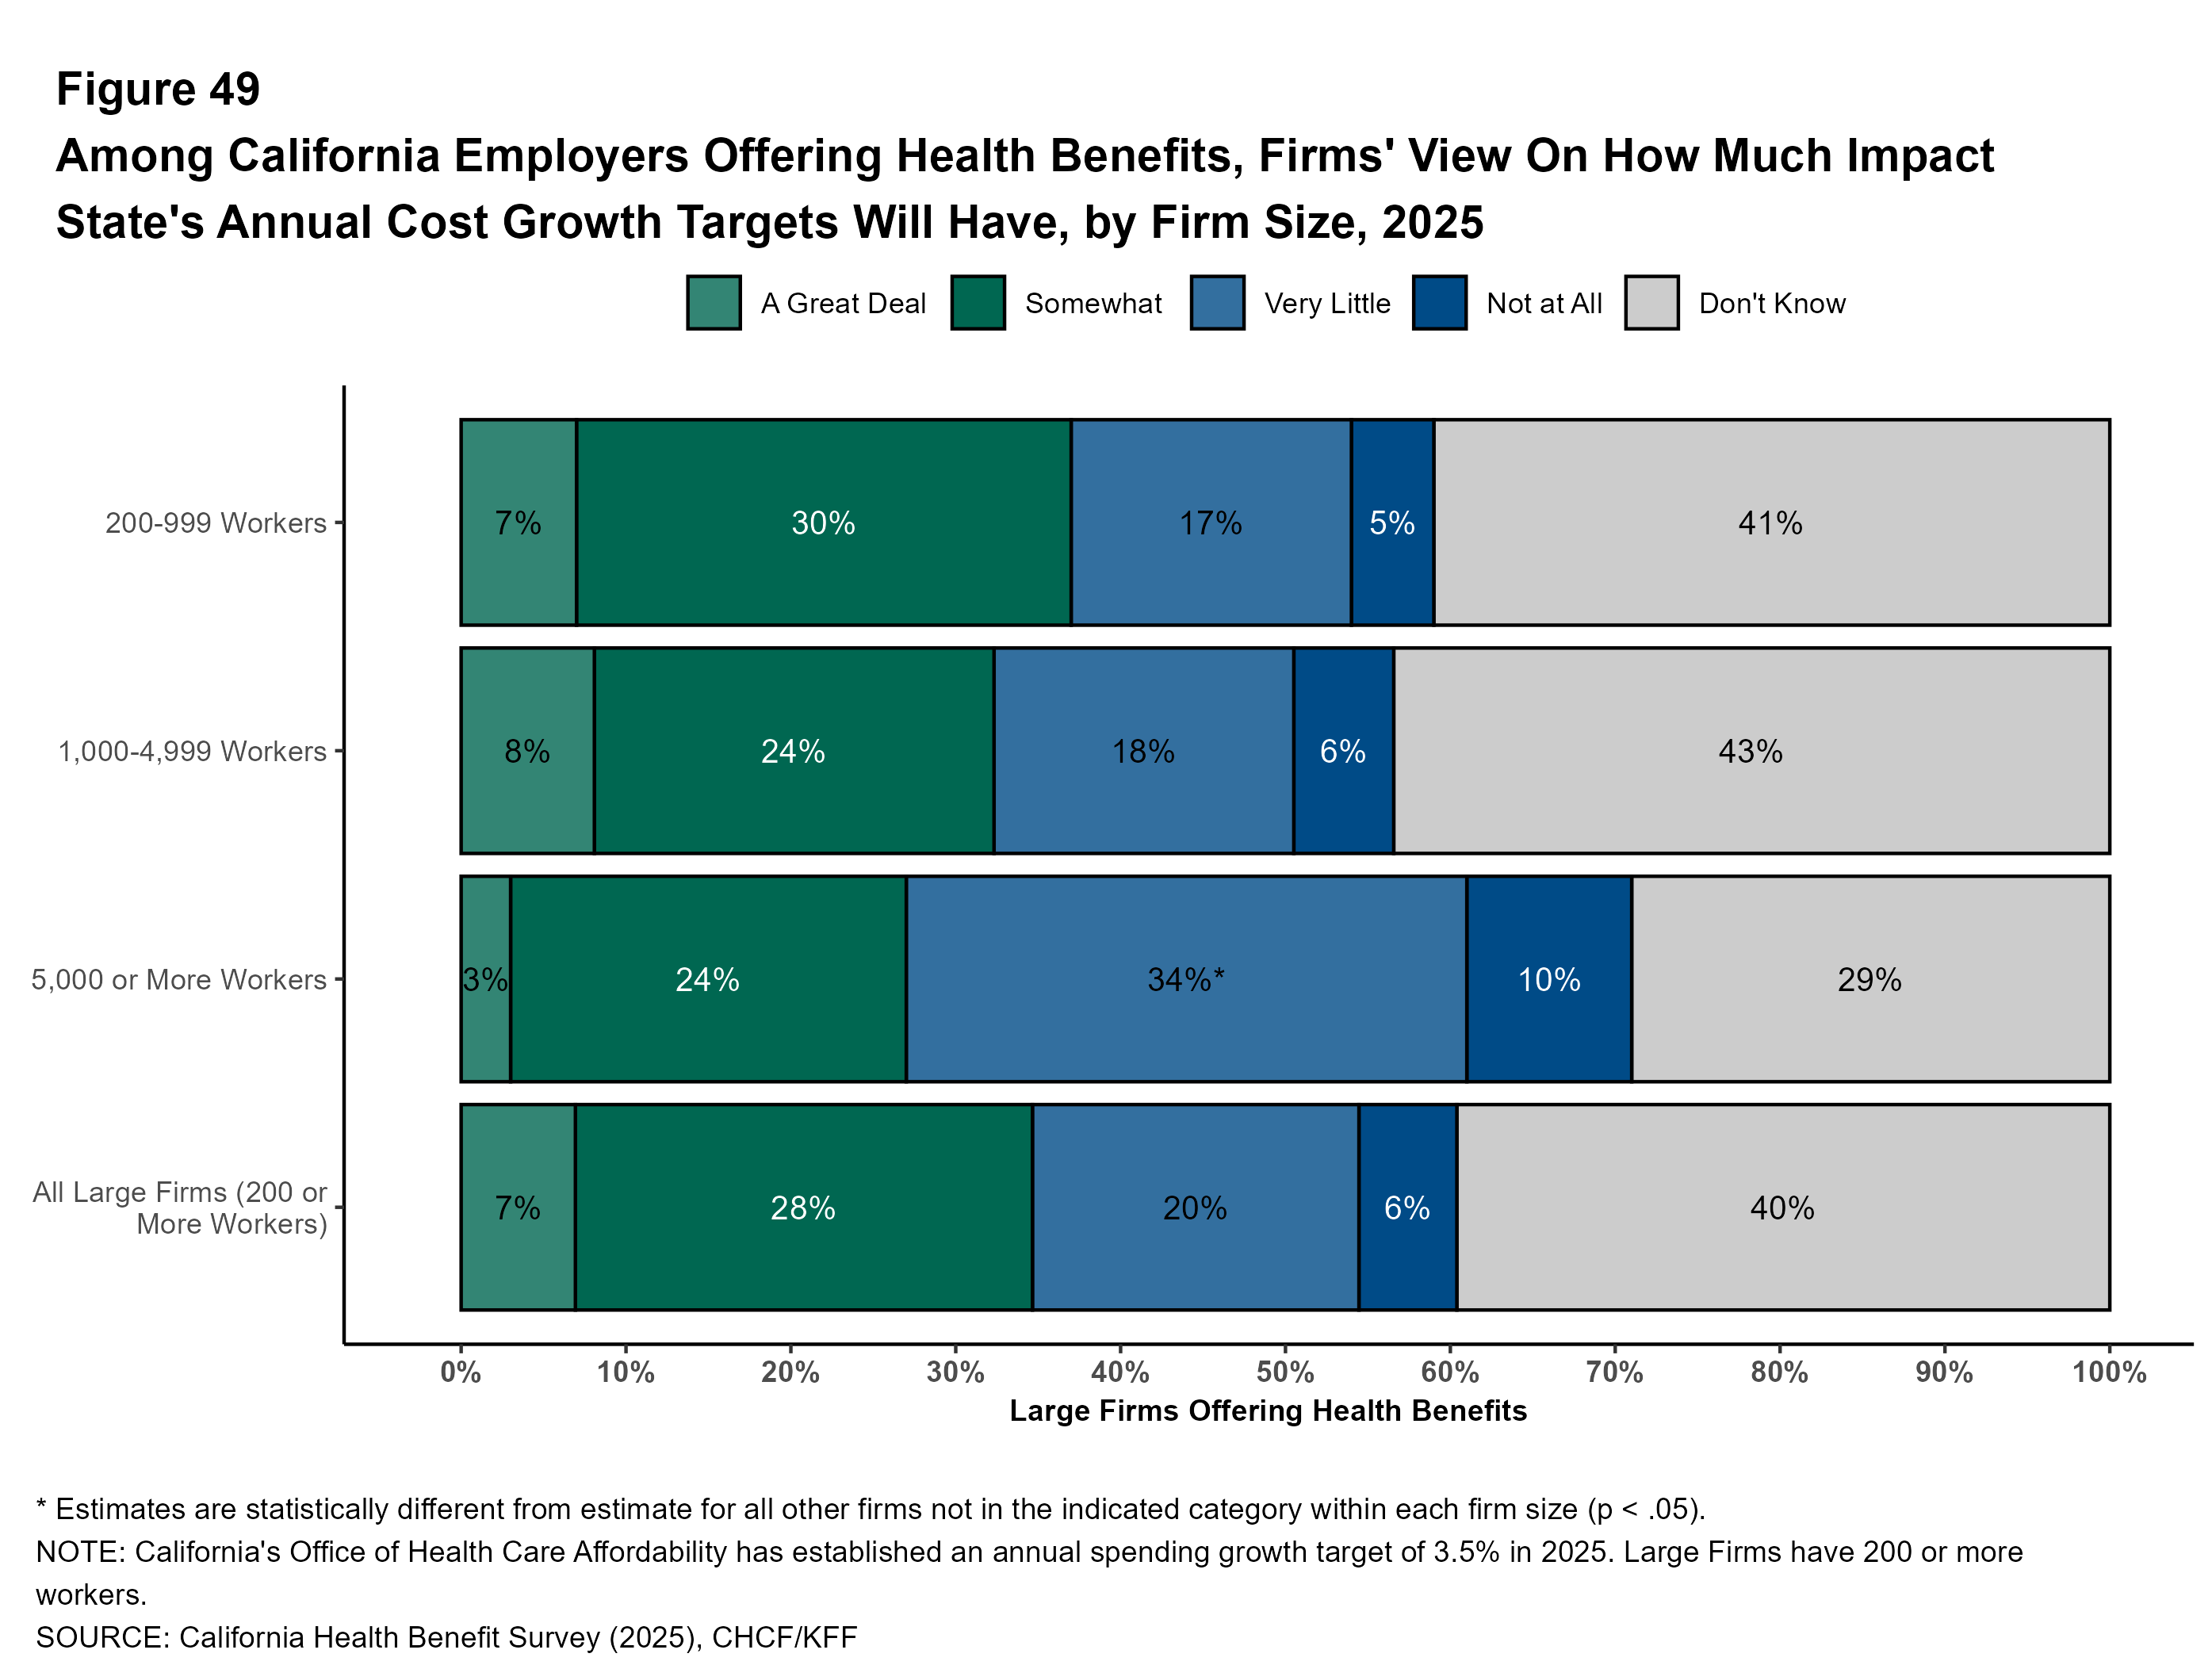
California’s Cost Growth Targets
California’s Office of Health Care Affordability has established a statewide health care spending growth target. Going forward, plans, purchasers, and regulators may use this target to encourage health care spending growth that is more in line with income growth for California families.
Familiarity With Targets: Among California employers with 200 or more workers offering health benefits, about seven in ten (70%) have not heard of the cost growth targets, and another 17% have “heard of it” but did not know any details. Only 2% say that they knew a “a fair amount” about the targets. Even among firms with 5,000 or more workers, only 6% say that they knew a “a fair amount” about them.
Impact of Targets: Given the low level of familiarity with the cost growth targets, relatively few employers think that they would have a big impact on health care spending. Seven percent of large California firms offering health benefits think that the targets would have “a great deal” of impact. Many employers do not know what the impact would be (40%).
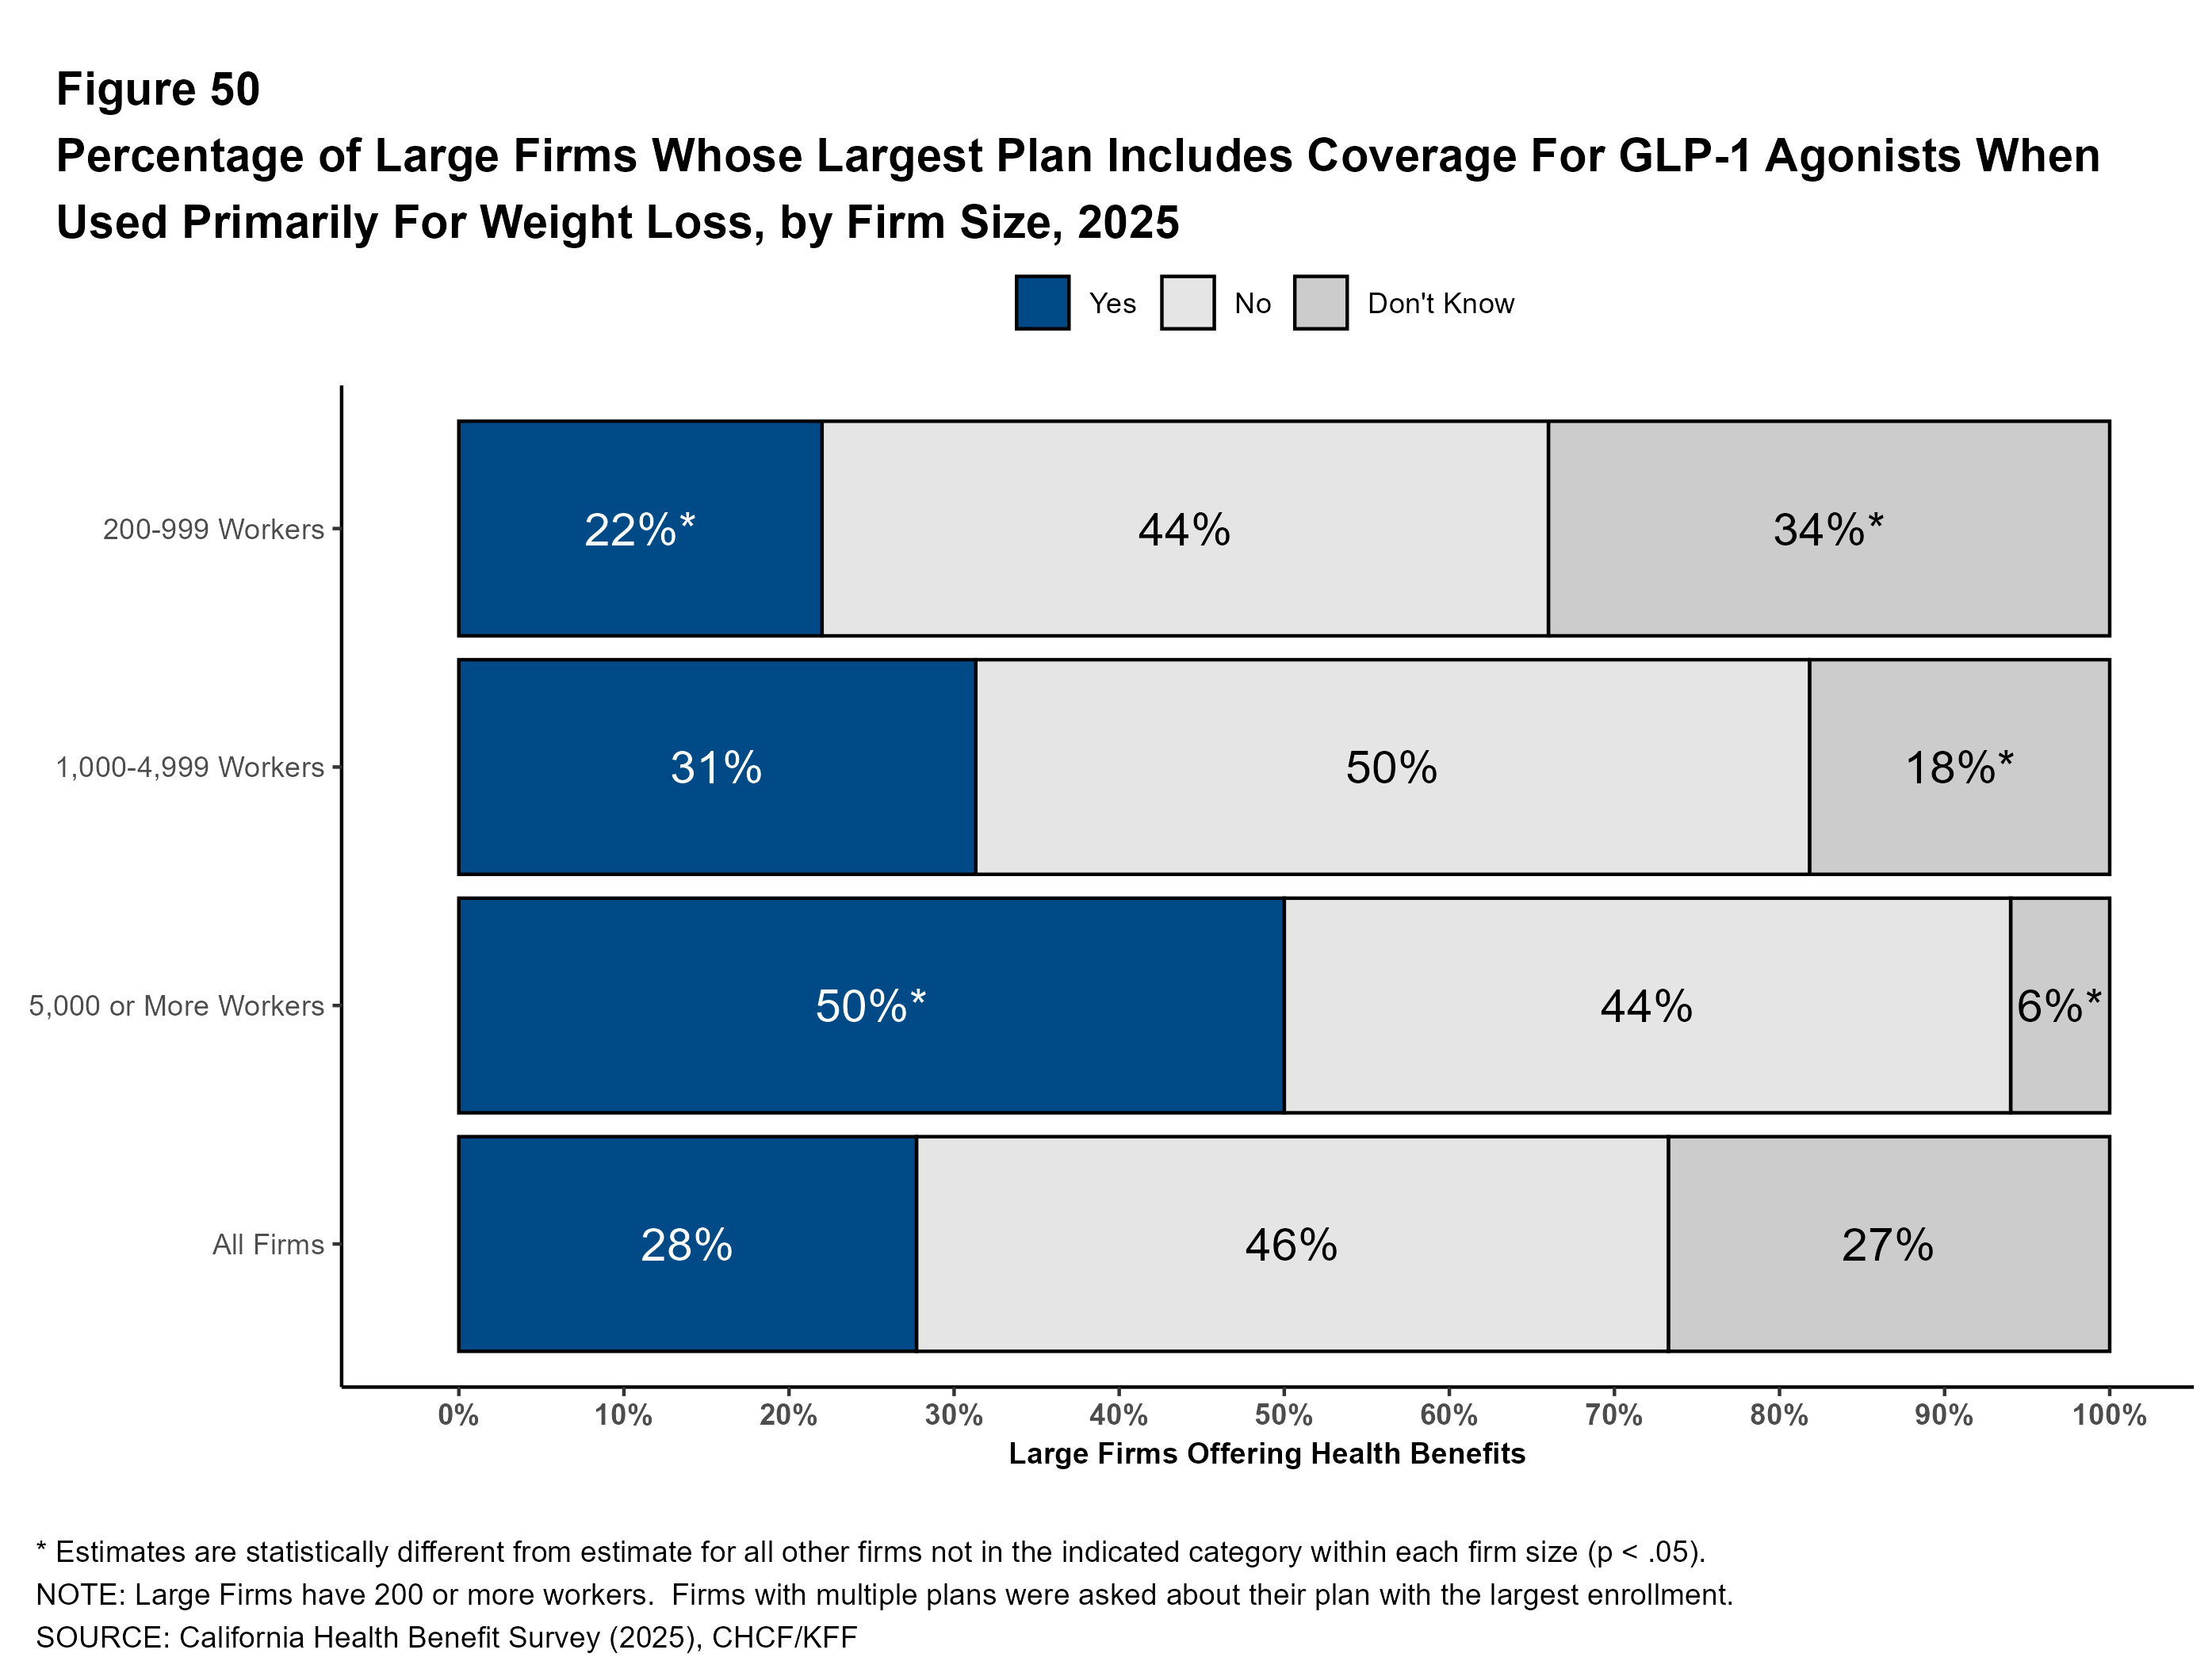
Coverage For GLP-1s For Weight Loss
Health plans generally cover GLP-1 agonists for people with diabetes. However, these medications can also be effective for weight loss. The relatively high price of these drugs, combined with potential for long-term usage, has raised concerns about the costs for plans that cover them.
In 2025, among California firms that provide health benefits, 22% of those with 200 to 999 workers, 31% of those with 1,000 to 4,999 workers, and 50% of those with 5,000 or more workers cover GLP-1 agonists when used primarily for weight loss in their largest plan.
A larger share of large firms in California cover GLP-1 agonists when used primarily for weight loss in their largest plan than large firms nationally (28% vs. 19% ). Among firms with 5,000 or more workers, 50% of firms in California covered GLP-1 agonists, compared to 43% nationally.
Many firms that cover these medications for weight loss require enrollees to take additional steps to address their weight. Among large firms in California that cover GLP-1 agonists for weight loss, 45% require enrollees to meet with a dietitian, case manager or therapist, or participate in a lifestyle program, in order to receive coverage.
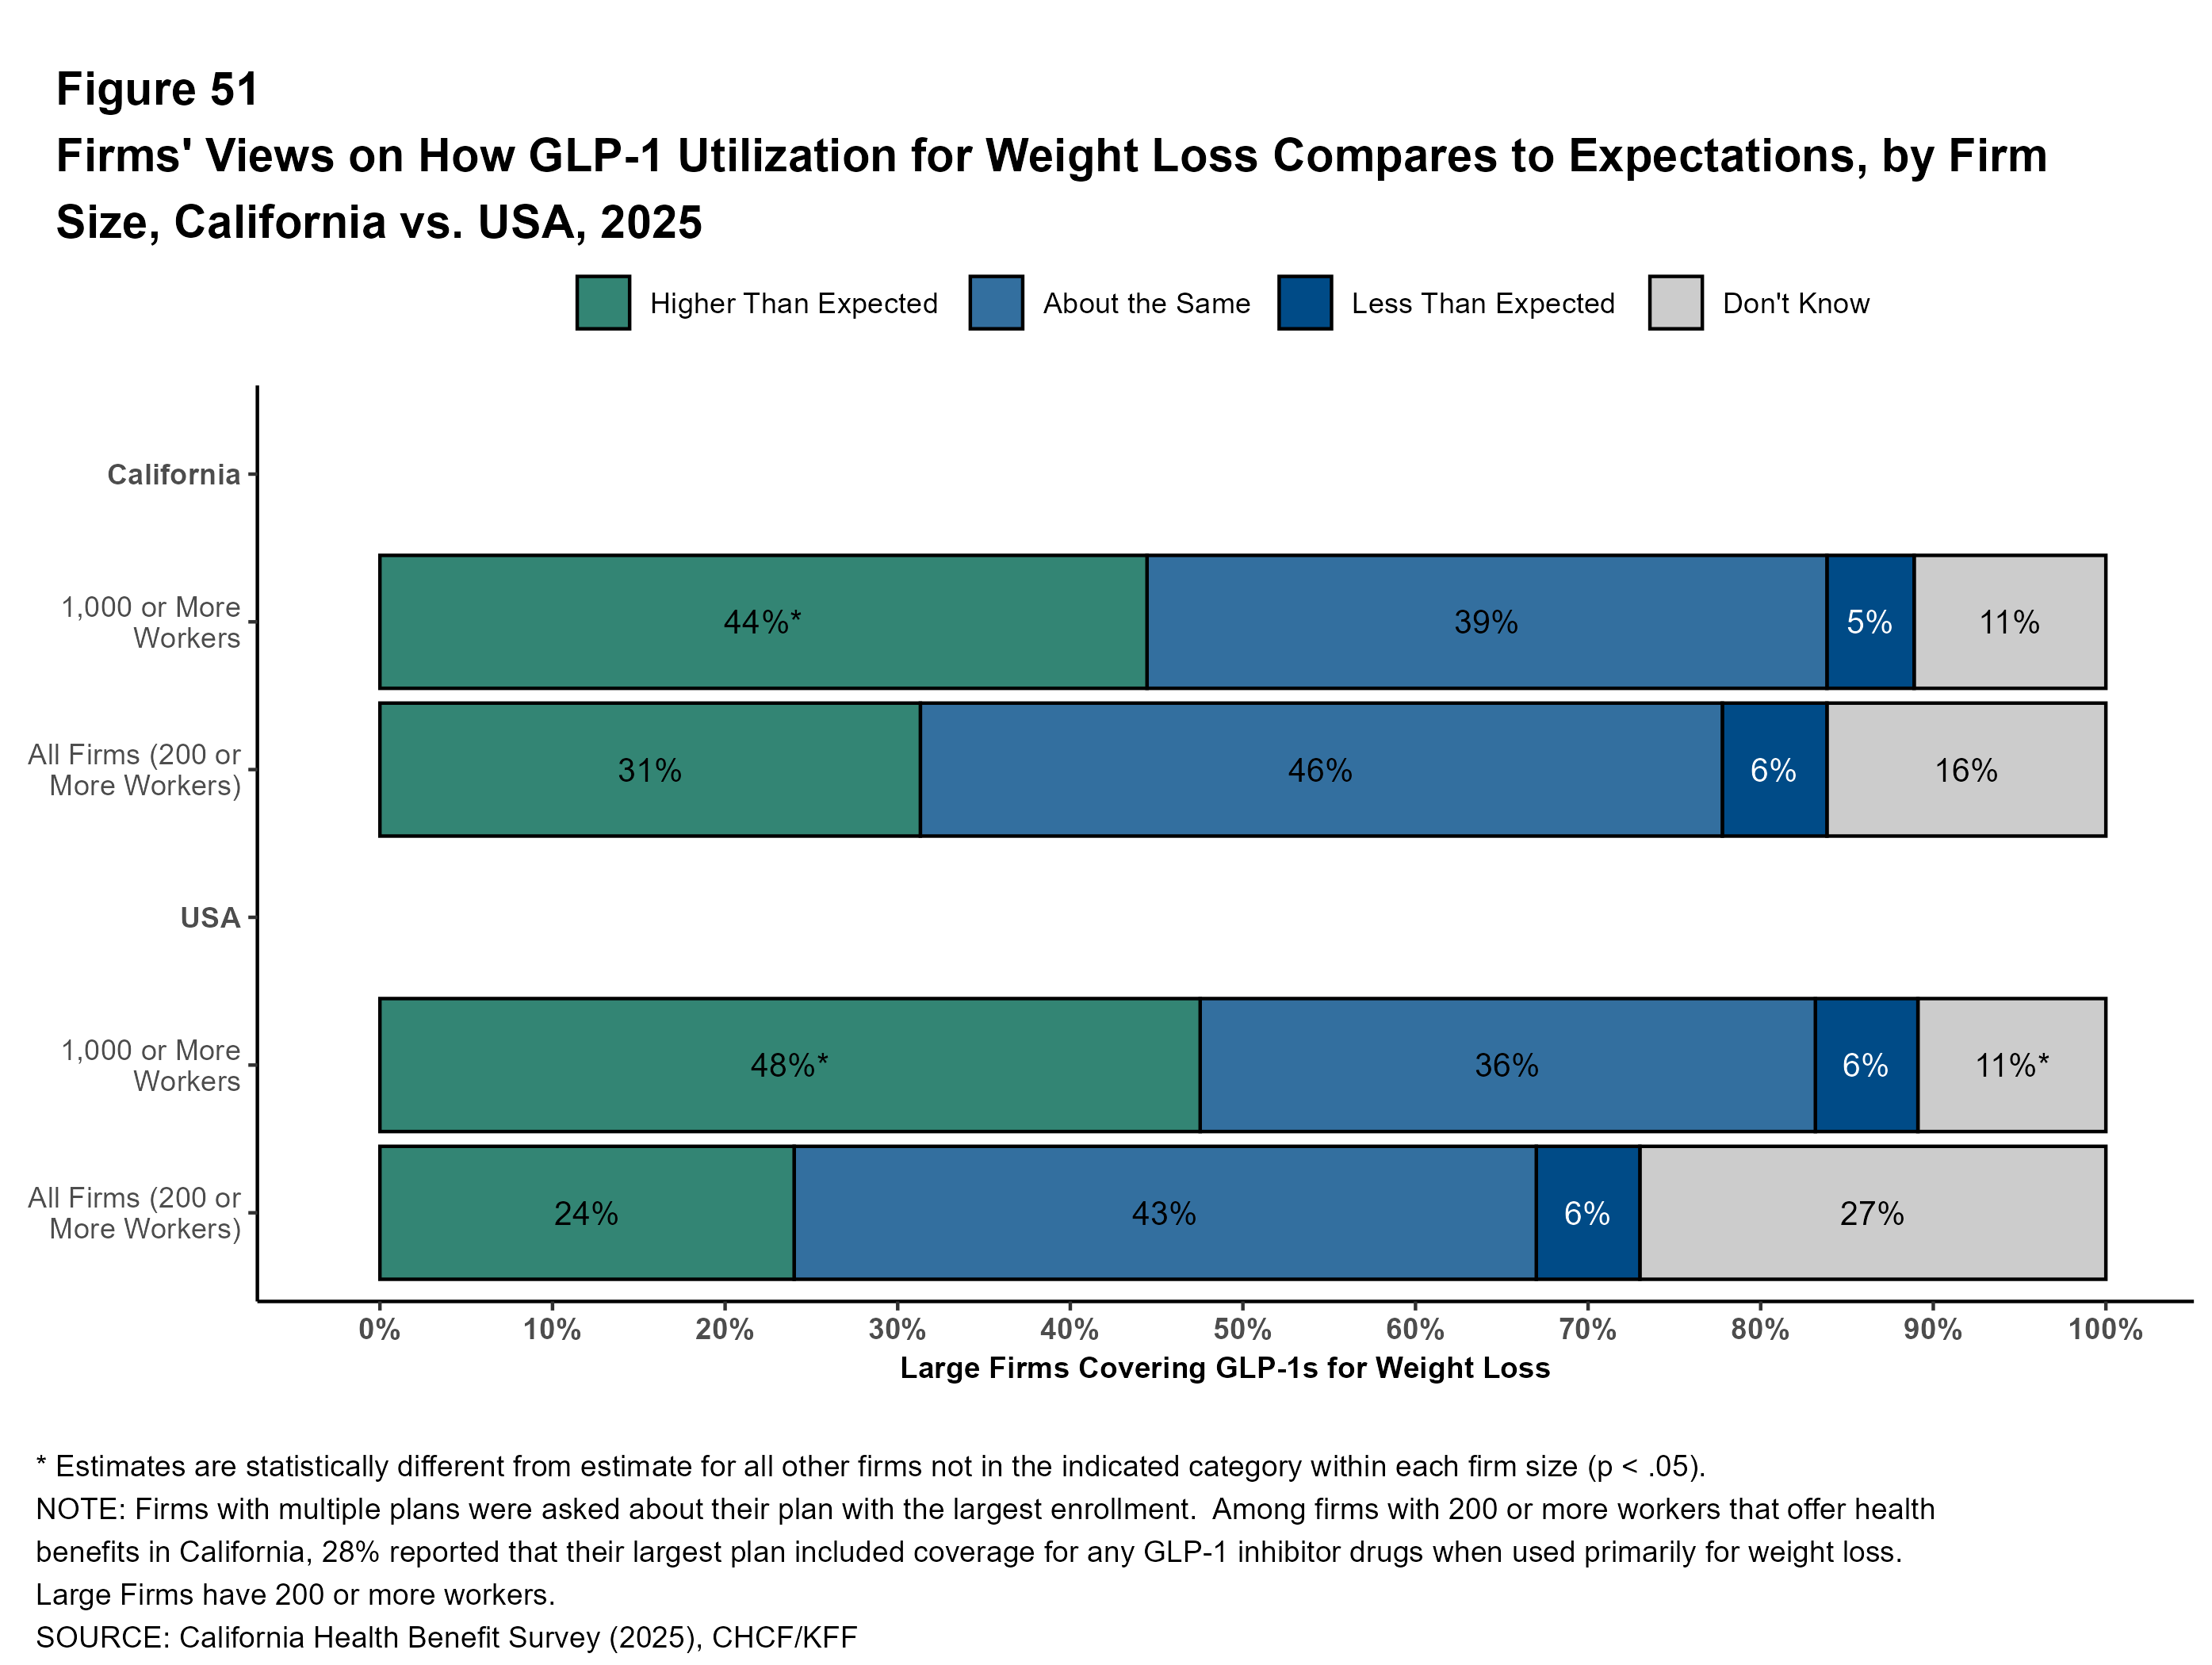
Utilization and Spending on GLP-1s: Large firms in California that cover GLP-1 agonists for weight loss were asked about how their use compares with expectations. Forty percent of these firms with 1,000 to 4,999 workers and 50% of firms with 5,000 or more workers say that use was higher than they expected.
A similar share of large employers covering GLP-1 agonists for weight loss say that use was higher than expected in California, as it was nationally (31% and 24%).
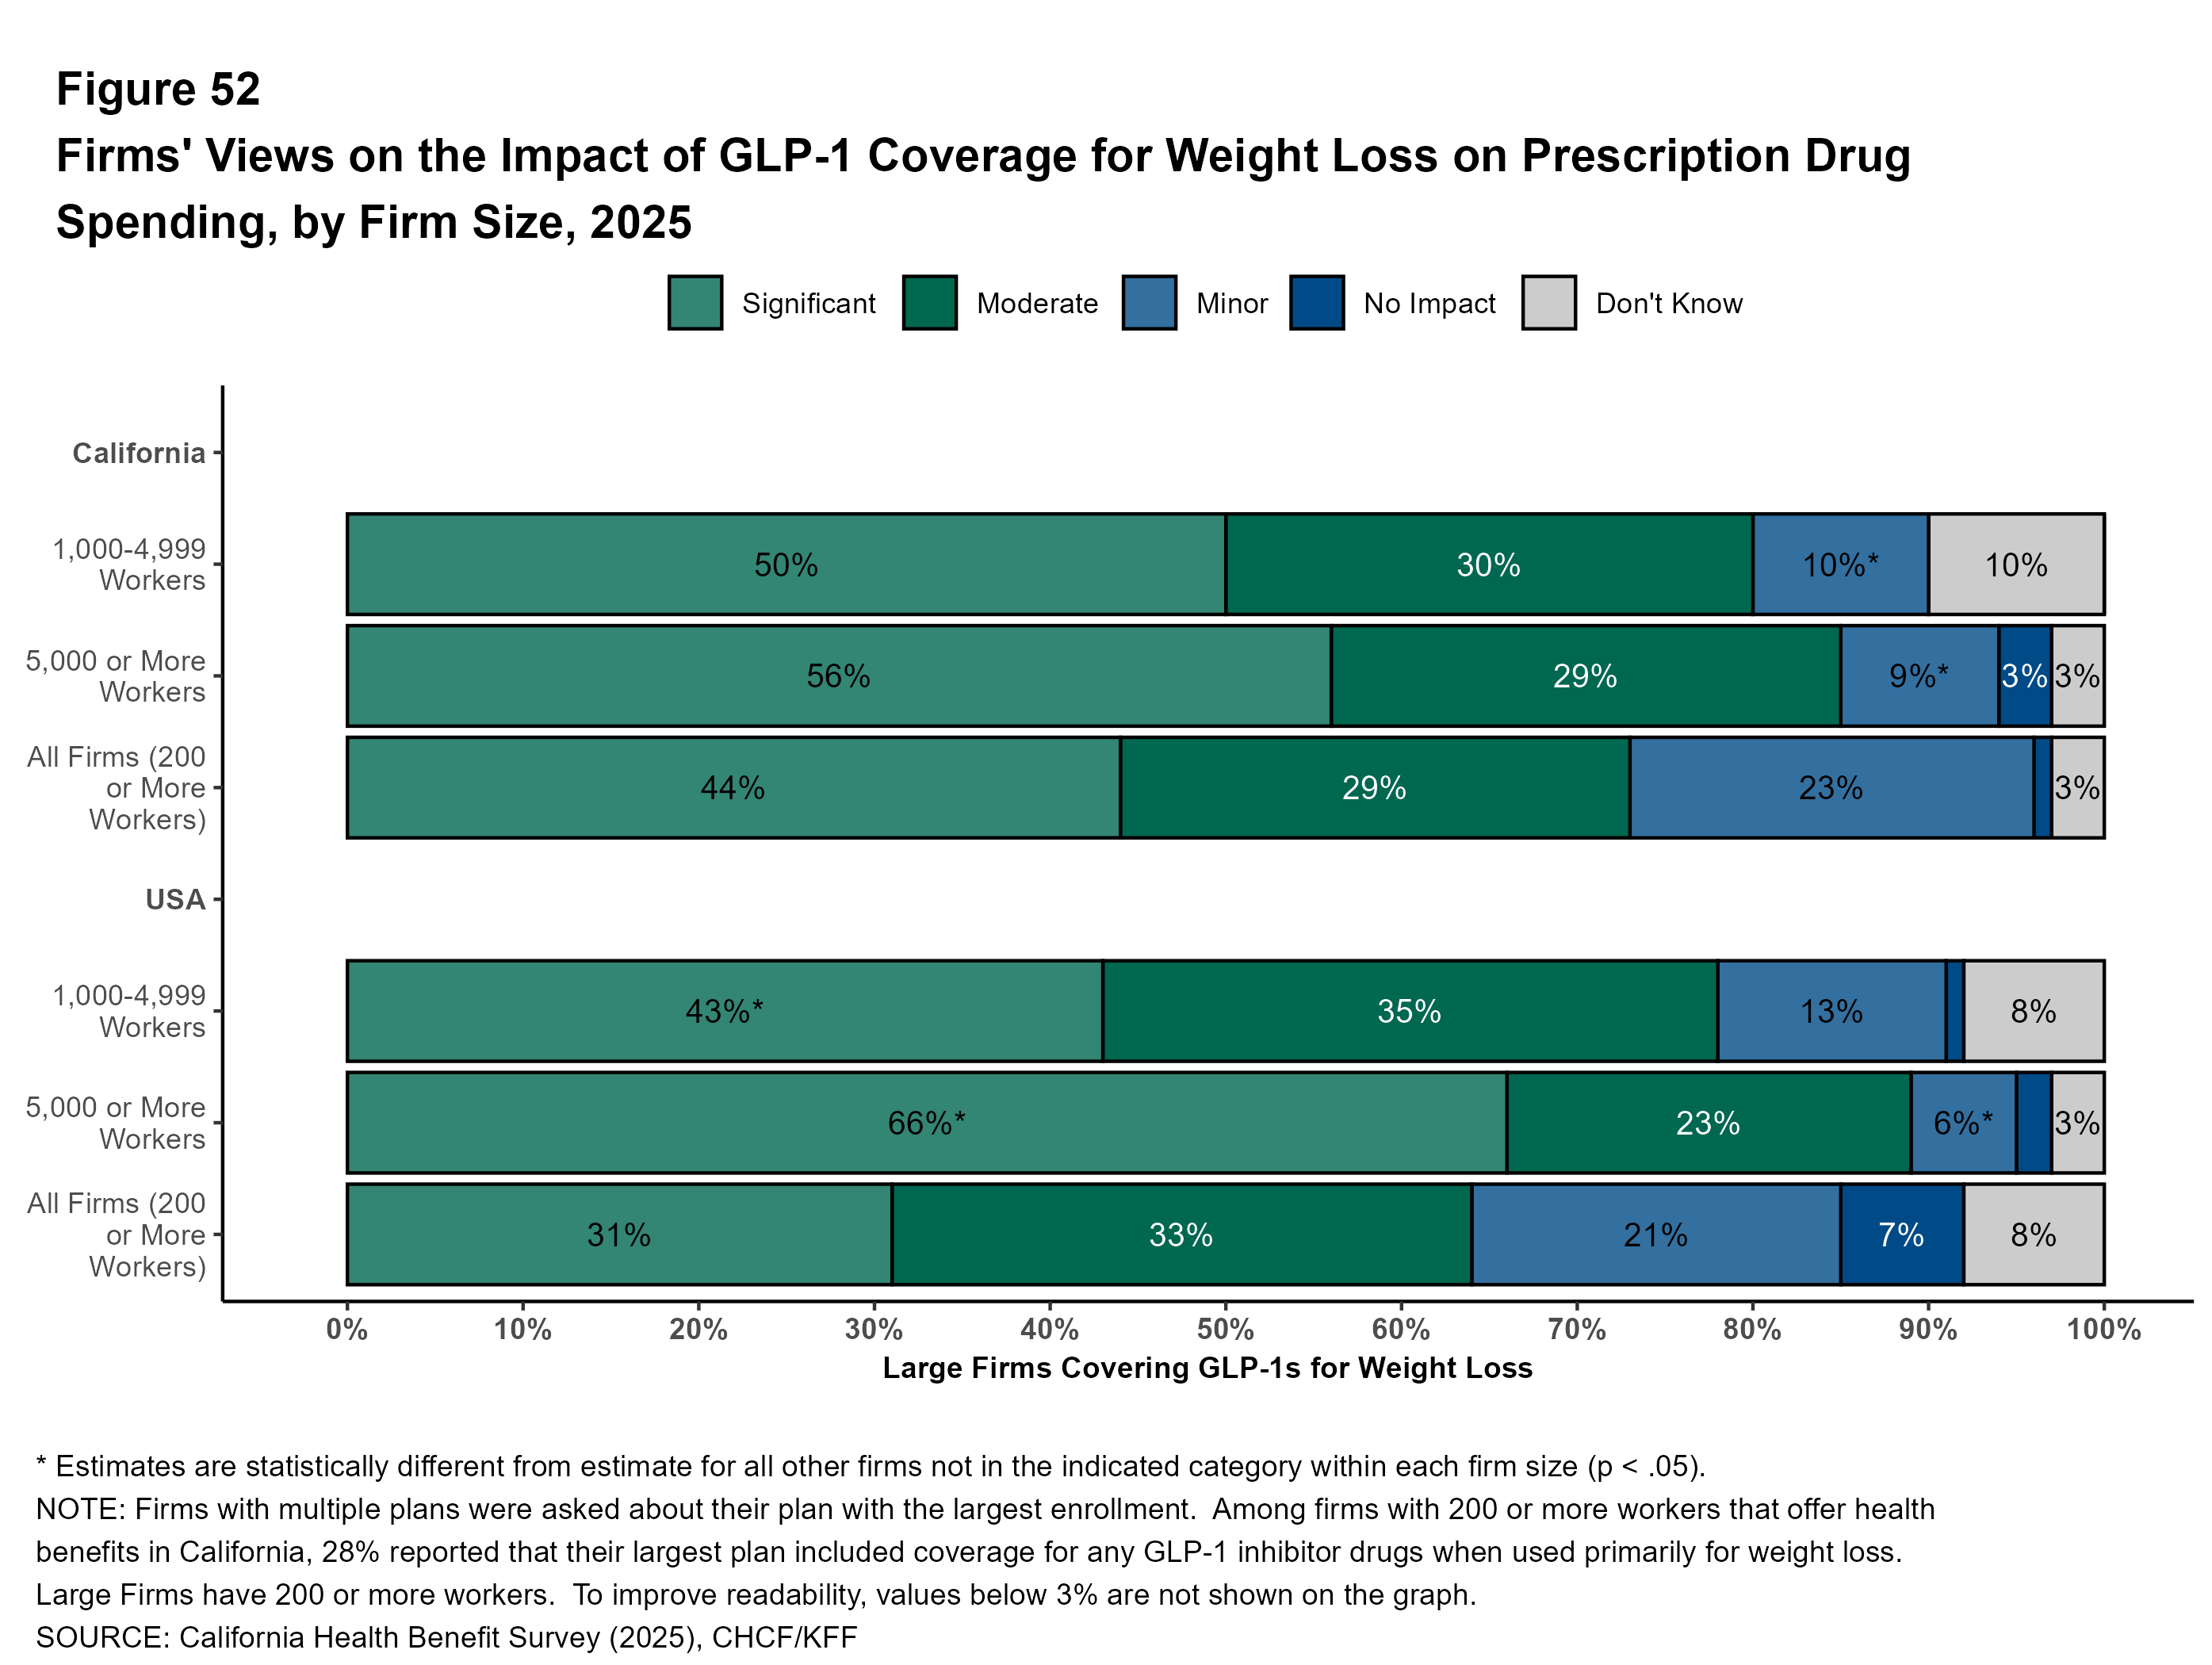
Large California firms covering GLP-1 agonists for weight loss report how their coverage affects their plan’s spending on prescription drugs. Among firms with 200 or more workers covering these medications for weight loss, 44% of large firms say that GLP-1s for weight loss had a “significant” impact on their prescription drug spending.
Importance of GLP-1s on Enrollee Satisfaction: Almost three-quarters (71%) of California firms with 200 or more workers that cover GLP-1 agonists for weight loss say that it is “very important” or “somewhat important” to their employees’ satisfaction with their health plan. Even among large firms that do not cover GLP-1s for weight loss, 45% say that doing so is “very important” or “somewhat important” for employees` satisfaction. Many employers may continue to feel pressure to add this coverage.
Employee Concerns with Plan Management
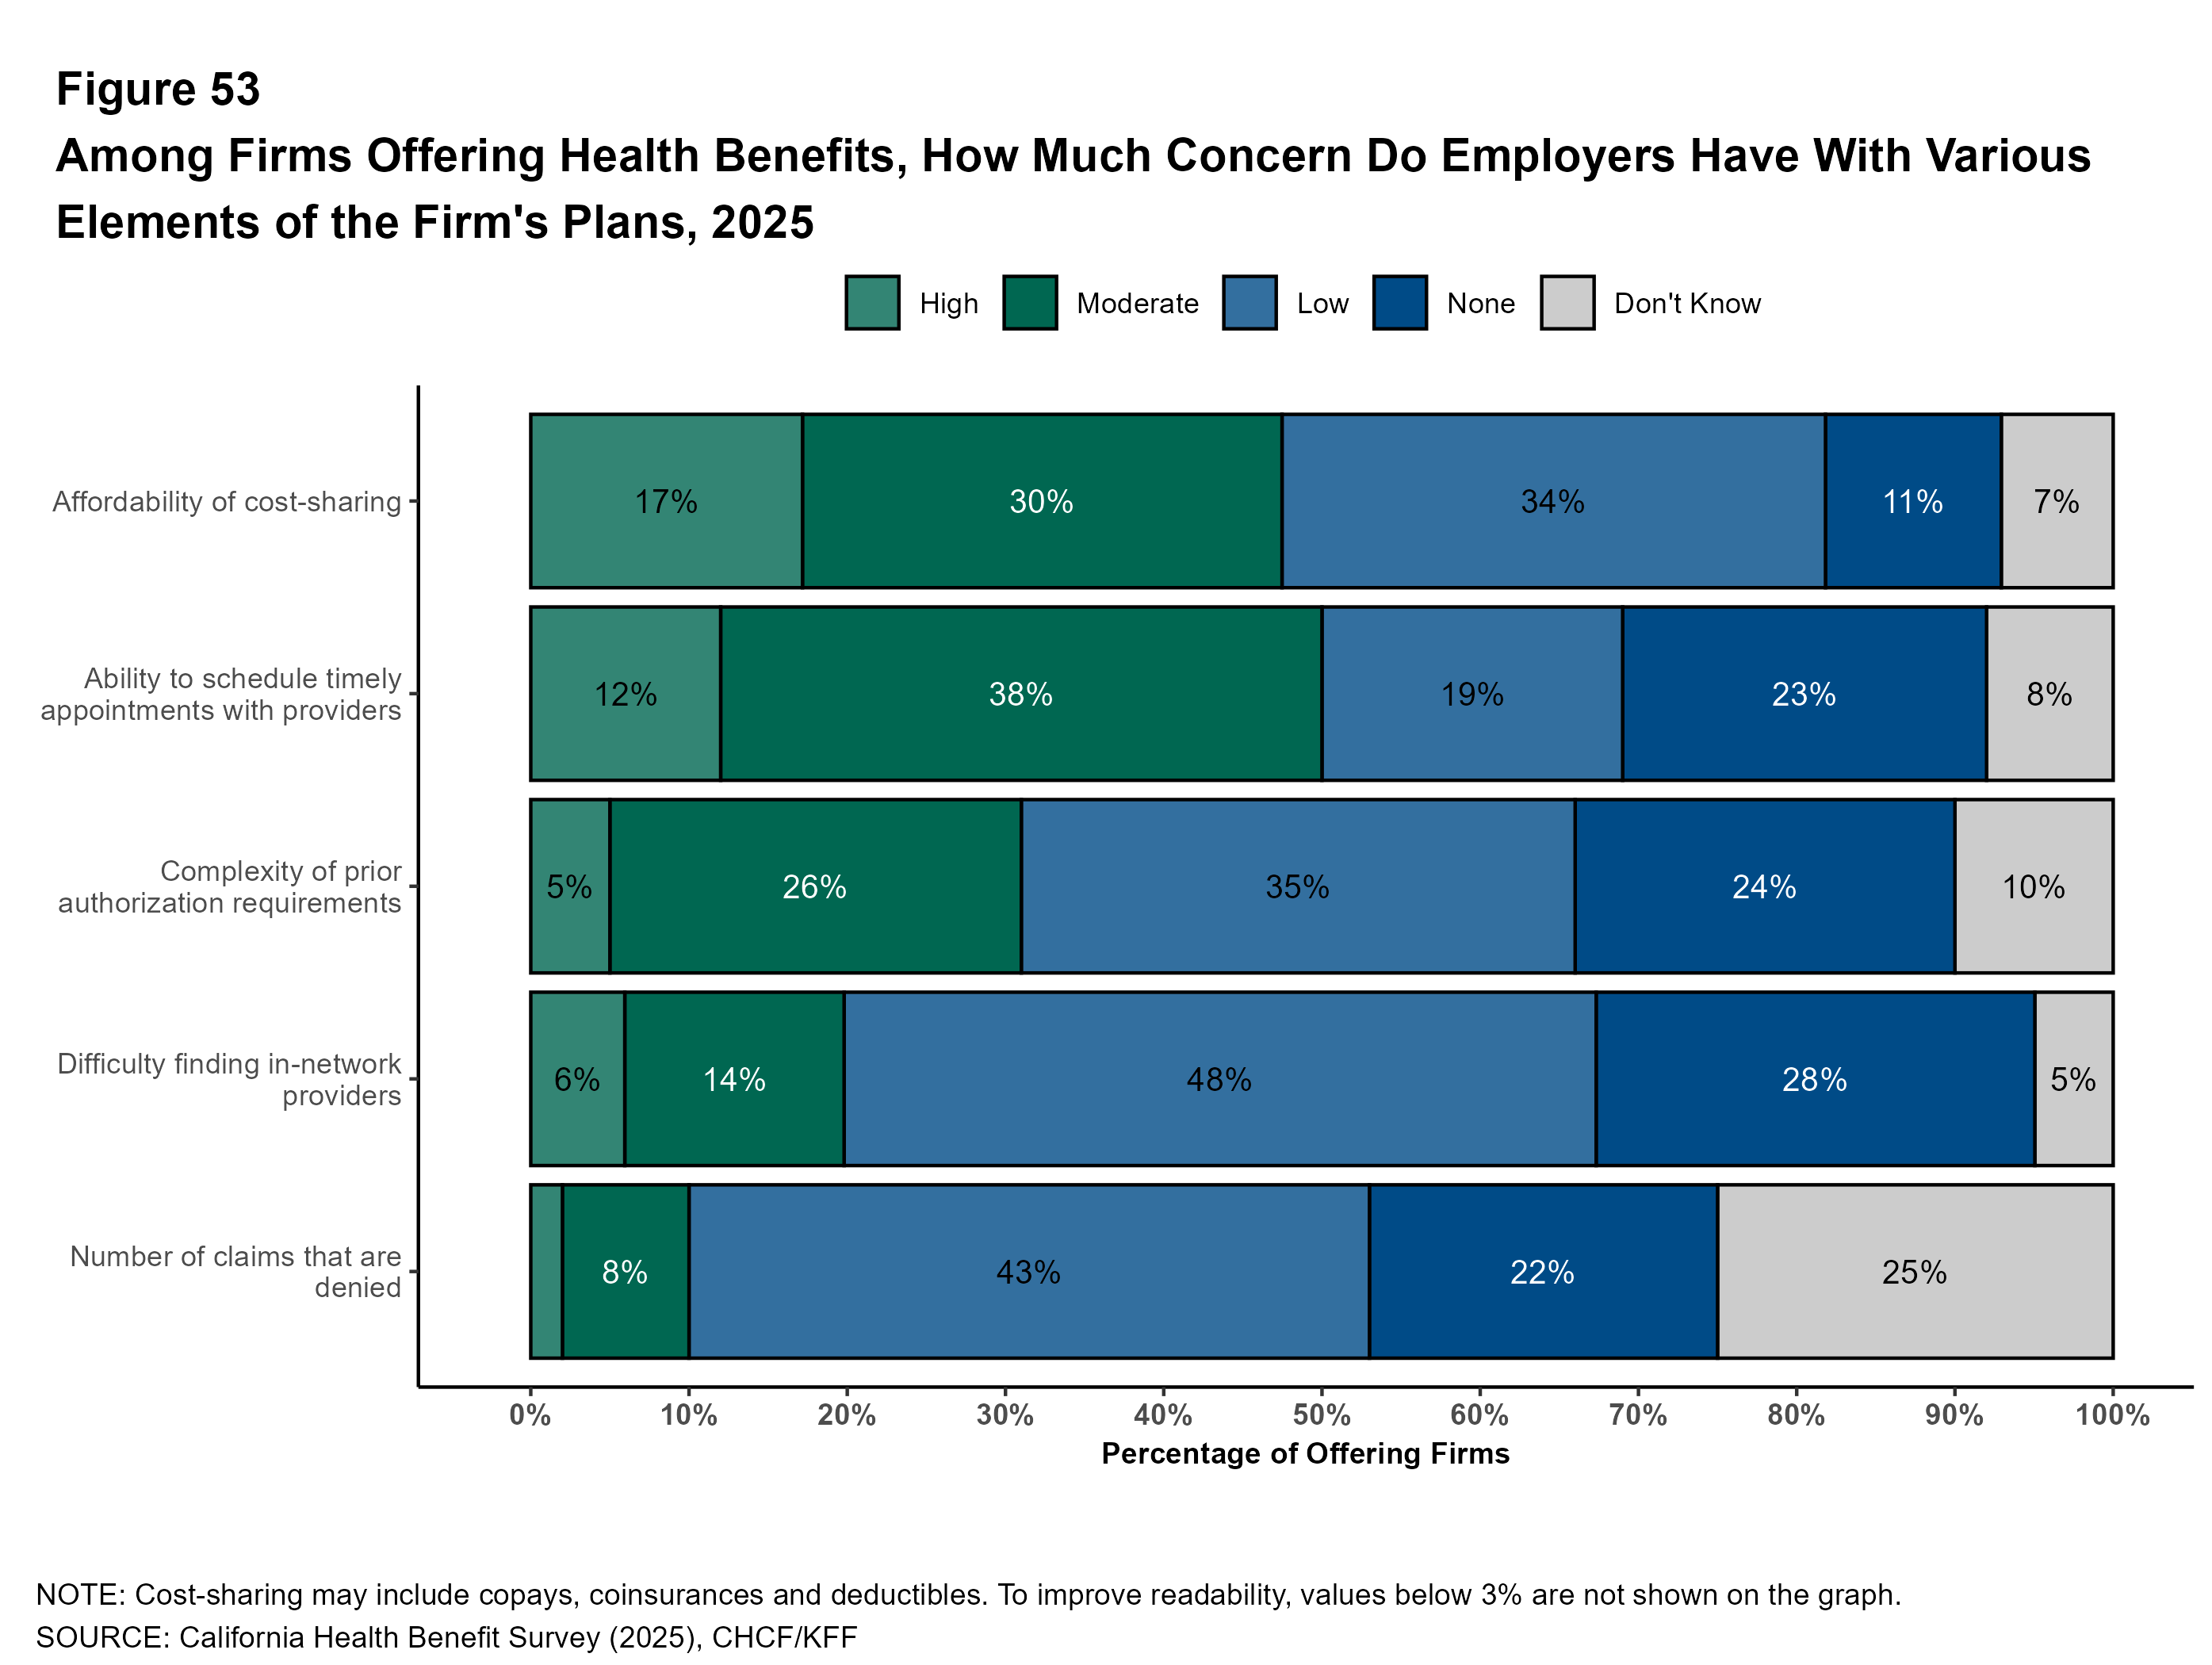
Employers assess the level of concern they believe their employees have about various aspects of health plan management. Among California firms offering health benefits:
- Forty-seven percent say that their employees’ level of concern over the affordability of cost sharing is “high” or “moderate”; this includes 71% of firms with 5,000 or more workers.
- Forty-nine percent say that their employees level of concern over their ability to schedule timely appointments is “high” or “moderate”; this includes 43% of firms with 5,000 or more workers.
- Thirty-one percent say that their employees level of concern over the complexity of prior authorization requirements is “high” or “moderate”; this includes 59% of firms with 5,000 or more workers.
Methods
The California Health Benefits Survey (CHBS) is a joint project of the California Health Care Foundation (CHCF) and KFF. The survey was designed and analyzed by researchers at KFF, and administered by Davis Research LLC (Davis). Findings are based on a random sample of 464 interviews with employee benefit managers in firms located in or employing workers in California. An additional 676 firms answered only whether they offered health benefits. Interviews were completed between January 28, 2025 and July 23, 2025. Responses reflect employers’ plans at the time of interview. The response rate for the full survey was 13 percent. Collectively, 201,000 of the 8,061,000 workers covered by their own firm’s health benefits in California were employed by firms that responded (2.5%).
Consistent with the approach in 2022, the 2025 survey was conducted as an oversample of California-based employers participating in the KFF Employer Health Benefit Survey (EHBS). Estimates are therefore comparable to those in the 2023 CHBS. All firms were asked about the characteristics of their workforce in California and nationwide and contribute to both surveys. To ensure reliability at both the national and state levels, weights for the California sample were calibrated to state-specific targets from the U.S. Census Bureau’s Statistics of U.S. Businesses (SUSB) and the Census of Governments by size and industry. Weights are constructed for employers, workers, covered workers, and workers by plan type in California and trimmed to reduce the influence of outliers. Overall, 91% of employers and 14% of covered workers are in firms where all covered workers reside in California.
Previous iterations of the CHBS are available but as explained in the 2023 methods section, we have implemented several methodological changes over time.
The sample includes private firms and non-federal government employers with ten or more employees. The sampling universe is defined by the U.S. Census’ 2021 Statistics of U.S. Businesses for private firms and the 2022 Census of Governments (COG) for public employers.
Beginning in 2025, neither EHBS nor CHBS includes firms with 3-9 employees, reflecting longstanding challenges in surveying the smallest firms and their limited effect on national estimates. Although there are 1.95 million such firms in the U.S., they employ a small share of workers. As a result their exclusion does not meaningfully affect worker-weighted estimates (e.g., premiums, contributions, cost sharing, or plan enrollment). For comparability, estimates from prior years shown here have been recalculated to exclude 3-9 worker firms; as a result, they differ from previously published values.
The 2025 sample of non-panel firms was drawn from Dynata (based on a Dun & Bradstreet census of private employers with ≥10 workers) and Forbes America’s Largest Private Companies. Employers who participated in the 2024 or 2023 EHBS were invited to participate. Firms were sampled by size and industry. In 2025, 464 firms responded, including 64% that had previously completed one of the listed surveys. Respondents could complete the survey online or by computer-assisted telephone interview. In total, 51% percent of responses (representing 31% of covered workers in California) were completed via telephone; the remainder were online.
Benefit managers reported on the premiums and deductibles of up to two plans, plus additional information on their plan type with the most enrollment. Plan types were defined as: health maintenance organizations (HMOs), preferred provider organizations (PPOs), point-of-service (POS) plans, and high-deductible health plans with a savings option (HDHP/SOs). HDHP/SOs were defined as plans with deductibles of at least $1,000 for single coverage and $2,000 for family coverage that also offered a health reimbursement arrangement (HRA) or health savings account (HSA). Overall, 78 percent of covered workers are enrolled in their firm’s largest plan type, and 96 percent are in one of the two largest plan types. Small firms are defined as those with 10-199 workers and large firms as those with 200 or more workers. Firms with “many lower-wage workers” were defined as those with at least 35 percent of employees earning $37,000 or less annually.
Because of the complex survey design, even large differences between estimates may not be statistically significant. In 2025, 44% of covered worker weights—but only 1% of employer weights—were represented by firms with 5,000 or more workers. Conversely, firms with 10-24 workers comprised 59% of employer weights but only 7% of covered worker weights.
To account for design effects, standard errors were calculated using the R version 4.5.1 (2025-06-13 ucrt) version of R and the “survey” package (version 4.4-8). Some exhibits do not sum to 100% due to rounding.
As noted, methods in the 2025 CHBS match those used in the 2025 EHBS. For more details on weighting, imputation, and sampling, see: KFF EHBS Survey Design and Methods.