Nearly 20 Million Children Live in Immigrant Families that Could Be Affected by Evolving Immigration Policies
President Trump has intensified national debate about immigration by implementing policies to enhance immigration enforcement and restrict legal immigration. Recent findings show that the climate surrounding these policies has significantly increased fear and uncertainty among immigrant families, broadly affecting families across different immigration statuses and locations. The effects extend to lawfully present immigrants, including lawful permanent residents or “green card” holders, and children in immigrant families, who are predominantly U.S.-born citizens. In particular, findings point to both short- and long-term negative consequences on the health and well-being of children in immigrant families.
Potential changes to public charge policies intended to reduce use of public programs by immigrant families, including their citizen children, could further increase strains on immigrant families and lead to losses in health coverage. To provide insight into the scope of potential impacts of continually evolving immigration policy on children, this data note provides nationwide and state-level estimates (Table 1) of citizen children living in immigrant families and the number currently covered by Medicaid/CHIP coverage.
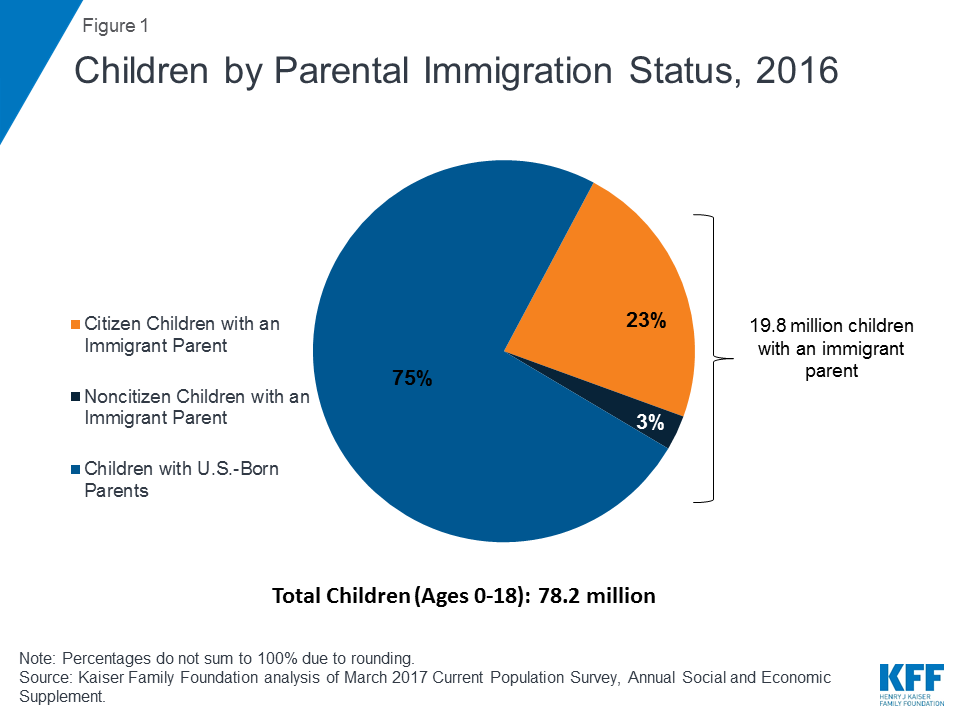
NEW: Nearly 20 million children live in immigrant families that could be affected by evolving immigration policies
In 2016, nearly 20 million or one in four children had at least one immigrant parent, and nearly nine in ten (89% or 17.7 million) of these children were citizens (Figure 1). An immigrant parent is a foreign-born parent, including naturalized citizens, lawfully present immigrants, and undocumented immigrants. Over half of children with an immigrant parent live in California (23%), Texas (13%), New York (8%), and Florida (8%).
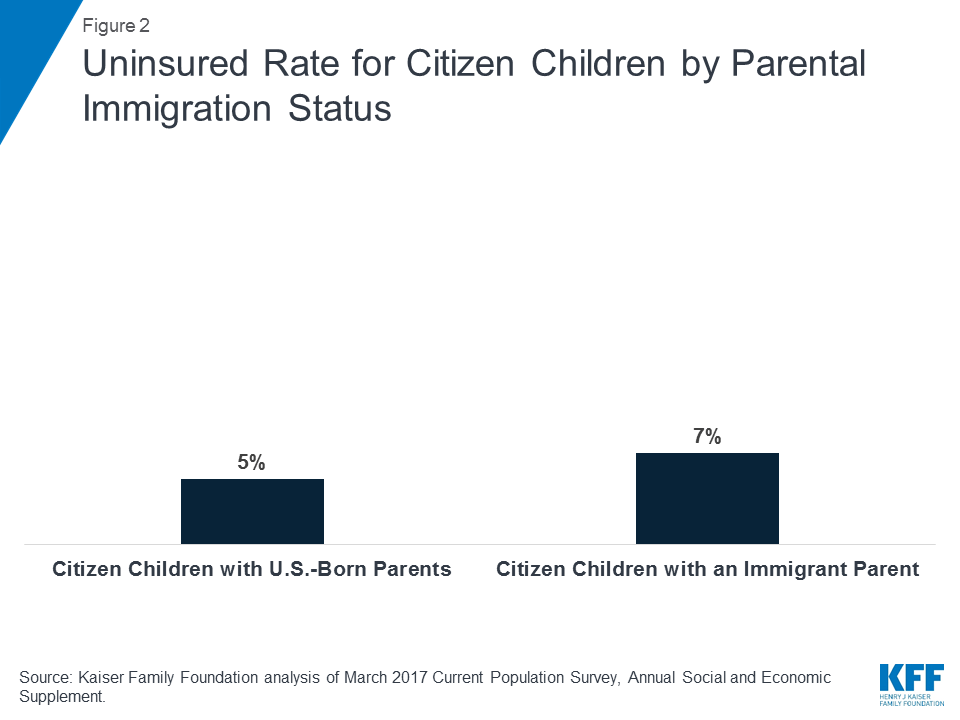
Over 8 million citizen children with an immigrant parent have Medicaid/CHIP coverage. Medicaid and CHIP provide these children access to preventive and primary care as well as care for chronic conditions. In addition, the coverage provides families financial protection from high medical costs. Recent findings indicate that growing fear and uncertainty among immigrant families is leading to decreased participation in Medicaid and CHIP. Moreover, potential forthcoming changes to public charge policies would likely lead to sharp declines in enrollment in Medicaid and CHIP as well as other programs among immigrant families, including their citizen children. Decreased participation in Medicaid and CHIP would increase the uninsured rate among immigrant families, negatively affecting the financial stability of families and the growth and healthy development of their children. Such coverage losses also would widen disparities in coverage citizen children in immigrant families already face compared to those with U.S.-born parents. Today, citizen children with an immigrant parent are more likely to be uninsured compared to those with U.S.-born parents (Figure 2).
In sum, although changes in immigration policy may target specific groups of immigrants, they often have much farther-reaching effects. One group significantly affected by such changes is children living in immigrant families, who are predominantly U.S. citizens. The effects on these children may have long-term negative consequences on their health and well-being across their lifespan.
This data note was prepared by Samantha Artiga, with the Kaiser Family Foundation, and Anthony Damico, an independent consultant to the Kaiser Family Foundation.
| Table 1: Medicaid/CHIP Coverage for Citizen Children With an Immigrant Parent, 2016 | |||
| All Children | Citizen Children with an Immigrant Parent | ||
| Total | Total with Medicaid/CHIP Coverage | ||
| United States | 78,150,000 | 17,674,000 | 8,112,000 |
| Alabama | 1,155,000 | 95,000 | 49,000 |
| Alaska | 202,000 | 23,000 | NA |
| Arizona | 1,715,000 | 451,000 | 205,000 |
| Arkansas | 742,000 | 63,000 | 30,000 |
| California | 9,678,000 | 4,122,000 | 2,039,000 |
| Colorado | 1,318,000 | 217,000 | 108,000 |
| Connecticut | 804,000 | 171,000 | 81,000 |
| Delaware | 215,000 | 41,000 | 19,000 |
| DC | 128,000 | 23,000 | 7,000 |
| Florida | 4,450,000 | 1,329,000 | 519,000 |
| Georgia | 2,666,000 | 484,000 | 260,000 |
| Hawaii | 319,000 | 77,000 | 25,000 |
| Idaho | 473,000 | 66,000 | 34,000 |
| Illinois | 3,048,000 | 791,000 | 341,000 |
| Indiana | 1,694,000 | 104,000 | NA |
| Iowa | 756,000 | 82,000 | 48,000 |
| Kansas | 763,000 | 107,000 | 41,000 |
| Kentucky | 1,104,000 | 60,000 | NA |
| Louisiana | 1,176,000 | 63,000 | NA |
| Maine | 272,000 | 22,000 | NA |
| Maryland | 1,428,000 | 398,000 | 141,000 |
| Massachusetts | 1,480,000 | 414,000 | 157,000 |
| Michigan | 2,280,000 | 222,000 | 82,000 |
| Minnesota | 1,383,000 | 270,000 | 106,000 |
| Mississippi | 768,000 | 31,000 | NA |
| Missouri | 1,479,000 | 125,000 | NA |
| Montana | 241,000 | 12,000 | NA |
| Nebraska | 500,000 | 73,000 | 29,000 |
| Nevada | 729,000 | 240,000 | 87,000 |
| New Hampshire | 283,000 | 28,000 | 13,000 |
| New Jersey | 2,077,000 | 751,000 | 277,000 |
| New Mexico | 522,000 | 101,000 | 67,000 |
| New York | 4,397,000 | 1,485,000 | 704,000 |
| North Carolina | 2,450,000 | 404,000 | 219,000 |
| North Dakota | 188,000 | 12,000 | 3,000 |
| Ohio | 2,792,000 | 195,000 | 90,000 |
| Oklahoma | 1,023,000 | 149,000 | 97,000 |
| Oregon | 933,000 | 203,000 | 132,000 |
| Pennsylvania | 2,836,000 | 336,000 | 170,000 |
| Rhode Island | 217,000 | 52,000 | 27,000 |
| South Carolina | 1,183,000 | 113,000 | NA |
| South Dakota | 229,000 | 14,000 | NA |
| Tennessee | 1,550,000 | 172,000 | 68,000 |
| Texas | 7,731,000 | 2,353,000 | 1,135,000 |
| Utah | 963,000 | 123,000 | NA |
| Vermont | 131,000 | 9,000 | NA |
| Virginia | 2,013,000 | 438,000 | 152,000 |
| Washington | 1,721,000 | 455,000 | 240,000 |
| West Virginia | 398,000 | NA | NA |
| Wisconsin | 1,396,000 | 89,000 | NA |
| Wyoming | 153,000 | 9,000 | NA |
| NOTES: Children with an immigrant parent in a household with at least one immigrant parent. NA: insufficient sample size to report.SOURCE: Kaiser Family Foundation analysis of March 2017 Current Population Survey, Annual Social and Economic Supplement. | |||