Kaiser Health Tracking Poll: April 2014
Kaiser Health Tracking Poll: April 2014
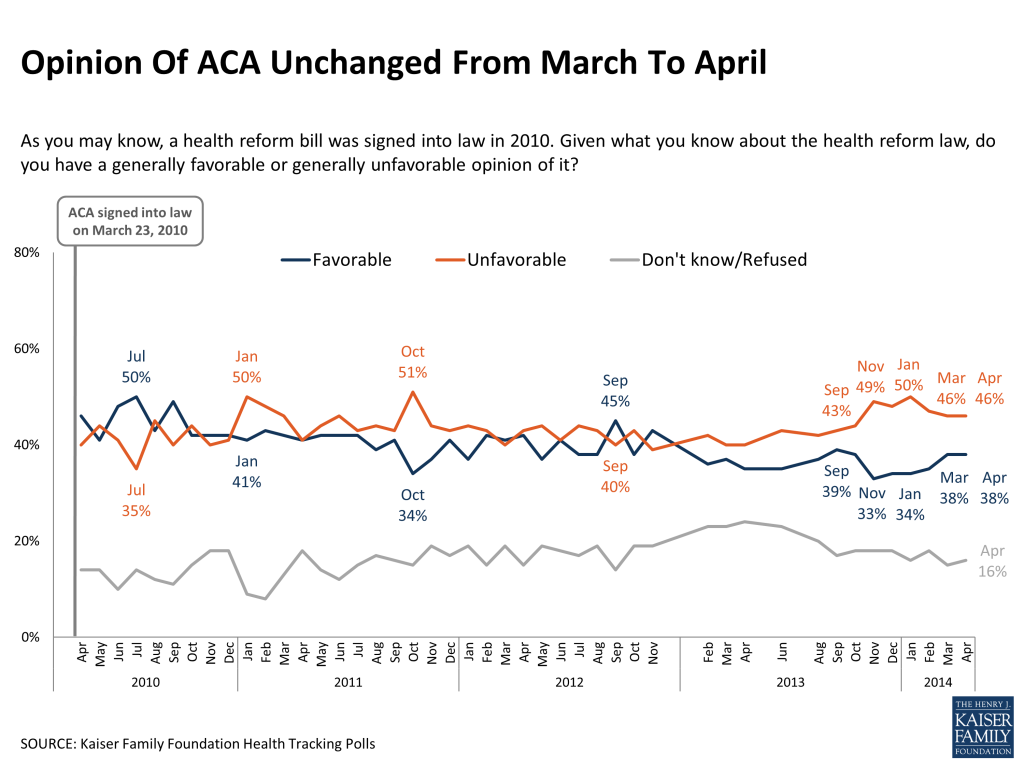
The enrollment surge at the end of March in the health insurance exchanges, created by the Affordable Care Act (ACA), was widely covered in the news, as was the announcement that at least 8 million people have used the new marketplaces to sign up for coverage. The news got a fair amount of attention from the public, with over half saying they followed the enrollment numbers “very” or “fairly closely.” But the latest Kaiser Health Tracking Poll finds that this news did little to change the public’s impressions of the law, with overall opinion remaining exactly where it was last month (46 percent unfavorable, 38 percent favorable). While over four in ten correctly identify the number of people who have signed up for insurance1 , enrollment levels do not register as a success for most Americans. Nearly six in ten (including half of those who correctly identified the 8 million figure) believe enrollment fell short of the government’s expectations, and the same share believe the rollout problems indicate that the law is not working as planned. Still, more want the government to give the law a chance than want to scrap it and start over; nearly six in ten would prefer their representative in Congress work to improve the law, while just over a third want them to repeal and replace it. When asked why they haven’t gotten coverage yet this year, over a third of the uninsured say they tried to get coverage but it was too expensive, while smaller shares say they didn’t know about the ACA’s requirement to have insurance or didn’t think it applied to them. Just 7 percent of the uninsured say they would rather pay the fine than pay for coverage. This month’s tracking poll also finds public support for the ACA’s requirement that private health insurance plans cover the full cost of birth control, including a majority who believe that for-profit companies should be subject to this requirement even if their owners object to birth control on religious grounds.
Overall opinion remains unchanged from March
Despite the announcement that at least 8 million people have signed up for health insurance through the ACA’s new marketplace, overall favorability of the law remains exactly where it was in last month’s tracking poll, with 46 percent of the public saying they have an unfavorable view and 38 percent a favorable view. This is a slight improvement over polls taken from November through January, but still represents a more negative tilt to opinion than was measured in Kaiser tracking surveys before the troubled launch of the exchanges last October.
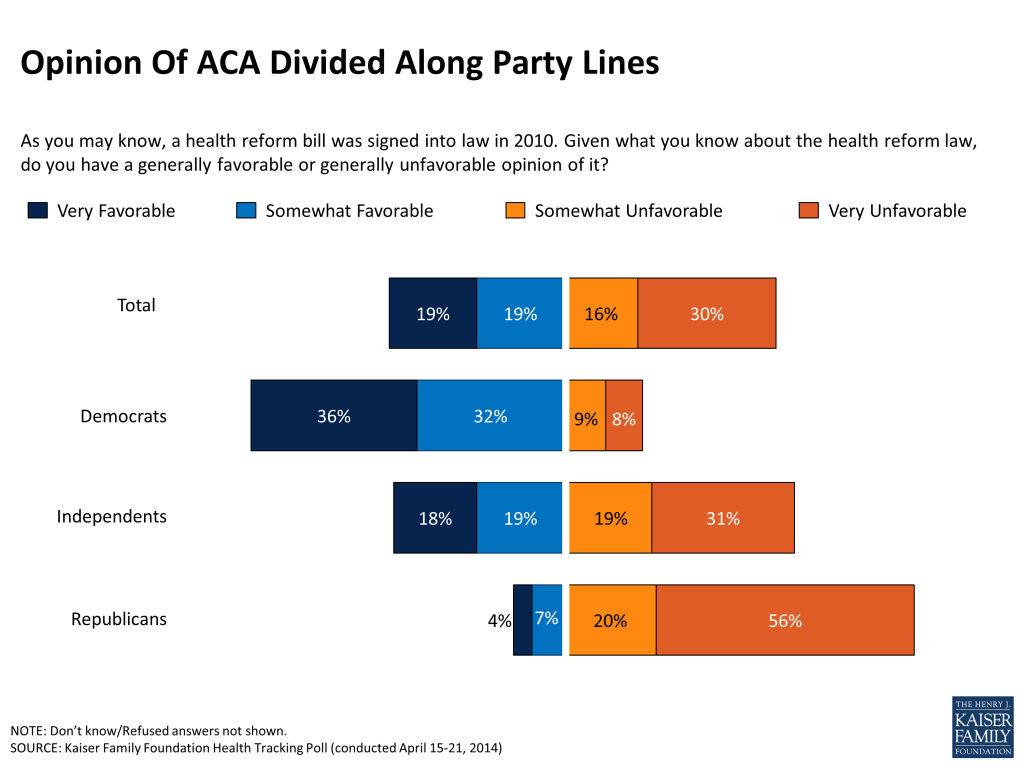
As it has been since the start, opinion remains highly polarized by political party, with three-quarters of Republicans having an unfavorable view of the law and two-thirds of Democrats viewing it favorably.
“8 million” registered with many, but majority don’t view first enrollment period as a success
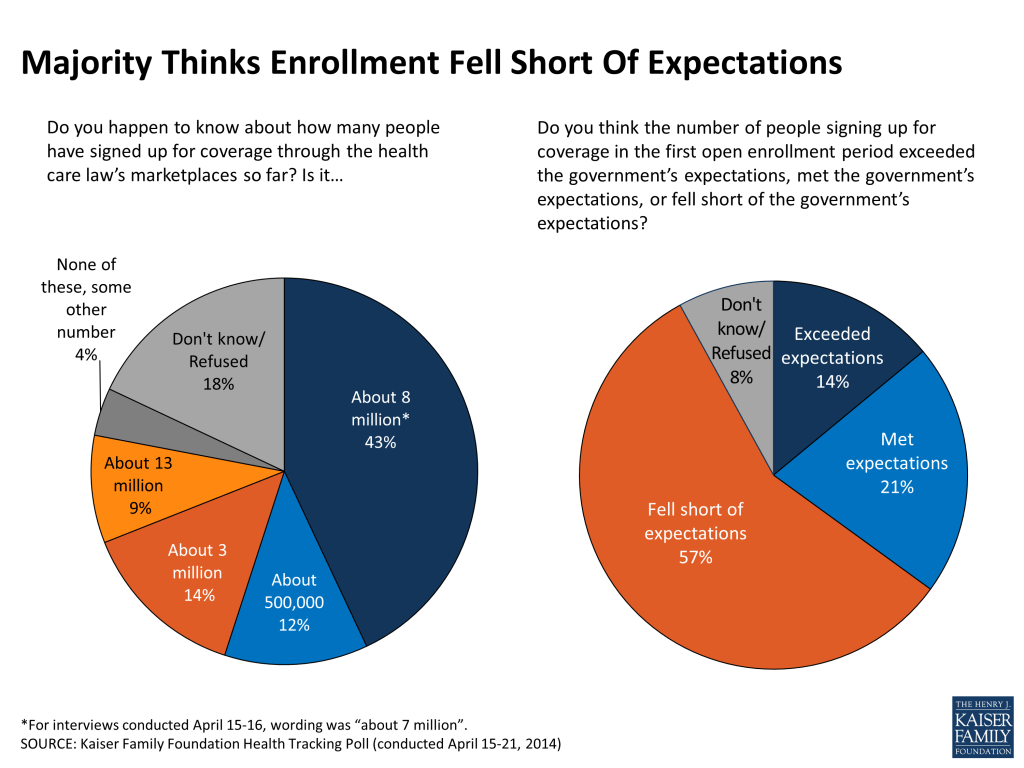
Just over four in ten Americans (43 percent) were correctly able to identify that “about eight million” people2 have signed up for coverage through the ACA’s new marketplaces as of April. Still, the majority of the public does not seem to register this as a success. Nearly six in ten believe that the number of people signing up for coverage fell short of the government’s expectations. Even among those who correctly identified the fact that 8 million people have signed up so far, roughly half believe enrollment fell short of expectations.
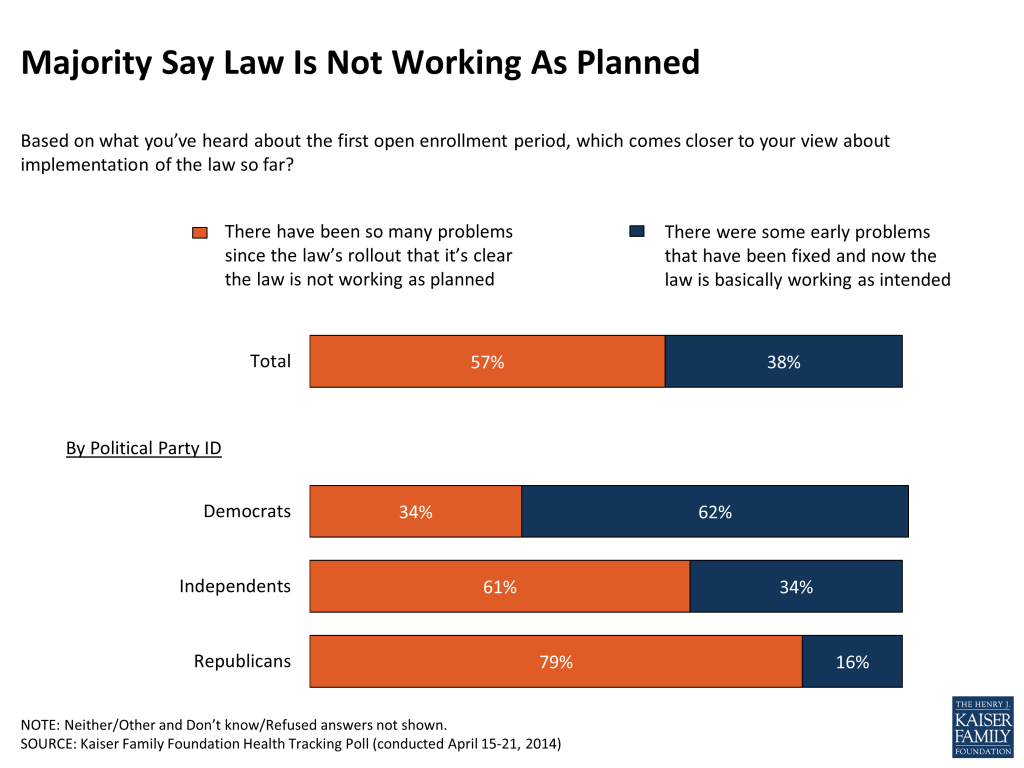
While almost four in ten believe the early problems with the law have been fixed, almost six in ten say “there have been so many problems since the law’s rollout that it’s clear the law is not working as planned.” There are expected partisan divisions on this question, but even among Democrats, who generally view the law favorably, about a third believe the law is still not working.
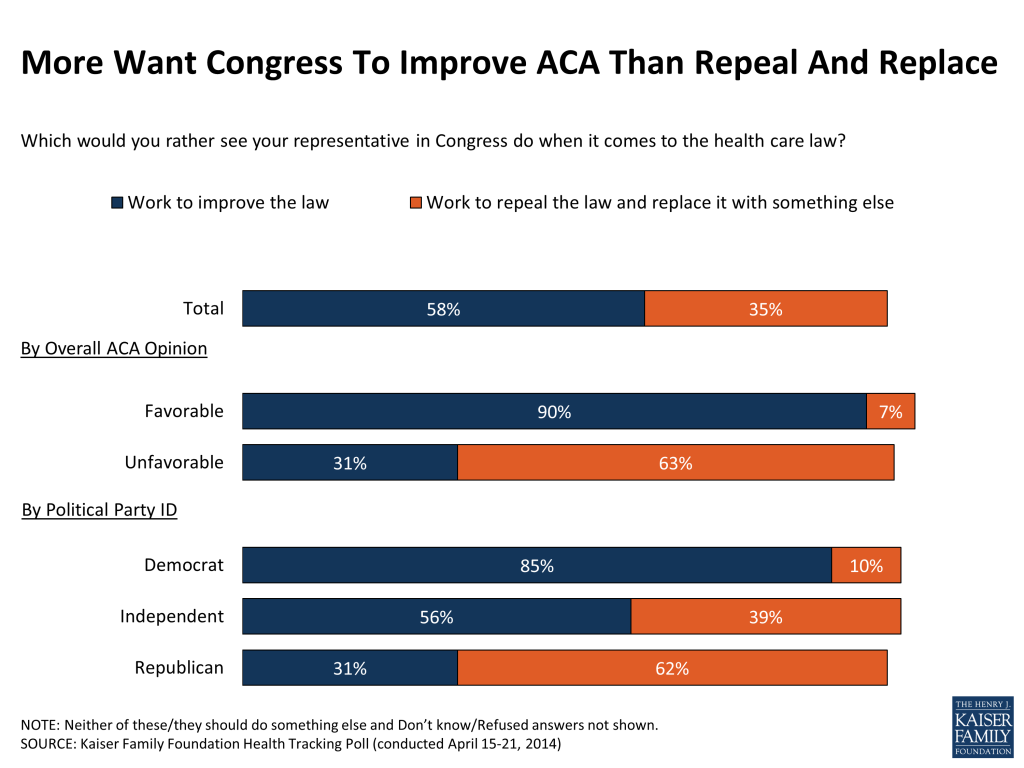
More want Congress to improve the law than repeal and replace
Despite this, the public is inclined to give the law a chance to work rather than throwing it out and starting over. Nearly six in ten (58 percent) say they want their representative in Congress to work to improve the law, while just over a third (35 percent) want them to work on repealing it and replacing it with something else. Like opinion on the law overall, this question is deeply divided by political party. Still, about three in ten Republicans and the same share of those with an unfavorable view of the law say they would prefer Congress work on improving it rather than repealing and replacing it.
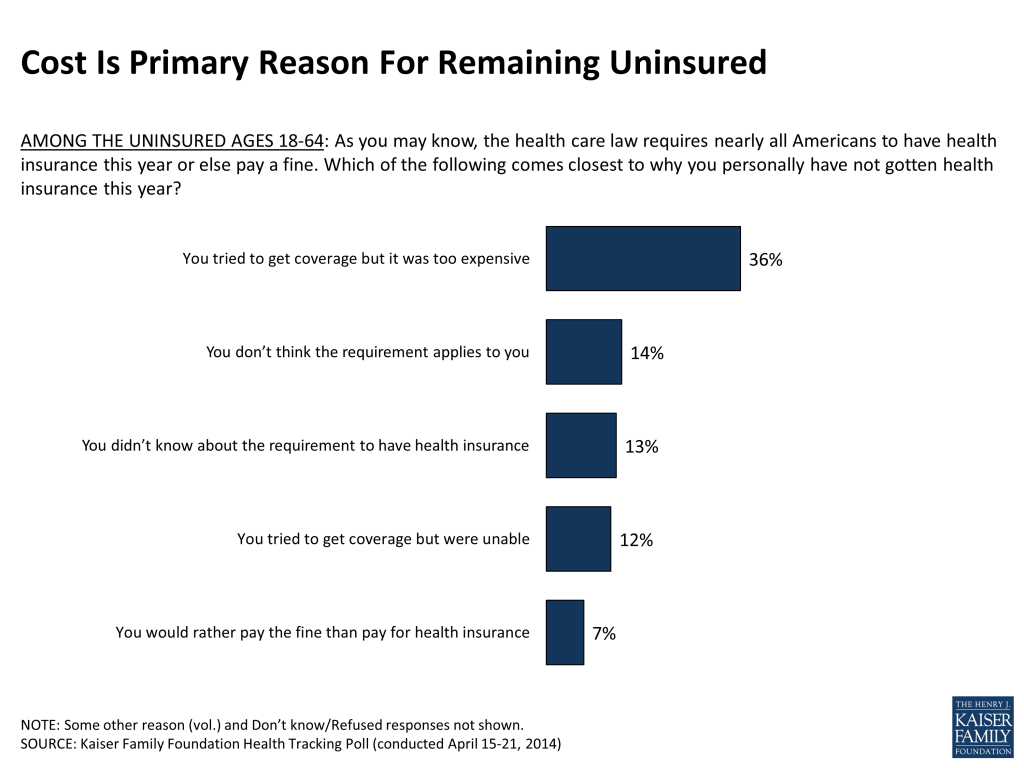
Most common reason for remaining uninsured is not being able to afford coverage
When asked to say in their own words why they don’t currently have health insurance, the most common reason mentioned by the uninsured is that it is too expensive (39 percent), followed by employment-related reasons such as being unemployed or working for an employer that doesn’t offer coverage (22 percent). Roughly one in ten say they just haven’t gotten around to getting coverage or missed the deadline to apply (11 percent), and a similar share feel they don’t want or need coverage (9 percent).
| FIGURE 6: In Their Own Words | ||
| AMONG THE UNINSURED AGES 18-64: What is the main reason you do not currently have health insurance? | ||
| Category | Percent Mentioning | Quotes |
| Too expensive/can’t afford it | 39% | “What’s out there now is just unaffordable.” “Because I think food on the table is more important.” “Being a single mom every penny I have goes into my household and I have nothing extra.” |
| Job-related reasons | 22 | “Because I was laid off from my job in December.” “I only work 2 and half hours a day for 5 days a week and I can’t afford it.” “Insurance that employer offers not worth the cost.” |
| Missed the deadline/haven’t gotten around to it/too busy | 11 | “I didn’t sign up in time.” “I haven’t had time to check all that out.” |
| Don’t want/need it | 9 | “Because I don’t want it. I feel it’s my own option whether I want to buy it.” “Because of my age, I don’t need it at the moment.” |
When reminded of the law’s requirement for individuals to get coverage or pay a fine and asked to choose the main reason they haven’t gotten coverage this year, cost again turns up as the biggest barrier for the uninsured; over a third (36 percent) say they tried to get coverage but it was too expensive. Fourteen percent of the uninsured say they don’t think the law’s requirement to have insurance applies to them personally, and another 13 percent say they didn’t know about the requirement. Twelve percent say they tried to get coverage but were unable. Just 7 percent say they would rather pay the fine than pay for health insurance.
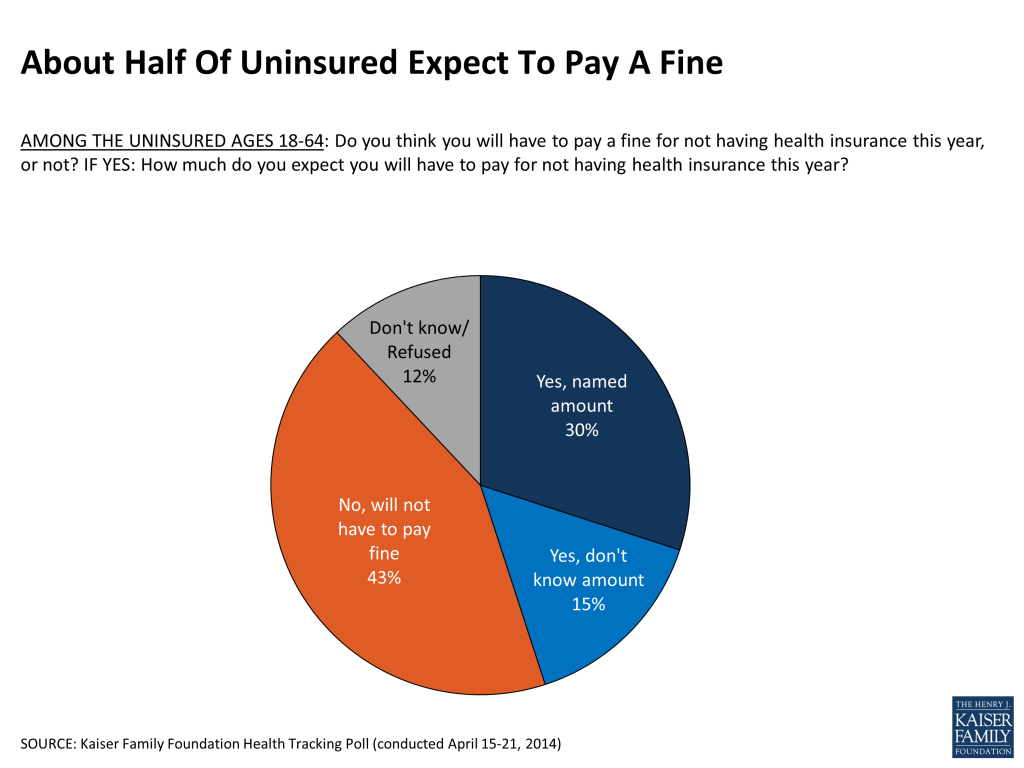
Almost half the uninsured (45 percent) think they will have to pay a fine for not having health insurance this year, though a sizeable share of the uninsured (15 percent) say they don’t know what the amount will be.
Among the public overall, almost half (46 percent) say they don’t know what the fine is for people who don’t get health insurance this year, while 23 percent give responses close to the actual fine, including 14 percent who named dollar amounts between $90 and $100, 5 percent who said it is one percent of a person’s household income, and 4 percent who gave the precise answer that the fine is either $95 or one percent of income, whichever is greater.
Majority support contraceptive coverage requirement, including for-profit companies whose owners have religious objections
In light of the recent Supreme Court hearings in two cases challenging the ACA’s requirement that private health plans cover prescription birth control without cost-sharing, the latest Kaiser Health Tracking Poll finds that, in general, the public supports the requirement by a nearly 2-to-1 margin (61 percent support, 32 percent oppose). Women, younger adults, Democrats and independents are the groups most likely to support the requirement, while seniors are split on the question and a majority of Republicans are opposed.
| Figure 9: Majority Supports ACA’s Contraceptive Coverage Requirement | ||||||||||
| By Gender | By Political Party ID | By Age | ||||||||
| In general, do you support or oppose the health care law’s requirement that private health insurance plans cover the full cost of birth control? | Total | Men | Women | Dem | Ind | Rep | 18-29 | 30-49 | 50-64 | 65+ |
| Support | 61% | 56% | 65% | 81% | 62% | 37% | 71% | 64% | 60% | 45% |
| Oppose | 32 | 36 | 28 | 14 | 30 | 57 | 25 | 30 | 32 | 43 |
| Don’t know/refused | 7 | 8 | 7 | 5 | 8 | 7 | 4 | 6 | 8 | 12 |
Asked more specifically about whether for-profit companies whose owners have religious objections to birth control should be subject to the requirement, a majority (55 percent) of the public feel these companies should be required to cover birth control even if it violates their owners’ personal religious beliefs, while four in ten feel such companies should not be subject to the requirement even if it means their workers will have to pay out-of-pocket for birth control.
| Figure 10: Majority Believe For-Profit Companies Should Be Required To Cover Birth Control, Despite Owners’ Religious Objections | ||||||||||
| By Gender | By Political Party ID | By Age | ||||||||
| Which comes closer to your view about how this law should apply to for-profit companies whose owners object to birth control on religious grounds? | Total | Men | Women | Dem | Ind | Rep | 18-29 | 30-49 | 50-64 | 65+ |
| For-profit companies SHOULD be required to cover birth control in their workers’ health plans, even if it violates their owners’ personal religious beliefs | 55% | 50% | 61% | 74% | 55% | 34% | 64% | 58% | 55% | 41% |
| For-profit companies should NOT be required to cover birth control in their workers’ health plans, even if it means their female employees will have to pay the cost of birth control themselves | 40 | 46 | 35 | 22 | 42 | 62 | 35 | 37 | 40 | 53 |
| Neither/other (Vol.) | 2 | 2 | 2 | 2 | 2 | 1 | 1 | 3 | 2 | 1 |
| Don’t know/Refused | 3 | 3 | 3 | 2 | 1 | 4 | 1 | 2 | 3 | 6 |
Over four in ten Americans (44 percent) reported following news coverage of the Supreme Court hearings regarding contraceptive coverage “very” or “fairly” closely, somewhat higher than the share that reported paying close attention to the recent Supreme Court decision overturning certain limits on campaign donations (37 percent). The Supreme Court contraception case was closely followed by similar shares of men and women, and similar shares of Democrats, Republicans, and independents.
More details on the public’s attention to health policy news in April can be found in the Kaiser Health Policy News Index.
This Kaiser Health Tracking Poll was designed and analyzed by public opinion researchers at the Kaiser Family Foundation (KFF) led by Mollyann Brodie, Ph.D., including Liz Hamel, Bianca DiJulio, and Jamie Firth. The survey was conducted April 15-21, 2014, among a nationally representative random digit dial telephone sample of 1,504 adults ages 18 and older, living in the United States, including Alaska and Hawaii (note: persons without a telephone could not be included in the random selection process). Computer-assisted telephone interviews conducted by landline (750) and cell phone (754, including 440 who had no landline telephone) were carried out in English and Spanish by Princeton Data Source under the direction of Princeton Survey Research Associates International (PSRAI). Both the random digit dial landline and cell phone samples were provided by Survey Sampling International, LLC. For the landline sample, respondents were selected by asking for the youngest adult male or female currently at home based on a random rotation. If no one of that gender was available, interviewers asked to speak with the youngest adult of the opposite gender. For the cell phone sample, interviews were conducted with the person who answered the phone. KFF paid for all costs associated with the survey.
The combined landline and cell phone sample was weighted to balance the sample demographics to match estimates for the national population using data from the Census Bureau’s 2012 American Community Survey (ACS) on sex, age, education, race, Hispanic origin, nativity (for Hispanics only), and region along with data from the 2010 Census on population density. The sample was also weighted to match current patterns of telephone use using data from the January-June 2013 National Health Interview Survey. The weight takes into account the fact that respondents with both a landline and cell phone have a higher probability of selection in the combined sample and also adjusts for the household size for the landline sample. All statistical tests of significance account for the effect of weighting.
The margin of sampling error including the design effect for the full sample is plus or minus 3 percentage points. Numbers of respondents and margin of sampling error for key subgroups are shown in the table below. For results based on other subgroups, the margin of sampling error may be higher. Sample sizes and margin of sampling errors for other subgroups are available by request. Note that sampling error is only one of many potential sources of error in this or any other public opinion poll.
| Group | N (unweighted) | M.O.S.E. |
| Total | 1,504 | ±3 percentage points |
| Uninsured, ages 18-64 | 154 | ±8 percentage points |
| Party Identification | ||
| Democrats | 449 | ±5 percentage points |
| Republicans | 400 | ±6 percentage points |
| Independents | 479 | ±5 percentage points |
| Opinion of ACA | ||
| Favorable Opinion of the ACA | 583 | ±5 percentage points |
| Unfavorable Opinion of the ACA | 716 | ±4 percentage points |
| Gender | ||
| Male | 707 | ±4 percentage points |
| Female | 797 | ±4 percentage points |
| Age | ||
| 18-29 | 210 | ±7 percentage points |
| 30-49 | 381 | ±5 percentage points |
| 50-64 | 479 | ±5 percentage points |
| 65 + | 432 | ±5 percentage points |
Endnotes
- The survey was in the field April 15-21. The Obama Administration announced on April 1 that at least 7 million people had signed up for coverage through the ACA’s marketplace, and announced on April 17 that the figure was at least 8 million. For interviews conducted April 15-16, the question about enrollment numbers included “about 7 million” as a possible response option; that option was changed to “about 8 million” for interviews conducted April 17-21. Our analysis indicates there were no substantive differences in opinion for interviews conducted before and after the April 17 announcement. ↩︎
- See previous footnote. ↩︎