Analysis of 2015 Premium Changes in the Affordable Care Act’s Health Insurance Marketplaces
Updated Jan. 2015 – Map and tables reflect most recent premium data available.
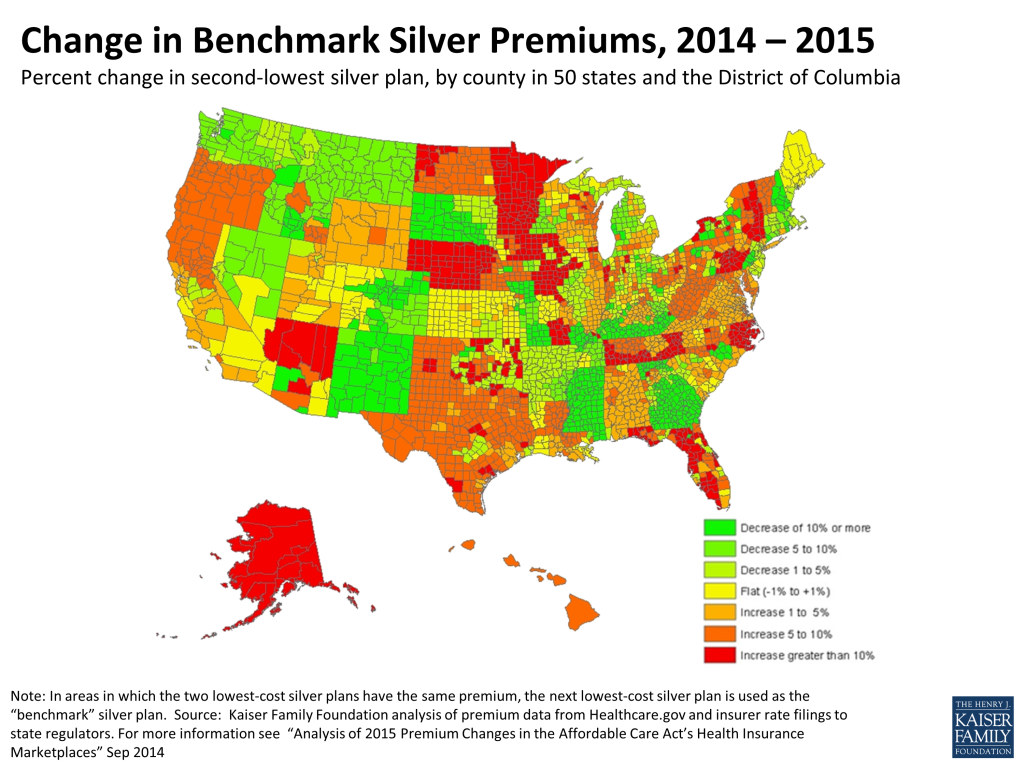
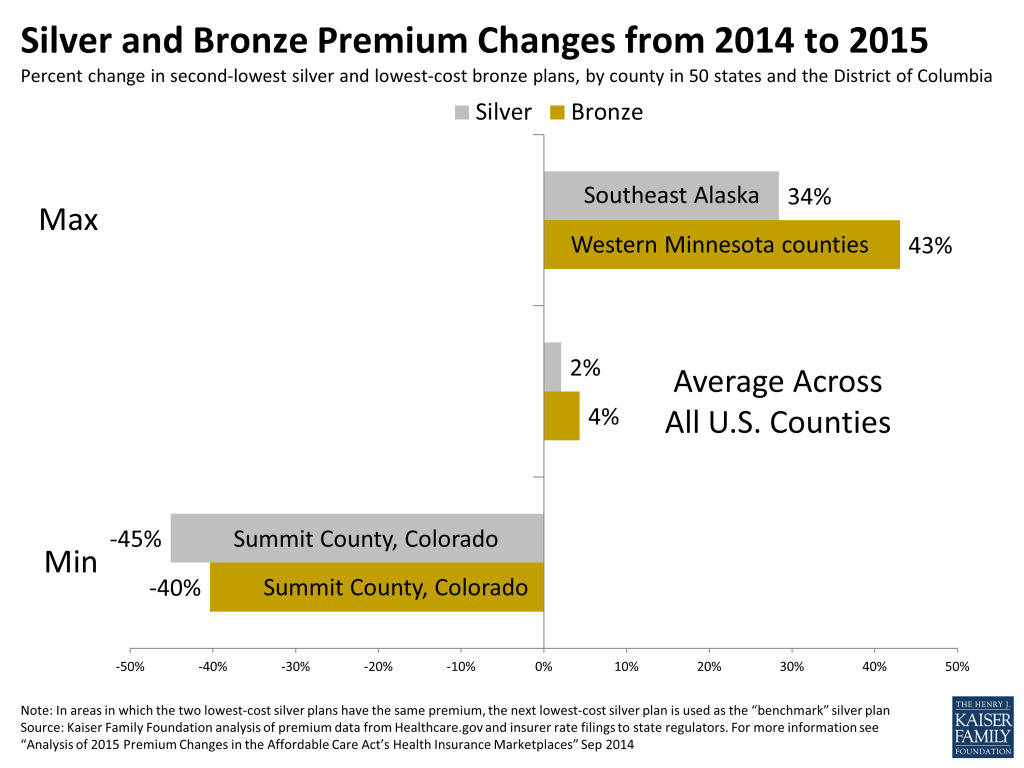
The map and 50-state table are updates to our September analysis, which examined premium changes for the lowest-cost bronze plan and the two lowest-cost silver plans in 16 major cities. The second-lowest cost silver plan in each state is of particular interest as it acts as a benchmark that helps determine how much assistance eligible individuals can receive in the form of federal tax credits. Although premium changes vary substantially across and within states, premium changes for 2015 in general are modest when looking at the low-cost insurers in the marketplaces, where enrollment is concentrated.
The tables below were first published in the Kaiser Family Foundation analysis of 2015 premium changes in September, 2014. They were updated in January, 2015 with the most recent premium data available.
Benchmark Silver Plans
This table presents the premiums and percent change in benchmark silver plans in a major city in each state. In addition to an enrollee’s income and family size, their second-lowest priced silver plan is used as the benchmark to determine the amount of financial assistance he or she can receive through the Marketplace.
| Table 1: Monthly Silver Premiumsfor a 40 Year Old Non-Smoker Making $30,000 / Year | |||||||
| State | Major City | 2nd Lowest Cost Silver Before Tax Credit | 2nd Lowest Cost Silver After Tax Credit | ||||
| 2014 | 2015 | % Changefrom 2014 | 2014 | 2015 | % Changefrom 2014 | ||
| Alabama | Birmingham | $258 | $264 | 2.5% | $209 | $208 | -0.8% |
| Alaska | Anchorage | $433 | $547 | 26.3% | $165 | $164 | -0.8% |
| Arizona | Phoenix | $197 | $177 | -10.0% | $197 | $177 | -10.0% |
| Arkansas | Little Rock | $306 | $299 | -2.3% | $209 | $208 | -0.8% |
| California | Los Angeles | $255 | $257 | 0.8% | $209 | $208 | -0.8% |
| Colorado | Denver | $250 | $211 | -15.6% | $209 | $208 | -0.8% |
| Connecticut | Hartford | $328 | $312 | -5.0% | $209 | $208 | -0.8% |
| Delaware | Wilmington | $289 | $301 | 4.1% | $209 | $208 | -0.8% |
| DC | Washington | $242 | $242 | -0.2% | $209 | $208 | -0.8% |
| Florida | Miami | $269 | $274 | 1.8% | $209 | $208 | -0.8% |
| Georgia | Atlanta | $251 | $255 | 1.8% | $209 | $208 | -0.8% |
| Hawaii | Honolulu | $183 | $200 | 9.3% | $181 | $179 | -0.8% |
| Idaho | Boise | $231 | $210 | -9.3% | $209 | $208 | -0.8% |
| Illinois | Chicago | $212 | $215 | 1.6% | $209 | $208 | -0.8% |
| Indiana | Indianapolis | $354 | $329 | -7.0% | $209 | $208 | -0.8% |
| Iowa | Cedar Rapids | $255 | $246 | -3.5% | $209 | $208 | -0.8% |
| Kansas | Wichita | $224 | $218 | -2.7% | $209 | $208 | -0.8% |
| Kentucky | Louisville | $205 | $212 | 3.2% | $205 | $208 | 1.1% |
| Louisiana | New Orleans | $311 | $296 | -4.8% | $209 | $208 | -0.8% |
| Maine | Portland | $295 | $282 | -4.4% | $209 | $208 | -0.8% |
| Maryland | Baltimore | $229 | $235 | 2.6% | $209 | $208 | -0.8% |
| Massachusetts | Boston | $278 | $257 | -7.5% | $209 | $208 | -0.8% |
| Michigan | Detroit | $224 | $230 | 2.6% | $209 | $208 | -0.8% |
| Minnesota | Minneapolis | $154 | $183 | 18.5% | $154 | $183 | 18.5% |
| Mississippi | Jackson | $410 | $305 | -25.5% | $209 | $208 | -0.8% |
| Missouri | St Louis | $263 | $276 | 4.8% | $209 | $208 | -0.8% |
| Montana | Billings | $258 | $241 | -6.6% | $209 | $208 | -0.8% |
| Nebraska | Omaha | $271 | $264 | -2.6% | $209 | $208 | -0.8% |
| Nevada | Las Vegas | $238 | $237 | -0.6% | $209 | $208 | -0.8% |
| New Hampshire | Manchester | $289 | $247 | -14.6% | $209 | $208 | -0.8% |
| New Jersey | Newark | $322 | $316 | -1.9% | $209 | $208 | -0.8% |
| New Mexico | Albuquerque | $194 | $171 | -11.8% | $194 | $171 | -11.8% |
| New York | New York City | $365 | $372 | 1.8% | $209 | $208 | -0.8% |
| North Carolina | Charlotte | $307 | $326 | 6.4% | $209 | $208 | -0.8% |
| North Dakota | Fargo | $271 | $272 | 0.3% | $209 | $208 | -0.8% |
| Ohio | Cleveland | $249 | $247 | -0.6% | $209 | $208 | -0.8% |
| Oklahoma | Oklah. City | $201 | $219 | 8.8% | $201 | $208 | 3.2% |
| Oregon | Portland | $201 | $213 | 6.1% | $201 | $208 | 3.4% |
| Pennsylvania | Philadelphia | $300 | $268 | -10.7% | $209 | $208 | -0.8% |
| Rhode Island | Providence | $293 | $260 | -11.2% | $209 | $208 | -0.8% |
| South Carolina | Columbia | $269 | $276 | 2.7% | $209 | $208 | -0.8% |
| South Dakota | Sioux Falls | $264 | $257 | -2.8% | $209 | $208 | -0.8% |
| Tennessee | Nashville | $188 | $203 | 7.8% | $188 | $203 | 7.8% |
| Texas | Houston | $245 | $250 | 2.0% | $209 | $208 | -0.8% |
| Utah | Salt Lake City | $209 | $215 | 2.7% | $209 | $208 | -0.8% |
| Vermont | Burlington | $413 | $436 | 5.6% | $209 | $208 | -0.8% |
| Virginia | Richmond | $253 | $260 | 2.7% | $209 | $208 | -0.8% |
| Washington | Seattle | $281 | $254 | -9.8% | $209 | $208 | -0.8% |
| West Virginia | Huntington | $268 | $289 | 7.8% | $209 | $208 | -0.8% |
| Wisconsin | Milwaukee | $315 | $333 | 5.7% | $209 | $208 | -0.8% |
| Wyoming | Cheyenne | $395 | $407 | 3.1% | $209 | $208 | -0.8% |
| Note: In areas in which the two lowest-cost silver plans have the same premium, the next lowest-cost silver plan is used as the “benchmark” silver plan.Source: Kaiser Family Foundation analysis of premium data from Healthcare.gov and insurer rate filings to state regulators. For more information see “Analysis of 2015 Premium Changes in the Affordable Care Act’s Health Insurance Marketplaces” Sep 2014 | |||||||
Lowest Bronze Plans
The table below presents the premium and percent change for the lowest-cost bronze plan in a major city in each state. These plans represent the lowest-cost option available to most shoppers on the Marketplaces.
| Table 2: Monthly Bronze Premiums for a 40 Year Old Non-Smoker Making $30,000 / Year | |||||||
| State | Rating Area(Major City) | Lowest Cost Bronze Before Tax Credit | Lowest Cost Bronze After Tax Credit | ||||
| 2014 | 2015 | % Change from 2014 | 2014 | 2015 | % Change from 2014 | ||
| Alabama | Birmingham | $208 | $218 | 4.9% | $160 | $162 | 1.3% |
| Alaska | Anchorage | $310 | $396 | 27.7% | $42 | $13 | -69.0% |
| Arizona | Phoenix | $170 | $153 | -9.8% | $170 | $153 | -9.8% |
| Arkansas | Little Rock | $231 | $240 | 3.7% | $135 | $149 | 10.5% |
| California | Los Angeles | $188 | $210 | 11.7% | $142 | $161 | 12.9% |
| Colorado | Denver | $186 | $167 | -10.0% | $145 | $164 | 13.0% |
| Connecticut | Hartford | $232 | $196 | -15.5% | $113 | $92 | -19.0% |
| Delaware | Wilmington | $247 | $239 | -3.4% | $167 | $146 | -13.0% |
| DC | Washington | $166 | $181 | 8.8% | $134 | $147 | 10.1% |
| Florida | Miami | $198 | $224 | 12.9% | $138 | $158 | 13.8% |
| Georgia | Atlanta | $202 | $205 | 1.5% | $161 | $158 | -1.9% |
| Hawaii | Honolulu | $145 | $166 | 14.5% | $143 | $145 | 1.4% |
| Idaho | Boise | $192 | $184 | -3.9% | $169 | $182 | 7.3% |
| Illinois | Chicago | $152 | $170 | 11.7% | $150 | $163 | 8.5% |
| Indiana | Indianapolis | $271 | $251 | -7.5% | $127 | $130 | 2.0% |
| Iowa | Cedar Rapids | $161 | $182 | 12.9% | $116 | $144 | 24.1% |
| Kansas | Wichita | $148 | $173 | 17.0% | $133 | $163 | 22.2% |
| Kentucky | Louisville | $162 | $135 | -16.8% | $162 | $131 | -19.4% |
| Louisiana | New Orleans | $208 | $202 | -2.7% | $106 | $114 | 7.1% |
| Maine | Portland | $235 | $218 | -7.1% | $149 | $144 | -3.6% |
| Maryland | Baltimore | $146 | $165 | 12.8% | $127 | $138 | 8.7% |
| Massachusetts | Boston | $242 | $210 | -13.1% | $173 | $161 | -7.3% |
| Michigan | Detroit | $168 | $181 | 7.8% | $153 | $159 | 3.6% |
| Minnesota | Minneapolis | $115 | $140 | 21.4% | $115 | $140 | 21.4% |
| Mississippi | Jackson | $242 | $226 | -6.6% | $42 | $129 | 208.4% |
| Missouri | St Louis | $179 | $198 | 10.6% | $125 | $130 | 3.7% |
| Montana | Billings | $206 | $211 | 2.6% | $157 | $178 | 13.2% |
| Nebraska | Omaha | $197 | $203 | 3.0% | $135 | $147 | 8.4% |
| Nevada | Las Vegas | $183 | $201 | 10.1% | $154 | $172 | 11.8% |
| New Hampshire | Manchester | $227 | $188 | -17.1% | $147 | $149 | 1.3% |
| New Jersey | Newark | $280 | $279 | -0.3% | $167 | $171 | 2.1% |
| New Mexico | Albuquerque | $154 | $131 | -15.2% | $154 | $131 | -15.2% |
| New York | New York City | $307 | $308 | 0.3% | $151 | $144 | -4.7% |
| North Carolina | Charlotte | $224 | $244 | 9.1% | $126 | $126 | -0.7% |
| North Dakota | Fargo | $213 | $223 | 4.5% | $151 | $159 | 4.7% |
| Ohio | Cleveland | $185 | $196 | 5.8% | $146 | $157 | 7.2% |
| Oklahoma | Oklah. City | $129 | $148 | 15.0% | $129 | $137 | 6.2% |
| Oregon | Portland | $165 | $175 | 5.8% | $165 | $170 | 2.6% |
| Pennsylvania | Philadelphia | $238 | $219 | -7.9% | $147 | $159 | 8.1% |
| Rhode Island | Providence | $210 | $201 | -4.3% | $127 | $149 | 17.5% |
| South Carolina | Columbia | $202 | $201 | -0.4% | $142 | $133 | -6.9% |
| South Dakota | Sioux Falls | $239 | $217 | -9.3% | $184 | $168 | -9.0% |
| Tennessee | Nashville | $139 | $153 | 10.3% | $139 | $153 | 10.3% |
| Texas | Houston | $168 | $188 | 11.9% | $132 | $146 | 10.1% |
| Utah | Salt Lake City | $152 | $168 | 10.3% | $152 | $161 | 5.5% |
| Vermont | Burlington | $336 | $360 | 7.1% | $132 | $131 | -0.7% |
| Virginia | Richmond | $170 | $173 | 1.8% | $126 | $121 | -4.5% |
| Washington | Seattle | $186 | $194 | 4.3% | $114 | $148 | 29.5% |
| West Virginia | Huntington | $215 | $234 | 8.9% | $156 | $153 | -2.3% |
| Wisconsin | Milwaukee | $244 | $261 | 7.1% | $138 | $136 | -1.7% |
| Wyoming | Cheyenne | $331 | $346 | 4.7% | $145 | $147 | 1.0% |
| Note: In areas in which the two lowest-cost silver plans have the same premium, the next lowest-cost silver plan is used as the “benchmark” silver plan.Source: Kaiser Family Foundation analysis of premium data from Healthcare.gov and insurer rate filings to state regulators. For more information see “Analysis of 2015 Premium Changes in the Affordable Care Act’s Health Insurance Marketplaces” Sep 2014 | |||||||