Vaccine Hesitancy in Rural America
Findings
The KFF COVID-19 Vaccine Monitor is an ongoing research project tracking the public’s attitudes and experiences with COVID-19 vaccinations. Using a combination of surveys and focus groups, this project will track the dynamic nature of public opinion as vaccine development unfolds, including vaccine confidence and hesitancy, trusted messengers and messages, as well as the public’s experiences with vaccination as distribution begins.
An updated Vaccine Monitor report on rural America is available here.
Vaccine Hesitancy in Rural America
The COVID-19 pandemic’s impact has been felt in communities across the U.S., from the largest urban centers to the smallest rural communities. As previous research has demonstrated, rural communities face unique challenges in responding to the pandemic due to medical workforce shortages, fewer hospital beds per capita, limited access to telehealth, and populations that are at elevated risk for COVID-19 related deaths due to age or chronic disease prevalence. In addition, a previous KFF analysis found non-metro counties experienced a faster growth rate in the spread of the virus and more recent data confirms that this is still the case. In late 2020, there were countless stories of the most rural communities being impacted by the coronavirus including remote Alaska villages and Texas ranches, and an analysis from Pew Research Center found that sparsely populated rural areas were accounting for twice the number of coronavirus-related deaths as urban areas.
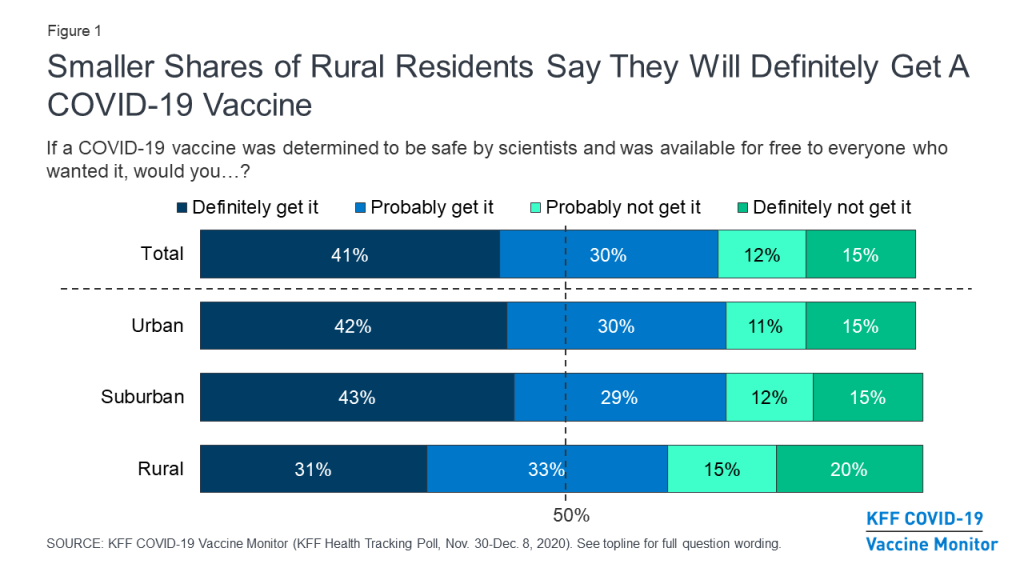
With the pandemic’s toll hitting rural communities hard, the findings from the December KFF COVID-19 Vaccine Monitor are a cause for concern. Rural residents are among the most vaccine hesitant groups, along with Republicans, individuals 30-49 years old, and Black adults. Individuals living in rural areas in the U.S. are significantly less likely to say they will get a COVID-19 vaccine that is deemed safe and available for free than individuals living in suburban and urban America. Three in ten (31%) people in rural areas say they will “definitely get” the vaccine, compared to four in ten people in urban areas (42%) and suburban areas (43%). An additional one-third of people in rural areas say they will “probably get it” while 35% say they will either “probably not get it” (15%) or “definitely not get it” (20%).

There are many factors that are associated with an individual’s willingness to get the coronavirus vaccine including their age, level of education, and – notably – their political party identification. For example, the KFF COVID-19 Vaccine Monitor finds that Republicans are much less likely to say they will get a coronavirus vaccine compared to their independent and Democratic counterparts. Yet, even when we control for these factors, individuals living in rural areas are still more likely to be vaccine hesitant compared to those living in suburban and urban areas.
With news reports about the coronavirus vaccine being slow to reach hospitals and health care workers in rural communities, the KFF data also finds three in ten rural residents (29%) report being the most enthusiastic to get the vaccine saying they will get the COVID-19 vaccine “as soon as possible” (compared to 36% of urban residents and 34% of suburban residents). An additional four in ten (38%) rural residents say they will “wait and see” before getting the vaccine, and one in ten say they will only get the vaccine if they are required to do so for work or other activities.

What are the effective messages and messengers for rural Americans?
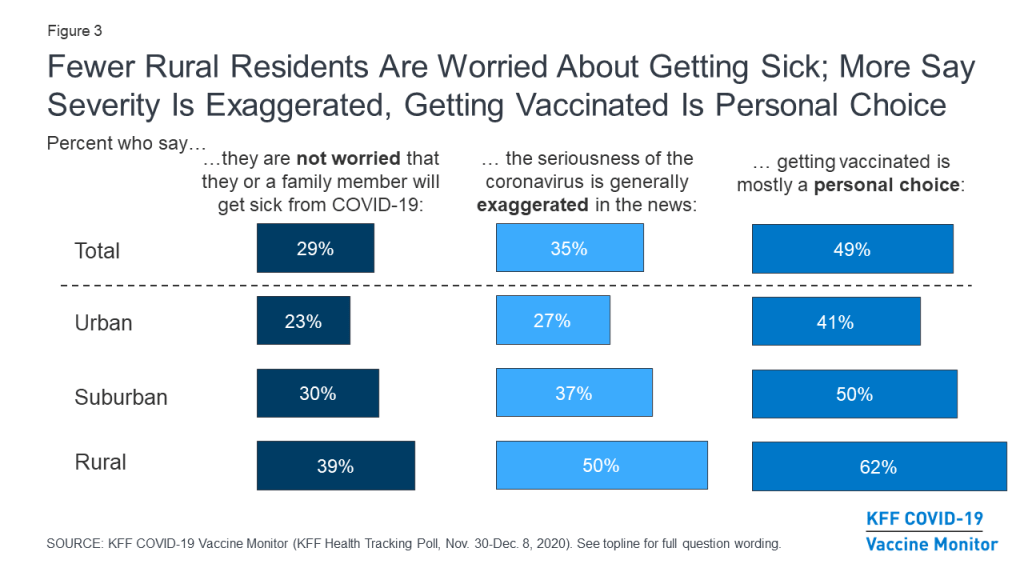
So if partisan identification and demographics don’t completely explain the greater hesitancy, what else is driving attitudes about getting a vaccine among rural residents? While rural residents are just as likely as those living in urban and suburban communities to know someone who has tested positive or died from coronavirus, four in ten rural residents (39%) say they are not worried they or someone in their family will get sick from the coronavirus, compared to 23% of urban residents and three in ten suburban residents (30%). In addition, half of rural residents say the seriousness of coronavirus is “generally exaggerated” compared to 27% of urban residents and 37% of suburban residents.
And, for rural residents, getting a COVID-19 vaccine is seen more as a personal choice (62% ) than as part “of everyone’s responsibility to protect the health of others” (36%). A majority of urban residents (55%) say getting vaccinated is part of everyone’s responsibility as do nearly half of suburban residents (47%).

When it comes to reaching rural residents, a large majority of rural Americans (86%) say they trust their own doctor or health care provider to provide reliable information about a COVID-19 vaccine. Smaller shares say they trust the FDA (68%), the CDC (66%), their local public health department (64%), Dr. Fauci (59%), or state government officials (55%).
Vaccine hesitancy among rural residents is more than just partisanship and is strongly connected to their views of the severity of the coronavirus and the reasons for getting vaccinated. Effective messages need to be delivered by trusted messengers and take into account these strongly held beliefs in order to have successful vaccine uptake in rural America.
Methodology
This KFF Health Tracking Poll/ KFF COVID-19 Vaccine Monitor was designed and analyzed by public opinion researchers at the Kaiser Family Foundation (KFF). The survey was conducted November 30- December 8, 2020, among a nationally representative random digit dial telephone sample of 1,676 adults ages 18 and older (including interviews from 298 Hispanic adults and 390 non-Hispanic Black adults), living in the United States, including Alaska and Hawaii (note: persons without a telephone could not be included in the random selection process). Phone numbers used for this study were randomly generated from cell phone and landline sampling frames, with an overlapping frame design, and disproportionate stratification aimed at reaching Hispanic and non-Hispanic Black respondents. The sample also includes interviews completed with respondents who had previously completed an interview on the KFF Tracking Poll (n =267) or an interview on the SSRS Omnibus poll (and other RDD polls) and identified as Hispanic (n = 80; including 14 in Spanish) or non-Hispanic Black (n=179). Computer-assisted telephone interviews conducted by landline (391) and cell phone (1,285, including 947 who had no landline telephone) were carried out in English and Spanish by SSRS of Glen Mills, PA. To efficiently obtain a sample of lower-income and non-White respondents, the sample also included an oversample of prepaid (pay-as-you-go) telephone numbers (25% of the cell phone sample consisted of prepaid numbers) Both the random digit dial landline and cell phone samples were provided by Marketing Systems Group (MSG). For the landline sample, respondents were selected by asking for the youngest adult male or female currently at home based on a random rotation. If no one of that gender was available, interviewers asked to speak with the youngest adult of the opposite gender. For the cell phone sample, interviews were conducted with the adult who answered the phone. KFF paid for all costs associated with the survey.
The combined landline and cell phone sample was weighted to balance the sample demographics to match estimates for the national population using data from the Census Bureau’s 2019 U.S. American Community Survey (ACS), on sex, age, education, race, Hispanic origin, and region, within race-groups, along with data from the 2010 Census on population density. The sample was also weighted to match current patterns of telephone use using data from the January- June 2019 National Health Interview Survey. The weight takes into account the fact that respondents with both a landline and cell phone have a higher probability of selection in the combined sample and also adjusts for the household size for the landline sample, and design modifications, namely, the oversampling of prepaid cell phones and likelihood of non-response for the re-contacted sample. All statistical tests of significance account for the effect of weighting.
The margin of sampling error including the design effect for the full sample is plus or minus 3 percentage points. Numbers of respondents and margins of sampling error for key subgroups are shown in the table below. For results based on other subgroups, the margin of sampling error may be higher. Sample sizes and margins of sampling error for other subgroups are available by request. Note that sampling error is only one of many potential sources of error in this or any other public opinion poll. Kaiser Family Foundation public opinion and survey research is a charter member of the Transparency Initiative of the American Association for Public Opinion Research.
| Group | N (unweighted) | M.O.S.E. |
| Total | 1,676 | ± 3 percentage points |
| Community type | ||
| Urban | 690 | ± 5 percentage points |
| Suburban | 788 | ± 4 percentage points |
| Rural | 198 | ± 8 percentage points |