Medicaid Financial Eligibility for Seniors and People with Disabilities: Findings from a 50-State Survey
Executive Summary
Medicaid is an essential source of coverage for medical and long-term services and supports (LTSS) for many seniors and nonelderly adults and children with disabilities. Aside from the core group of SSI beneficiaries, pathways to full Medicaid eligibility based on old age or disability are provided at state option. This issue brief presents the latest state-level data on Medicaid financial eligibility criteria and adoption of key age and disability-related pathways (Figure 1). It also analyzes state choices about whether to adopt these optional age and disability-related pathways in light of states’ Affordable Care Act (ACA) expansion status. Findings are based on a survey of the 50 states and the District of Columbia. Appendix Tables contained detailed state-level data. Key findings include the following:

- While adoption of the major optional age and disability-related Medicaid eligibility pathways varies substantially across states, state choices about these pathways have remained stable since the time of our last survey in 2015. All states except Alabama elect at least one state plan optional pathway to full Medicaid eligibility based on old age or disability.
- The income limits associated with the age and disability-related pathways vary across states but generally remain low, with a notable minority of states opting to eliminate asset tests in certain pathways. The median income limit was 74% of the federal poverty level (FPL, $771/month in 2019) for individuals eligible based on old age or disability, 48% FPL ($500/month) for individuals eligible as medically needy, and 250% FPL ($2,602/month) for working people with disabilities. All states except Tennessee offer the Katie Beckett state plan option or a comparable waiver to cover at least some children with significant disabilities regardless of household income.
- Greater shares of states that have adopted the ACA Medicaid expansion also have adopted key optional age and disability-related pathways, compared to non-expansion states. Since the time of our last survey in 2015, expansion states generally have not scaled back age or disability-related pathways, while non-expansion states generally have not increased eligibility in age and disability-related pathways.
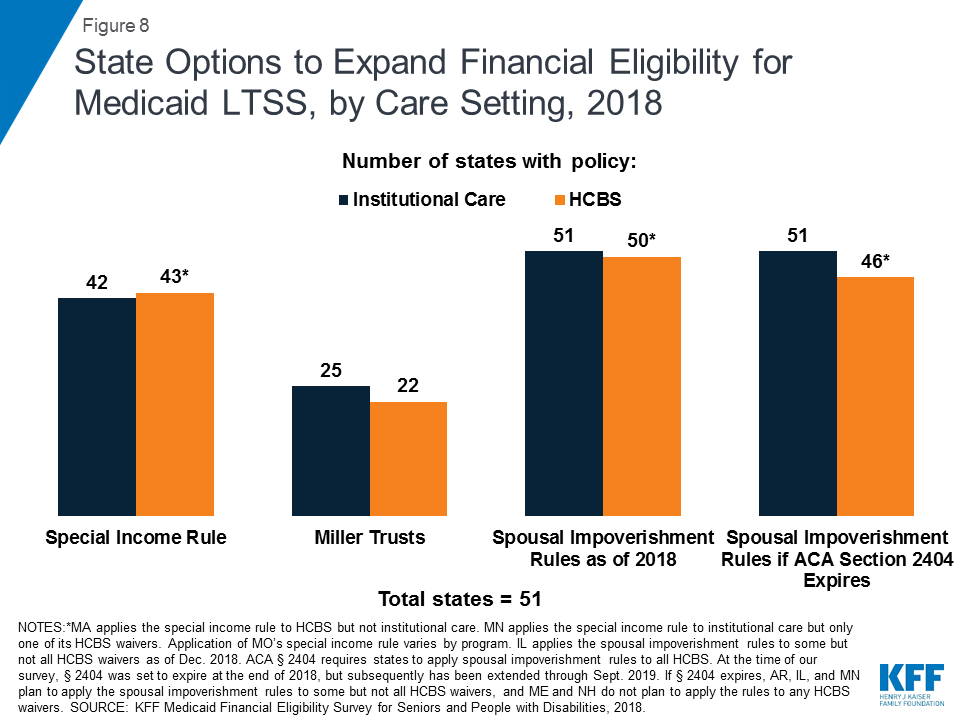
- All states elect at least some options to expand financial eligibility for Medicaid LTSS. While most states apply the same rules regardless of care setting, there are a few states in which financial eligibility rules for home and community-based services (HCBS) are more restrictive and could be aligned with rules for institutional care to eliminate programmatic bias and increase community integration. Nearly all states are applying the spousal impoverishment rules to HCBS as required by ACA Section 2404; these rules protect a portion of income and assets to support a spouse when an individual receives Medicaid LTSS. However, five states report plans to scale back or stop doing so and more could follow if Congress allows Section 2404 to expire on September 30, 2019.
- All states offer Medicare Savings Programs (MSPs) in which Medicaid covers some or all out-of-pocket costs for low-income Medicare beneficiaries. Few states expand MSP financial eligibility beyond the federal minimum limits, although nine states have opted to eliminate MSP asset limits.
- An increasing number of states are opting to apply the ACA’s streamlined eligibility renewal provisions to age and disability-related pathways, which can help retain eligible people in coverage and strengthen continuity of care. Thirty states now use prepopulated forms to facilitate eligibility renewals and 43 states offer reconsideration periods for these pathways.
Looking ahead, state and federal policy choices that affect Medicaid eligibility for seniors and people with disabilities will remain important areas to watch. As more states have adopted the ACA Medicaid expansion, state choices about optional age and disability-related pathways generally have remained stable. Expanding coverage for children with significant disabilities is the subject of recent legislation in Louisiana and Tennessee. States’ progress in advancing community integration could be at risk if spousal impoverishment rules are scaled back for HCBS but remain in place for institutional care if Congress allows ACA Section 2404 to expire this fall. In addition, Medicaid eligibility in age and disability-related pathways could be affected by a change to the inflation measure that is used to determine the annual federal poverty line, which the federal government is considering. Using a lower inflation measure would result in smaller increases in the poverty line each year compared to the current measure, which would slow the annual increase in Medicaid income limits based on the FPL over time, with fewer people eligible for Medicaid as a result. These and other policy changes in the years ahead will influence the extent to which seniors and people with disabilities can gain and maintain Medicaid eligibility and access to needed preventive, physical, behavioral health, and long-term services and supports.
Issue Brief
Introduction
Medicaid is an important source of health and long-term care coverage for seniors and people with disabilities. Over 6.9 million Medicaid beneficiaries are age 65 or older.1 Medicaid also covers more than three in 10 (nearly 7 million) nonelderly adults with disabilities2 and, together with the Children’s Health Insurance Program (CHIP), about half (47%, or about 6.1 million) of children with special health care needs.3 Medicaid beneficiaries with disabilities include individuals with physical conditions such as multiple sclerosis, epilepsy, and blindness; HIV/AIDS; spinal cord and traumatic brain injuries; disabling mental health conditions such as depression and schizophrenia; intellectual and developmental disabilities such as Down syndrome and autism; and functional limitations resulting from chronic illnesses. For all of these populations, Medicaid makes coverage affordable and covers a range of medical and long-term services and supports (LTSS), many of which are not covered at all or only available in limited amounts through private insurance or Medicare.
Medicaid pathways in which eligibility for full benefits is based on old age or disability include the core group of Supplemental Security Income (SSI) beneficiaries, which all states that choose to participate in Medicaid must cover, and an array of additional groups that can be covered at state option (Figure 2 and Appendix Table 1). In addition to these pathways, some people with disabilities are eligible for Medicaid based solely on their low income in a poverty-related pathway,4 including the Affordable Care Act’s (ACA) Medicaid expansion.

This issue brief presents state-level data on Medicaid financial eligibility criteria5 and adoption of the major coverage pathways related to old age and disability as of 2018. It includes mandatory and optional pathways to full Medicaid eligibility, options to expand Medicaid eligibility for institutional and home and community-based LTSS, and the Medicare Savings Programs that state Medicaid programs must offer to assist low-income Medicare beneficiaries with out-of-pocket costs. It also considers state choices about whether to adopt various optional pathways related to old age and disability in light of states’ ACA expansion status and state adoption of optional streamlined eligibility renewal procedures. The findings are based on a survey of the 50 states and the District of Columbia conducted by the Kaiser Family Foundation’s Program on Medicaid and the Uninsured in fall 2018.6 The Appendix Tables contain detailed state-level data.
Pathways to Full Medicaid Eligibility Based on Old Age or Disability
SSI Beneficiaries
States generally must provide Medicaid to people who receive federal Supplemental Security Income (SSI) benefits.7 To be eligible for SSI, beneficiaries must have low incomes, limited assets, and an impaired ability to work at a substantial gainful level as a result of old age or significant disability. The SSI federal benefit rate is $750 per month for an individual and $1,125 for a couple8 in 2018,9 which is 74 percent of the federal poverty level (FPL). The effective SSI income limit is somewhat higher than 74% FPL in four states, due to state supplemental payments and/or additional income disregards: 80% FPL in Idaho, 83% FPL in New York and Wisconsin, and 87% FPL in Missouri (Appendix Table 2). Box 1 provides more information about disregards. SSI beneficiaries also are subject to an asset limit of $2,000 for an individual and $3,000 for a couple.
A minority of states (8 of 51) elect the Section 209 (b) option to apply Medicaid eligibility rules to SSI beneficiaries that are different from those under the federal SSI program (Appendix Table 2). SSI is administered by the Social Security Administration (SSA). If states do not want to accept SSA’s determination of an SSI beneficiary’s income, assets, and/or disability status when determining Medicaid eligibility, states can use different rules under Section 209 (b). States can use financial and/or functional eligibility criteria that are more restrictive than the federal SSI rules, as long as the state’s rules are no more restrictive than the rules it had in place in 1972, when the SSI program was established.10 States with Section 209 (b) programs include Connecticut, Hawaii, Illinois, Minnesota, Missouri, New Hampshire, North Dakota, and Virginia. Among these states, Connecticut applies a more restrictive income limit (63% FPL) but also uses a more generous general income disregard than the federal SSI rules ($339 vs $20).11 Illinois also applies a slightly more generous income disregard ($25 vs. $20), while New Hampshire uses a more restrictive income disregard ($13 vs. $20). Two states (CT and NH) have a more restrictive asset limit ($1,600 and $1,500 for an individual, respectively), and three states (MN, MO, and ND) have a more generous asset limit ($3,000 for an individual) compared to the federal SSI rule ($2,000 for an individual).
Optional Pathways
Seniors and people with disabilities up to 100% FPL
Over 40 percent of states (21 of 51) elect the option to expand Medicaid to seniors and people with disabilities whose income exceeds the SSI limit but is below the federal poverty level ($1,012 per month for an individual in 2018)12 (Figure 3 and Appendix Table 2).13 Eighteen of these states set the income limit at 100% FPL, the federal maximum for this pathway. In the other three states electing this option, the eligibility limit is 80% FPL in Arkansas, 81% FPL in Virginia, and 88% FPL in Florida. Twenty of the 21 states electing this option cover both seniors and people with disabilities, while Arkansas only covers seniors.

Arizona is the only state electing the seniors and people with disabilities option that does not apply an asset limit to this pathway (Appendix Table 2). Over half (12) of the 21 states electing this option use the SSI asset limit of $2,000 for an individual and $3,000 for a couple. The other eight states have asset limits higher than the SSI amount: $3,000 for an individual in Minnesota; $4,000 in DC, Nebraska, New Jersey, and Rhode Island; $5,000 in Florida; and $7,560 in Arkansas and South Carolina.
Box 1: Countable Income and Assets in Determining Financial Eligibility
States have rules about which sources of income and assets are included or “countable” when determining Medicaid financial eligibility. Many states use the federal SSI financial methodology to determine Medicaid eligibility in pathways based on old age or disability. Under the SSI rules, an individual’s home, one car used for household transportation, and a certain amount of funds for prepaid burial expenses are examples of assets that are excluded from the limit of $2,000 for an individual and $3,000 for a couple.
Additionally, states may apply rules that disregard a portion of an individual’s income. Under the federal SSI rules, $20 is typically subtracted from a person’s monthly income before comparing the remaining amount to the relevant income limit for a Medicaid coverage group. Other disregards also may apply, depending on the income source. For example, earned income may be subject to an additional disregard of $65 plus half of the remaining amount under the federal SSI rules. Consequently, a person may have actual income that exceeds the limit for a certain pathway but still be eligible for Medicaid as a result of disregards that reduce countable income.
Medically Needy Populations
Two-thirds of states (34 of 51) adopt the medically needy option to extend Medicaid to people with high medical expenses who would be eligible in a categorically needy pathway except that their income and/or asset exceeds the maximum limit for that pathway (Figure 4 and Appendix Table 3). Box 2 explains the distinction between categorically and medically needy pathways and provides more detail about establishing eligibility under the medically needy option. All states electing the medically needy pathway must cover pregnant women and children. These states also may extend medically needy coverage to other groups: 32 of 34 states (all but TN and TX) cover medically needy seniors and people with disabilities, and 26 of 34 states (all but CT, HI, MA, TN, TX, VA, WA, and WI) cover medically needy low income parents.14

The median medically needy income limit is 48% FPL, or $488 per month for an individual in 2018 (Figure 4 and Appendix Table 3).15 Medically needy income limits vary across states16 but are typically very low.17 Nine states set their medically needy income limit at or above the federal SSI benefit level ($750 per month for an individual in 2018,18 74% FPL), and 25 states set their medically needy income limit below the SSI level.
Over half of states (19 of 34) set their medically needy asset limit at the SSI level ($2,000 for an individual and $3,000 for a couple) (Appendix Table 3). Connecticut has a more restrictive medically needy asset limit ($1,600 for an individual and $2,400 for a couple). The other 14 states have more generous medically needy asset limits for individuals and couples (DC, FL, IA, MN, NE, NH, NJ, NY, ND, PA, and RI), only for individuals (MD), or only for couples (GA, KY), compared to the SSI limit, ranging from $2,400 for an individual in Pennsylvania to $15,150 in New York. Four of these states (DC, NE, NJ, and RI) use $4,000, double the SSI limit for an individual. Asset limits for an individual are $2,500 in two states (MD and NH), $3,000 in two states (MN and ND), $5,000 in Florida, and $10,000 in Iowa.
Nearly three-quarters of states covering medically needy populations (25 of 34) expand access to Medicaid institutional LTSS by including nursing facility services in their medically needy benefit package (Appendix Table 3). States have the option to provide a more limited benefit package to people who qualify for Medicaid in a medically needy, as opposed to categorically needy, pathway. Under federal law, states must include nursing facility services in the benefit package for categorically needy populations but can choose whether to include these services in their medically needy benefit package. In states electing this option, the medically needy pathway can be an important means of expanding coverage for those with overwhelming medical and/or LTSS expenses.
Box 2: Categorically Needy vs. Medically Need Pathways
Before the ACA, Medicaid eligibility was limited to certain categories of people.19 These “categorically needy” groups include children, pregnant women, low-income parents, seniors, and people with disabilities. The ACA eliminated the need to fit into one of these categories by expanding Medicaid to nearly all adults with incomes up to 138% FPL ($1,396 per month for an individual in 2018).20 In states that have not adopted the ACA Medicaid expansion, people still must fit into one of the specified categories to qualify for coverage today. In addition, these categories remain relevant to determining Medicaid eligibility under the “medically needy” option because beneficiaries who qualify as “medically needy” must fit into one of the traditional categories. States cannot use the medically needy option to cover people who do not fit into one of the traditional categories, regardless of how poor they are or how extensive their medical needs are.
There are two ways that individuals can qualify for Medicaid through a medically needy pathway.21 First, people with income above the categorically needy income limit associated with a certain population but below the state’s medically needy income limit may be eligible as medically needy. Second, people who “spend down” to the state’s medically needy income limit by subtracting incurred medical or LTSS expenses from their income may qualify. States select a budget period between one and six months during which an individual must incur enough expenses to decrease their income below the medically needy limit. Most states use a budget period of either one month (11 states) or six months (13 states)22 (Appendix Table 3). Using a longer budget period may be administratively simpler for states and enrollees and provide continuity of coverage.
Katie Beckett Children with disabilites
All states except Tennessee opt to provide Medicaid for at least some “Katie Beckett” children up to age 19 with significant disabilities living at home, without regard to household income (Figure 5 and Appendix Table 1). These children must meet SSI medical disability criteria and otherwise qualify for an institutional level of care according to functional eligibility criteria set by the state. States can target different populations based on the type of institutional care (hospital, skilled nursing facility, intermediate care facility, intermediate care facility for individuals with “mental disease,”23 intermediate care facility for individuals with intellectual or developmental disabilities) that would be required if the child was not receiving Medicaid services in the community.
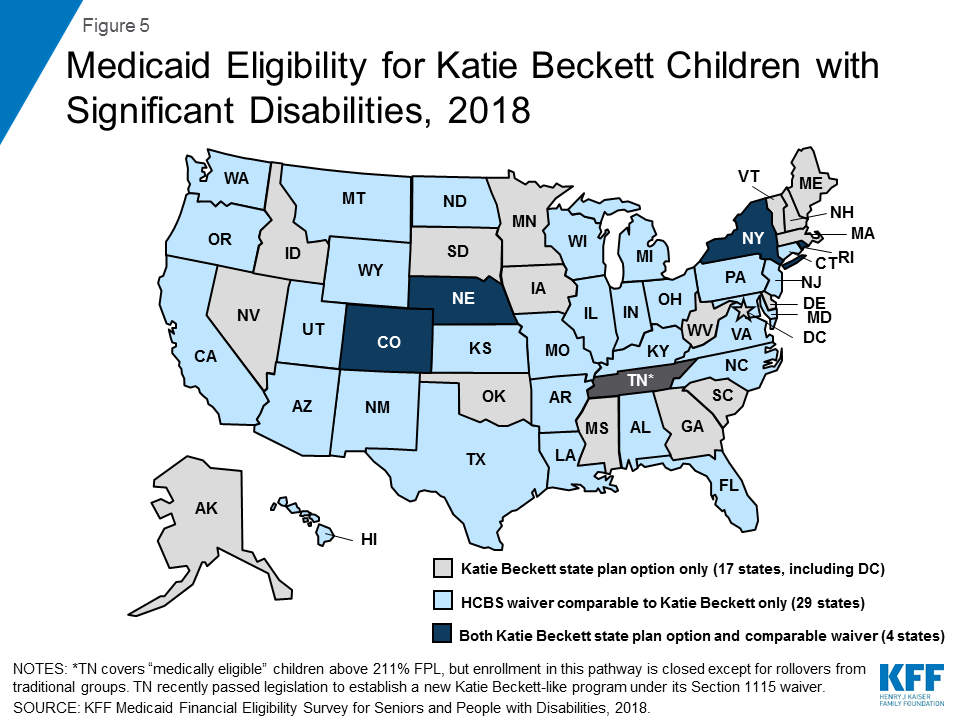
Katie Beckett income limits are generally 300% of SSI ($2,250 per month in 2018),24 with a $2,000 asset limit, considering only the child’s own income and assets. There is no notable state variation in Katie Beckett income and asset limits across states, including those with the state plan option and those with comparable waivers. Under the Katie Beckett pathway, parental income and assets are disregarded when determining Medicaid eligibility for children with disabilities living at home, just as they are for children with disabilities residing in an institution. This option makes it possible for children to receive necessary care while remaining at home with their families.
Over half of Katie Beckett states (29 of 50) cover these children solely through a waiver, under which enrollment can be capped, while about one-third of Katie Beckett states (17 of 50) elect to cover all eligible children under the state plan option (Figure 5 and Appendix Table 1).25 Four states (CO, NE, NY, and RI) cover some Katie Beckett children through the state plan option and others through a comparable waiver. Box 3 describes recent legislation to establish a Katie Beckett waiver program in the remaining state (TN). In addition, Louisiana, which currently has a Katie Beckett-like waiver, recently passed legislation to adopt the Katie Beckett state plan option, which is estimated to cover 1,613 children in FY 2021.26 Katie Beckett children can be covered through the optional state plan coverage group or through a home and community-based services (HCBS) waiver.27 Providing coverage through a waiver allows states to cap enrollment, which can result in waiting lists and is not permitted under state plan authority.
Just over 10 percent of Katie Beckett states (6 of 50) report charging premiums or monthly fees for these children. These include two states electing the Katie Beckett state plan option (ME and MN) and four states with comparable waivers (AR, CT, ND and NV). Maine reports charging premiums for all Katie Beckett enrollees, which vary on a sliding scale based on income and whether the child also has private health insurance. Minnesota reports charging a monthly fee based on family size and income for some enrollees. Arkansas charges premiums for children in households with income above 150% FPL; the premium amount varies based on family income. In North Dakota, premiums are 5% of gross income and begin at 83% FPL. The income level at which premiums begin in Nevada varies based on household size, income, and deductions.
Box 3: Legislation to Create a Katie Beckett Waiver Program in Tennessee
Tennessee is the only state that does not report covering Katie Beckett children through the state plan option or a comparable waiver in 2018. Instead, Tennessee’s Section 1115 waiver currently covers “medically eligible” children” in households with income at or above 211% FPL with no asset test, although enrollment in this pathway is closed except for rollovers from those losing coverage in a traditional group.28 Tennessee’s Section 1115 waiver also provides Medicaid HCBS to a capped number of children with intellectual or developmental disabilities who meet an institutional level of care with incomes up to 300% SSI.29
Recent legislation in Tennessee directs the state to amend its Section 1115 waiver to establish a Katie Beckett-like program that will provide Medicaid without regard to household income and assets to children who are not served under an existing HCBS waiver, have severe functional limitations, qualify for an institutional level of care, and meet SSI medical disability criteria.30 Tennessee proposes that applications will be limited to open enrollment periods, and enrollment would prioritize children with the most significant or complex needs. Families may be required to purchase private or employer sponsored insurance for the child and to pay Medicaid premiums based on a sliding scale. The legislation also calls for a “Medicaid diversion plan” to be established under Tennessee’s waiver that would offer a limited benefit package and use Medicaid funds as premium assistance to purchase private coverage for children who meet functional needs criteria and qualify for an institutional level of care or are at risk of doing so. The amount of premium assistance would be determined using a sliding fee scale based on parental income. The legislation is expected to provide Medicaid to 300 children and serve another 2,700 children under the diversion program.31
Family Opportunity Act children with disabilities
Five states elect the Family Opportunity Act (FOA) state plan option for children with significant disabilities living at home (CO, IA, LA, ND, and TX), and one state (MA) provides comparable coverage through a waiver (Appendix Table 1). The FOA pathway allows states to cover children who meet SSI medical disability criteria in families with incomes up to 300% FPL ($5,195 per month for a family of three in 2018).32 Assets are not considered when determining a child’s FOA eligibility. Both FOA and the Katie Beckett pathway (described above) apply to children with significant disabilities living in the community. Unlike the Katie Becket pathway which only considers the child’s own income, the FOA option considers household income. The Katie Beckett pathway requires the child to meet both SSI medical disability criteria and an institutional level of care, while the FOA pathway only requires SSI medical disability criteria. Table 1 below outlines key differences in eligibility criteria between these two pathways.
| Table 1: Eligibility Criteria in Key Optional Coverage Pathways for Children with Disabilities | ||
| Katie Beckett | Family Opportunity Act | |
| What are the income requirements? | Only considers child’s income (up to 300% SSI) | Considers household income (up to 300% FPL) |
| What are the asset requirements? | Only considers child’s assets | Does not consider assets |
| What are the functional eligibility criteria? | Child must meet both SSI medical disability criteria and an institutional level of care | Only requires SSI medical disability criteria |
Three FOA states (CO, IA, and LA) extend coverage to the federal maximum of 300% FPL. North Dakota and Texas cover children up to 200% FPL and 150% FPL, respectively. Massachusetts’ FOA-like waiver does not have an enrollment cap or an income limit.33
Nearly all (5 of 6) states with the FOA option or a comparable waiver choose to charge premiums. Under the FOA option, states are permitted to charge premiums equal to no more than 5% of the family’s monthly gross countable income ($260 per month for a family of three with income at 300% FPL34 ). Iowa is the only FOA state that does not charge premiums. Colorado charges premiums of $70 per month beginning at 134% FPL, Texas charges $90 per month beginning at 151% FPL, North Dakota charges 5% of gross family income beginning at 200% FPL, and Louisiana charges $15 per month beginning at 201% FPL. Under Massachusetts’ FOA-like waiver, sliding scale premiums apply to children in families with income over 150% FPL, beginning at $12 per month.35
Working People with disabilities
Nearly 90% of states (45 of 51) expand Medicaid to working individuals with disabilities whose income and /or assets exceed the limits for other eligibility pathways (Figure 6 and Appendix Table 4).36 This option enables people with disabilities to retain access to the medical and LTSS they need as their income increases. Medicaid often is especially important to working people with disabilities because private insurance typically does not cover all of the services and supports they need to live independently and to work.37
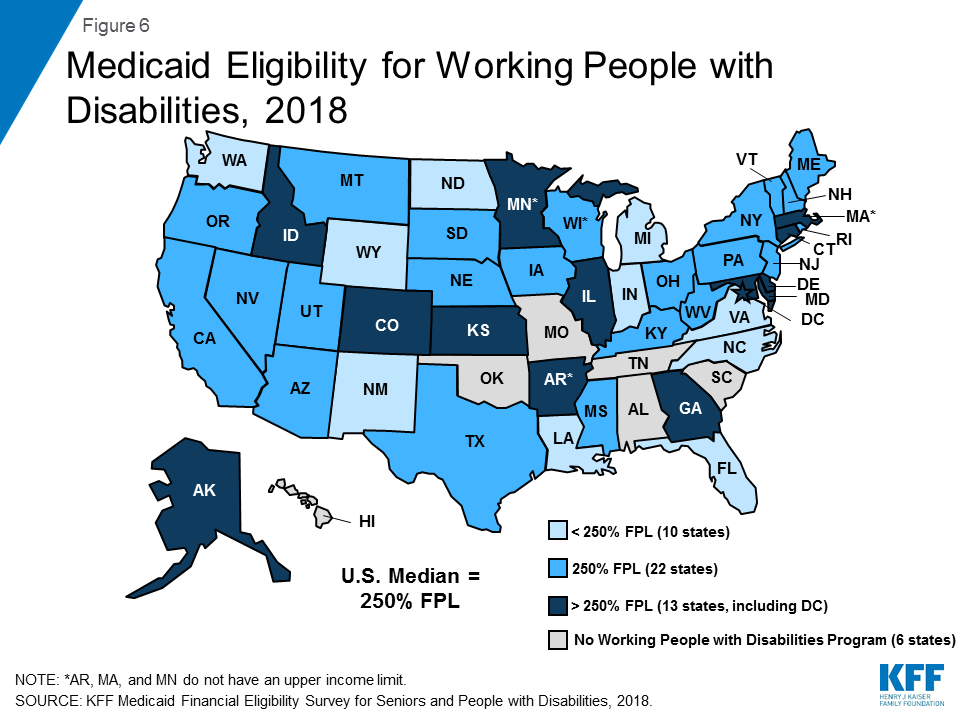
The median working people with disabilities income limit was $2,530 per month, or 250% FPL for an individual38 in 2018 (Figure 6 and Appendix Table 4). Three states (AR, MA, and MN) do not have an income limit for this pathway. Virginia requires individuals to have income at or below 80% FPL ($809/month for an individual in 2018)39 to become eligible in this pathway, but once enrolled, individuals can have earnings up to $75,000 per year ($6,250 per month) as long as they are deposited into a qualifying account.
A minority of states (8 of 45) do not have an asset limit for the working people with disabilities pathway (Appendix Table 4). These states include Arizona, Arkansas, Colorado, Delaware, DC, Massachusetts, Washington, and Wyoming. Among states that do have an asset limit for this pathway, the median was $10,000 for an individual and $15,000 for a couple, substantially higher than the SSI limits of $2,000 and $3,000, respectively. Increasing or eliminating these asset limits recognizes that enrollees are likely to incur expenses, such as those related to work or community living, and enables them to accrue some savings to meet future expenses.
Three-quarters of states (34 of 4540 ) charge premiums in the working people with disabilities pathway (Appendix Table 4). Premium amounts in most states are on a sliding scale based on income. Some states charge a flat dollar amount, while others charge a certain percentage of income. The 10 states that do not charge premiums include DC, Florida, Kentucky, Louisiana, Michigan, New Mexico, New York, South Dakota, Vermont, and Virginia.
Section 1915 (i) for People AT Risk of institutional Care
Ohio has joined Indiana as the only states using Section 1915 (i) as an independent Medicaid eligibility pathway since this option became available under the ACA (Appendix Table 1). The ACA amended Section 1915 (i) to allow states to provide full Medicaid benefits to people who are not otherwise eligible and who meet financial and functional eligibility criteria.41 States can cover (1) people up to 150% FPL with no asset limit who meet functional eligibility criteria; and/or (2) people up to 300% SSI who would be eligible for Medicaid under an existing HCBS waiver. States can target Section 1915 (i) services to a particular population. Indiana uses Section 1915 (i) to provide Medicaid eligibility to adults with mental health conditions up to 150% FPL.42 Ohio uses Section 1915 (i) to provide Medicaid eligibility to adults with certain mental health or physical health disabilities.43 Section 1915 (i) functional eligibility requires people to have needs that are less than what is required to qualify for an institutional level of care, which enables states to offer HCBS as preventive services in efforts to delay or foreclose the need for costlier future care or institutionalization. Unlike waivers, states are not permitted to cap enrollment or maintain a waiting list for Section 1915 (i) HCBS. However, states can manage enrollment under Section 1915 (i) by restricting functional eligibility criteria if the state will exceed the number of beneficiaries that it anticipated serving. Fourteen other states use Section 1915 (i) to authorize HCBS44 but require beneficiaries to be otherwise eligible for Medicaid through another coverage pathway.
State Adoption of Optional Eligibility Pathways Based on Old Age or Disability and the ACA Medicaid Expansion
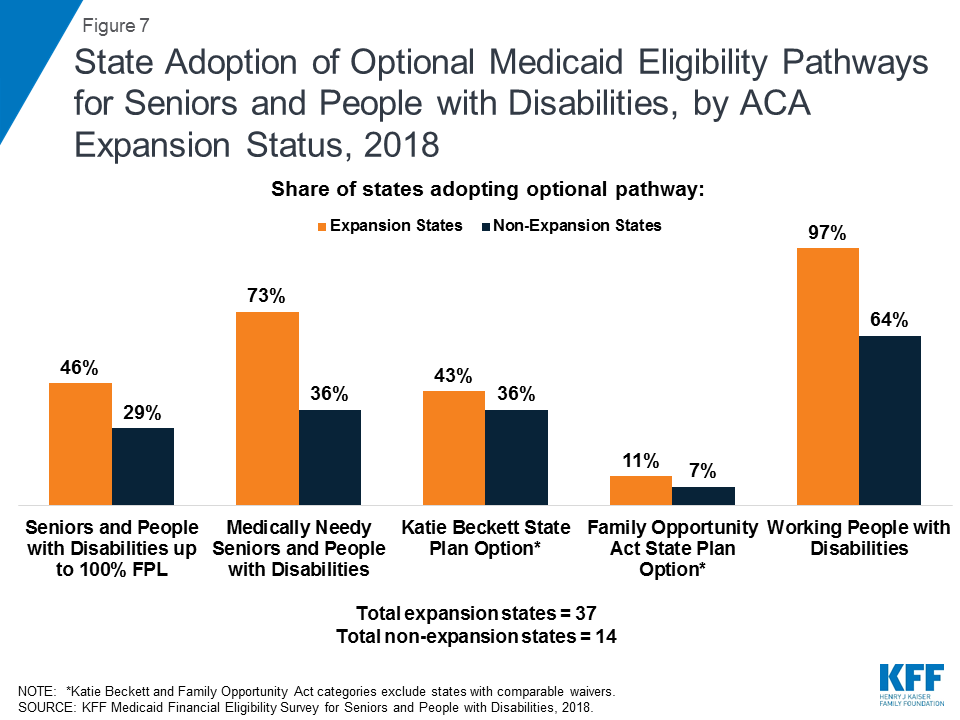
Greater shares of states that have adopted the ACA Medicaid expansion also have adopted key optional eligibility pathways based on old age or disability, compared to non-expansion states (Figure 7 and Table 2 below). To date, 37 states (including DC) have adopted the ACA Medicaid expansion, and 14 have not.45 Just under half of expansion states46 elect the option to cover seniors and people with disabilities up to 100% FPL, compared to less than one-third of non-expansion states.47 Nearly three-quarters of expansion states48 also offer the optional medically needy pathway for seniors and people with disabilities, while just over one-third of non-expansion states49 do so. Over two in five expansion states50 elect the Katie Beckett state plan option for children with significant disabilities,51 compared to just over one-third of non-expansion states.52 Nearly all expansion states53 also elect the option to cover working people with disabilities, compared to less than two-thirds of non-expansion states.54 The two states opting to use Section 1915 (i) as an independent eligibility pathway are both expansion states. All states adopt at least one of these optional age and disability-related state plan options, with the exception of Alabama. (Alabama does cover Katie Beckett children through a waiver; waiver coverage is excluded from this analysis as, unlike state plan coverage groups, waiver enrollment can be capped.)
| Table 2: Adoption of Optional Medicaid Eligibility Pathways for Seniors and People with Disabilities, by ACA Expansion Status, 2018 | ||||
| Optional Eligibility Pathway | Expansion States (37 states) | Non-Expansion States (14 states) | ||
| Number Adopting | Share of Expansion States | Number Adopting | Share ofNon-Expansion States | |
| Seniors and People with Disabilities up to 100% FPL | 17 | 46% | 4 | 29% |
| Medically Needy Seniors and People with Disabilities1 | 27 | 73% | 5 | 36% |
| Katie Beckett State Plan Option2 | 16 | 43% | 5 | 36% |
| Family Opportunity Act State Plan Option2 | 4 | 11% | 1 | 7% |
| Working People with Disabilities | 36 | 97% | 9 | 64% |
| Section 1915 (i) HCBS as an Independent Eligibility Pathway | 2 | 5% | 0 | 0% |
| NOTES: 1Excludes 2 non-expansion states (TN and TX) which limit the medically needy pathway to pregnant women and children and does not include seniors and people with disabilities. 2Katie Beckett and Family Opportunity Act categories exclude states with comparable waivers. SOURCE: KFF Medicaid Financial Eligibility Survey for Seniors and People with Disabilities, 2018. | ||||
State Options to Expand Medicaid LTSS Financial Eligibility
All states elect at least some options to expand financial eligibility for people who need Medicaid LTSS. Medicaid LTSS includes nursing home and other institutional services as well as home and community-based services (HCBS). Medicaid remains the primary payer for LTSS, as Medicare does not cover long-term care, private insurance coverage is limited, and out-of-pocket costs often are unaffordable.55 Medicaid also is an important source of federal funds to support states in meeting their community integration obligations under the Americans with Disabilities Act and the Olmstead decision.56 State policy choices about key financial eligibility rules for Medicaid LTSS are described below.
Special Income Rule
Nearly 85 percent of states (43 of 51) allow people with functional needs that require an institutional level of care to qualify for Medicaid institutional and/or home and community-based LTSS with income up to 300% SSI ($2,250 per month for an individual in 201857 ) under the “special income rule” (Appendix Table 5).58 Forty-one of these states use the federal maximum of 300% SSI. Delaware’s limit is 250% FPL, and the income limit in Missouri varies by program. States also apply an asset limit under the special income rule, usually the SSI amount of $2,000 for an individual and $3,000 for a couple.
Nearly all of the states using the special income rule apply it to both people in institutions, such as nursing homes, and people receiving services in the community59 (Figure 8 and Appendix Table 5). Minnesota applies the special income rule to institutional services and to seniors living in the community but not to other groups seeking HCBS. Missouri’s rules vary by program. By contrast, Massachusetts applies the special income rule only to HCBS and not to institutional care. Aligning financial eligibility rules across long-term care settings is important to eliminating programmatic bias toward institutional care. If people can qualify for institutional services at higher incomes than required to qualify for community-based services, they may choose to enter a nursing facility when they need care instead of going without necessary care while spending down to the lower HCBS income limit.
Qualified Income or “Miller” Trusts
About half (25 of 51) of states allow an individual residing in an institution to qualify for Medicaid LTSS with income higher than 300% of SSI if their excess income is administered through a special type of trust, called a qualified income or Miller trust60 (Figure 8 and Appendix Table 6).61 Eighteen of these states do not cap the amount that can be put into a Miller trust when establishing eligibility for institutional LTSS. Income from a Miller trust can be used to fund the Medicaid beneficiary’s personal needs allowance as well as a monthly allowance for the beneficiary’s spouse who remains in the community under the spousal impoverishment rules (both discussed below). Any additional income from the trust goes toward the beneficiary’s cost of care, and states can recover funds remaining in the trust after the individual’s death to reimburse the cost of care.
Nearly all states allowing Miller Trusts for institutional care (22 of 25) also allow individuals to use Miller trusts to qualify for Medicaid HCBS (Figure 8 and Appendix Table 6). The three states that offer Miller trusts for institutional care but not for HCBS are Alabama, Nevada, and Wyoming. Fourteen of the 22 states that offer Miller trusts for HCBS do not cap the amount that can be put into the trust. Among the states that do cap Miller trust amounts for HCBS, four states (AZ, KY, OK, and SD) set the same dollar amount cap for HCBS as for institutional care.62 The remaining state (IA) sets a cap of 125% of the average nursing facility cost for individuals receiving HCBS but does not cap the trust amount for individuals in institutions. As noted above, using the same financial eligibility rules for institutional care and HCBS helps alleviate bias toward intuitional care.
Supplemental Needs and Pooled Income Trusts
Nearly all states (48 of 51) allow individuals to qualify for Medicaid LTSS using supplemental needs63 and pooled income64 trusts (Appendix Table 6). The three states that do not report recognizing these types of trusts are Alabama, Hawaii, and Illinois. Both of these types of trusts contain assets for the benefit of non-elderly people with disabilities that are excluded from Medicaid financial eligibility determinations. The trust beneficiary must have a disability based on SSI criteria. Both types of trusts can be established by the individual’s parent, grandparent, legal guardian or a court and must provide that the state can receive any amount remaining in the trust upon the beneficiary’s death to cover the cost of Medicaid services provided. Pooled income trusts are established and managed by a non-profit association, with a separate account for each beneficiary, but assets are combined for purposes of fund investment and management. This option can enable individuals with relatively small trust amounts to benefit from economies of scale by being part of a larger pool of funds for investment and management purposes. Twenty-two states do not cap the amount that can be placed in a supplemental needs trust,65 and 20 states do not cap the amount that can be placed in a pooled income trust. The two states that apply caps to pooled income trusts but not supplemental needs trusts are Illinois and Tennessee.
ABLE Accounts for Disability-Related Expenses
All states have authorized Achieving a Better Life Experience (ABLE) accounts, which allow people with disabilities and their families to save money to fund disability-related expenses that is disregarded when determining Medicaid eligibility (Appendix Table 6).66 Federal legislation in 2014 enabled states to establish ABLE programs for people with significant disabilities with onset before age 26.67 Annual account contributions are generally limited to the federal gift tax exclusion amount ($15,000 per year in 2018). In addition, ABLE account beneficiaries who work can contributed earned income in an amount equal to 100% FPL for a household of one ($12,140 per year in 2018)68 if they do not receive employer contributions to a workplace retirement savings account.69 These accounts seek to equalize the treatment of savings for future expenses for people with disabilities, similar to 529 plans for higher education expenses.
The median ABLE account maximum lifetime limit is $400,000, and ranges from $235,000 in Mississippi, to $511,758 in Pennsylvania (Appendix Table 6).70 ABLE account contributions and investment earnings can be used for disability-related expenses, such as education, housing, transportation, employment training and support, assistive technology, personal support services, health, financial management, legal fees, and other expenses approved by the Treasury Secretary. In the preamble to the proposed implementing regulations, the IRS noted that qualified ABLE account expenses “should be broadly construed to permit the inclusion of basic living expenses and should not be limited to expenses for items for which there is a medical necessity. . . .”71
Home Equity Limits
Over three-quarters of states (40 of 51) limit home equity to the federal minimum of $552,000 for Medicaid beneficiaries seeking eligibility for LTSS, while nine states allow the upper limit of $858,000 (Appendix Table 6).72 Wisconsin limits home equity to $750,000, and California has no limit on home equity for the individual’s principal residence.
Personal/Maintenance Needs Allowance
The median personal needs allowance for an individual residing in an institution is $50 per month (Appendix Table 7). Three states (AL, NC, and SC) set their personal needs allowance at the federal minimum of $30 per month. The state with the highest personal needs allowance in the continental U.S. is Florida ($130 per month). Alaska is an outlier with a personal needs allowance of $1,396 per month. Once eligible for Medicaid, individuals in institutions generally must contribute most of their monthly income to the cost of their care, with the exception of a small allowance used to pay for personal needs that are not covered by Medicaid, such as clothing.73
The median maintenance needs allowance for a Medicaid beneficiary residing in the community is $1,840 per month.74 These amounts ranged from a low of $100 per month in Montana to a high of $2,250 per month (300% of SSI) in 20 states (Appendix Table 7). Four states (IL,75 MO, NM, and NC) do not report a maintenance needs allowance of any amount for Medicaid HCBS beneficiaries. Six states (HI, ID, MD, NH, NJ, and OR) report that maintenance needs allowances vary by waiver program and/or living arrangement. Certain Medicaid beneficiaries receiving HCBS76 must contribute a portion of their income to their cost of care, although states generally allow them to retain a monthly maintenance needs allowance that exceeds the institutional personal needs allowance described above, recognizing that individuals living in the community must pay for room and board. There is no federal minimum HCBS maintenance needs allowance; instead, states may use any amount as long as it is based on a “reasonable assessment of need” and subject to a maximum that applies to all enrollees under the HCBS waiver.77 The maintenance needs allowances established by states play a critical role in determining whether individuals can afford to remain in the community and avoid or forestall institutional placement.
Spousal Impoverishment Rules
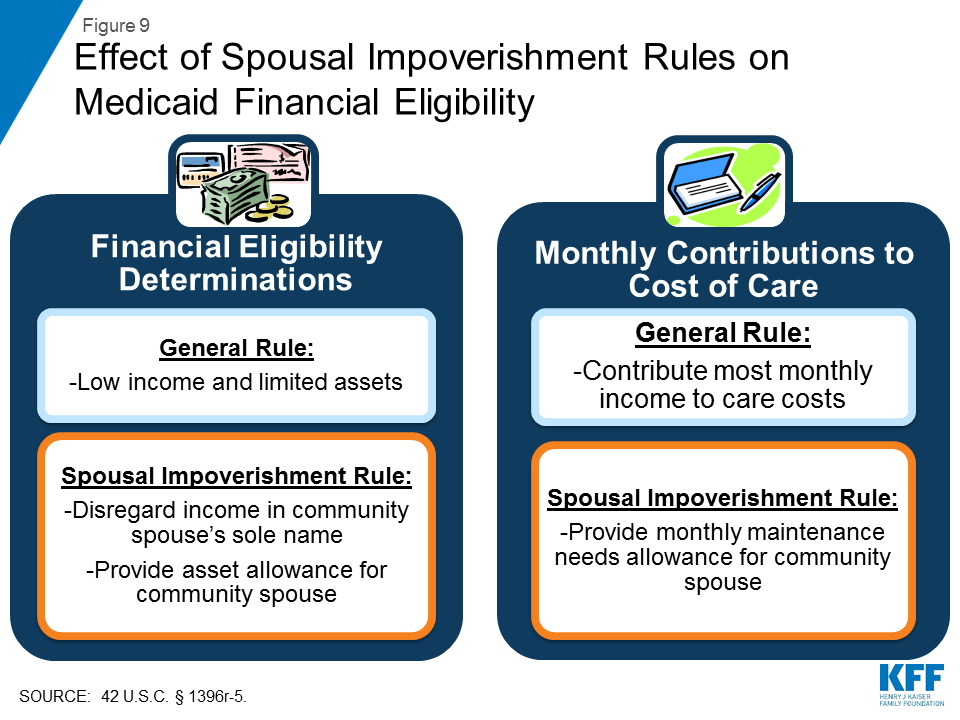
When a married Medicaid beneficiary is receiving nursing facility or other institutional LTSS, 14 states allow the spouse remaining in the community to retain $2,05878 in income per month (the federal minimum, 150% FPL for a household of two), and 19 states permit $3,09079 per month (the federal maximum) (Appendix Table 7). The remaining 18 states establish a level between the federal minimum and maximum. This protected income is called the spouse’s “monthly maintenance needs allowance” and is a feature of the spousal impoverishment rules (Figure 9). Congress created the spousal impoverishment rules in 1988 to protect a portion of a married couple’s income and assets and ensure that the “community spouse” is able to meet their living expenses when the other spouse seeks Medicaid LTSS. The spousal impoverishment rules supersede rules that would otherwise require Medicaid financial eligibility determinations to account for a spouse’s financial responsibility for a Medicaid applicant or beneficiary by contributing to their cost of care.80
Eighteen states allow the community spouse to retain $123,60081 in assets (the federal maximum) when the other spouse is receiving Medicaid-funded nursing facility or other institutional LTSS (Appendix Table 7). Two states (KY and UT) elect the federal minimum ($24,720).82 This is known as the “community spouse resource allocation.” Most states apply a formula that allows the community spouse to retain an amount of protected assets that is the greater of either the federal minimum ($24,720) or one-half of the couple’s total combined resources but not to exceed the federal maximum ($123,600).
As of 2018, 50 states were applying the spousal impoverishment rules to HCBS waivers as required by ACA Section 2404 (Figure 8 and Appendix Table 7).83 The remaining state (IL) applied the rules to some but not all HCBS waivers.84 States must apply the spousal impoverishment rules to institutional care, but prior to the ACA, states had the option to apply the spousal impoverishment rules when a married individual sought home and-community based waiver services.85 Beginning on January 1, 2014, ACA Section 2404 required states to apply the spousal impoverishment rules to HCBS waivers.86 At the time of our survey, Section 2404 was set to expire at the end of 2018, but Congress subsequently extended it through March 2019,87 and again through September 201988 (Figure 10).

If ACA Section 2404 expires, 46 states reported plans as of the end of 2018 to continue to apply the spousal impoverishment rules to all of their HCBS waivers as of the end of 2018; five states reported plans to scale back or discontinue application of the rules to HCBS, and others could follow (Figure 8 and Appendix Table 7).89 Arkansas and Illinois plan to scale back by applying the rules to some but not all HCBS waivers if Section 2404 is not reauthorized. Arkansas will apply the rules to two of its four waivers.90 Illinois plans to scale back application of the rules if Section 2404 is not extended by applying the rules in full to one of nine HCBS waivers and in part (for financial eligibility but not post-eligibility treatment of income) to two waivers.91 Minnesota plans to apply the rules to one of five HCBS waivers.92 Maine93 and New Hampshire do not plan to apply the rules to any HCBS waivers if Congress does not reauthorize ACA Section 2404.
Medicare Savings Programs for Dual Eligible Beneficiaries94
States must offer Medicare Savings Programs (MSPs) through which low-income Medicare beneficiaries receive Medicaid assistance with some or all of their Medicare out-of-pocket costs.95 Medicare beneficiaries include seniors as well as nonelderly people with disabilities receiving Social Security Disability Insurance, generally after a 24-month waiting period. Medicare’s out-of-pocket costs, including premiums, deductibles, and other cost-sharing, can be high. For example, Medicare Part A, which covers inpatient hospital services, has an annual deductible of $1,340 in 2018.96 Medicare Part B, which covers outpatient services, requires a monthly premium of $134 for most beneficiaries in 2018.97 Part B also requires an annual deductible of $183 in 201898 and co-insurance of 20% of the Medicare-approved cost of services after the deductible is met.99 Box 4 describes the MSP pathways.
Box 4: MSP Pathways
To help low-income enrollees afford Medicare’s out-of-pocket costs, state Medicaid programs must offer three MSPs:
Qualified Medicare Beneficiaries (QMBs) generally have incomes up to 100% FPL ($1,012 per month for an individual and $1,372 for a couple in 2018).100 Medicaid pays Medicare Parts A and B premiums and cost-sharing for QMBs.
Specified Low-Income Medicare Beneficiaries (SLMBs) have slightly higher incomes (100-120% FPL) and receive help with Medicare Part B premiums only.101 Most states set their SLMB income limits at 120% FPL ($1,214 per month for an individual and $1,646 for a couple in 2018).102
Qualified Individuals (QIs) are eligible for Medicaid assistance with Medicare Part B premiums through an expansion of the SLMB program passed by Congress in 1997. The QI program covers Medicare beneficiaries with incomes up to 135% FPL ($1,366 per month for an individual and $1,852 for a couple in 2018).103 However, unlike other Medicaid pathways, because Congress only appropriates a limited amount of funds to each state to pay for the QI program, once a state’s QI appropriation is spent, additional individuals who meet the eligibility criteria cannot receive help.
Four states set their MSP income limits higher than the federal minimum (Appendix Table 8). These states include Connecticut, DC,104 Indiana, and Maine, with Indiana joining this group since the time of our last survey in 2015. Three states (ME, MS, IL) apply income disregards higher than the $20 SSI general disregard.
Nine states have no MSP asset limits (Appendix Table 8). These states include Alabama, Arizona, Connecticut, Delaware, DC, Mississippi, New York, Oregon, and Vermont, with Oregon joining this group in 2016. Most states have MSP asset limits within the federal guideline amounts of $7,560 for an individual and $11,340 for a couple. A few states have slightly higher limits ($9,060 for an individual and $14,340 for a couple in CO and NM, and $10,000 for an individual and $18,000 for a couple in MN). Maine’s MSP asset limit is substantially higher at $58,000 for an individual and $87,000 for a couple.
State Option to Adopt Streamlined Renewal Procedures for Pathways Based on Old Age or Disability
Nearly all states (47 of 51) have adopted at least one of the ACA’s streamlined processes for Medicaid beneficiaries renewing coverage through an age or disability-related pathway, and over 60% (31 of 51) have adopted both options (Figure 11 and Appendix Table 9). Aside from the Medicaid expansion, the ACA introduced other reforms that simplify and modernize Medicaid eligibility and enrollment processes. All states must adopt these reforms for poverty-related coverage pathways, and states can choose whether to apply them to age and disability-related pathways.105 Streamlined renewal polices can facilitate continuous coverage among eligible individuals, which helps prevent gaps in care and protects individuals from out-of-pocket costs that might be incurred if they experience a break in coverage. We surveyed states about whether they opt to send pre-populated eligibility renewal forms and whether they offer reconsideration periods for eligibility renewals in pathways related to old age or disability. The states that have not adopted either of these options are Alaska, New Hampshire, and Oregon.106
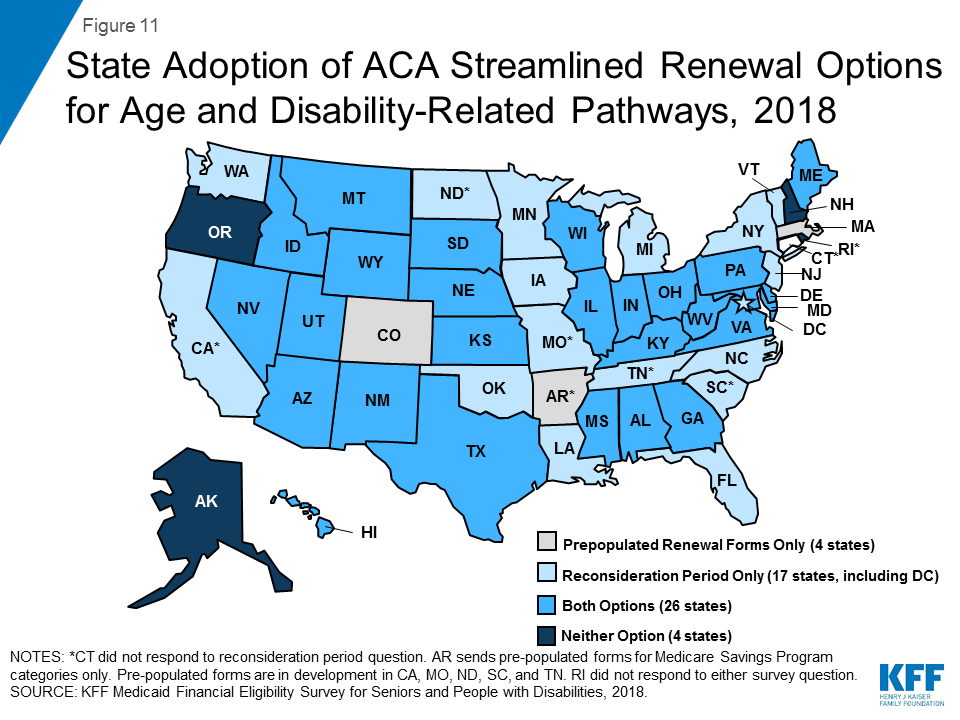
About 70 percent of states (30 of 51) are using prepopulated forms to facilitate eligibility renewals in age and disability-related pathways (Figure 11 and Appendix Table 9).107 Five of these states (CT, ME, NM, OH, and VA) newly report that they have adopted this option since our last survey in 2015. Another five states (CA, MO, ND, SC, and TN) report that they are planning to implement this reform (Appendix Table 9). Three of the states that are not sending prepopulated forms for age and disability pathway eligibility renewals also are not doing so for poverty-related pathways (FL, LA, and OK).108 Sending prepopulated forms can simplify the eligibility renewal process for beneficiaries and help retain eligible people in coverage, which in turn strengthens continuity of care.
Almost 85 percent of states (43 of 51) offer a reconsideration period, allowing those in age and disability-related pathways to renew coverage without a new application within a certain period of time after termination (Figure 11 and Appendix Table 9).109 Nine of these states (DC, HI, LA, MO, MT, NM, NC, OK, and WV) newly report that they have adopted this option since our last survey in 2015. The ACA’s streamlining reforms for poverty-related pathways call for the reconsideration period to be 90 days from the date of Medicaid termination. Our survey did not ask states for the length of the reconsideration period for age and disability-related pathways, but nine states (IN, IA, NV, NJ, OH, SC, UT, VT, and WY) volunteered that they use 90 days, consistent with the period for poverty-related pathways. DC’s reconsideration period is 30 days, and Maryland uses 120 days. If a person whose coverage has been terminated for lack of response to an eligibility renewal form subsequently does return the form within the reconsideration time period, coverage can be renewed without requiring a new application.110
Looking Ahead
Medicaid remains an essential – and often the sole – source of medical and LTSS coverage for many seniors and nonelderly adults and children with disabilities. Aside from the core group of SSI beneficiaries, pathways to full Medicaid eligibility based on old age or disability are provided at state option. Consequently, there is substantial variation among states regarding which optional pathways are available and the associated financial eligibility limits.
While adoption of the major optional age and disability-related Medicaid eligibility pathways varies substantially across states, state choices about these pathways have remained stable since the time of our last survey in 2015. All states except Alabama elect at least one state plan optional pathway to full Medicaid eligibility based on old age or disability. (Alabama does offer a waiver to cover some Katie Beckett-like children.) Since the time of our last survey, Ohio and Oklahoma have stopped electing the Section 209 (b) option and instead follow federal rules for SSI beneficiaries, and no states have added or discontinued the optional pathway to cover seniors and people with disabilities up to 100% FPL. State choices about pathways to cover children with significant disabilities have remained stable overall, with Tennessee, the sole state without any Katie Beckett coverage, recently enacting legislation to establish a waiver pathway for these children; Louisiana recently passing legislation to adopt the Katie Beckett state plan option in addition to its current waiver coverage; and no states newly adopting or discontinuing the FOA pathway. Florida has joined 44 other states that cover working people with disabilities, and Ohio has adopted Section 1915 (i) as an independent coverage pathway.
The income limits associated with age and disability-related pathways vary across states but generally remain low. The median income limit was 74% FPL for individuals eligible based on old age or disability, 48% FPL for individuals eligible as medically needy, and 250% FPL for working people with disabilities. Medicaid eligibility in these pathways could be affected by a change to the inflation measure that is used to determine the annual federal poverty line, which the federal government is considering.111 Using a lower inflation measure would result in smaller increases in the poverty line each year compared to the current measure, which would slow the annual increase in Medicaid income limits based on the FPL over time, with fewer people eligible for Medicaid as a result.
A notable minority of states have opted to eliminate asset tests in certain age and disability-related pathways. To date, Arizona remains the only state without an asset test for the seniors and people with disabilities option to 100% FPL, eight states do not have asset tests for their working people with disabilities buy-in, and nine states do not have asset tests for MSP pathways. No states that have eliminated asset tests have sought to reinstate them since the time of our last survey in 2015. Eliminating asset tests aligns these age and disability-related pathways with newer disability-related pathways (FOA and Section 1915 (i)) that do not have asset tests and with poverty-related pathways, in which asset tests were eliminated by the ACA.
State choices about optional age and disability-related pathways have remained relatively stable, even as states have adopted the ACA Medicaid expansion, with greater shares of expansion states also adopting key age and disability-related pathways compared to non-expansion states. At the time of our last survey in 2015, key open questions were whether and how the availability of the ACA Medicaid expansion pathway might affect state choices about optional age and disability-related pathways. To date, ACA Medicaid expansion states generally have not sought to decrease or eliminate eligibility in age and disability-related pathways. On the other hand, a few ACA expansion states have taken steps to expand eligibility in age and disability-related pathways. As noted above, Louisiana recently passed legislation to adopt the Katie Beckett state plan option, in addition to its Katie Beckett-like waiver program and Ohio adopted the Section 1915 (i) eligibility pathway. Indiana has increased its MSP income limits, and Oregon eliminated its MSP asset test. States that have not adopted the ACA Medicaid expansion also generally have not sought to increase eligibility in age and disability-related pathways. As noted above, the exceptions are Florida, which newly reports covering the working people with disabilities pathway since 2015, and Tennessee, which recently passed legislation authorizing a capped Katie Beckett-like waiver program.
All states elect at least some options to expand financial eligibility for Medicaid LTSS. Medicaid remains the primary payer for LTSS and an important source of federal funds to support states in meeting their community integration obligations under the Americans with Disabilities Act and the Olmstead decision. State flexibility in setting LTSS financial eligibility rules can be used to counter the historical program bias in favor of institutional care over HCBS. While most states that expand financial eligibility for Medicaid nursing home and other institutional care also apply those same rules to HCBS, there are a few states in which HCBS financial eligibility rules are more restrictive and could be aligned with those for institutional care to eliminate bias in favor of institutional care. Relatedly, if Congress does not re-authorize ACA Section 2404, which is currently set to expire on September 30, 2019, the spousal impoverishment rules will revert to a state option for HCBS while remaining in place for institutional care. Allowing Section 2404 to expire could slow or begin to reverse states’ progress in expanding access to HCBS, while extending Section 2404 would provide stability for states and enrollees receiving HCBS. If ACA Section 2404 expires, five states reported plans as of the end of 2018 to scale back or discontinue application of the rules to HCBS, and others could follow.
All state Medicaid programs include MSPs in which Medicaid covers some or all out-of-pocket costs for low-income Medicare beneficiaries. Few states expand MSP financial eligibility beyond the federal minimum limits, although nine states have opted to eliminate MSP asset tests.
An increasing number of states are opting to apply the ACA’s streamlined eligibility renewal provisions to age and disability-related pathways, which can help retain eligible people in coverage and strengthen continuity of care. Thirty states now use prepopulated forms to facilitate eligibility renewals, with five states newly electing this option since the time of our last survey in 2015, and another five states reporting plans to implement this option. Forty-three states offer reconsideration periods, with nine of these states newly adopting this option since our last survey.
Looking ahead, state and federal policy choices that affect Medicaid eligibility for seniors and people with disabilities will remain important areas to watch. Policy changes in the years ahead will influence the extent to which seniors and people with disabilities can gain and maintain Medicaid eligibility and access to needed preventive, physical, behavioral health, and long-term services and supports.
Appendix Tables
Appendix Table 1: State Adoption of Key Optional Pathways to Full Medicaid Eligibility Based on Old Age or Disability, 2018
Appendix Table 2: Medicaid Eligibility for SSI Beneficiaries and Optional Pathway for Seniors and People with Disabilities Up to 100% FPL, 2018
Appendix Table 3: Medicaid Eligibility Through the Medically Needy Pathway, 2018
Appendix Table 4: Medicaid Eligibility for Working People with Disabilities, 2018
Appendix Table 5: Medicaid Special Income Rule for Long-Term Services and Supports Eligibility, 2018
Appendix Table 6: Medicaid Long-Term Services and Supports Trusts and Home Equity Limits, 2018
Appendix Table 7: Medicaid Long-Term Services and Supports Post-Eligibility Treatment of Income and Spousal Impoverishment Standards, 2018
Appendix Table 8: Eligibility for Medicaid’s Medicare Savings Programs, 2018
Appendix Table 9: State Adoption of Selected ACA Streamlined Medicaid Eligibility Renewal Provisions, 2018
| Appendix Table 1: State Adoption of Key Optional Pathways to Full Medicaid Eligibility Based on Old Age or Disability, 2018 | ||||||
| State | Seniors and People with Disabilities up to 100% FPL | Medically Needy | Katie Beckett Children with Significant Disabilities Living at Home4 | Family Opportunity Act Buy-in for Children with Significant Disabilities | Buy-in for Working People with Disabilities | Section 1915 (i) HCBS as an Independent Eligibility Pathway7 |
| TOTAL | 21 | 34 | 50 | 6 | 45 | 2 |
| Alabama | ✓, waiver | |||||
| Alaska | ✓, SPA | ✓ | ||||
| Arizona | ✓ | ✓, waiver | ✓ | |||
| Arkansas | ✓1, 2 | ✓ | ✓, waiver | ✓ | ||
| California | ✓ | ✓ | ✓, waiver | ✓ | ||
| Colorado | ✓, both | ✓ | ✓ | |||
| Connecticut | ✓ | ✓, waiver | ✓ | |||
| Delaware | ✓, SPA | ✓ | ||||
| DC | ✓ | ✓ | ✓, SPA | ✓ | ||
| Florida | ✓1 | ✓ | ✓, waiver | ✓ | ||
| Georgia | ✓ | ✓, SPA | ✓ | |||
| Hawaii | ✓ | ✓ | ✓, waiver | |||
| Idaho | ✓, SPA | ✓ | ||||
| Illinois | ✓ | ✓ | ✓, waiver | ✓ | ||
| Indiana | ✓ | ✓, waiver | ✓ | ✓ | ||
| Iowa | ✓ | ✓, SPA | ✓ | ✓ | ||
| Kansas | ✓ | ✓, waiver | ✓ | |||
| Kentucky | ✓ | ✓, waiver | ✓ | |||
| Louisiana | ✓ | ✓, waiver | ✓ | ✓ | ||
| Maine | ✓ | ✓ | ✓, SPA | ✓ | ||
| Maryland | ✓ | ✓, waiver | ✓ | |||
| Massachusetts | ✓ | ✓ | ✓, SPA | ✓6 | ✓ | |
| Michigan | ✓ | ✓ | ✓, waiver | ✓ | ||
| Minnesota | ✓ | ✓ | ✓, SPA | ✓ | ||
| Mississippi | ✓, SPA | ✓ | ||||
| Missouri | ✓, waiver | |||||
| Montana | ✓ | ✓, waiver | ✓ | |||
| Nebraska | ✓ | ✓ | ✓, both | ✓ | ||
| Nevada | ✓, SPA | ✓ | ||||
| New Hampshire | ✓ | ✓, SPA | ✓ | |||
| New Jersey | ✓ | ✓ | ✓, waiver | ✓ | ||
| New Mexico | ✓, waiver | ✓ | ||||
| New York | ✓ | ✓, both | ✓ | |||
| North Carolina | ✓ | ✓ | ✓, waiver | ✓ | ||
| North Dakota | ✓ | ✓, waiver | ✓ | ✓ | ||
| Ohio | ✓, waiver | ✓ | ✓ | |||
| Oklahoma | ✓ | ✓, SPA | ||||
| Oregon | ✓, waiver | ✓ | ||||
| Pennsylvania | ✓ | ✓ | ✓, waiver | ✓ | ||
| Rhode Island | ✓ | ✓ | ✓, both | ✓ | ||
| South Carolina | ✓ | ✓, SPA | ||||
| South Dakota | ✓, SPA | ✓ | ||||
| Tennessee | ✓3 | 5 | ||||
| Texas | ✓3 | ✓, waiver | ✓ | ✓ | ||
| Utah | ✓ | ✓ | ✓, waiver | ✓ | ||
| Vermont | ✓ | ✓, SPA | ✓ | |||
| Virginia | ✓1 | ✓ | ✓, waiver | ✓ | ||
| Washington | ✓ | ✓, waiver | ✓ | |||
| West Virginia | ✓ | ✓, SPA | ✓ | |||
| Wisconsin | ✓ | ✓, waiver | ✓ | |||
| Wyoming | ✓, waiver | ✓ | ||||
| NOTES: Unless otherwise indicated, table excludes Medicaid eligibility pathways available through HCBS waivers. 1 AR, FL, and VA do not elect the maximum of 100% FPL. 2 AR extends coverage beyond SSI limits for seniors only. 3 In TN and TX, the medically needy pathway is limited to pregnant women and children and does not include seniors and people with disabilities. 4 States can cover Katie Beckett children through state plan amendments (SPAs) and/or comparable waivers. 5 TN provides waiver coverage to “medically eligible” children in households with incomes at or above 211% FPL, although enrollment in this pathway is currently closed except for rollovers for those losing coverage under traditional groups; recent legislation directs the state to establish a Katie Beckett-like waiver program. 6 Massachusetts has a Section 1115 waiver program comparable to the FOA option. 7 Other states use Section 1915 (i) to offer HCBS to people who are otherwise Medicaid eligible. | ||||||
| SOURCE: Kaiser Family Foundation, Medicaid Financial Eligibility Survey for Seniors and People with Disabilities, 2018. | ||||||
| Appendix Table 2: Medicaid Eligibility for SSI Beneficiaries and Optional Pathway for Seniors and People with Disabilities Up To 100% FPL, 2018 | ||||||
| State | Monthly Income Limit | Income Disregard | % FPL | Asset Limit | ||
| Individual | Couple | Individual | Couple | |||
| MEDIAN | $750 | $1,125 | $20 | 74% | $2,000.00 | $3,000.00 |
| Alabama | $750 | $1,125 | $20 | 74% | $2,000 | $3,000 |
| Alaska | $750 | $1,125 | $20 | 74% | $2,000 | $3,000 |
| Arizona | $1,012 | $1,372 | $20 | 100% | No limit | No limit |
| Arkansas | $804 | $1,083 | $20 | 80% | $7,560 | $11,340 |
| California | $1,012 | $1,372 | $230 individual/ $310 couple | 100% | $2,000 | $3,000 |
| Colorado | $750 | $1,125 | $20 | 74% | $2,000 | $3,000 |
| Connecticut1,2 | $523 | $696 | $339 | 63% | $1,600 | $2,400 |
| Delaware | $750 | $1,125 | $20 | 74% | $2,000 | $3,000 |
| DC | $1,012 | $1,372 | $20 individual/ $100 couple | 100% | $4,000 | $6,000 |
| Florida | $891 | $1,208 | $20 | 88% | $5,000 | $6,000 |
| Georgia | $750 | $1,125 | $20 | 74% | $2,000 | $3,000 |
| Hawaii1 | $1,164 | $1,578 | $20 | 100% Hawaii poverty line | $2,000 | $3,000 |
| Idaho | $803 | $1,145 | $20 | 80%3 | $2,000 | $3,000 |
| Illinois1 | $1,012 | $1,372 | $25 | 100% | $2,000 | $3,000 |
| Indiana | $1,012 | $1,372 | $20 | 100% | $2,000 | $3,000 |
| Iowa | $750 | $1,125 | $20 | 74% | $2,000 | $3,000 |
| Kansas | $750 | $1,125 | $20 | 74% | $2,000 | $3,000 |
| Kentucky | $750 | $1,125 | $20 | 74% | $2,000 | $3,000 |
| Louisiana | $750 | $1,125 | $20 | 74% | $2,000 | $3,000 |
| Maine | $1,012 | $1,372 | $75 | 100% | $2,000 | $3,000 |
| Maryland | $750 | $1,125 | $20 | 74% | $2,000 | $3,000 |
| Massachusetts | $1,012 | $1,372 | $20 | 100% | $2,000 | $3,000 |
| Michigan | $1,012 | $1,372 | $20 | 100% | $2,000 | $3,000 |
| Minnesota1 | $1,012 | $1,372 | $20 | 100% | $3,000 | $6,000 |
| Mississippi | $750 | $1,125 | $20 | 74% | $2,000 | $3,000 |
| Missouri1 | $880 | $1,186 | $20 | 87%3 | $3,000 | $6,000 |
| Montana | $750 | $1,125 | $20 | 74% | $2,000 | $3,000 |
| Nebraska | $1,012 | $1,372 | $20 | 100% | $4,000 | $6,000 |
| Nevada | $750 | $1,125 | $20 | 74% | $2,000 | $3,000 |
| New Hampshire1 | $750 | $1,125 | $13 individual/$20 couple | 74% | $1,500 | $1,500 |
| New Jersey | $1,012 | $1,372 | $20 | 100% | $4,000 | $6,000 |
| New Mexico | $750 | $1,125 | $20 | 74% | $2,000 | $3,000 |
| New York | $837 | $1,229 | $20 | 83%3 | $2,000 | $3,000 |
| North Carolina | $1,012 | $1,372 | $20 | 100% | $2,000 | $3,000 |
| North Dakota1 | $750 | $1,125 | $20 | 74% | $3,000 | $6,000 |
| Ohio | $750 | $1,125 | $20 | 74% | $2,000 | $3,000 |
| Oklahoma | $1,012 | $1,372 | $20 | 100% | $2,000 | $3,000 |
| Oregon | $750 | $1,125 | $20 | 74% | $2,000 | $3,000 |
| Pennsylvania | $1,012 | $1,372 | $20 | 100% | $2,000 | $3,000 |
| Rhode Island | $1,012 | $1,372 | $20 | 100% | $4,000 | $6,000 |
| South Carolina | $1,012 | $1,372 | $20 | 100% | $7,560 | $11,340 |
| South Dakota | $750 | $1,125 | $20 | 74% | $2,000 | $3,000 |
| Tennessee | $750 | $1,125 | $20 | 74% | $2,000 | $3,000 |
| Texas | $750 | $1,125 | $20 | 74% | $2,000 | $3,000 |
| Utah | $1,012 | $1,372 | $20 | 100% | $2,000 | $3,000 |
| Vermont | $750 | $1,125 | $20 | 74% | $2,000 | $3,000 |
| Virginia1 | $810 | $1,098 | $20 | 81% | $2,000 | $3,000 |
| Washington | $750 | $1,125 | $20 | 74% | $2,000 | $3,000 |
| West Virginia | $750 | $1,125 | $20 | 74% | $2,000 | $3,000 |
| Wisconsin | $834 | $1,257 | $20 | 83%3 | $2,000 | $3,000 |
| Wyoming | $750 | $1,125 | $20 | 74% | $2,000 | $3,000 |
| NOTES: States generally must provide Medicaid to SSI beneficiaries (equivalent to 74% FPL in 2018) and have the option to extend eligibility for seniors and people with disabilities up to 100% FPL. 1 Eight states elect the Section 209 (b) option, which allows states to use financial and functional eligibility criteria that differ from the federal SSI rules, as long as they are no more restrictive than the rules the state had in place in 1972. 2 Table includes data for regions B & C. Region A income limit is $633/single and $805/couple. All regions offer a boarding home disregard of $246.70 and a shared living disregard of $406.90. 3 In ID, MO, NY, and WI, the effective SSI income limit is higher than 74% FPL due to state supplemental payments and/or additional income disregards. | ||||||
| SOURCE: Kaiser Family Foundation, Medicaid Financial Eligibility Survey for Seniors and People with Disabilities, 2018. | ||||||
| Appendix Table 3: Medicaid Eligibility Through the Medically Needy Pathway, 2018 | ||||||||||||
| State | Medically Needy Populations Covered | Monthly Income Limit | % FPL4 | Asset Limit | Budget Period | Benefit Package Includes Nursing Facility Services | ||||||
| Pregnant Women | Children | Seniors | People with Disabilities | Low-Income Parents | Individual | Couple | Individual | Couple | ||||
| TOTAL/MEDIAN | 34 | 34 | 32 | 32 | 26 | $488 | $559 | 48% | $2,000 | $3,000 | N/A | 25 |
| Arkansas | ✓ | ✓ | ✓ | ✓ | ✓ | $108 | $217 | 11% | $2,000 | $3,000 | 3 months | No response |
| California | ✓ | ✓ | ✓ | ✓ | ✓ | $600 | $934 | 59% | $2,000 | $3,000 | 1 month | ✓ |
| Connecticut1,2 | ✓ | ✓ | ✓ | ✓ | $523 | $696 | 52% | $1,600 | $2,400 | 6 months | ✓ | |
| DC | ✓ | ✓ | ✓ | ✓ | ✓ | $652 | $652 | 64% | $4,000 | $6,000 | 1-6 months | ✓ |
| Florida | ✓ | ✓ | ✓ | ✓ | ✓ | $180 | $241 | 18% | $5,000 | $6,000 | 1 month | |
| Georgia | ✓ | ✓ | ✓ | ✓ | ✓ | $317 | $375 | 32% | $2,000 | $4,000 | 1 month | |
| Hawaii | ✓ | ✓ | ✓ | ✓ | $469 | $632 | 40% | $2,000 | $3,000 | 1 month | ✓ | |
| Illinois | ✓ | ✓ | ✓ | ✓ | ✓ | $1,012 | $1,372 | 100% | $2,000 | $3,000 | 1 month | ✓ |
| Iowa | ✓ | ✓ | ✓ | ✓ | ✓ | $483 | $483 | 48% | $10,000 | $10,000 | 2 months | ✓ |
| Kansas | ✓ | ✓ | ✓ | ✓ | ✓ | $475 | $475 | 47% | $2,000 | $3,000 | 6 months | ✓ |
| Kentucky | ✓ | ✓ | ✓ | ✓ | ✓ | $235 | $291 | 24% | $2,000 | $4,000 | 1-3 months | |
| Louisiana 1,3 | ✓ | ✓ | ✓ | ✓ | ✓ | $100 | $192 | 10% | $2,000 | $3,000 | 3 months | ✓ |
| Maine | ✓ | ✓ | ✓ | ✓ | ✓ | $315 | $341 | 32% | $2,000 | $3,000 | 6 months | ✓ |
| Maryland | ✓ | ✓ | ✓ | ✓ | ✓ | $350 | $392 | 35% | $2,500 | $3,000 | 6 months | ✓ |
| Massachusetts | ✓ | ✓ | ✓ | ✓ | $522 | $650 | 52% | $2,000 | $3,000 | 6 months | ✓ | |
| Michigan | ✓ | ✓ | ✓ | ✓ | ✓ | $1,012 | $1,372 | 100% | $2,000 | $3,000 | 1 month | ✓ |
| Minnesota | ✓ | ✓ | ✓ | ✓ | ✓ | $810 | $1,098 | 80% | $3,000 | $6,000 | 6 months | ✓ |
| Montana | ✓ | ✓ | ✓ | ✓ | ✓ | $525 | $525 | 52% | $2,000 | $3,000 | 1 month | |
| Nebraska | ✓ | ✓ | ✓ | ✓ | ✓ | $392 | $392 | 39% | $4,000 | $6,000 | 1 month | ✓ |
| New Hampshire | ✓ | ✓ | ✓ | ✓ | ✓ | $591 | $675 | 58% | $2,500 | $4,000 | 1 or 6 months | |
| New Jersey | ✓ | ✓ | ✓ | ✓ | ✓ | $367 | $434 | 37% | $4,000 | $6,000 | 6 months | |
| New York | ✓ | ✓ | ✓ | ✓ | ✓ | $842 | $1,233 | 84% | $15,150 | $22,200 | 6 months | ✓ |
| North Carolina | ✓ | ✓ | ✓ | ✓ | ✓ | $242 | $317 | 24% | $2,000 | $3,000 | 6 months | ✓ |
| North Dakota | ✓ | ✓ | ✓ | ✓ | ✓ | $840 | $1,139 | 83% | $3,000 | $6,000 | 1 month | ✓ |
| Pennsylvania | ✓ | ✓ | ✓ | ✓ | ✓ | $425 | $442 | 42% | $2,400 | $3,200 | 6 months | ✓ |
| Rhode Island | ✓ | ✓ | ✓ | ✓ | ✓ | $903 | $947 | 88% | $4,000 | $6,000 | 6 months | ✓ |
| Tennessee | ✓ | ✓ | $241 | $258 | 24% | $2,000 | $3,000 | 1 month | ✓ | |||
| Texas | ✓ | ✓ | $104 | $216 | 11% | $2,000 | $3,000 | 1-3 months | ||||
| Utah | ✓ | ✓ | ✓ | ✓ | ✓ | $1,012 | $1,372 | 100% | $2,000 | $3,000 | 1 month | ✓ |
| Vermont1 | ✓ | ✓ | ✓ | ✓ | ✓ | $1,041 | $1,041 | 110% | $2,000 | $3,000 | 1 or 6 months5 | ✓ |
| Virginia1 | ✓ | ✓ | ✓ | ✓ | $493 | $659 | 49% | $2,000 | $3,000 | 1 or 6 months 5 | ✓ | |
| Washington | ✓ | ✓ | ✓ | ✓ | $750 | $750 | 75% | $2,000 | $3,000 | 3 or 6 months | ✓ | |
| West Virginia | ✓ | ✓ | ✓ | ✓ | ✓ | $200 | $275 | 20% | $2,000 | $3,000 | 6 months | |
| Wisconsin | ✓ | ✓ | ✓ | ✓ | $592 | $592 | 59% | $2,000 | $3,000 | 6 months | ✓ | |
| NO PROGRAM | ||||||||||||
| Alabama | ||||||||||||
| Alaska | ||||||||||||
| Arizona | ||||||||||||
| Colorado | ||||||||||||
| Delaware | ||||||||||||
| Idaho | ||||||||||||
| Indiana | ||||||||||||
| Mississippi | ||||||||||||
| Missouri | ||||||||||||
| Nevada | ||||||||||||
| New Mexico | ||||||||||||
| Ohio | ||||||||||||
| Oklahoma | ||||||||||||
| Oregon | ||||||||||||
| South Carolina | ||||||||||||
| South Dakota | ||||||||||||
| Wyoming | ||||||||||||
| NOTES: 1 CT, LA, VA, and VT vary their medically needy income standard by region. 2 Table includes data for regions B & C. Region A income limit is $633/individual and $805.09/couple. 3 Table includes data for urban regions. Rural income limit is $92/individual and $192/couple. 4 States reported a single income limit across populations. 5 Budget period of 6 months applies to those living in the community. | ||||||||||||
| SOURCE: Kaiser Family Foundation, Medicaid Financial Eligibility Survey for Seniors and People with Disabilities, 2018. | ||||||||||||
| Appendix Table 4: Medicaid Eligibility for Working People with Disabilities, 2018 | ||||||
| State | Monthly Income Limit | % FPL | Asset Limit | Monthly Income at Which Premiums Begin | Monthly Premium Amount | |
| Individual | Couple | |||||
| MEDIAN | $2,530 | 250% | $10,000 | $15,000 | N/A | N/A |
| Alaska | $3,163 | 313% | $10,000 | $15,000 | 100% FPL | No more than 10% of annual family income |
| Arizona | $2,530 | 250% | None | None | 50% FPL ($500) | $10 – $35 |
| Arkansas | None | None | None | None | No response | No response |
| California | $2,530 | 250% | $2,000 | $3,000 | 0% FPL | $20/individual; $30/couple |
| Colorado | $4,553 | 450% | None | None | 41% FPL | $25 – $200 |
| Connecticut | $3,083 | 305% | $10,000 | $15,000 | 200% FPL | 10% of income, minus any health insurance premiums between 200-250% FPL; No more than 7.5% of income above 250% FPL |
| Delaware | $2,782 | 275% | None | None | 100% FPL | $25 |
| DC | $3,036 | 300% | None | None | No premium | No premium |
| Florida | $2,024 | 200% | $5,000 | $6,000 | No premium | No premium |
| Georgia | $3,036 | 300% | $4,000 | $6,000 | 150% FPL | $35 |
| Idaho | $5,080 | 502% | $10,000 | $15,000 | 133% FPL | $10-259 |
| Illinois | $3,433 | 339% | $25,000 | $25,000 | 25% FPL ($251) | $19 |
| Indiana | $2,024 | 200% | $2,000 | $3,000 | 150% FPL | $48 |
| Iowa | $2,530 | 250% | $12,000 | $13,000 | > 150% FPL | $34/$47/$56 |
| Kansas | $3,035 | 300% | $15,000 | $15,000 | 100% FPL | $55 – $205 |
| Kentucky | $2,530 | 250% | $5,000 | $10,000 | No premium | No premium |
| Louisiana | $1,012 | 100% | $10,000 | $10,000 | No premium | No premium |
| Maine | $2,530 | 250% | $8,000 | $12,000 | 150% | $10 -$20 |
| Maryland | $3,036 | 300% | $10,000 | $15,000 | 101% | $25/$40/$55 |
| Massachusetts | None | None | None | None | > 150% FPL | Varies based on income |
| Michigan | $2,023 | 200% | $4,000 | Excludes spouse | No premium | No premium |
| Minnesota | None | None | $20,000 | Excludes spouse | 0% FPL | $35 minimum |
| Mississippi | $2,530 | 250% | $24,000 | $26,000 | 150% FPL | 5% of countable income |
| Montana | $2,530 | 250% | $15,000 | $30,000 | 100% FPL or less | $35 and above |
| Nebraska | $2,530 | 250% | $4,000 | $6,000 | 200% FPL | Sliding scale based on income |
| Nevada | $2,529 | 250% | $15,000 | $15,000 | 0% FPL | Sliding scale based on income |
| New Hampshire | $2,530 | 250% | $28,568 | $42,849 | 150% FPL | No more than 7.5% of total income |
| New Jersey | $2,530 | 250% | $20,000 | $30,000 | 150% FPL | $25 |
| New Mexico | $1,519 | 150% | $10,000 | $15,000 | No premium | No premium |
| New York | $2,530 | 250% | $20,000 | $30,000 | No premium | No premium |
| North Carolina | $2,024 | 200% | $2,000 | $3,000 | 150% FPL | No response |
| North Dakota | $2,277 | 225% | $13,000 | $16,000 | 225% FPL | 5% of gross income |
| Ohio | $2,530 | 250% | $11,901 | Excludes spouse | 150% FPL | Varies by family size and income |
| Oregon | $2,530 | 250% | $5,000 | Excludes spouse | 75% FPL | $50 |
| Pennsylvania | $2,530 | 250% | $10,000 | $10,000 | 0% FPL | 5% of net income2 |
| Rhode Island | $2,529 | 250% | $10,000 | $20,000 | 150% FPL | No response |
| South Dakota | $2,530 | 250% | $8,000 | Excludes spouse | No premium | No premium |
| Texas | $2,530 | 250% | $5,000 | Excludes spouse | 150% FPL | $20 |
| Utah | $2,529 | 250% | $15,000 | $15,000 | 100% FPL | 5%-15% of countable net income |
| Vermont | $2,530 | 250% | $10,000 | $15,000 | No premium | No premium |
| Virginia1 | $810 | 80% | $2,000 | $3,000 | No premium | No premium |
| Washington | $2,226 | 220% | None | None | 6.5% FPL ($65) | No more than 7.5% of total income |
| West Virginia | $2,530 | 250% | $2,000 | $3,000 | 0% FPL | $15 – $129.50 |
| Wisconsin | $2,529 | 250% | $15,000 | Excludes spouse | 150% FPL | Depends on income |
| Wyoming | $2,250 | 222% | None | None | 0% FPL ($1) | Premium based on 7.5% of gross monthly income |
| NO PROGRAM | ||||||
| Alabama | ||||||
| Hawaii | ||||||
| Missouri | ||||||
| Oklahoma | ||||||
| South Carolina | ||||||
| Tennessee | ||||||
| NOTES: 1 To enter VA’s buy-in, individuals must have incomes at or below 80% FPL and assets limited to $2,000. However, once enrolled, individuals can have earnings up to $75,00 per year or ($6,250 per month) as long as they are deposited in a qualifying account. 2 In PA, the premium does not have to be paid if it is calculated to be less than $10 per month or if the individual shows good cause not to pay it. | ||||||
| SOURCE: Kaiser Family Foundation, Medicaid Financial Eligibility Survey for Seniors and People with Disabilities, 2018. | ||||||
| Appendix Table 5: Medicaid Special Income Rule for Long-Term Services and Supports Eligibility, 2018 | ||||
| State | Special Income Rule | Special Income Rule Asset Limit | ||
| Applies to Institutions | Applies to HCBS | Individual | Couple | |
| TOTAL/MEDIAN | 42 | 43 | $2,000 | $3,000 |
| Alabama | ✓ | ✓ | $2,000 | $3,000 |
| Alaska | ✓ | ✓ | $2,000 | $3,000 |
| Arizona | ✓ | ✓ | $2,000 | $3,000 |
| Arkansas | ✓ | ✓ | $2,000 | $3,000 |
| Colorado | ✓ | ✓ | $2,000 | $3,000 |
| Connecticut | ✓ | ✓ | $1,600 | $2,400 |
| Delaware1 | ✓ | ✓ | $2,000 | $3,000 |
| DC | ✓ | ✓ | $4,000 | $6,000 |
| Florida | ✓ | ✓ | $2,000 | $3,000 |
| Georgia | ✓ | ✓ | $2,000 | $3,000 |
| Idaho | ✓ | ✓ | $2,000 | $3,000 |
| Indiana | ✓ | ✓ | $2,000 | $3,000 |
| Iowa | ✓ | ✓ | $2,000 | $3,000 |
| Kansas | ✓ | ✓ | $2,000 | N/A2 |
| Kentucky | ✓ | ✓ | $2,000 | N/A2 |
| Louisiana | ✓ | ✓ | $2,000 | $3,000 |
| Maine | ✓ | ✓ | $2,000 | $3,000 |
| Maryland | ✓ | ✓ | $2,000 | $3,000 |
| Massachusetts | ✓ | $2,000 | N/A3 | |
| Michigan | ✓ | ✓ | $2,000 | $3,000 |
| Minnesota | ✓ | ✓ Aged only | $3,000 | $6,000 |
| Mississippi | ✓ | ✓ | $4,000 | $6,000 |
| Missouri1 | ✓ | ✓ | Varies by program | Varies by program |
| Nevada | ✓ | ✓ | $2,000 | $3,000 |
| New Hampshire | ✓ | ✓ | $2,500 | N/A2 |
| New Jersey | ✓ | ✓ | $2,000 | $3,000 |
| New Mexico | ✓ | ✓ | $2,000 | N/A2 |
| Ohio | ✓ | ✓ | $2,000 | $3,000 |
| Oklahoma | ✓ | ✓ | $2,000 | $3,000 |
| Oregon | ✓ | ✓ | $2,000 | N/A2 |
| Pennsylvania | ✓ | ✓ | $2,000 | $3,000 |
| Rhode Island | ✓ | ✓ | $4,000 | $6,000 |
| South Carolina | ✓ | ✓ | $2,000 | N/A2 |
| South Dakota | ✓ | ✓ | $2,000 | $3,000 |
| Tennessee | ✓ | ✓ | $2,000 | N/A2 |
| Texas | ✓ | ✓ | $2,000 | $3,000 |
| Utah | ✓ | ✓ | $2,000 | $3,000 |
| Vermont | ✓ | ✓ | $2,000 | $3,000 |
| Virginia | ✓ | ✓ | $2,000 | N/A2 |
| Washington | ✓ | ✓ | $2,000 | $3,000 |
| West Virginia | ✓ | ✓ | $2,000 | $3,000 |
| Wisconsin | ✓ | ✓ | $2,000 | $3,000 |
| Wyoming | ✓ | ✓ | $2,000 | $3,000 |
| NO PROGRAM | ||||
| California | ||||
| Hawaii | ||||
| Illinois | ||||
| Montana | ||||
| Nebraska | ||||
| New York | ||||
| North Carolina | ||||
| North Dakota | ||||
| NOTES: 1 All but two states (DE & MO) reported setting the eligibility standard at 300% of SSI ($2,250 per month). DE’s limit is 250% of SSI and in MO, the limit varies by program. 2 All institutionalized individuals are single person households once eligibility is established.3 In MA, the asset limit for a couple is the aggregate of the $2,000 limit for the applicant and the community spouse limit of $123,600. | ||||
| SOURCE: Kaiser Family Foundation, Medicaid Financial Eligibility Survey for Seniors and People with Disabilities, 2018. | ||||
| Appendix Table 6: Medicaid Long-Term Services and Supports Trusts and Home Equity Limits, 2018 | ||||||||
| State | Miller Trust (maximum amount, if any) | Supplemental Needs Trust | Is Trust Amount Limited? | Pooled Income Trust | Is Trust Amount Limited? | ABLE Program (maximum lifetime amount) | Home Equity Limit | |
| For Institutional Care | For HCBS | |||||||
| TOTAL/MEDIAN | 25 | 22 | 48 | 21 | 48 | 19 | 51 | $572,000 |
| Alabama | ✓ | ✓, $400,000 | $572,000 | |||||
| Alaska | ✓ | ✓ | ✓ | No limit | ✓ | No limit | ✓, no response | $572,000 |
| Arizona | ✓, $7,134 urban; $6,307 rural | ✓, $7,134 urban; $6,307 rural | ✓ | No limit | ✓ | No limit | ✓, $486,000 | $572,000 |
| Arkansas | ✓ | ✓ | ✓ | ✓ | ✓, $366,000 | $572,000 | ||
| California | ✓ | ✓ | ✓, $529,000 | No Limit on Principal Residence | ||||
| Colorado | ✓, regional caps | ✓, regional caps | ✓ | ✓ | ✓, $350,000 | $572,000 | ||
| Connecticut | ✓ | Varies | ✓ | Varies | ✓, $300,000 | $858,000 | ||
| Delaware1 | ✓ | ✓ | ✓ | No limit | ✓ | No limit | ✓, 350,000 | $572,000 |
| DC | ✓ | ✓ | ✓, $500,000 | $858,000 | ||||
| Florida | ✓ | ✓ | ✓ | ✓ | ✓, $418,000 | $572,000 | ||
| Georgia | ✓ | ✓ | ✓ | No limit | ✓ | No limit | ✓, $468,000 | $572,000 |
| Hawaii | ✓, $305,000 | $858,000 | ||||||
| Idaho | ✓ | ✓ | ✓ | ✓ | ✓, no response | $858,000 | ||
| Illinois | ✓, $400,000 | $572,000 | ||||||
| Indiana | ✓ | ✓ | ✓ | ✓ | ✓, $450.000 | $572,000 | ||
| Iowa | ✓ | ✓, 125% of avg. cost of facility | ✓ | No limit | ✓ | ✓, $420,000 | $572,000 | |
| Kansas | ✓ | ✓ | ✓, $365,000 | $572,000 | ||||
| Kentucky | ✓, $2,250 | ✓, $2,250 | ✓ | ✓ | ✓, $468,000 | $572,000 | ||
| Louisiana | ✓ | ✓ | ✓, $500,000 | $572,000 | ||||
| Maine | ✓ | ✓ | ✓, $400,000 | $858,000 | ||||
| Maryland | ✓ | ✓ | ✓, $350,000 | $572,000 | ||||
| Massachusetts | ✓ | No limit | ✓ | No limit | ✓, $400,000 | $858,000 | ||
| Michigan | ✓ | ✓ | ✓, $500,000 | $572,000 | ||||
| Minnesota | ✓ | No limit | ✓ | No limit | ✓, $350,000 | $572,000 | ||
| Mississippi | ✓, income cannot exceed cost of private pay rate for nursing facility | ✓, $3,035 | ✓ | No limit | ✓ | No limit | ✓, $235,000 | $572,000 |
| Missouri1 | ✓, varies | ✓, varies | ✓ | Varies | ✓ | Varies | ✓, $468,000 | $572,000 |
| Montana | ✓ | No limit | ✓ | No limit | ✓, $400,000 | $572,000 | ||
| Nebraska | ✓ | No limit | ✓ | No limit | ✓, $400,000 | $572,000 | ||
| Nevada | ✓ | ✓ | ✓ | ✓, $370,000 | $572,000 – 858,000 | |||
| New Hampshire | ✓ | ✓ | ✓, $468,000 | $572,000 | ||||
| New Jersey | ✓ | ✓ | ✓ | ✓ | ✓, $305,000 | $858,000 | ||
| New Mexico | ✓ | ✓ | ✓ | ✓ | ✓, $468,000 | $572,000 | ||
| New York | ✓ | ✓ | ✓, $100,000 | $858,000 | ||||
| North Carolina | ✓ | ✓ | ✓, $420,000 | $572,000 | ||||
| North Dakota | ✓ | No limit | ✓ | No limit | ✓, $269,000 | $572,000 | ||
| Ohio | ✓ | ✓ | ✓ | ✓ | ✓, $468,000 | $572,000 | ||
| Oklahoma | ✓, $4,365 | ✓, $4,365 | ✓ | ✓ | ✓, $468,000 | $572,000 | ||
| Oregon | ✓ | ✓ | ✓ | No limit | ✓ | No limit | ✓, $400,000 | $572,000 |
| Pennsylvania | ✓ | No limit | ✓ | No limit | ✓, $511,758 | $572,000 | ||
| Rhode Island | ✓ | ✓ | ✓, $395,000 | $572,000 | ||||
| South Carolina | ✓ | ✓ | ✓ | ✓ | ✓, $462,000 | $572,000 | ||
| South Dakota | ✓, $2,250 | ✓, $2,250 | ✓ | No limit | ✓ | No limit | ✓, $350,000 | $572,000 |
| Tennessee | ✓ | ✓ | ✓ | No limit | ✓ | ✓, $350,000 | $572,000 | |
| Texas | ✓ | ✓ | ✓ | No limit | ✓ | No limit | ✓, $370,000 | $572,000 |
| Utah | ✓ | No limit | ✓ | No limit | ✓, $416,000 | $572,000 | ||
| Vermont | ✓ | No limit | ✓ | No limit | ✓, $468,000 | $572,000 | ||
| Virginia | ✓ | ✓ | ✓, $500,000 | $572,000 | ||||
| Washington | ✓ | No limit | ✓ | No limit | ✓, $500,000 | $572,000 | ||
| West Virginia | ✓ | No limit | ✓ | No limit | ✓, $468,000 | $572,000 | ||
| Wisconsin | ✓ | ✓ | ✓, $330,000 | $750,000 | ||||
| Wyoming | ✓ | ✓ | No limit | ✓ | No limit | ✓, $464,000 | $572,000 | |
| SOURCE: Kaiser Family Foundation, Medicaid Financial Eligibility Survey for Seniors and People with Disabilities, 2018. | ||||||||
| Appendix Table 7: Medicaid Long-Term Services and Supports Post-Eligibility Treatment of Income and Spousal Impoverishment Standards, 2018 | ||||||
| State | Monthly Personal Needs Allowance | Spousal Impoverishment Standards for Institutional Care | ||||
| For Institutional Care | For HCBS | Monthly Community Spouse Needs Allowance 4 | Community Spouse Asset Limit 5 | Applies to HCBS Waiver Participants | Will Apply to HCBS if ACA § 2404 Expires 6 | |
| TOTAL/MEDIAN | $50 | $2,024 | $3,090 | $123,600 | 51 | 49 |
| Alabama | $30 | $2,250 | $2,058 | $25,000 – 123,600 | ✓ | ✓ |
| Alaska | $1,396 | $1,656 | $3,090 | $123,600 | ✓ | ✓ |
| Arizona | $113 | $2,250 | $2,058 | $123,600 | ✓ | ✓ |
| Arkansas | $40 | $2,250 | $2,058 – 3,090 | $24,720 – 123,600 | ✓ | ✓ Some |
| California | $35 | $600 | $3,090 | $123,600 | ✓ | ✓ |
| Colorado | $84 | $2,250 | $2,058 | $123,600 | ✓ | ✓ |
| Connecticut | $60 | $2,024 | $2,058 – 3,090 | $24,720 – 123,600 | ✓ | ✓ |
| Delaware | $50 | $2,030 | $2,058 – 3,090 | $25,000 | ✓ | ✓ |
| DC | $70 | $2,250 | $3,090 | $24,720 – 123,600 | ✓ | ✓ |
| Florida | $130 | $1,012 | $2,058 | $123,600 | ✓ | ✓ |
| Georgia | $65 | $750 | $3,090 | $123,600 | ✓ | ✓ |
| Hawaii | $50 | $469 or $1,164 | $3,090 | $123,600 | ✓ | ✓ |
| Idaho | $40 | $750 or $1,3501 | $2,058 – 3,090 | $24,720 – 123,600 | ✓ | ✓ |
| Illinois | $60 | N/A2 | $3,090 | $123,600 | ✓ Some | ✓ Some |
| Indiana | $52 | $2,250 | $2,058 | $24,720 – 123,600 | ✓ | ✓ |
| Iowa | $50 | $2,250 | $3,090 | $24,720 – 123,600 | ✓ | ✓ |
| Kansas | $62 | $727 | $2,058 – 3,090 | $24,720 – 123,600 | ✓ | ✓ |
| Kentucky | $40 | $770 | $2,058 | $24,720 | ✓ | ✓ |
| Louisiana | $38 | $2,250 | $3,090 | $123,600 | ✓ | ✓ |
| Maine | $40 | $2,024 | $2,058 | $123,600 | ✓ | |
| Maryland | $80 | Varies by waiver | $2,058 – 3,090 | $24,720 – 123,600 | ✓ | ✓ |
| Massachusetts | $73 | $2,250 | $2,058 – 3,090 | $123,600 | ✓ | ✓ |
| Michigan | $60 | $2,250 | $2,058 – 3,090 | $24,720 – 123,600 | ✓ | ✓ |
| Minnesota | $99 | $1,003 | $2,058 | $123,600 | ✓ | ✓ Some |
| Mississippi | $44 | $2,250 | $3,090 | $123,600 | ✓ | ✓ |
| Missouri | $50 | N/A | $2,058 – 3,090 | $24,720 – 123,600 | ✓ | ✓ |
| Montana | $50 | $100 | $2,058 | $24,720 – 123,600 | ✓ | ✓ |
| Nebraska | $60 | $392 | $2,058 – 3,090 | $24,720 – 123,600 | ✓ | ✓ |
| Nevada | $35 | $2,250 | $2,058 – 3,090 | $24,720 – 123,600 | ✓ | ✓ |
| New Hampshire | $70 | $70-$2,250 3 | $3,090 | $24,720 – 123,600 | ✓ | |
| New Jersey | $50 | $112 or $2,250 | $2,058 | $24,720 – 123,600 | ✓ | ✓ |
| New Mexico | $72 | N/A | $2,058 | $31,290 | ✓ | ✓ |
| New York | $50 | $842 | $3,090 | $123,600 | ✓ | ✓ |
| North Carolina | $30 | N/A | $3,090 | $24,720 – 123,600 | ✓ | ✓ |
| North Dakota | $65 | $840 | $2,550 | $24,720 – 123,600 | ✓ | ✓ |
| Ohio | $50 | $1,463 | $3,090 | $24,720 – 123,600 | ✓ | ✓ |
| Oklahoma | $50 | $1,101 | $3,090 | $25,000 – 123,600 | ✓ | ✓ |
| Oregon | $61 | $750 or $1,750 | $2,058 – 3,090 | $24,720 – 123,600 | ✓ | ✓ |
| Pennsylvania | $45 | $2,250 | $2,058 – 3,090 | $24,720 – 123,600 | ✓ | ✓ |
| Rhode Island | $50 | $1,012 | $3,090 | $24,720 – 123,600 | ✓ | ✓ |
| South Carolina | $30 | $2,250 | $3,090 | $66,480 | ✓ | ✓ |
| South Dakota | $60 | $750 | $2,058 | $123,600 | ✓ | ✓ |
| Tennessee | $50 | $2,250 | $2,058 – 3,090 | $24,720 – 123,600 | ✓ | ✓ |
| Texas | $60 | $2,250 | $3,090 | $24,720 – 123,600 | ✓ | ✓ |
| Utah | $45 | $1,012 | $2,058 | $24,720 | ✓ | ✓ |
| Vermont | $48 | $1,125 | $2,058 – 3,090 | $123,600 | ✓ | ✓ |
| Virginia | $40 | $1,238 | $2,058 | $24,720 – 123,600 | ✓ | ✓ |
| Washington | $58 | $1,012 | $3,090 | $123,600 | ✓ | ✓ |
| West Virginia | $50 | $2,250 | $2,058 – 3,090 | $24,720 – 123,600 | ✓ | ✓ |
| Wisconsin | $45 | $930 | $2,743 – 3,090 | $50,000 – 123,600 | ✓ | ✓ |
| Wyoming | $50 | $2,250 | $3,090 | $123,600 | ✓ | ✓ |
| NOTES: 1 In ID, amounts vary by marital status and housing situation; single (not responsible for rent/mortgage): $750; single (responsible for rent/mortgage): $1,350; married (not responsible for rent/mortgage): $1,125; married (responsible for rent/mortgage): $1,350. 2 With the exception of IL’s Section 1915 (c) waiver for seniors, IL does not recognize a monthly personal needs allowance for waiver enrollees who remain in their homes.3 NH amount varies by waiver and living situation. 4 CMS uses $2,057.50, while most states reported the minimum as $2,058. 5 States with an asset limit range apply a formula that allows the community spouse to retain an amount of protected assets that is the greater of either the federal minimum ($24,720) or one-half of the couple’s total combined resources but not to exceed the federal maximum ($123,600). 6 States reported plans about whether to continue to apply spousal impoverishment rules to HCBS waivers if ACA § 2404 expired in Dec. 2018; Congress subsequently extended ACA § 2404 through Sept. 2019. | ||||||
| SOURCE: Kaiser Family Foundation, Medicaid Financial Eligibility Survey for Seniors and People with Disabilities, 2018. | ||||||
| Appendix Table 8: Eligibility for Medicaid’s Medicare Savings Programs, 2018 | |||||||||||||||
| State | Qualified Medicare Beneficiaries (QMB) | Specified Low-Income Savings Programs (SLMB) | Qualified Individuals (QI) | ||||||||||||
| Monthly Income Limit | % FPL | Asset Limit | Monthly Income Limit | % FPL | Asset Limit | Monthly Income Limit | % FPL | Asset Limit | |||||||
| Individual | Couple | Individual | Couple | Individual | Couple | Individual | Couple | Individual | Couple | Individual | Couple | ||||
| MEDIAN | $1,012 | $1,372 | 100% | $7,560 | $11,340 | $1,214 | $1,646 | 120% | $7,560 | $11,340 | $1,366 | $1,852 | 135% | $7,560 | $11,340 |
| Alabama | $1,012 | $1,392 | 100% | none | none | $1,214 | $1,646 | 120% | none | none | $1,366 | $1,852 | 135% | none | none |
| Alaska | $1,265 | $1,715 | 100% | $7,560 | $11,340 | $1,518 | $2,058 | 120% | $7,560 | $11,340 | $1,708 | $2,316 | 135% | $7,560 | $11,340 |
| Arizona | $1,012 | $1,372 | 100% | none | none | $1,214 | $1,646 | 120% | none | none | $1,366 | $1,852 | 135% | none | none |
| Arkansas | $1,012 | $1,372 | 100% | $7,560 | $11,340 | $1,214 | $1,646 | 120% | $7,560 | $11,340 | $1,366 | $1,852 | 135% | $7,560 | $11,340 |
| California | $1,012 | $1,372 | 100% | $7,560 | $11,340 | $1,214 | $1,646 | 120% | $7,560 | $11,340 | $1,366 | $1,852 | 135% | $7,560 | $11,340 |
| Colorado | $1,012 | $1,372 | 100% | $9,060 | $14,340 | $1,214 | $1,646 | 120% | $9,060 | $14,340 | $1,366 | $1,852 | 135% | $9,060 | $14,340 |
| Connecticut | $2,136 | $2,895 | 211% | none | none | $2,338 | $3,170 | 231% | none | none | $2,490 | $3,376 | 246% | none | none |
| Delaware | $1,012 | $1,372 | 100% | none | none | $1,214 | $1,646 | 120% | none | none | $1,366 | $1,852 | 135% | none | none |
| DC1 | $3,035 | $4,115 | 300% | none | none | N/A | N/A | N/A | N/A | N/A | N/A | N/A | N/A | N/A | N/A |
| Florida | $1,012 | $1,372 | 100% | $7,560 | $11,340 | $1,214 | $1,646 | 120% | $7,560 | $11,340 | $1,366 | $1,852 | 135% | $7,560 | $11,340 |
| Georgia | $1,012 | $1,372 | 100% | $7,560 | $11,340 | $1,214 | $1,646 | 120% | $7,560 | $11,340 | $1,366 | $1,852 | 135% | $7,560 | $11,340 |
| Hawaii | $1,164 | $1,578 | 100% | $7,560 | $11,340 | $1,396 | $1,893 | 120% | $7,560 | $11,340 | $1,571 | $2,130 | 135% | $7,560 | $11,340 |
| Idaho | $1,012 | $1,392 | 100% | $7,560 | $11,340 | $1,214 | $1,646 | 120% | $7,560 | $11,340 | $1,366 | $1,852 | 135% | $7,560 | $11,340 |
| Illinois | $1,012 | $1,372 | 100% | $7,560 | $11,340 | $1,214 | $1,646 | 120% | $7,560 | $11,340 | $1,366 | $1,852 | 135% | $7,560 | $11,340 |
| Indiana2 | $1,518 | $2,058 | 150% | $7,560 | $11,340 | $1,720 | $2,332 | 170% | $7,560 | $11,340 | $1,872 | $2,538 | 185% | $7,560 | $11,340 |
| Iowa | $1,012 | $1,372 | 100% | $7,560 | $11,340 | $1,214 | $1,646 | 120% | $7,560 | $11,340 | $1,366 | $1,852 | 135% | $7,560 | $11,340 |
| Kansas | $1,012 | $1,372 | 100% | $7,560 | $11,340 | $1,214 | $1,646 | 120% | $7,560 | $11,340 | $1,366 | $1,852 | 135% | $7,560 | $11,340 |
| Kentucky | $1,012 | $1,372 | 100% | $7,560 | $11,340 | $1,214 | $1,646 | 120% | $7,560 | $11,340 | $1,366 | $1,852 | 135% | $7,560 | $11,340 |
| Louisiana | $1,012 | $1,372 | 100% | $7,560 | $11,340 | $1,214 | $1,646 | 120% | $7,560 | $11,340 | $1,366 | $1,852 | 135% | $7,560 | $11,340 |
| Maine3 | $1,417 | $1,921 | 140% | $58,000 | $87,000 | $1,619 | $2,195 | 160% | $58,000 | $87,000 | $1,771 | $2,401 | 175% | $58,000 | $87,000 |
| Maryland | $1,012 | $1,372 | 100% | $7,560 | $11,340 | $1,214 | $1,646 | 120% | $7,560 | $11,340 | $1,366 | $1,852 | 135% | $7,560 | $11,340 |
| Massachusetts | $1,012 | $1,372 | 100% | $7,560 | $11,340 | $1,214 | $1,636 | 120% | $7,560 | $11,340 | $1,366 | $1,852 | 135% | $7,560 | $11,340 |
| Michigan | $1,012 | $1,372 | 100% | $7,560 | $11,340 | $1,214 | $1,646 | 120% | $7,560 | $11,340 | $1,366 | $1,852 | 135% | $7,560 | $11,340 |
| Minnesota | $1,012 | $1,372 | 100% | $10,000 | $18,000 | $1,214 | $1,646 | 120% | $10,000 | $18,000 | $1,366 | $1,852 | 135% | $10,000 | $18,000 |
| Mississippi | $1,012 | $1,372 | 100% | none | none | $1,214 | $1,646 | 120% | none | none | $1,366 | $1,852 | 135% | none | none |
| Missouri | $1,012 | $1,372 | 100% | $7,560 | $11,340 | $1,214 | $1,646 | 120% | $7,560 | $11,340 | $1,366 | $1,852 | 135% | $7,560 | $11,340 |
| Montana | $1,012 | $1,372 | 100% | $7,560 | $11,340 | $1,215 | $1,647 | 120% | $7,560 | $11,340 | $1,366 | $1,852 | 135% | $7,560 | $11,340 |
| Nebraska | $1,012 | $1,372 | 100% | $7,560 | $11,340 | $1,214 | $1,646 | 120% | $7,560 | $11,340 | $1,366 | $1,852 | 135% | $7,560 | $11,340 |
| Nevada | $1,012 | $1,372 | 100% | $7,560 | $11,340 | $1,214 | $1,646 | 120% | $7,560 | $11,340 | $1,366 | $1,852 | 135% | $7,560 | $11,340 |
| New Hampshire | $1,012 | $1,372 | 100% | $7,560 | $11,340 | $1,214 | $1,646 | 120% | $7,560 | $11,340 | $1,366 | $1,852 | 135% | $7,560 | $11,340 |
| New Jersey | $1,012 | $1,372 | 100% | $7,560 | $11,340 | $1,214 | $1,646 | 120% | $7,560 | $11,340 | $1,366 | $1,852 | 135% | $7,560 | $11,340 |
| New Mexico | $1,012 | $1,372 | 100% | 9,060 | $14,340 | $1,214 | $1,646 | 120% | 9,060 | $14,340 | $1,366 | $1,852 | 135% | $9,060 | $14,340 |
| New York | $1,012 | $1,372 | 100% | none | none | $1,214 | $1,646 | 120% | none | none | $1,366 | $1,852 | 135% | none | none |
| North Carolina | $1,012 | $1,372 | 100% | $7,560 | $11,340 | $1,214 | $1,646 | 120% | $7,560 | $11,340 | $1,366 | $1,852 | 135% | $7,560 | $11,340 |
| North Dakota | $1,012 | $1,372 | 100% | $7,560 | $11,340 | $1,214 | $1,646 | 120% | $7,560 | $11,340 | $1,366 | $1,852 | 135% | $7,560 | $11,340 |
| Ohio | $1,012 | $1,372 | 100% | $7,560 | $11,340 | $1,214 | $1,646 | 120% | $7,560 | $11,340 | $1,366 | $1,852 | 135% | $7,560 | $11,340 |
| Oklahoma | $1,012 | $1,372 | 100% | $7,560 | $11,340 | $1,214 | $1,646 | 120% | $7,560 | $11,340 | $1,366 | $1,852 | 135% | $7,560 | $11,340 |
| Oregon | $1,012 | $1,372 | 100% | none | none | $1,214 | $1,646 | 120% | none | none | $1,366 | $1,852 | 135% | none | none |
| Pennsylvania | $1,012 | $1,372 | 100% | $7,560 | $11,340 | $1,214 | $1,646 | 120% | $7,560 | $11,340 | $1,366 | $1,852 | 135% | $7,560 | $11,340 |
| Rhode Island | $1,012 | $1,372 | 100% | $7,560 | $11,340 | $1,214 | $1,646 | 120% | $7,560 | $11,340 | $1,366 | $1,852 | 135% | $7,560 | $11,340 |
| South Carolina | $1,012 | $1,372 | 100% | $7,560 | $11,340 | $1,214 | $1,646 | 120% | $7,560 | $11,340 | $1,366 | $1,852 | 135% | $7,560 | $11,340 |
| South Dakota | $1,012 | $1,372 | 100% | $7,560 | $11,340 | $1,214 | $1,646 | 120% | $7,560 | $11,340 | $1,366 | $1,852 | 135% | $7,560 | $11,340 |
| Tennessee | $1,012 | $1,372 | 100% | $7,560 | $11,340 | $1,214 | $1,646 | 120% | $7,560 | $11,340 | $1,366 | $1,852 | 135% | $7,560 | $11,340 |
| Texas | $1,012 | $1,372 | 100% | $7,560 | $11,340 | $1,214 | $1,646 | 120% | $7,560 | $11,340 | $1,366 | $1,852 | 135% | $7,560 | $11,340 |
| Utah | $1,012 | $1,372 | 100% | $7,560 | $11,340 | $1,214 | $1,646 | 120% | $7,560 | $11,340 | $1,366 | $1,852 | 135% | $7,560 | $11,340 |
| Vermont | $1,012 | $1,372 | 100% | none | none | $1,214 | $1,646 | 120% | none | none | $1,366 | $1,852 | 135% | none | none |
| Virginia | $1,012 | $1,372 | 100% | $7,560 | $11,340 | $1,214 | $1,646 | 120% | $7,560 | $11,340 | $1,366 | $1,852 | 135% | $7,560 | $11,340 |
| Washington | $1,012 | $1,372 | 100% | $7,560 | $11,340 | $1,214 | $1,646 | 120% | $7,560 | $11,340 | $1,366 | $1,852 | 135% | $7,560 | $11,340 |
| West Virginia | $1,012 | $1,372 | 100% | $7,560 | $11,340 | $1,214 | $1,646 | 120% | $7,560 | $11,340 | $1,366 | $1,852 | 135% | $7,560 | $11,340 |
| Wisconsin | $1,012 | $1,372 | 100% | $7,560 | $11,340 | $1,214 | $1,646 | 120% | $7,560 | $11,340 | $1,366 | $1,852 | 135% | $7,560 | $11,340 |
| Wyoming | $1,012 | $1,372 | 100% | $7,560 | $11,340 | $1,214 | $1,646 | 120% | $7,560 | $11,340 | $1,366 | $1,852 | 135% | $7,560 | $11,340 |
| NOTES: Most state have a standard $20 general income disregard; exceptions include: Maine ($75), Mississippi ($50), and Illinois ($25). 1DC’s disregard effectively increases the QMB income limit to 300% FPL; as a result, the SLMB and QI categories are moot. 2IN disregards the amount of income from 100-150% FPL for QMBs, 120-170% for SLMBs, and 135-185% FPL for QIs.3ME’s MSP income thresholds are at the federal limits, but the state’s disregards are updated annually to effectively increase the income limit to 140% FPL for QMBs, 160% FPL for SLMBs, and 175% FPL for QIs; asset limits are for liquid assets only. | |||||||||||||||
| SOURCE: Kaiser Family Foundation, Medicaid Financial Eligibility Survey for Seniors and People with Disabilities, 2018. | |||||||||||||||
| Appendix Table 9: State Adoption of Selected ACA Streamlined Medicaid Eligibility Renewal Provisions, 2018 | ||
| State | Sends Pre-populated Forms for Age and Disability-Related Pathway Eligibility Renewals | Offers Reconsideration Period for Age and Disability Eligibility Pathway Renewals |
| TOTAL | 30 | 43 |
| Alabama | ✓ | ✓ |
| Alaska | ||
| Arizona | ✓ | ✓ |
| Arkansas | ✓ (for MSP categories) | |
| California | In development | ✓ |
| Colorado | ✓ | |
| Connecticut | ✓ | No response |
| Delaware | ✓ | ✓ |
| DC | ✓, 30 days | |
| Florida | ✓ | |
| Georgia | ✓ | ✓ |
| Hawaii | ✓ | ✓ |
| Idaho | ✓ | ✓ |
| Illinois | ✓ | ✓ |
| Indiana | ✓ | ✓, 90 days |
| Iowa | ✓, 90 days | |
| Kansas | ✓ | ✓ |
| Kentucky | ✓ | ✓ |
| Louisiana | ✓ | |
| Maine | ✓ | ✓ |
| Maryland | ✓ | ✓, 120 days |
| Massachusetts | ✓ | |
| Michigan | ✓ | |
| Minnesota | ✓ | |
| Mississippi | ✓ | ✓ |
| Missouri | In development | ✓ |
| Montana | ✓ | ✓ |
| Nebraska | ✓ | ✓ |
| Nevada | ✓ | ✓, 90 days |
| New Hampshire | ||
| New Jersey | ✓, 90 days | |
| New Mexico | ✓ | ✓, only for waivers |
| New York | ✓ | |
| North Carolina | ✓ | |
| North Dakota | In development | ✓ |
| Ohio | ✓ | ✓, 90 days |
| Oklahoma | ✓ | |
| Oregon | ||
| Pennsylvania | ✓ | ✓ |
| Rhode Island | No response | No response |
| South Carolina | In development | ✓, 90 days |
| South Dakota | ✓ | ✓ |
| Tennessee | In development | ✓ |
| Texas | ✓ | ✓ |
| Utah | ✓ | ✓, 90 days |
| Vermont | ✓, 90 days | |
| Virginia | ✓ | ✓ |
| Washington | ✓ | |
| West Virginia | ✓ | ✓ |
| Wisconsin | ✓ | ✓ |
| Wyoming | ✓ | ✓, 90 days |
| SOURCE: Kaiser Family Foundation, Medicaid Financial Eligibility Survey for Seniors and People with Disabilities, 2018. | ||
Endnotes
- Kaiser Family Foundation, Medicaid Enrollment by Age (FY 2013). ↩︎
- Kaiser Family Foundation, Medicaid Restructuring Under the American Health Care Act and Nonelderly Adults with Disabilities (March 2017), https://modern.kff.org/medicaid/issue-brief/medicaid-restructuring-under-the-american-health-care-act-and-nonelderly-adults-with-disabilities/. ↩︎
- Kaiser Family Foundation, Medicaid’s Role for Children with Special Health Care Needs: A Look at Eligibility, Services, and Spending (June, 2019), https://modern.kff.org/medicaid/issue-brief/medicaids-role-for-children-with-special-health-care-needs-a-look-at-eligibility-services-and-spending/. ↩︎
- For state-level data about Medicaid eligibility through poverty-related pathways, see Kaiser Family Foundation, Medicaid and CHIP Eligibility, Enrollment, and Cost Sharing Policies as of January 2019: Findings from a 50-State Survey (March 2019), https://modern.kff.org/medicaid/report/medicaid-and-chip-eligibility-enrollment-and-cost-sharing-policies-as-of-january-2019-findings-from-a-50-state-survey/. ↩︎
- Medicaid eligibility pathways based on old age or disability include two general components: financial eligibility rules that limit income and sometimes assets and functional eligibility rules that determine the degree of a person’s need for services and supports. State variation in functional eligibility criteria associated with these pathways is beyond the scope of this brief. ↩︎
- Arkansas and Rhode Island did not respond to the survey. Data for these two states were obtained from state Medicaid agency websites and Medicaid.gov. ↩︎
- 42 U.S.C. § 1396a (a)(10)(A)(i)(II); but see 42 U.S.C. § 1396a (f). ↩︎
- The couple rate applies when both individuals qualify for SSI. ↩︎
- $771 for an individual and $1,157 for a couple in 2019. ↩︎
- Section 209 (b) states must allow SSI beneficiaries to establish Medicaid eligibility through a spend-down by deducting unreimbursed out-of-pocket medical expenses from their countable income (described later in this brief). Section 209 (b) states also must provide Medicaid to children who receive SSI and who meet the financial eligibility rules for the state’s Aid to Families with Dependent Children program as of July 16, 1996. 42 U.S.C. § 1396a (f); see also 42 U.S.C. § 1396a (a)(10)(C)(i)(III) and (ii); 42 C.F.R. § 435.121 (d). ↩︎
- The federal SSI rules also include additional disregards for earned income. See Box 1 in the text. ↩︎
- 100% FPL for an individual in 2019 is $1,041/month in the continental U.S. 100% FPL for an individual in Hawaii is $1,163 in 2018, and $1,198 in 2019. ↩︎
- 42 U.S.C. § § 1396a (a)(10)(A)(ii)(X); 1396a (m). ↩︎
- 42 U.S.C. § § 1396a (a)(10)(C); 1396d (a)(iii), (iv), (v). ↩︎
- $500/month for an individual in 2019. States reported a single medically needy income limit across covered populations. ↩︎
- Additionally, four states (CT, LA, VA, and VT) vary medically needy income limits by region to account for variation in cost of living in different geographic areas. ↩︎
- States’ medically needy income limits are so low because they are tied to the Aid to Families with Dependent Children (AFDC) payment levels that were in place in 1996. Federal rules require medically needy income levels to be no higher than 133 1/3% of the state’s maximum AFDC payment level for a family of two without any income or assets as of July 16, 1996. States can raise their medically needy income limits if they increase their TANF income standards, but few states have done so (TANF replaced AFDC in 1996). 42 U.S.C. § § 1396b (f)(1)(B)(i); 1396u-1 (b), (f)(3). ↩︎
- $771/month in 2019. ↩︎
- Unless the state had a Section 1115 waiver that used cost savings to expand coverage. ↩︎
- $1,436/month for an individual in 2019. ↩︎
- For more information on medically needy eligibility and how to calculate spend down, see Kaiser Family Foundation, The Medically Needy Program: Spending and Enrollment Update (Dec. 2012), https://modern.kff.org/medicaid/issue-brief/the-medicaid-medically-needy-program-spending-and/. ↩︎
- Another four states report using one or six months, with two of those states (VA and VT) specifying that a six month period is used for individuals living in the community. ↩︎
- An antiquated term in the statute. ↩︎
- $2,313/month for an individual in 2019. ↩︎
- 42 U.S.C. § 1396a (e)(3); 42 C.F.R. § 435.225. ↩︎
- La. H.B. 199 Enrolled (2019 Regular Session), http://www.legis.la.gov/legis/BillInfo.aspx?s=19RS&b=HB199&sbi=y; La. Legislative Fiscal Office Fiscal Note on HB 199 Re-Engrossed with Senate Committee Amendments (May 31, 2019), http://www.legis.la.gov/legis/ViewDocument.aspx?d=1140097. ↩︎
- For more about HCBS waivers, see Kaiser Family Foundation, Medicaid Home and Community-Based Services Enrollment and Spending (April 2019), https://modern.kff.org/medicaid/issue-brief/medicaid-home-and-community-based-services-enrollment-and-spending/; Kaiser Family Foundation, Key State Policy Choices About Medicaid Home and Community-Based Services (April 2019), https://modern.kff.org/medicaid/issue-brief/key-state-policy-choices-about-medicaid-home-and-community-based-services/; Kaiser Family Foundation, Key Questions About Medicaid Home and Community-Based Services Waiver Waiting Lists (April 2019), https://modern.kff.org/medicaid/issue-brief/key-questions-about-medicaid-home-and-community-based-services-waiver-waiting-lists/. ↩︎
- CMS, TennCare II Special Terms and Conditions, #11-W-00151/4 at paragraph 20 and Table 1a (Dec. 16, 2016-June 30, 2021), https://www.medicaid.gov/Medicaid-CHIP-Program-Information/By-Topics/Waivers/1115/downloads/tn/tn-tenncare-ii-ca.pdf. As of October-December 2018, Tennessee covered just under 1,600 children in this pathway. TennCare II, Section 1115 Quarterly Report for the period October – December 2018, Table 2, p. 3 (EG7E Expan Child, Type 3 Demonstration Population), https://www.medicaid.gov/Medicaid-CHIP-Program-Information/By-Topics/Waivers/1115/downloads/tn/TennCare-II/tn-tenncare-ii-qtrly-rpt-oct-dec-2018.pdf. Those with income less than 211% FPL are covered with CHIP funds. ↩︎
- This pathway covers children up to age 21 and also includes children who do not currently meet, but are at risk of meeting, an institutional level of care. TennCare II Special Terms and Conditions, supra. n.28 at paragraph 22 (f), p. 36 and Table 2c. ↩︎
- Tenn. General Assembly, Amendments No. 1-1 and 2 to H.B.0498, http://wapp.capitol.tn.gov/apps/BillInfo/Default.aspx?BillNumber=SB0476. ↩︎
- Tenn. General Assembly Fiscal Review Committee, Fiscal Memorandum HB 498-SB 476 (April 29, 2019), http://wapp.capitol.tn.gov/apps/BillInfo/Default.aspx?BillNumber=SB0476. ↩︎
- 42 U.S.C. § § 1396a (a)(10)(A)(ii)(XIX); 1396a (cc)(1). 300% FPL is $5,333/month for a family of three in 2019. ↩︎
- Under Massachusetts’ waiver, state plan “base populations” include all infants under age one (based solely on income) through 200% FPL and children with disabilities under age 19 through 150% FPL. Waiver expansion populations include “higher income children with disabilities” with no income limit. CMS Special Terms and Conditions, MassHealth Medicaid Section 1115 Demonstration, #11-W-00030/1,Table A, p. 10, 16, 21 (approved July 1, 2017-June 30, 2022, amended June 27, 2018), https://www.medicaid.gov/Medicaid-CHIP-Program-Information/By-Topics/Waivers/1115/downloads/ma/ma-masshealth-ca.pdf. ↩︎
- $267/month for a family of three at 300% FPL in 2019. ↩︎
- MassHealth Medicaid Section 1115 Demonstration, supra. n. 33 at 21. Monthly premiums are $12 for 151-200% FPL, $20 for 201-250% FPL, $28 for 251-300% FPL, and at higher amounts for those above 300% FPL. MassHealth CommonHealth at p. 30-31, https://www.mass.gov/files/documents/2016/07/my/aca-1-english-mb-mh-commonhealth.pdf. ↩︎
- 42 U.S.C. § § 1396a (a)(10)(A)(ii)(XV), (XVI); 1396o (g). ↩︎
- See, e.g., Kaiser Family Foundation, Benefits and Cost-sharing for People with Disabilities in Medicaid and the Marketplace (Oct. 2014), https://modern.kff.org/medicaid/issue-brief/benefits-and-cost-sharing-for-working-people-with-disabilities-in-medicaid-and-the-marketplace/. ↩︎
- $2,602/month for an individual in 2019. ↩︎
- $833/month for an individual in 2019. ↩︎
- One state, AR, did not respond to this survey question. ↩︎
- 42 U.S.C. § 1396a (a)(10)(A)(ii)(XXII). ↩︎
- Indiana offers Section 1915 (i) services targeted to multiple populations with mental illness (differentiated by age) and uses Section 1915 (i) as an independent pathway to Medicaid eligibility for one of these populations. Findings in this section have been supplemented by data reported from KFF’s annual Medicaid HCBS survey. See Kaiser Family Foundation, Key State Policy Choices About Medicaid Home and Community-Based Services (April 2019), https://modern.kff.org/medicaid/issue-brief/key-state-policy-choices-about-medicaid-home-and-community-based-services/. ↩︎
- Physical health diagnoses include HIV/AIDS, cancer, sickle cell anemia, hemophilia, immune deficiency, cystic fibrosis, end stage renal disease, and previous transplant. Ohio #17-017 § 1915 (i) State plan HCBS (effective June 1, 2017, approved Aug. 23, 2017), https://www.medicaid.gov/State-resource-center/Medicaid-State-Plan-Amendments/Downloads/OH/OH-17-017.pdf. ↩︎
- Section 1915 (i) allows states to offer HCBS as part of their Medicaid state plan benefit package instead of through a waiver. ↩︎
- Kaiser Family Foundation, Status of State Action on the Medicaid Expansion Decision (May 13, 2019). ↩︎
- 17of 37: AZ, AR (covers seniors only), CA, DC, HI, IL, IN, ME, MA, MI, MN, NE, NJ, PA, RI, UT, and VA. ↩︎
- 4 of 14: FL, NC, OK, and SC. ↩︎
- 17 of 37: AR, CA, CT, DC, HI, IL, IA, KY, LA, ME, MD, MA, MI, MN, MT, NE, NH, NJ, NY, ND, PA, RI, UT, VT, VA, WA, and WV. ↩︎
- 5 of 14: FL, GA, KS, NC, and WI. (TN and TX cover medically needy pregnant women and children but not seniors and people with disabilities.) ↩︎
- 16 of 37: AK, CO, DE, DC, ID, IA, ME, MA, MN, NE, NV, NH, NY, RI, VT, and WV. ↩︎
- Excludes states with Katie Beckett-like waivers, in which enrollment can be capped. ↩︎
- 5 of 14: GA, MS, OK, SC, and SD. ↩︎
- 36 of 37, all except HI. ↩︎
- 9 of 14; all except AL, MO, OK, SC, and TN. ↩︎
- Kaiser Family Foundation, Medicaid Home and Community-Based Services Enrollment and Spending (April 2019), https://modern.kff.org/medicaid/issue-brief/medicaid-home-and-community-based-services-enrollment-and-spending/. ↩︎
- In Olmstead, the Supreme Court held that the unjustified institutionalization of people with disabilities violates the Americans with Disabilities Act. Kaiser Family Foundation, Olmstead’s Role in Community Integration for People with Disabilities Under Medicaid: 15 Years After the Supreme Court’s Olmstead Decision (June 2014), https://modern.kff.org/medicaid/issue-brief/olmsteads-role-in-community-integration-for-people-with-disabilities-under-medicaid-15-years-after-the-supreme-courts-olmstead-decision/. ↩︎
- $2,313/month for an individual in 2019. ↩︎
- Those in institutions must have resided there for at least 30 days. 42 U.S.C. § 1396a (a)(10)(ii)(V) and (VI). ↩︎
- States also use § 1915 (c) and § 1115 waivers to expand financial eligibility for HCBS. See generally Kaiser Family Foundation, Medicaid Home and Community-Based Services Enrollment and Spending (April 2019), https://modern.kff.org/medicaid/issue-brief/medicaid-home-and-community-based-services-enrollment-and-spending/; Kaiser Family Foundation, Key State Policy Choices About Medicaid Home and Community-Based Services (April 2019), https://modern.kff.org/medicaid/issue-brief/key-state-policy-choices-about-medicaid-home-and-community-based-services/. ↩︎
- See Miller v. Ibarra, 746 F. Supp. 19 (D. Colo. 1990). ↩︎
- This option is not available in medically needy states unless they do not offer nursing facility services to medically needy populations. 42 U.S.C. § 1396p (d)(4)(B). ↩︎
- CO reports unspecified regional caps. MS caps trust income for those in institutions at the nursing facility private pay rate and at $3,035 for those receiving HCBS. MO reports that caps vary. ↩︎
- 42 U.S.C. § 1396p (d)(4)(A). ↩︎
- 42 U.S.C. § 1396p (d)(4)(C). ↩︎
- Two other states (CT and MO) have cap policies that vary by program. ↩︎
- One state (Hawaii) reported that its ABLE program was enacted but not yet active. For more information about ABLE Accounts, see generally CMS, State Medicaid Director Letter #17-002, Implications of the ABLE Act for State Medicaid Programs (Sept. 7, 2017), https://www.medicaid.gov/federal-policy-guidance/downloads/smd17002.pdf. Two states (AK and ID) did not respond to this question. ↩︎
- Income earned in ABLE accounts generally is not subject to federal income tax, similar to Section 529 college savings accounts. 26 U.S.C. § 529A. A person with a disability may open an account in the ABLE program in their state of residence or in another state, if permitted by that state’s program; the majority of state ABLE programs allow out-of-state enrollment. ABLE National Resource Center, Step #5 –How Do I Enroll? (last accessed May 8, 2019), http://ablenrc.org/step-5-how-do-i-enroll. ↩︎
- $12,490/year for an individual in 2019. ↩︎
- See generally IRS, ABLE Accounts – Tax Benefit for People with Disabilities (Feb. 4, 2019), https://www.irs.gov/government-entities/federal-state-local-governments/able-accounts-tax-benefit-for-people-with-disabilities. ↩︎
- This amount is based on state tax laws. ↩︎
- 80 Fed. Reg. 35602, 35608 (June 22, 2015), https://www.govinfo.gov/app/details/FR-2015-06-22/2015-15280. ↩︎
- $585,000 minimum and $878,000 maximum in 2019. ↩︎
- 42 U.S.C. § 1396a (q). ↩︎
- 42 C.F.R. § 435.726. States use different methodologies to determine the monthly maintenance needs allowances for HCBS beneficiaries. For example, Maryland allows individuals to deduct housing costs from income. Most states allow individuals to deduct their uncovered medical bills from income. ↩︎
- Except for seniors. ↩︎
- Such individuals are eligible for Medicaid by reason of a Section 1915 (c) HCBS waiver because they would be eligible under the Medicaid state plan if institutionalized, meet an institutional level of care, and would be institutionalized if not receiving waiver services. 42 U.S.C. § 1396a (a)(10)(A)(ii)(VI). They sometimes are referred to as the “217-group,” because they are described in 42 C.F.R. § 435.217. ↩︎
- 42 C.F.R. § 435.726 (c). ↩︎
- Same amount through June 2019. While the community spouse maximum income maintenance allowance and minimum and maximum asset allowances are adjusted each January, the community spouse minimum monthly maintenance needs allowance is adjusted as of July 1st. CMCS Informational Bulletin, Updated 2019 Spousal Impoverishment Standards (May 30, 2019), https://www.medicaid.gov/federal-policy-guidance/downloads/cib053019.pdf . Most states reported this amount as $2,058, but CMS lists the federal minimum as $2,057.50. Starting July 2019, $2,113.75 per month for all states except Alaska and Hawaii. $2,641.25 per month in Alaska and $2,432.50 per month in Hawaii. ↩︎
- $3,160.50 per month in 2019. ↩︎
- 42 U.S.C. § 1396r-5 (a)(1). The rules permit (and sometimes require) that a married individual seeking Medicaid LTSS whose spouse is not institutionalized is treated differently for financial eligibility purposes from other individuals seeking Medicaid LTSS. 42 U.S.C. § 1396r-5 (a)(2). For more information, see Kaiser Family Foundation, Potential Changes to Medicaid Long-Term Care Spousal Impoverishment Rules: States’ Plans and Implications for Community Integration (Feb. 2019), https://modern.kff.org/report-section/potential-changes-to-medicaid-long-term-care-spousal-impoverishment-rules-states-plans-and-implications-for-community-integration-issue-brief/. ↩︎
- $126,420 in 2019. ↩︎
- $25,284 in 2019. ↩︎
- Data in this paragraph and the following paragraph were previously reported in Kaiser Family Foundation, Potential Changes to Medicaid Long-Term Care Spousal Impoverishment Rules: States’ Plans and Implications for Community Integration (Feb. 2019), https://modern.kff.org/report-section/potential-changes-to-medicaid-long-term-care-spousal-impoverishment-rules-states-plans-and-implications-for-community-integration-issue-brief/. ↩︎
- According to Illinois’ approved waiver documents, Illinois currently applies the rules to 7 of its 9 HCBS waivers: persons with disabilities waiver (approved 7/12/16); elderly waiver (approved 11/1/16); children and adults with I/DD waiver (approved 7/1/17); residential waiver for children and young adults with I/DD (approved 7/1/17); medically fragile children’s waiver (approved 9/1/17); supportive living waiver for seniors and people with disabilities (approved 10/31/17); adult I/DD waiver (approved 12/11/17). This information is not provided for 2 waivers: HIV/AIDS waiver (approved 1/21/14) and brain injury waiver (approved 7/1/17). ↩︎
- Specifically, states could opt to apply the rules to individuals who are eligible for Medicaid by reason of a Section 1915 (c) HCBS waiver, under 42 U.S.C. § 1396a (a)(10)(A)(ii)(VI) (describing individuals who would be eligible under the Medicaid state plan if institutionalized, meet an institutional level of care, and would be institutionalized if not receiving waiver services, sometimes referred to as the “217-group,” because they also are described in 42 C.F.R. § 435.217). 42 U.S.C. § 1396r-5 (h)(1)(A). ↩︎
- Section 2404 also expanded the spousal impoverishment rules to the Section 1915 (i) HCBS state plan option, Community First Choice (CFC) attendant care services and supports, and individuals eligible through a medically needy spend down. ↩︎
- Medicaid Extenders Act of 2019, § 3, Pub. L. No. 116-3 (Jan. 24, 2019), https://www.congress.gov/bill/116th-congress/house-bill/259. ↩︎
- Medicaid Services Investment and Accountability Act of 2019, § 2, Pub. L. No. 116-16 (April 18, 2019), https://www.congress.gov/bill/116th-congress/house-bill/1839/. ↩︎
- After the initial report releasing this data, Kaiser Family Foundation, Potential Changes to Medicaid Long-Term Care Spousal Impoverishment Rules: States’ Plans and Implications for Community Integration (Feb. 2019), https://modern.kff.org/report-section/potential-changes-to-medicaid-long-term-care-spousal-impoverishment-rules-states-plans-and-implications-for-community-integration-issue-brief/, Montana reported that its status changed from “undecided” to “yes.” ↩︎
- AR will apply the rules to its waivers for seniors/adults with physical disabilities and assisted living but not to its waivers for autism and intellectual/developmental disabilities. Waiver approval documents on Medicaid.gov indicate that AR’s excluded waivers do cover the 217-group. ↩︎
- IL plans to apply the rules in full to 1 waiver: supportive living waiver for seniors and adults with physical disabilities (approved 10/23/17). IL plans to apply the rules for financial eligibility but not PETI to 2 waivers: persons with disabilities waiver (approved 7/12/16) and elderly waiver (approved 11/1/16). IL does not plan to apply the rules to 4 waivers: children and adults with I/DD waiver (approved 7/1/17); residential waiver for children and young adults with I/DD (approved 7/1/17); medically fragile children’s waiver (approved 9/1/17); and adult I/DD waiver (approved 12/11/17). This information is not provided in for 2 waivers, neither of which cover the 217-group: HIV/AIDS waiver (approved 1/21/14) and brain injury waiver (approved 7/1/17). ↩︎
- MN plans to apply the rules to its elderly waiver (approved 7/1/18). MN does not plan to apply the rules to its brain injury waiver (approved 6/1/16); community access for disability inclusion waiver (approved 6/1/16;) DD waiver (approved 10/27/17); and community alternative care waiver (approved 4/1/18). ↩︎
- Waiver approval documents on Medicaid.gov indicate that ME’s seven waivers do cover the 217-group. ↩︎
- Dual eligible beneficiaries qualify for both Medicare and Medicaid. All dual eligible beneficiaries qualify for Medicaid assistance with their Medicare out-of-pocket costs through one of the Medicare Savings Programs (MSP) described in this section. Additionally, Medicare beneficiaries who independently qualify for Medicaid through another poverty or disability-related pathway also receive full Medicaid benefits. These “full duals” may receive Medicaid services that Medicare does not cover, such as LTSS, eyeglasses, dental care, or hearing aids. Medicare beneficiaries who qualify only for an MSP are known as “partial duals” and receive Medicaid assistance only with Medicare premiums and/or cost-sharing. See generally Kaiser Family Foundation, Medicaid’s Role for Medicare Beneficiaries (Feb. 2017), https://modern.kff.org/medicaid/issue-brief/medicaids-role-for-medicare-beneficiaries/. ↩︎
- Medicare Part D, which covers prescription drugs, has financial assistance for low-income beneficiaries (the Low-Income Subsidy program) built into the program instead of being available through Medicaid. See generally, Kaiser Family Foundation, An Overview of the Medicare Part D Prescription Drug Benefit (Oct. 2018), https://modern.kff.org/medicare/fact-sheet/an-overview-of-the-medicare-part-d-prescription-drug-benefit/. ↩︎
- $1,364 in 2019. Medicare Part A also requires co-insurance for hospital stays over 60 days. Most Medicaid beneficiaries qualify for Part A without a premium. CMS Fact Sheet, 2019 Medicare Parts A & B Premiums and Deductibles (Oct. 12, 2018), https://www.cms.gov/newsroom/fact-sheets/2019-medicare-parts-b-premiums-and-deductibles. ↩︎
- $135.50 in 2019. Id. ↩︎
- $185 in 2019. Id. ↩︎
- Id. ↩︎
- 42 U.S.C. § 1396d (p). $1,041/month for an individual and $1,409/month for a couple in 2019. ↩︎
- 42 U.S.C. § 1396a (a)(10)(E)(iii). ↩︎
- $1,249/month for an individual and $1,691/month for a couple in 2019. ↩︎
- 42 U.S.C. § 1396a (a)(10)(E)(iv). $1,405/month for an individual and $1,902/month for a couple in 2019. ↩︎
- DC’s effective QMB income limit is 300% FPL ($3,035 per month for an individual in 2018, $3,123/month in 2019) after applying income disregards, which means that all MSP beneficiaries in DC receive QMB premium and cost-sharing assistance, and none are covered in the less generous SLMB or QI programs. ↩︎
- 42 C.F.R. § 435.916 (b); see also Kaiser Family Foundation, The Affordable Care Act’s Impact on Medicaid Eligibility, Enrollment, and Benefits for People with Disabilities (April 2014), https://modern.kff.org/health-reform/issue-brief/the-affordable-care-acts-impact-on-medicaid-eligibility-enrollment-and-benefits-for-people-with-disabilities/. ↩︎
- RI did not respond to either of these survey questions. CT did not respond to the reconsideration period question. ↩︎
- AR elects this option only for MSP pathways. RI did not respond to this question. ↩︎
- Compare Appendix Table 10 with Kaiser Family Foundation, Medicaid and CHIP Eligibility, Enrollment, and Cost Sharing Policies as of January 2019: Findings from a 50-State Survey, Table 13, (March 2019), https://modern.kff.org/medicaid/report/medicaid-and-chip-eligibility-enrollment-and-cost-sharing-policies-as-of-january-2019-findings-from-a-50-state-survey/. ↩︎
- NM offers a reconsideration period for waivers only. CT and RI did not respond to this question. ↩︎
- 42 C.F.R. § 435.916 (a)(3). ↩︎
- 84 Fed. Reg. 19961-19963 (May 7, 2019), https://www.federalregister.gov/documents/2019/05/07/2019-09106/request-for-comment-on-the-consumer-inflation-measures-produced-by-federal-statistical-agencies. ↩︎