Coloradans’ Perspectives on Health, Quality of Life, and Midterm Elections
Executive Summary
The Kaiser Family Foundation and Colorado Health Foundation collaborated to conduct a survey of Coloradans examining a wide range of issues leading into the 2018 midterm elections, with special attention to health care and housing.
Poll: Colorado Voters’ Top Issues for Gubernatorial Race Are Education, Health Care and Housing
KFF has been tracking the role of health care throughout the 2018 election cycle, and Colorado, with an open gubernatorial election and many contested congressional races, provides unique insight into how the issue may play out next month. Similar to KFF national polling, the affordability of health care is among the top issues for Colorado voters. One-fifth of voters say health care is the top issue for the 2018 gubernatorial candidates to talk about during their campaigns, with the issue ranking higher for Democratic voters compared to independent voters or Republican voters. When voters are asked what explicitly about health care they would like the gubernatorial candidates to discuss, four in ten voters offer health care costs as the most important issue for the candidates to discuss. Health care costs outrank all other health care issues by a margin of at least four to one.
In Colorado and nationally, KFF polling has found that Democrats have an edge when it comes to voter enthusiasm in the upcoming elections. In Colorado, while Democrats have a slight edge in voter enthusiasm when it comes to the gubernatorial election, they have a stronger edge in the congressional elections. Nearly half of Democratic voters in Colorado say they are “more enthusiastic” about voting in the Congressional election this year than previous elections compared to smaller shares of Republican voters and independent voters. In addition, Coloradans’ midterm voting intentions appear to be largely driven by views on President Trump, with substantial shares of voters saying a candidate’s support for or opposition to President Trump will make the biggest difference in their 2018 vote choice.
Most Coloradans See the State’s Economy as Improving, But View Health Care and Housing Costs as Getting Worse, @KaiserFamFound / @COHealthFDN poll finds
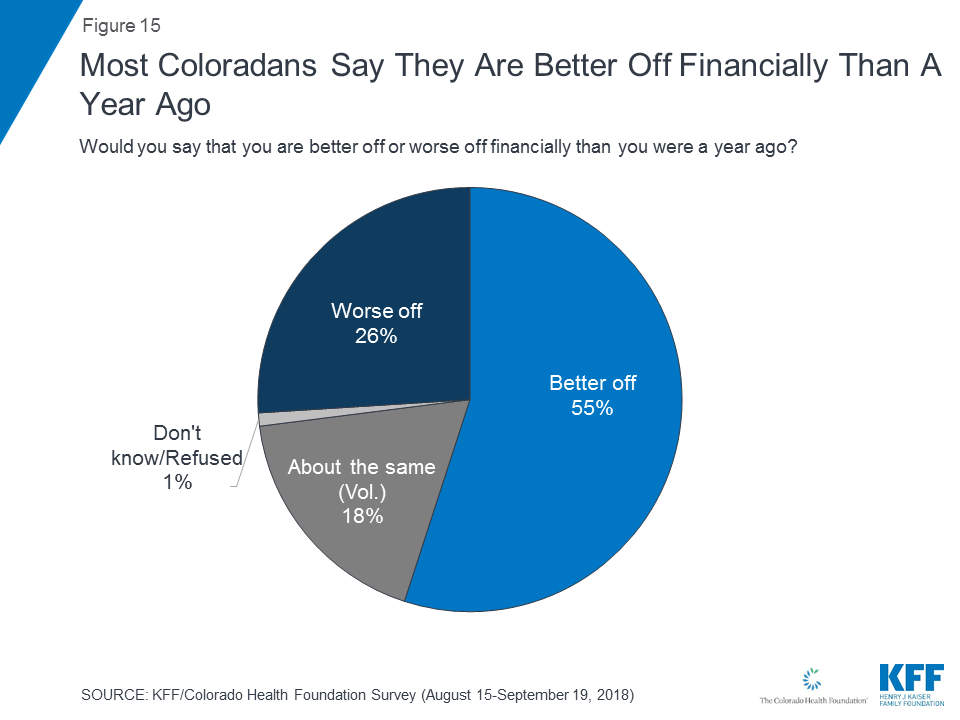
Coloradans generally have a positive outlook for the future of both the state and their own local communities, with majorities saying things are going in the right direction. Perceptions of the economy may be driving these positive attitudes, with six in ten Colorado residents saying the economy and jobs is one area where things in Colorado are getting “better” (including three in ten who say it is getting “much better”) compared to 17 percent who say it is getting “worse.” In addition, slightly more than half of Coloradans (55 percent) say they are personally “better off” financially than they were a year ago, while one-fourth (26 percent) say they are “worse off” and one in five (18 percent) say their financial situation is about the same. Yet, there are some differences among key demographic groups with less than half of those earning less than $40,000 annually and Black residents reporting they are better off financially now than they were a year ago.
Despite this general optimism about the economy, health care and housing affordability weigh heavily on the minds of Coloradans. A majority of Coloradans say housing costs (80 percent), substance abuse (53 percent), and health care costs (55 percent) are areas where things are getting “worse” in Colorado. In addition, half of Coloradans report that over the past few years, it has become harder for people like them to afford their rent or mortgage or afford health care. Majorities of Coloradans say lowering the amount individuals pay for health care and making housing more affordable are at least “very important” for the state government to work on; about a quarter each choose health care costs and affordable housing as the “most important issue” for the Colorado state government.
Moving past the 2018 midterms, nearly three in ten Coloradans are worried that they might lose their home because they cannot afford their monthly housing costs, with a larger share of residents living in the Denver and Boulder areas saying it has become harder for them recently to afford their rent or mortgage than in other regions. In addition, about one-third of Denver and Boulder residents say they are either “very worried” or “somewhat worried” that they might lose their home because they cannot afford the monthly rent or mortgage.
Half of Coloradans say it has gotten harder for people like them to afford health care and this is consistent across key demographic groups, with similar shares of Coloradans, regardless of race/ethnicity, income, or region saying it has gotten harder to afford health care in recent years. Moreover, while about two-thirds of Coloradans say the current Colorado health care system is meeting their family’s needs, one in five say there was a time when they or another family member thought they might need mental health or substance abuse services but did not get them – mainly due to costs.
Key Findings: Section One: 2018 Midterm Elections
Health care is among the top campaign issues for Colorado voters, with one-fifth of voter saying education (21 percent), health care (21 percent), and housing costs (18 percent) are the top issues for the 2018 gubernatorial candidates to talk about. Ranking slightly lower are issues such as the economy and jobs (14 percent), immigration (13 percent), gun policy (11 percent), crime (9 percent), taxes and tax reform (9 percent), and hunger (8 percent).
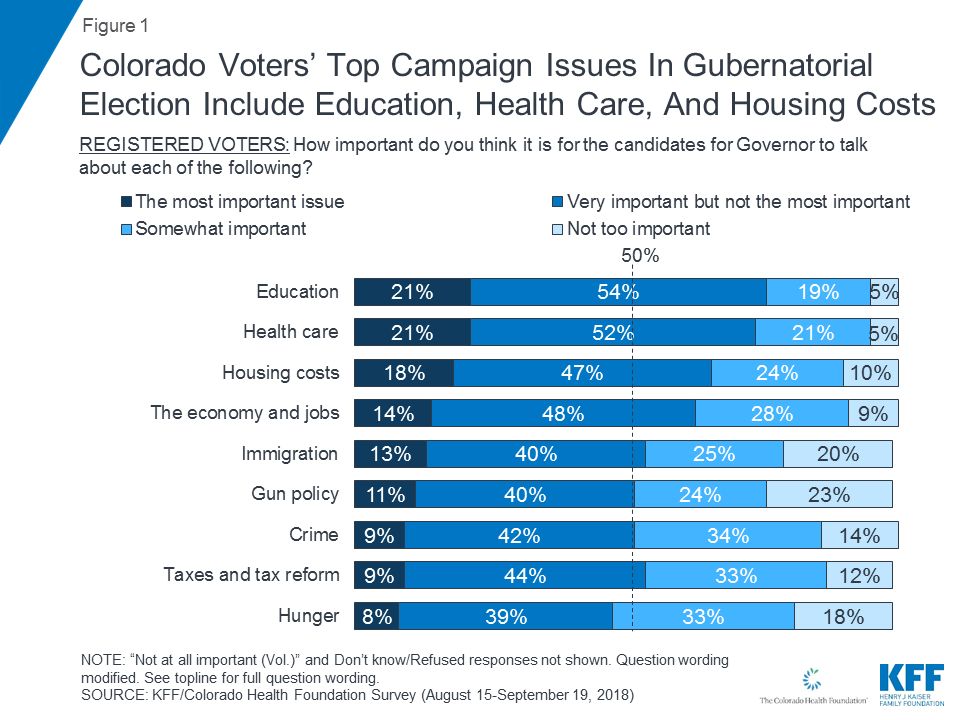
Similar to the national election landscape, health care is among the top issues Democratic voters in Colorado want to hear the gubernatorial candidates discuss while it ranks lower for Republican voters. One-third of Democratic voters say health care is the most important issue for candidates for Governor to talk about during their campaigns, compared to one in five independents (18 percent) and an even smaller share of Republicans (12 percent). The top issues Republican voters want to hear the gubernatorial candidates talk about are immigration (20 percent) and the economy and jobs (17 percent).

When voters are asked what explicitly about health care they would like the gubernatorial candidates to discuss, four in ten (41 percent) voters offer health care costs as the most important issue for the candidates to discuss. Health care costs outrank all other health care issues by a margin of at least four to one.

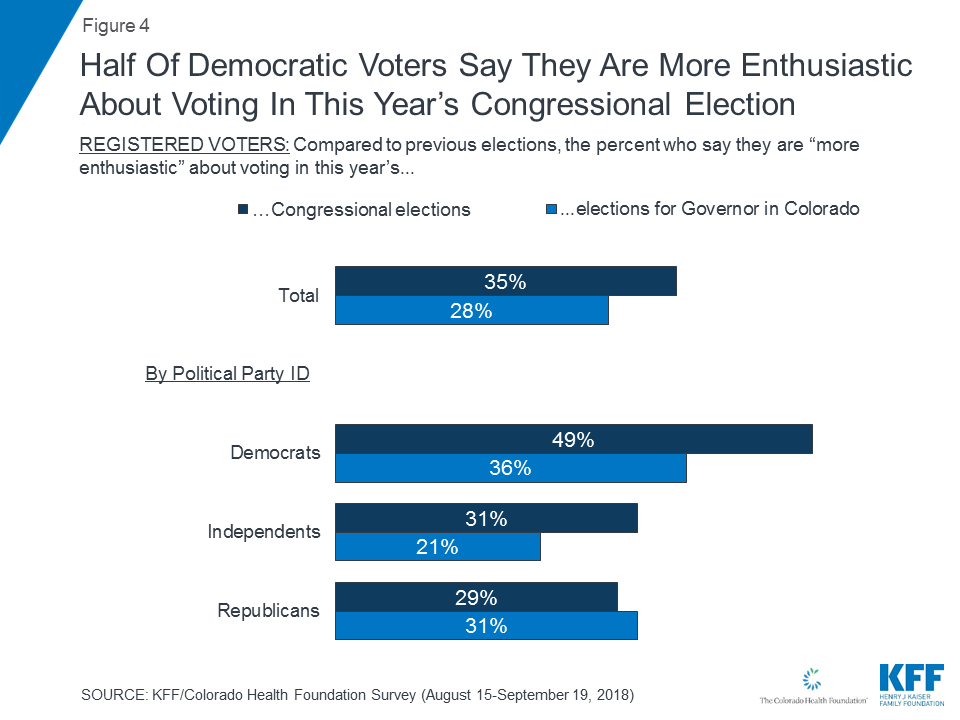
Most voters (59 percent) – including half of Democratic voters (51 percent) and six in ten Republican voters (58 percent) say they are equally as enthusiastic about voting in this gubernatorial election compared to previous ones, while similar shares of Democratic voters (36 percent) and Republican voters (31 percent) say they are “more enthusiastic” about voting this year. Few (about one in ten) voters say they are “less enthusiastic” about voting this year.
While Democrats only have a slight edge when it comes to voter enthusiasm in the gubernatorial election, they have a strong lead in the congressional elections in Colorado. Nearly half of Democratic voters (49 percent) say they are “more enthusiastic” about voting in the Congressional election this year than in previous elections compared to three in ten Republican voters (29 percent) and one-fourth of independent voters (31 percent).
President Trump’s Role in the 2018 Midterm Election
Colorado residents, like the country overall, have polarized opinions of the president with six in ten Coloradans (57 percent) disapproving of the job President Trump is doing while four in ten approve (38 percent).
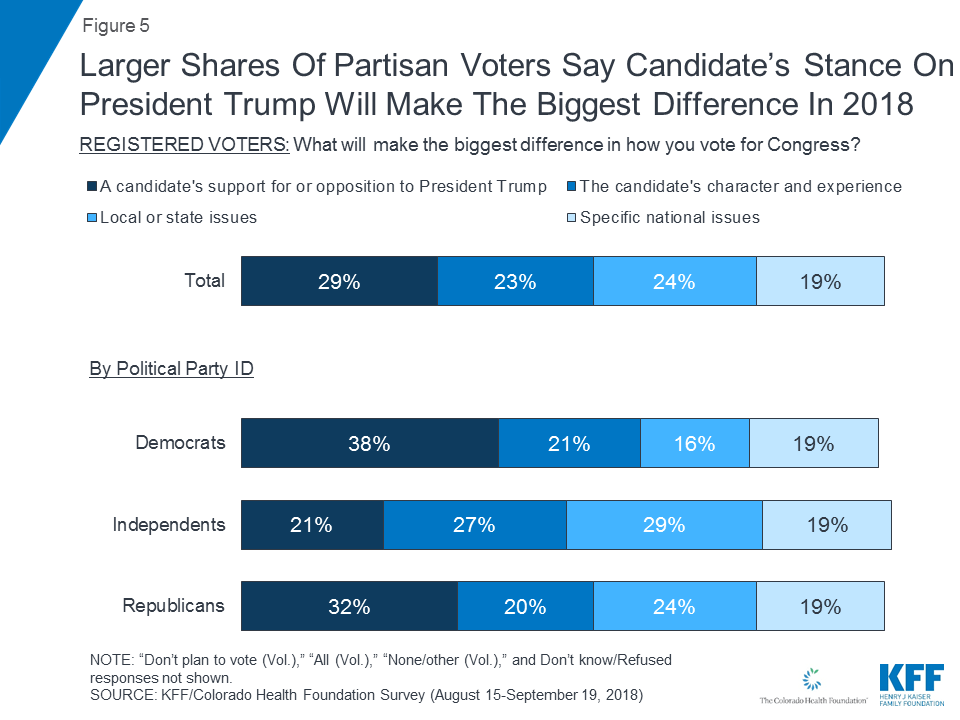
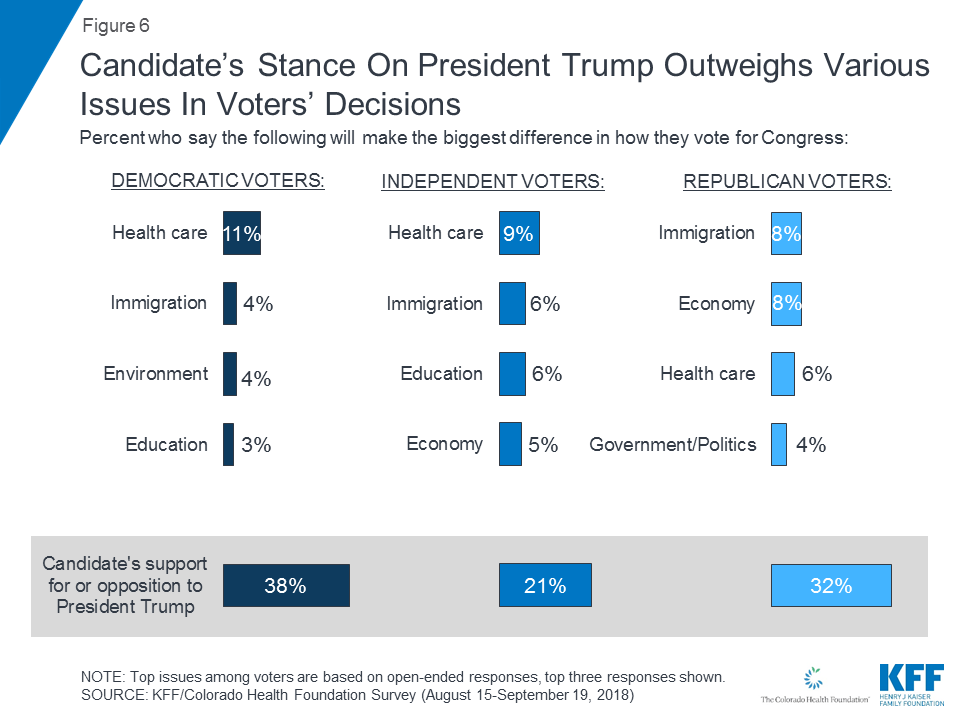
Like most midterm elections, the 2018 election is turning out to be a referendum on President Trump and his agenda. When issues are put up against other voting factors, a larger share of voters say a congressional candidate’s stance on the president will make the biggest difference in how they vote. Three in ten (29 percent) voters say a “candidate’s support for or opposition to President Trump” will make the biggest difference in how they vote for Congress this year, while fewer say “local or state issues” (24 percent), “a candidate’s character and experience” (23 percent), or “specific national issues” (19 percent) will make the biggest difference. Four in ten Democratic voters (38 percent) and nearly one-third of Republican voters (32 percent) say a candidate’s support for or opposition to President Trump will make the biggest difference in their congressional vote choice. Smaller shares – about one five – say either “specific national issues” or “local or state issues” will make the biggest difference. Independent voters are less likely than partisan voters to say “a candidate’s support for or opposition to President Trump” will make the biggest difference (21 percent).
Across all partisans, voters say a candidate’s stance on President Trump will make a bigger difference in how they vote for Congress this year than any specific national, state, or local issue including health care.
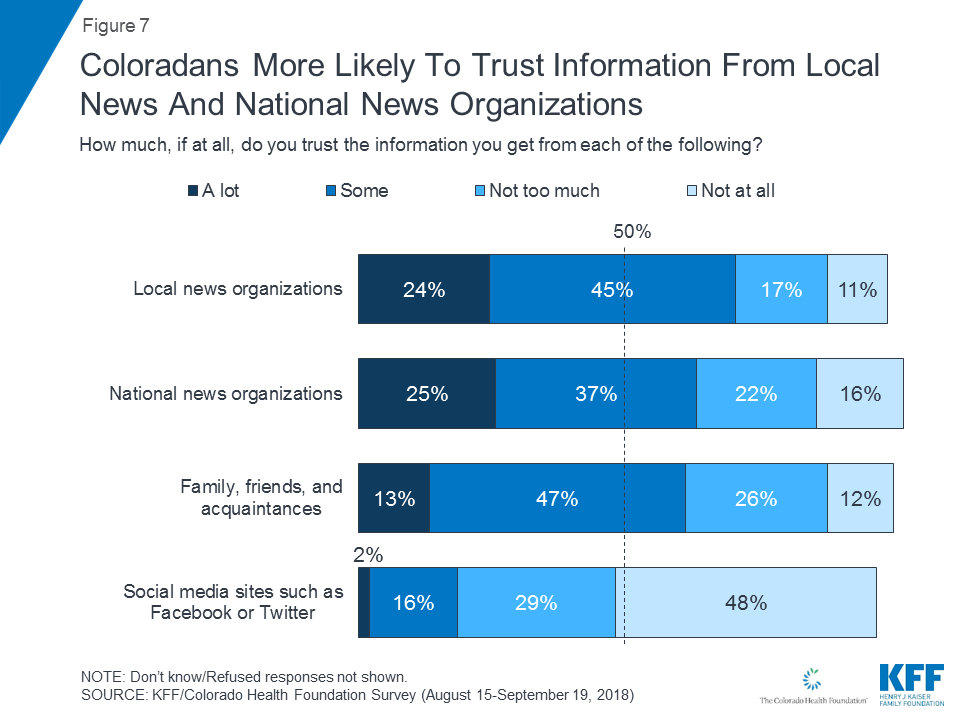
Gearing up for the 2018 midterm elections, more than half of Coloradans say they trust the information they get from local news organizations (69 percent), national news organizations (62 percent), or family and friends (60 percent) at least “some” or “a lot.” Fewer Coloradans trust the information they get from social media sites such as Facebook or Twitter (18 percent).
Key Findings: Section Two: Coloradans’ Outlook And Priorities For State Government
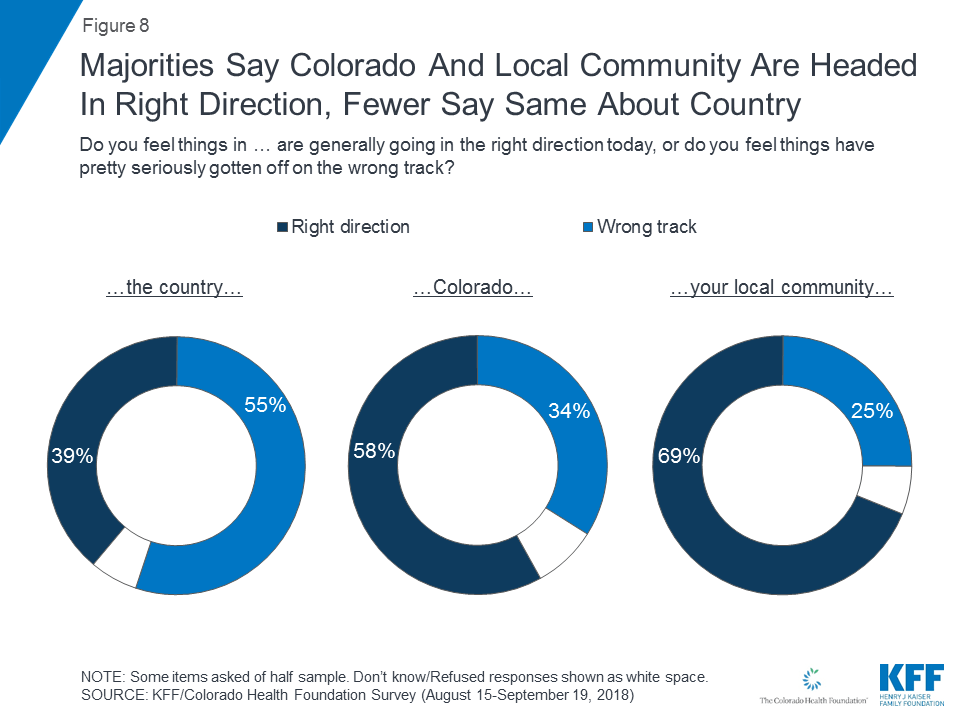
Moving past the midterm elections, Coloradans have a positive outlook for the future of both the state and their own local communities. Six in ten Coloradans (58 percent) say things in Colorado are “generally going in the right direction today” while one-third (34 percent) say things have “pretty seriously gotten off on the wrong track.” Seven in ten (69 percent) say things in their local community are going in the right direction compared to one-quarter who say things are off on the wrong track. These results run somewhat counter to how Coloradans feel about the country generally, where a slight majority (55 percent) say things are off on the wrong track, while four in ten (39 percent) say things are going in the right direction.
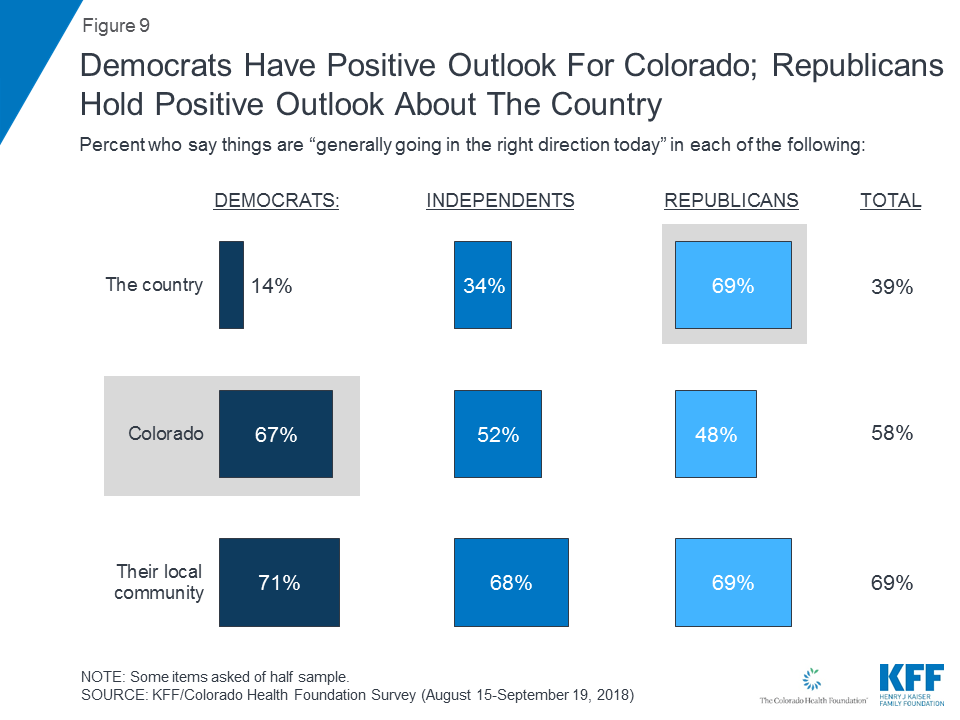
Coloradan’s outlook for their local community, state, and the country are largely driven by partisanship, with most Democrats holding a positive outlook for the state (67 percent) compared to about half of independents (52 percent) and Republicans (48 percent). Republicans, on the other hand, are more positive in their outlook for the country, with seven in ten (69 percent) saying things in the country, generally, are going in the right direction compared to one-third of independents (34 percent) and an even smaller share of Democrats (14 percent). Regardless of partisanship, about seven in ten Coloradans say things in their local community are headed in the right direction.
Coloradans View Economy Improving, Concerns Remain About Housing, Health Care Costs, and Substance Abuse
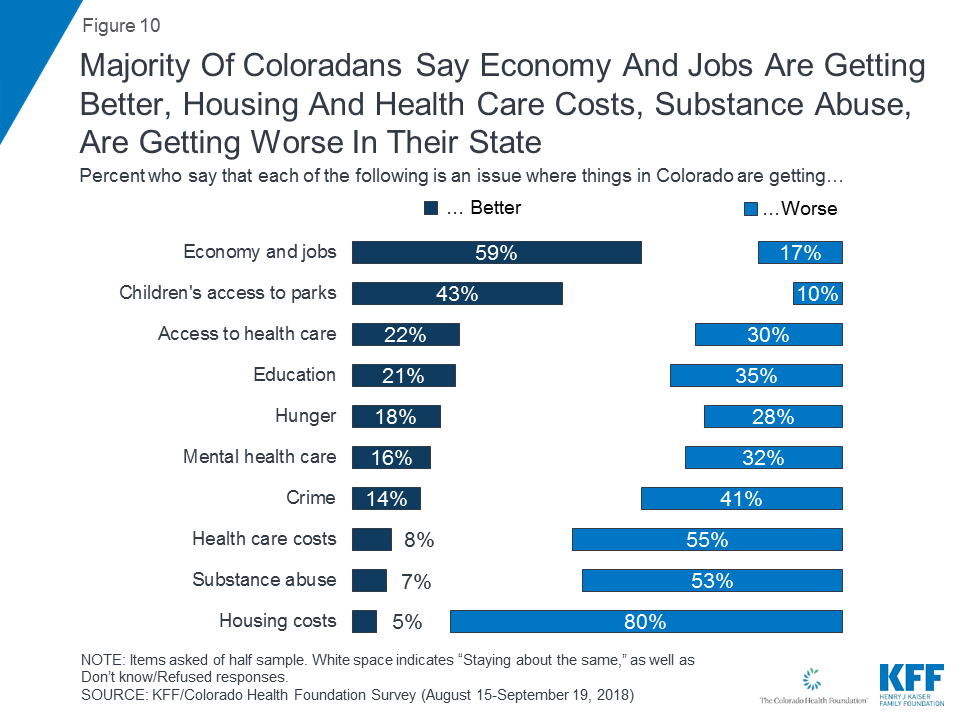
Recent reports have consistently ranked Colorado’s economy as one of the best in the country with an overall unemployment rate well below the national average.1 In fact, six in ten Colorado residents say the economy and jobs is one area where things in Colorado are getting “better” (including about three in ten who say it is getting “much better”) compared to 17 percent who say it is getting “worse.” On the other side, a majority of Coloradans say housing costs (80 percent), substance abuse (53 percent), and health care costs (55 percent) are issues that are getting “worse” in Colorado. In many areas including access to health care, education, hunger, mental health care, and crime, significant shares of Coloradans say things are staying about the same.
Priorities for the State Government
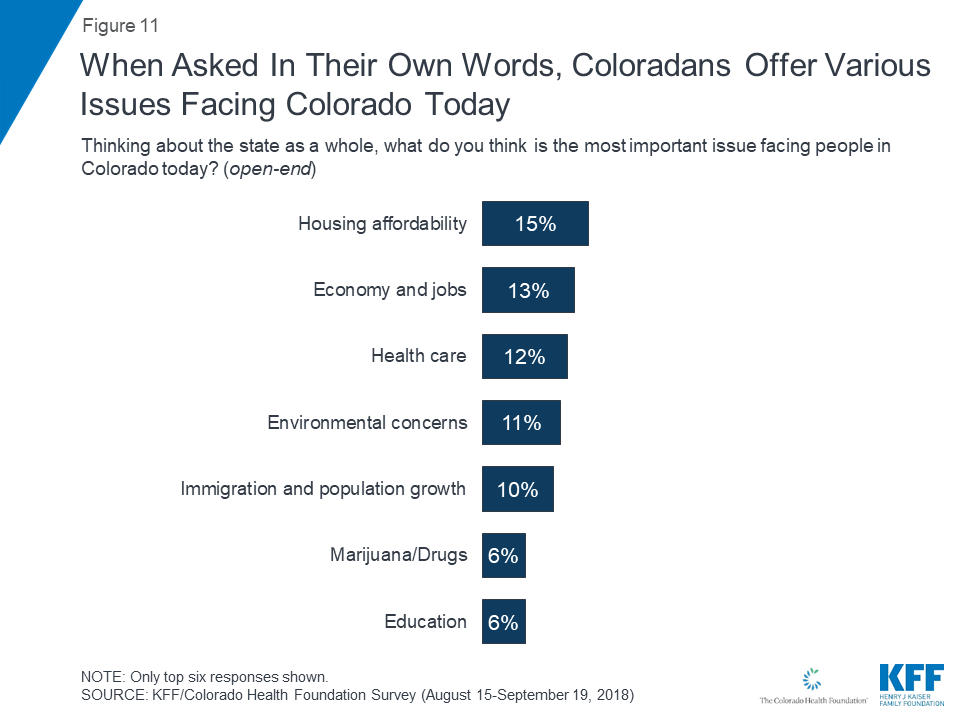
When asked to say in their own words what is the most important issue facing people in the state, Coloradans offer responses touching on a wide range of issues including housing affordability (15 percent), economy and jobs (13 percent), health care (12 percent), environmental concerns (11 percent), and immigration and population growth (10 percent).
Republicans are more likely to offer immigration and population growth (16 percent) as the most important issue facing the state, while Democrats and independents are more likely to offer housing-related issues (16 percent and 17 percent, respectively). Similar to previous KFF national polling, Democrats in Colorado are more likely to offer health care (16 percent) as the most important issue compared to both independents (11 percent) and Republicans (10 percent).
Priorities For State Government
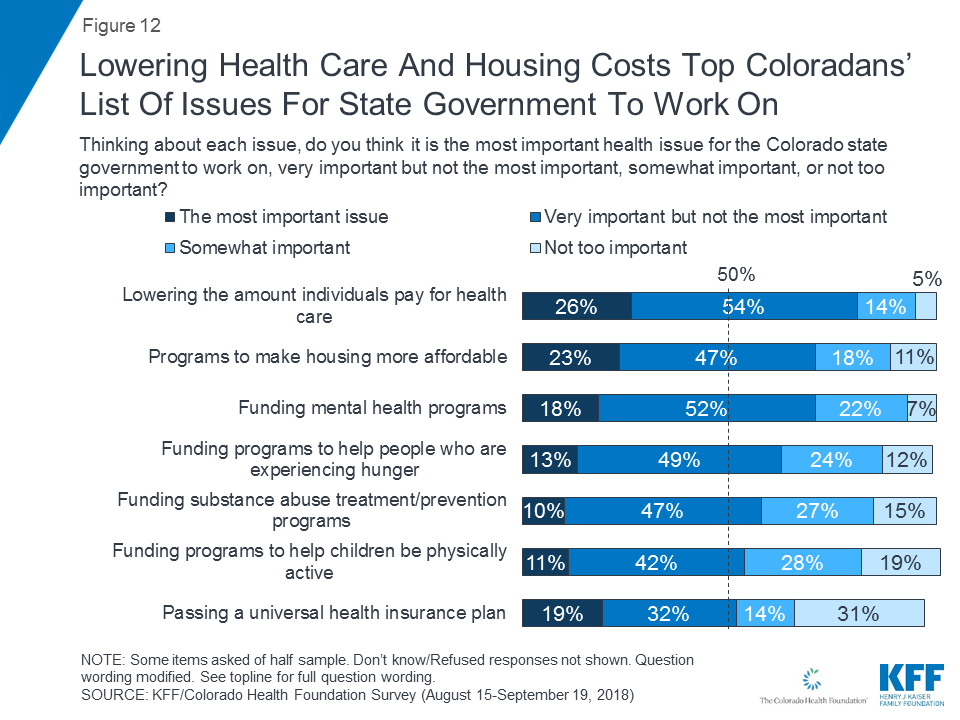
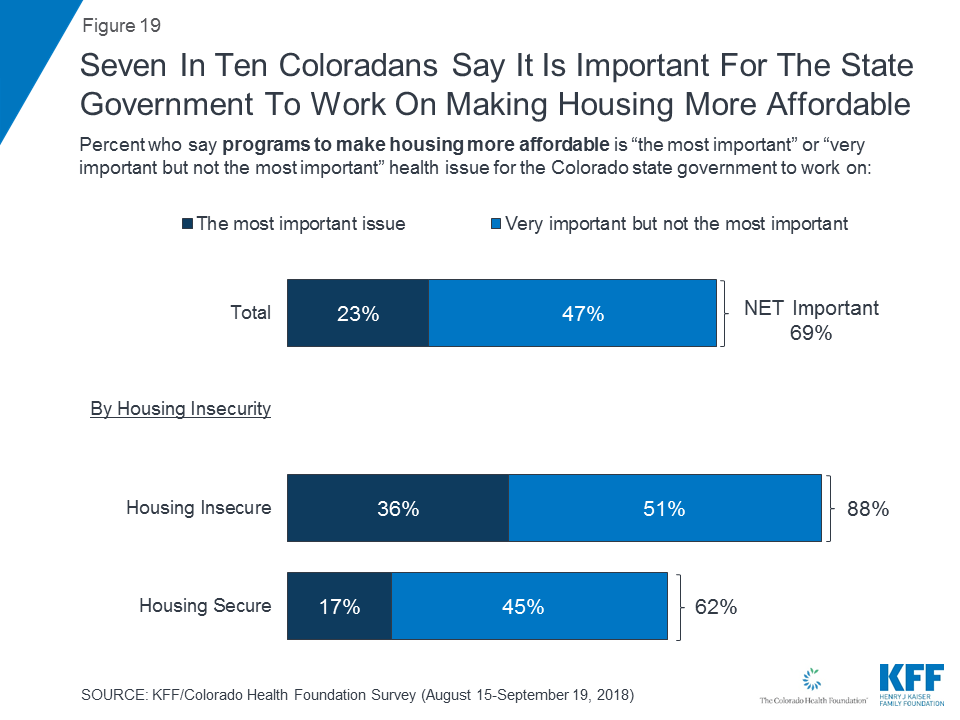
When asked about various things the state legislature might do within health care and other areas, all are seen as important by a majority of Coloradans, with health care affordability rising to the top of the list. Eight in ten Coloradans say lowering the amount individuals pay for health care is the “most important” or a “very important” issue for the state government to work. About seven in ten also say that it is at least “very important” for the Colorado state government to work on programs to make housing more affordable and on funding for mental health programs. Fewer, but still a majority, say the same about funding for programs to help people who are experiencing hunger (62 percent), substance abuse treatment and prevention programs (58 percent), programs to help children be physically active (52 percent), and passing a universal health insurance plan, in which all Colorado residents would get their coverage from a single state government plan (51 percent).
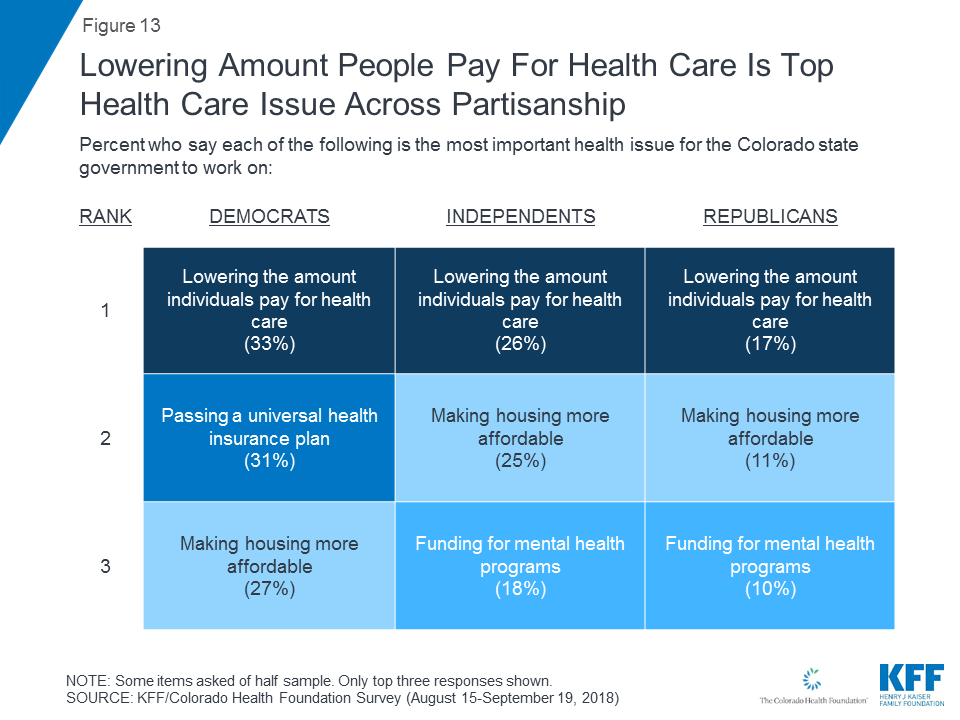
While there are differences in how partisans in Colorado view health care priorities for the state legislature, lowering the amount individuals pay for health care is the top health care issue among Democrats (33 percent), independents (26 percent), and Republicans (17 percent). Democrats also prioritize passing a universal health insurance plan (31 percent), while one in five independents (18 percent) say funding for mental health programs is “the most important health issue” for the Colorado state government to work on. Across most health issues provided, fewer Republicans say they are the “most important” for the state to work on.
Lowering the amount individuals pay for health care ranks among the top issues for the state government to work on across demographic groups such as region2 , race/ethnicity, gender, or self-reported income level. Notably however, half of Black residents (52 percent) say programs to make housing more affordable is the most important issue as do one-third of those earning less than $40,000 annually.
| Table 1: Top Health Care Issues for State Legislature by Key Demographics | |||||||||||
| Percent who say the following is the most important issue for the Colorado state government to work on: | Region | Race/Ethnicity | Self-reported income | ||||||||
| Denver/Boulder | Suburbs | Front Range | Rural | White, Non-Hispanic | Black, Non-Hispanic | Hisp. | <$40k | $40k–$89.9k | $90k+ | ||
| Lowering the amount individuals pay for health care | 30% | 25% | 23% | 28% | 25% | 32% | 29% | 28% | 27% | 23% | |
| Programs to make housing more affordable | 25 | 24 | 19 | 25 | 20 | 52 | 27 | 33 | 25 | 11 | |
| Funding for mental health programs | 20 | 19 | 15 | 18 | 16 | 27 | 22 | 21 | 18 | 14 | |
| Funding for programs to help people who are experiencing hunger | 14 | 14 | 12 | 13 | 11 | 19 | 21 | 21 | 14 | 7 | |
| Funding for substance abuse treatment/prevention programs | 13 | 10 | 10 | 9 | 8 | 22 | 18 | 14 | 9 | 7 | |
| Funding for programs to help children be physically active | 12 | 10 | 10 | 10 | 8 | 22 | 19 | 14 | 11 | 7 | |
| Passing a universal health insurance plan | 21 | 21 | 17 | 18 | 17 | 43 | 21 | 24 | 20 | 14 | |
Key Findings: Section Three: Quality Of Life In Colorado And Affordability Of Housing
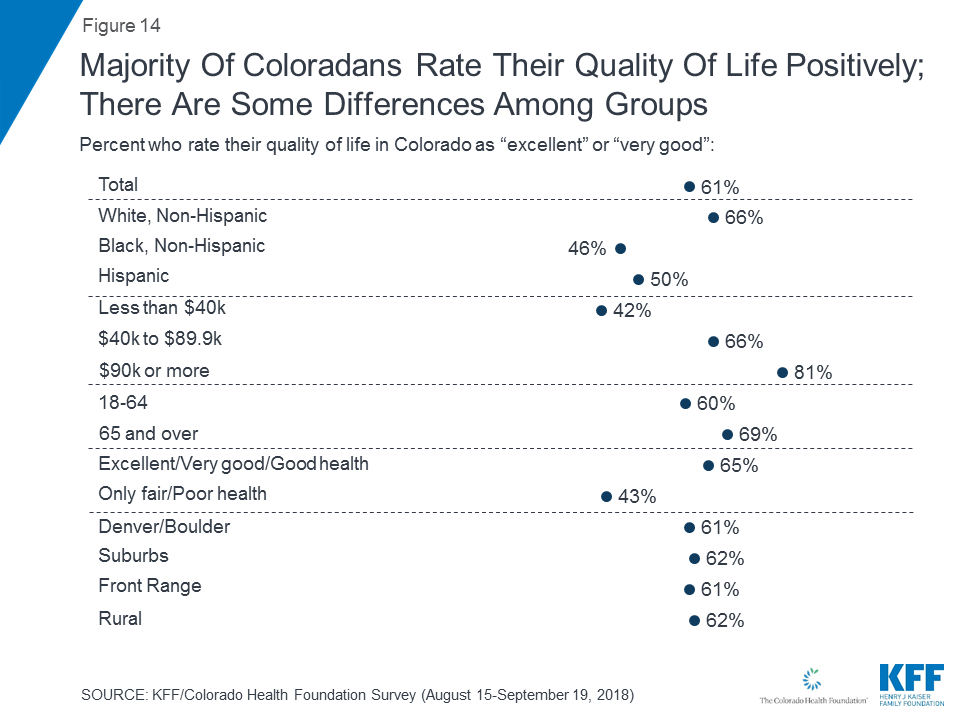
Most Coloradans (61 percent) rate their quality of life as either “excellent” or “very good.” Yet, there are some differences by income and health status with less than half of those earning less than $40,000 annually (42 percent) or in fair or poor health (43 percent) reporting the same.
Similar to perceptions of the state’s economic situation, slightly more than half of Coloradans (55 percent) say they are “better off” financially than they were a year ago, while one-fourth (26 percent) say they are “worse off” and one in five (18 percent) say their financial situation is about the same.
There are some differences among key demographic groups, with about half (47 percent) of individuals who report earning a household income of less than $40,000 annually saying they are “better off” compared to 56 percent of those earning between $40,000 and $89,999 and seven in ten (69 percent) of those earning $90,000 or more annually. In addition, four in ten Black residents report being “better off” compared to larger shares of both white Coloradans (55 percent) and Hispanic residents (59 percent). There are no significant differences by regions of the state.
| Table 2: Personal Economic Situation by Key Demographics | ||||||||||
| Would you say that you are better off or worse off financially than you were a year ago? | Region | Race/Ethnicity | Self-reported income | |||||||
| Denver/Boulder | Suburbs | Front Range | Rural | White, Non-Hispanic | Black, Non-Hispanic | Hispanic | <$40k | $40k–$89.9k | $90k+ | |
| Better off | 55% | 55% | 57% | 53% | 55% | 40% | 59% | 47% | 56% | 59% |
| About the same (Vol.) | 17 | 18 | 18 | 18 | 19 | 22 | 16 | 16 | 19 | 15 |
| Worse off | 27 | 26 | 25 | 28 | 26 | 39 | 24 | 37 | 24 | 16 |
| NOTE: Don’t know/Refused responses not shown. | ||||||||||
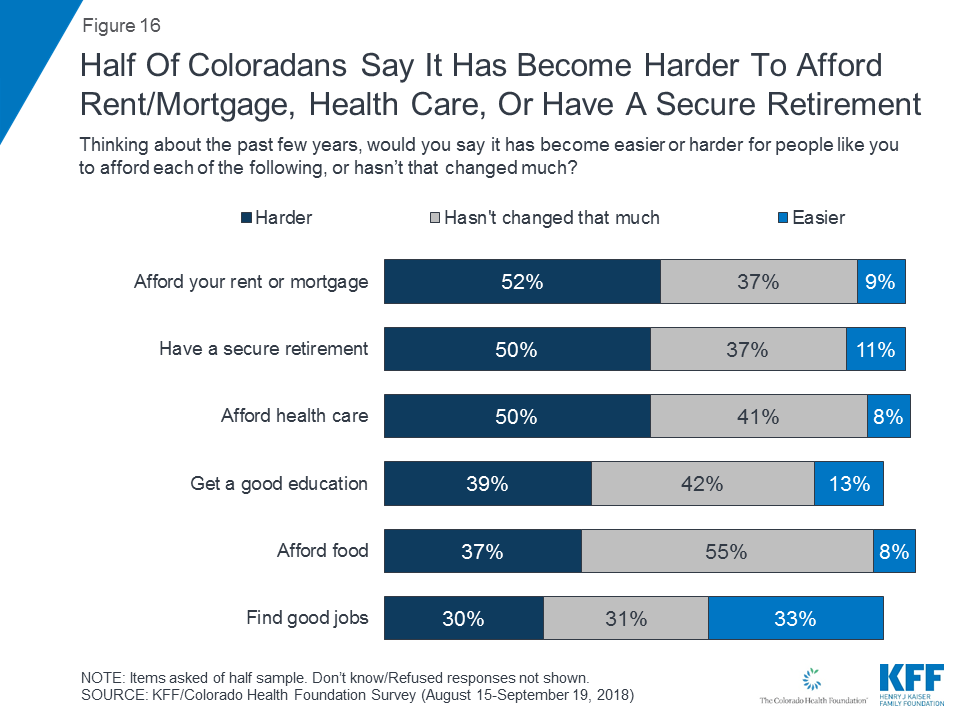
Half of Coloradans report that over the past few years, it has become harder for people like them to afford their rent or mortgage (52 percent), have a secure retirement (50 percent), or afford health care (50 percent). Fewer (about four in ten) say the same about getting a good education or affording food. Three in ten Coloradans (28 percent) say it has become harder to find good jobs.
Increased Concerns over Housing Affordability
Three in ten Coloradans say they are worried that they might lose their home because they cannot afford their monthly housing costs (rent or mortgage), including one in eight (12 percent) who say they are “very worried” and 16 percent who say they are “somewhat worried.” Seven in ten Coloradans are either “not too worried” (23 percent) or “not at all worried” (47 percent) about losing their home over the next year.

Regional Differences In Housing COncerns
Personal concerns about housing affordability appear to be somewhat more prominent in the Denver and Boulder areas compared to other regions of the state. A larger share of residents living in the Denver and Boulder areas say it has become harder for them to afford their rent or mortgage (65 percent) than in other regions. In addition, about one-third (35 percent) of Denver and Boulder residents say they are either “very worried” or “somewhat worried” that they might lose their home because they cannot afford the monthly rent or mortgage.

Individuals who are housing insecure, meaning they are worried about losing their home in the next year because they cannot afford their rent or mortgage, are more likely to say programs to make housing more affordable is a top health issue for the Colorado state legislature to work on. Nine in ten (88 percent) Coloradans who are housing insecure say these programs are either the “most important” or “very important but not the most important” issue for the state to work on compared to six in ten (62 percent) Coloradans who are housing secure.
Key Findings: Section Four: Health Care Concerns Include Affordability, Mental Health And Substance Abuse
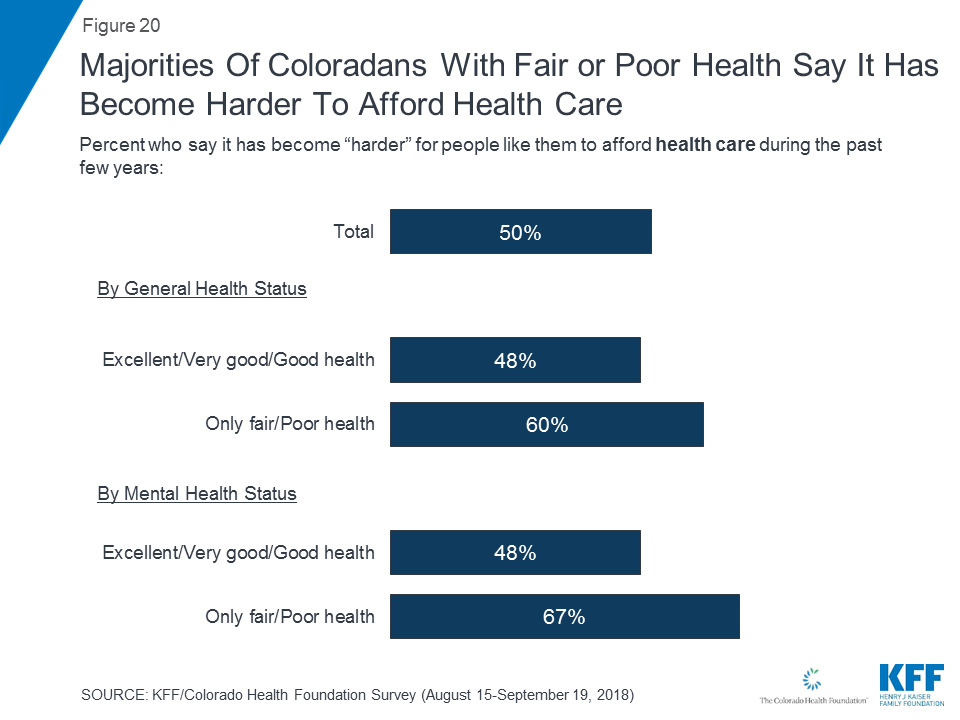
Half of Coloradans say it has gotten harder for people like them to afford health care, and this is consistent across key demographic groups with similar shares of Coloradans, regardless of race/ethnicity, income, or region saying it has gotten harder to afford health care in recent years. Yet, larger shares of individuals who report being in either fair or poor health generally (60 percent) or describe their mental health status as either fair or poor (67 percent), say it has become “harder” to afford health care during the past year.
Moreover, while most Coloradans (65 percent) say their current family’s health care needs are being met, there are some concerns about whether the system is meeting most Coloradans’ health care needs. Nearly equal shares agree (46 percent) and disagree (45 percent) that the current health care system is meeting the needs of most Coloradans. This is consistent with findings from the 2017 Colorado Health Access Survey.

There are some differences in perceptions of the Colorado health care system by region and income. Individuals living in the Front Range region or Rural region are less likely to agree that the current Colorado health care system is meeting their own family’s needs (60 percent and 58 percent, respectively) compared to those living in the Denver and Boulder area (71 percent) or the Suburbs (71 percent). Three-fourths (72 percent) of individuals earning more than $90,000 annually agree the current Colorado health care system is meeting their family’s needs compared to nearly six in ten of those earning less than that.
| Table 3: Perceptions of Colorado Health Care System by Key Demographics | ||||||||||
| Percent who agree that the current Colorado health care system is meeting the needs of… | Region | Race/Ethnicity | Self-reported income | |||||||
| Denver/Boulder | Suburbs | Front Range | Rural | White, Non-Hispanic | Black, Non-Hispanic | Hispanic | <$40k | $40k–$89.9k | $90k+ | |
| …them and their family members | 71% | 71% | 60% | 58% | 64% | 74% | 69% | 63% | 62% | 72% |
| …most Coloradans | 46 | 49 | 44 | 43 | 44 | 50 | 52 | 47 | 45 | 45 |
Consistent with previous health policy research, this survey finds a strong connection between income and self-reported health status. A smaller share of those who earn a household income of less than $40,000 annually report either “excellent” or “very good” health and mental health. Less than half of those earning less than $40,000 report that their general health (38 percent) or their mental health (47 percent) is “excellent” or “very good,” compared to majorities of those earning $40,000 or more annually. Yet, a significant share of these lower-income residents also report that their general health and mental health is “good,” and less than one-third report their health status as either “only fair” or “poor.” Self-perceived general health also differs by race/ethnicity, with four in ten Black and Hispanic residents (40 percent each) saying their health is “excellent” or “very” good compared with almost six in ten white residents (57 percent).
| Table 4: Perceptions of Own Health Status by Key Demographics | ||||||||||
| Percent who say the following is “excellent” or “very good”: | Region | Race/Ethnicity | Self-reported income | |||||||
| Denver/Boulder | Suburbs | Front Range | Rural | White, Non-Hispanic | Black, Non-Hispanic | Hispanic | <$40k | $40k–$89.9k | $90k+ | |
| Their health | 57% | 53% | 51% | 50% | 57% | 40% | 40% | 38% | 56% | 68% |
| Their mental health | 61 | 62 | 67 | 64 | 66 | 63 | 59 | 47 | 67 | 80 |
Mental Health and Substance Abuse
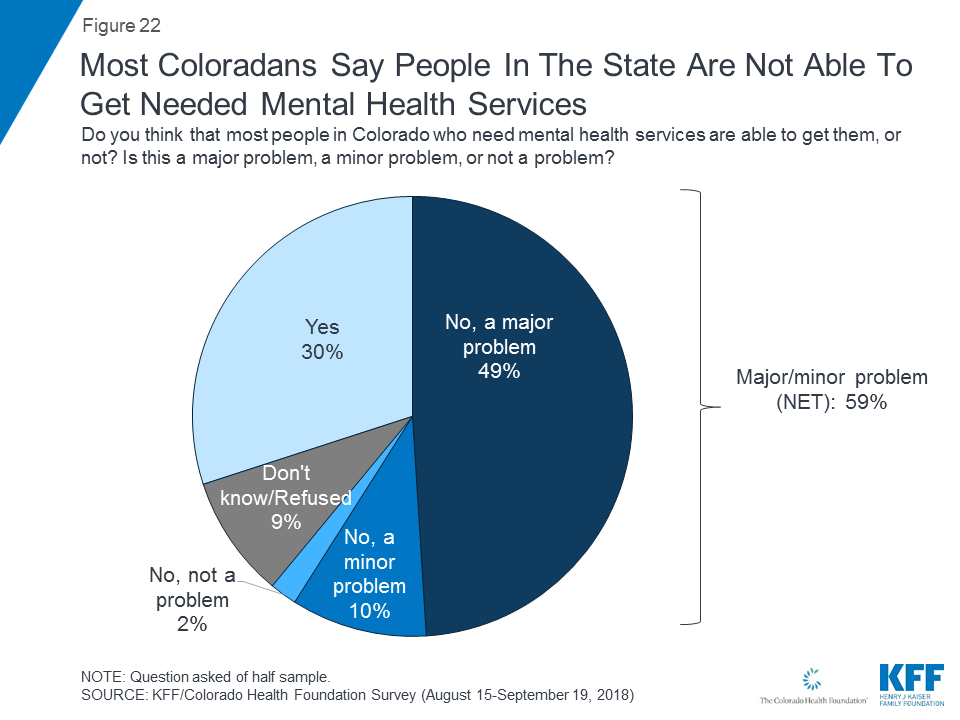
A majority of Coloradans (61 percent) say that most people in the state who need mental health services are not able to get them while three in ten say they are able to get them. Of those who say people in the state are not able to get the mental health services they need, most (59 percent of total) say this is either a “major problem” (49 percent of total) or a “minor problem” (10 percent of total), while few (2 percent of total) say this is “not a problem.”
Fewer – but still four in ten (44 percent) – say most people in Colorado who need substance abuse services are not able to get the services they need. Of these, most (about one-third of total) say this a major problem while one in ten overall (9 percent) say this is a minor problem. Four in ten (43 percent) say they think most people who need these services are able to receive them.

One in five Coloradans say there was a time when they or another family member thought they might need mental health or substance abuse services but did not get them. Individuals say they did not get mental health or substance abuse services because they could not afford the cost (13 percent), insurance would not cover it (11 percent), they were afraid or embarrassed to seek care (9 percent), or they did not know where to get care (8 percent).

Appendices
Appendix A: Survey Methodology
Survey Methodology
The Kaiser Family Foundation and Colorado Health Foundation Coloradans’ Perspectives on Health, Quality of Life and Midterm Elections was conducted by telephone August 15 – September 19, 2018 among a random representative sample of 1,803 adults age 18 and older living in the state of Colorado (note: persons without a telephone could not be included in the random selection process). Interviews were administered in English and Spanish, combining random samples of both landline (584) and cellular telephones (1,219, including 825 who had no landline telephone). Sampling, data collection, weighting and tabulation were managed by SSRS in close collaboration with Kaiser Family Foundation researchers. Colorado Health Foundation paid for the costs of the survey fieldwork, and Kaiser Family Foundation contributed the time of its research staff. KFF researchers led the survey design and analysis with frequent consultation with the CHF team.
The sampling and screening procedures included Registration-Based Sampling (RBS) and re-contact components, both designed to increase the number of registered voters and to specifically increase the number of Hispanic and Black registered voters. The sample included 464 respondents from the Registration-Based Sampling component, using an updated Colorado voter-registration database obtained through Aristotle. It also included 77 respondents who were reached by calling back respondents in Colorado who had previously completed an interview on either the SSRS Omnibus poll or the Kaiser Health Tracking Polls and indicated they fit one of the oversample criteria (either Black respondents or Hispanic registered voters living in Colorado).
The dual frame cellular and landline phone sample was generated by Marketing Systems Group (MSG) using random digit dial (RDD) procedures. All respondents were screened to verify that they resided in Colorado. For the landline sample, respondents were selected by asking for the youngest adult male or female currently at home based on a random rotation. If no one of that gender was available, interviewers asked to speak with the youngest adult of the opposite gender. For the cell phone sample, interviews were conducted with the qualifying adult who answered the phone.
A multi-stage weighting design was applied to ensure an accurate representation of the Colorado adult population. The first stage of weighting involved corrections for sample design, including accounting for the oversampling of registered voters and non-response within the RBS frame, a correction for the oversampling of telephone exchanges known to have higher incidences of Blacks and Hispanics, the likelihood of non-response for the re-contacted sample, and an adjustment to account for the fact that respondents with both a landline and cell phone have a higher probability of selection. In the second weighting stage, demographic adjustments were applied to the RDD sample to account for systematic non-response along known population parameters. Population parameters included gender, age, race, Hispanicity (broken down by nativity), educational attainment, phone status (cell phone only or reachable by landline), and state region. Based on this second stage of weighting, estimates were derived for registration status by race (Black, Hispanic, else) in the Colorado population. The last stage of weighting included RBS and re-contact respondents and included registration status by race based on the previous stage’s outcomes. Weighting parameters were based on estimates from the U.S. Census Bureau’s March 2016 American Community Survey (ACS), and telephone use (cell phone-only, landline-only, dual-user) was based on data for Colorado from the 2016 National Health Interview Survey. A final post-hoc adjustment was included in the weighting procedure to maintain consistency with existing health coverage estimates, based on Kaiser Family Foundation 2016 estimates for adults under 65.
The margin of sampling error including the design effect for the full sample is plus or minus 3 percentage points. For results based on subgroups, the margin of sampling error may be higher. Sample sizes and margins of sampling error for subgroups are available by request. Note that sampling error is only one of many potential sources of error in this or any other public opinion poll. Kaiser Family Foundation public opinion and survey research is a charter member of the Transparency Initiative of the American Association for Public Opinion Research.
| Group | N (unweighted) | M.O.S.E. |
| Total | 1803 | +/- 3 percentage points |
| Democrats | 571 | +/- 5 percentage points |
| Independents | 630 | +/- 5 percentage points |
| Republicans | 434 | +/- 6 percentage points |
| Total voters | 1585 | +/- 3 percentage points |
| Democratic voters | 528 | +/- 5 percentage points |
| Independent voters | 534 | +/- 5 percentage points |
| Republican voters | 404 | +/- 6 percentage points |
Appendix B: Regions of the State
In order to compare responses from different regions of the state, counties were categorized into four different regions: Denver/Boulder, Suburbs, Front Range, Rural. Some counties included in the Front Range category are categorized by the U.S. Census Bureau as “rural,” but for the purpose of this analysis in order to provide a more nuanced breakdown of the geographic area of the state, they were included in the Front Range category.

| Group | N (unweighted) | M.O.S.E. |
| Region | ||
| Denver/Boulder | 346 | +/- 7 percentage points |
| Suburbs | 532 | +/- 5 percentage points |
| Front Range | 625 | +/- 5 percentage points |
| Rural | 300 | +/- 7 percentage points |
Endnotes
- According to the U.S. Department of Labor’s Bureau of Labor Statistics (https://www.bls.gov/eag/eag.co.htm), the unemployment rate in Colorado is 2.9 percent, well below the national average of 3.9 percent. ↩︎
- To see a geographic breakdown of which counties are included in the three regions included in this analysis, see Appendix B. ↩︎