2015 Survey of Health Insurance Marketplace Assister Programs and Brokers
Executive Summary
Executive Summary
Now in second year, a new infrastructure of consumer assistance in health insurance continues to develop. The Affordable Care Act (ACA) provided for new publicly funded consumer assistance entities to help people on an ongoing basis as they apply for health coverage and subsidies and resolve questions and problems with their insurance once covered. Nearly all Marketplace Assistance Programs established for the first year returned this year to continue helping consumers. These assistance professionals have unique insights into how ACA implementation is progressing, what is changing and what challenges remain. How Assister Programs develop in their own right will also likely impact whether consumers can continue to get the help they need.
This report is based on findings from the 2015 Kaiser Family Foundation survey of Health Insurance Marketplace Assister Programs and Brokers. The online survey was conducted from March 31 to May 3, 2015 as the second Open Enrollment period concluded. As was the case last year, Federal and state-operated Marketplaces provided contact information for directors of their Assister Programs, all of whom were invited to participate. Two years of data enable comparison of Assister Programs capacity and experiences from one year to next. This year’s survey also included brokers for the first time. Brokers have traditionally helped consumers enroll in private health insurance coverage. In 2014, many brokers registered to sell coverage through the Marketplace, and nearly all of them returned this year, as well. Returning brokers also offered some observations about how this year compared to the first year, and how it compared to their experience selling non-group coverage prior to ACA.
Ninety-one percent of Assister Programs and 86% of brokers this year had also helped Marketplace consumers last year, and most (82% of Assister Programs and 79% of brokers) who returned said the second open enrollment period went better than the first. In particular, Marketplace websites worked better this year. In 2014, 65% of Assister Programs said most or nearly all consumers sought help, in part, because of technical difficulties with the Marketplace website. This year, 38% of Programs said this was the case. In 2015, more Assister Programs reported they could complete the enrollment process with consumers and see their plan choice (71% vs. 61%) Returning Assister Programs had also gained a year of experience. By comparison, when the first Open Enrollment period began, only 16% of Assister Programs had previously helped consumers enroll in private health insurance.
More than 4,600 Assister Programs served Marketplace consumers in the second year of health reform, collectively employing 30,400 full time equivalent staff and volunteers. The overall number of Assister Programs and staff increased slightly in the second year. Similar to last year, 15% of Assister Programs were Navigators, funded directly by the Marketplace, while Assister Programs in Federally Qualified Health Centers (FQHCs), supported by grants from the Health Resources Services Administration (HRSA), comprised another 25% of total Programs. Certified Application Counselor (CAC) Programs, which are mostly supported by their sponsoring non-profit organizations or foundations and do not typically receive direct government support for assistance activities, comprised 60% of total Programs, and more than 50% of FTE staff. In terms of consumers helped, Navigators and FQHCs provided assistance to the majority of consumers reached during the second open enrollment period. Together, Navigators and FQHCs served 70% of all consumers who received help this year (30% and 40%, respectively), while CACs provided assistance to only 30% of consumers helped.
Assister Programs helped an estimated 5.9 million consumers this year. Returning Programs helped 5.8 million of those, or about 19% fewer than last year. This decline was driven by a large drop in the number of people helped by returning CACs. Collectively, returning Navigator and FQHC Assister Programs this year helped about the same number of consumers they reported helping last year (4 million vs. 4.1 million), while returning CAC Programs helped 1.8 million individuals, 60% of the number they helped last year. These differences suggest that Assister Programs supported by outside grant funding may be in a better position than voluntary Programs to help more consumers and to sustain their capacity over time.
The need for in-person consumer assistance remains substantial. Website improvements notwithstanding, millions of consumers continue to need personalized help to apply for health coverage and subsidies. Seventy-nine percent of Assister Programs this year (and 80% last year) said most or nearly all consumers sought help because they lacked confidence to apply on their own; 82% of Programs this year (83% last year) said most or nearly all consumers needed help understanding their plan choices; 74% of Assister Programs (this year and last year) said most or nearly all consumers needed help understanding basic insurance terms, such as “deductible.” In addition, this year, like last year, most Assister Programs said it took one to two hours, on average, to help each consumer who was new to the Marketplace. Programs said it took somewhat less time, about an hour on average, to help consumers who were returning to renew Marketplace coverage and subsidies.
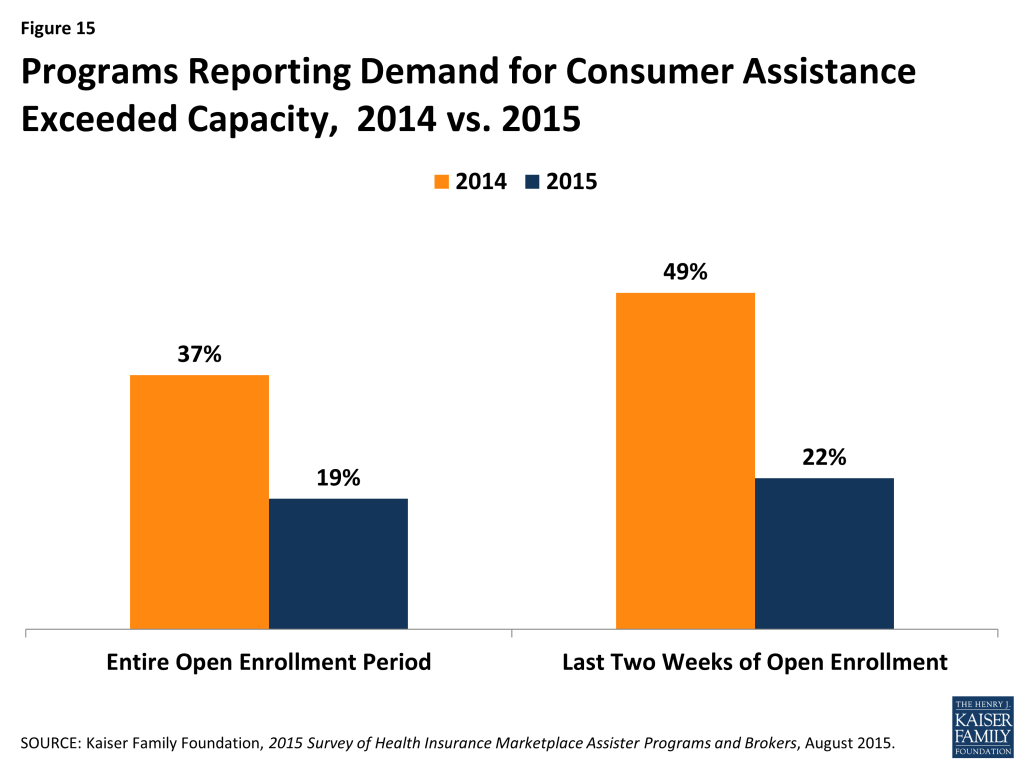
Consumer demand for help exceeded what some Programs could provide this year, though not by as much as last year. About one-in-five Assister Programs reported having to turn away at least some consumers this year. For the Open Enrollment period overall, 19% of Programs said they could not help all who sought assistance; during the final two weeks, 22% said they had to turn at least some consumers away. This contrasts with the first year, when 37% of Programs were stretched beyond capacity during Open Enrollment overall, and nearly half had to turn away at least some consumers during the final two weeks. It appears the availability of Marketplace consumer assistance is aligning with demand; however, additional capacity may still be needed.
In between Open Enrollment periods, returning Assister Programs helped an estimated 630,000 consumers apply for coverage through special enrollment periods, 290,000 consumers report mid-year changes to the Marketplace, and nearly 800,000 consumers resolve post-enrollment problems. The need for consumer assistance is year-round. Changes in work or family status or income during the year mean some people must enroll in coverage outside of Open Enrollment or apply for new or revised subsidies mid-year. Marketplace Assister Programs are tasked with helping consumers at these times as well. In addition, consumers need help once enrolled, including with questions about how to use their new health insurance, or what to do if their provider is not in network, or if a claim is denied. Under the ACA, state ombudsman or Consumer Assistance Programs (CAPs) were established to provide post-enrollment assistance, though CAP funding has not been appropriated since 2010. Most Assister Programs, therefore, try to help Marketplace consumers with their post-enrollment problems, and 69% said they could successfully resolve problems most of the time.
Assister Programs report further improvements are still needed in Marketplace websites and Call Centers, and other technical assistance could be strengthened. Most Marketplace online eligibility systems, especially in FFM states, are not yet integrated with Medicaid, so the single, streamlined application for financial assistance envisioned under the ACA is not yet a reality. As a result, when Marketplaces determine a consumer is likely eligible for Medicaid or CHIP, a new separate application is often required. Sixty-nine percent of Assister Programs will help consumers complete a separate Medicaid application. Most say this can be accomplished during the initial visit, but 45% of Programs say a one or more additional visits are needed, on average, to complete the Medicaid or CHIP application and enrollment process.
Assister Programs also cite the need for better information on health plan choices. Thirty-one percent of Programs this year said it was often or almost always the case that consumers had QHP questions that weren’t answered by information on the Marketplace website. (Last year, 41% of Programs said this was the case.)
Programs also reported that technical assistance from the Marketplace Call Centers can be uneven. Half of Programs who said they reached out to Call Centers for help with translation services said help was effective most or all of the time. Among those who sought technical assistance with immigration questions, tax-related questions, or questions about QHP choices, less than half (41%, 45%, and 39%, respectively) said that Call Center technical assistance was effective most or all of the time.
Coordination among Assister Programs remains an important, but elusive goal. Ninety percent of Assister Programs said coordination with other Programs is somewhat or very important to their effective operation, but just over half of respondents said they seldom if ever coordinate with other Assister Programs. When coordination did take place this year, similar to last year, most often it was initiated by Assisters themselves or by an outside third party, not by the Marketplace.
Funding uncertainty concerns many Assister Programs. Twenty-seven percent of Assister Programs said they are very certain that funding will be available to support them next year, while 39% are not certain at all. Overall, Marketplaces provided fewer funding resources for Assister Programs in the second year. The federally run Marketplace cut funding available for Assister Programs in FFM and FPM states by about 10% this year from $67 million in FY 2014 to $60 million in FY 2015. Many State-based Marketplaces also reduced their Navigator funding from first year levels; in all state-Marketplace funding for Navigators fell by about 15 percent. The Centers for Medicare and Medicaid Services (CMS) has announced $67 million will be available for Navigators in FFM/FPM states in year three – the same amount awarded in year one and a 12% increase over year two funding levels. CMS has also indicated there will be additional, as yet unspecified, funding for Federal Enrollment Assistance Programs (FEAPs), which supplement the work of Navigators in some FFM states, in year three. Many state-based Marketplaces have yet to decide the level of consumer assistance resources they will fund in year three.
Health insurance brokers continue to help many consumers apply for coverage, mostly through Marketplaces. Before the ACA, private health insurance brokers traditionally offered help to consumers seeking non-group coverage, and they continue to play an important role today. Brokers are paid commissions by insurance companies for each policy they sell. Many are certified to sell non-group coverage through the Marketplace, and this year, the survey included Marketplace-certified brokers (referred to simply as “brokers” in this report.) The vast majority of brokers who sold non-group coverage this year had done so during the first Open Enrollment period and prior to 2014, as well. Most (79%) sold non-group coverage both inside and outside of the Marketplace, though on average, brokers helped almost twice as many consumers apply for coverage through the Marketplace compared to outside.
Non-group sales have increased for most brokers since Marketplaces opened in 2014. Sixty percent of brokers say they are selling more non-group coverage today than they did prior to 2014. Most reported it takes more time to sell a policy and the revenue they earn per-policy is less; but 40% earn more income overall from non-group commissions than they did prior to implementation of the Marketplaces and another 20% said their overall non-group commission income is about the same.
Brokers and Assister Programs engage in similar consumer assistance activities, with some differences. Both brokers and Assisters help consumers complete Marketplace applications, compare plan choices, and answer tax-related questions. Both also help consumers with post-enrollment problems. However, compared to Assister Programs, brokers less often engage in public outreach and education activities. Brokers also provide less help to consumers applying for Medicaid and more help to small businesses seeking small-group coverage.
Brokers and Assister Programs appear to serve somewhat different populations. Brokers were less likely than Assister Programs to serve Latinos, consumers who needed language translation help, consumers who lacked Internet service at home, or consumers with incomes low enough to be eligible for Medicaid. Brokers were also less likely than Assister Programs to say that most of their clients were uninsured at the time they sought help. However, returning brokers reported a higher degree of client continuity from year one compared to Assister Programs, indicating they may be establishing more ongoing relationships with their clients than Assister Programs have been able to do so far.
About the Assister Programs and Brokers Described in this Report
Several types of Assister Programs provide outreach and enrollment assistance in the Marketplace.
Navigator refers to Assister Programs that contract directly with State Marketplaces or with federally facilitated Marketplace to provide free outreach and enrollment assistance to consumers. The ACA requires all Marketplaces to establish Navigator Programs and to finance Navigators using Marketplace operating revenue. For the first Open Enrollment, before Marketplaces had received any operating revenue, SBMs were permitted to use federal exchange grant funding to establish similar Programs, called In Person Assisters (IPAs). Now that those state grants have ended, this year’s report does not distinguish between IPAs and Navigators; instead, all Assister Programs funded directly by Marketplaces are referred to as Navigators. CMS provided $60 million for Navigators to work in 34 FFM and FPM Marketplaces in the second year, compared to $67 million in year one.1 SBM states and consumer assistance FPM states provided over $100 million in funding for their IPA and Navigator Programs in year one.2 However, with the termination of federal grant funding to support consumer assistance, overall state spending on these Programs dropped about 15 percent in year two. 3
Certified Application Counselor (CAC) refers to Assister Programs that are recognized by a Marketplace but do not receive funding from a Marketplace. This designation was created prior to the first Open Enrollment – when funding for Marketplace-paid assisters, at least in the FFM, was still uncertain – to ensure that willing volunteer Programs would also be available to help. CACs must be sponsored by an organization that will attest to the Marketplace that all of its individual Assisters meet minimum requirements. CACs also must provide help to consumers free of charge. Under federal rules, CACs are not required to engage in all activities required of Navigators, and they are not required to undergo training as extensive as that required for Navigators. All Marketplaces are required to recognize and certify CAC Programs, and states have flexibility to establish additional rules for CAC Programs. Although not funded by the Marketplace, many CAC Programs received funding from other outside sources.
Federally Qualified Health Center (FQHC) Programs are operated by health centers funded by the Health Resources and Services Administration (HRSA). FQHCs treat patients regardless of ability to pay and, prior to enactment of the ACA, actively helped patients apply for Medicaid, CHIP, or other available coverage. For the first year of ACA implementation, HRSA awarded $208 million to FQHCs to support enrollment assistance. In the second year, HRSA made permanent enrollment assistance grants to FQHCs totaling about $150 million per year. All FQHC Assisters are required to complete at least the level of training required of CACs. About 6% of FQHCs also serve as Navigators and so received Marketplace funding in addition to HRSA grants. For purposes of this report, FQHCs that also receive Marketplace funding are referred to as Navigators.
Federal Enrollment Assistance Program (FEAP) refers to Assister Programs that contracted with CMS to provide supplemental enrollment help within FFM and FPM states in selected communities where large numbers of uninsured individuals reside. Duties and requirements of FEAPs are similar to those of federal Navigators except that FEAPs provide “surge” assistance. Most have rolled back staff and operations since Open Enrollment ended. In this report, unless otherwise indicated, description of findings about Navigators will include FEAPs because the two types are so similar. For the 2015 coverage year, CMS awarded contracts totaling about $29 million to two organizations to establish FEAPs in 10 states. 4 FEAP contracts were initiated for the 2014 plan year with an option for CMS to elect a second year of work. CMS will continue to contract with FEAPs in year three, though the contract amount and work sites have not yet been determined.
Finally, in addition to Marketplace Assister Programs, the ACA authorized creation of state-based ombudsman programs, also called Consumer Assistance Programs, or CAPs. The law requires CAPs to provide outreach and public education and provide enrollment assistance to consumers in the Marketplace. In addition, CAPs must help all state residents resolve questions and disputes with their private health insurance coverage, including helping consumers to appeal denied claims. The ACA requires Marketplace Assisters to refer consumers with post-enrollment problems to state CAPs. The law provided initial funding for states to establish CAPs and 35 were established in 2010. However no new appropriations have been enacted since and most CAPs have not received any new federal funding since 2012.5 Pending additional federal funding, many CAPs remain operational, albeit at reduced levels.
Broker refers to a state-licensed professional who sells private health insurance to individuals and/or businesses. Brokers are sometimes called agents or producers. To sell non-group or small group health plans offered through a state Marketplace, brokers must register with the Marketplace annually, sign a participation agreement, and complete required training. Brokers who sell non-group policies through the Marketplace help consumers complete an application for financial assistance and explain coverage options. Brokers are paid a commission by the health insurance company offering the policy that the consumer selects. Typically insurers pay commissions when a policy is first issued and at renewal for at least several years. Brokers also offer ongoing services to consumers once they’re covered, including help with post-enrollment questions and help buying other insurance products or financial services.
Report: Section 1: Characteristics Of Assister Programs
In all, more than 4,600 Marketplace Assister Programs were established to help consumers during the second Open Enrollment. This total is based on Program data provided by all state and federal Marketplaces, and represents a 3% increase in the number of Programs established during the first Open Enrollment.
Once again, most Assister Programs that help people enroll in the Marketplace are not funded by Marketplaces. Navigators, which are funded directly by the Marketplace, comprise about 14% of total Programs. Assister Programs in FQHCs, primarily supported by HRSA grants, comprised another 25% and CAC Programs were 61%. Mostly CACs are voluntary Programs, supported by their sponsoring non-profit organizations, foundations, and other sources. Marketplaces are required to recognize and certify qualified CACs, but are not required to provide them financial support. (Figure 1) This distribution of Assister Program types is somewhat different from that during the first Open Enrollment period, and includes a larger proportion of CACs, largely because of a reclassification of Assister Program types in California.6

Most Assister Programs this year also helped consumers during the first Open Enrollment. Over 90% of Programs indicated they operated during the first year. As a result, these Programs were more experienced. Prior to the first Open Enrollment, just two-thirds of Programs had experience helping consumers enroll in Medicaid and CHIP and only 16% of Programs had previously helped consumers enroll in private health insurance.
Most Assister Programs served specific geographic or population-based communities. Fourteen percent of all Programs operated in a statewide service area, the same proportion as in year one. However, the number of Navigator Programs operating statewide increased to 26% in year two (compared to 17% in year one). This could be attributable to funding requirements that encourage statewide coverage.
Assister Programs varied in size and in the number of consumers they helped. Most Programs have a small staff; 68% have five or fewer full-time-equivalent (FTE) staff, either paid or volunteer, while only 6% of Programs have more than 20 FTE staff. CACs were more likely to have small staff, with 71% of such Programs reporting five or fewer FTE staff, compared to 56% of Navigators. CACs were also more likely to rely primarily on volunteers (19% vs. 4% for other Program types.) These results are similar to year one.
Navigator and FQHC Assister Programs were more likely to report helping large numbers of consumers. This year 40% of Navigators and FQHCs said they helped more than 1,000 people during Open Enrollment. By contrast, 13% of CACs helped more than 1,000 people. This is similar to the distribution in year one. (Table 1)
| Table 1: Assister Programs by Size, Service Area, and Numbers of People Helped | ||||
| Program Characteristics | All Assister Programs | Program Type | ||
| Navigator and FEAP | FQHC | CAC | ||
| Worked during first Open Enrollment | 91% | 95% | 96% | 87%*^ |
| Statewide vs. specific geographic service area | ||||
| Statewide | 14% | 27% | 10%* | 13%* |
| Specific area within state | 80% | 68% | 87%* | 80%*^ |
| Other | 6% | 5% | 3% | 7%^ |
| Paid staff vs. volunteer | ||||
| Most/all volunteers | 13% | 5% | 3% | 19%*^ |
| Most/all paid staff | 87% | 95% | 97% | 81%*^ |
| Number of full-time-equivalent staff and volunteers | ||||
| 5 or fewer | 68% | 55% | 67%* | 71%* |
| 6-10 | 17% | 19% | 22% | 14%^ |
| 11-20 | 7% | 11% | 6% | 6%* |
| 21-50 | 5% | 9% | 3%* | 5% |
| More than 50 | 1% | 4% | 1% | 1% |
| Don’t know/No answer | 2% | 1% | 1% | 3% |
| Mean FTE staff size | 6.8 | 12.2 | 6.1 | 5.8 |
| Number of consumers helped during Open Enrollment | ||||
| 100 or fewer | 32% | 14% | 9% | 45%*^ |
| 101-500 | 31% | 28% | 33% | 30% |
| 501-1,000 | 13% | 17% | 18% | 10%*^ |
| 1,001-2,500 | 13% | 22% | 22% | 8%*^ |
| 2,501-5,000 | 5% | 8% | 10% | 2%*^ |
| More than 5,000 | 5% | 10% | 8% | 3%*^ |
| Don’t know/No answer | 1% | – | 1% | 2% |
| Mean number of people helped per Program | 1,274 | 2,727 | 1,929 | 652 |
| Portion of Consumers helped who were new to Marketplace vs. renewing | ||||
| Most/nearly all renewing or changing | 21% | 18% | 23% | 21% |
| About half new/half renewing or changing | 22% | 26% | 27% | 20% |
| Most/nearly all new to Marketplace | 53% | 52% | 46% | 56% |
| *Significantly different from Navigator and FEAP at the 95% confidence level; ^Significantly different from FQHC at the 95% confidence levelNOTE: Numbers may not sum to 100% due to rounding. | ||||
Assister Program budgets this year were mostly modest. Twenty-nine percent of all Programs reported having an annual budget for consumer assistance of $50,000 or less. Slightly more (31%) had annual budgets between $50,000 and $500,000. Only 4% of Programs reported annual budgets larger than $500,000. CACs tended to have the smallest budgets compared to other types of Assister Programs. (Table 2)
Navigators were more likely to receive most of their funding from the Marketplace, while FQHCs relied more heavily on grants from HRSA. CACs were most likely to rely on re-programmed resources from their sponsoring organization or from other sources of private sector support.
| Table 2: Assister Program Budgets and Sources of Funding, FY 2014 | ||||
| All Assister Programs | by Program Type | |||
| Navigator and FEAP | FQHC | CAC | ||
| FY 2015 Program budget | ||||
| Up to $50,000 | 29% | 21% | 13%* | 38%*^ |
| $50,001 – $200,000 | 21% | 28% | 36% | 13%*^ |
| $200,001 – $500,000 | 10% | 21% | 12%* | 7%* |
| $500,001 – $1,000,000 | 2% | 10% | 1%* | 1%* |
| More than $1,000,000 | 2% | 4% | 1% | 2% |
| Don’t know/No answer | 35% | 17% | 37% | 39% |
| Programs receiving most (>50%) of budget from this funding source | ||||
| Grants or other direct payment from Marketplace | 13% | 42% | 3%* | 9%*^ |
| Grants from HRSA, other federal agency | 21% | 10% | 53%* | 11%^ |
| Grants or payments from other state agencies | 5% | 17% | 1%* | 3%*^ |
| Grants from private foundations | 2% | 2% | – | 5%* |
| Grants from other outside private sources | 1% | – | – | 2% |
| Funds re-programmed from sponsoring organization’s own budget | 16% | 2% | 2% | 25%*^ |
| *Significantly different from Navigator and FEAP estimate at the 95% confidence level; ^Significantly different from FQHC at the 95% confidence levelNOTE: Columns may not sum to 100% because not all Programs received a majority of funding from a single source. | ||||
Assister Programs engaged in a range of activities during Open Enrollment. Virtually all Programs provided eligibility and enrollment assistance, helping consumers apply for private health insurance and subsidies or for Medicaid and CHIP. Eighty percent of Programs also provided outreach and education to consumers. Beyond outreach and enrollment support, nearly 80% of Programs assisted consumers with post-enrollment questions and problems. Additionally, almost 6 in 10 helped consumers appeal Marketplace eligibility decisions, and new this year, more than 6 in 10 Programs helped consumers with ACA tax-related questions. (Table 3)
These percentages were similar to those reported last year; however, more Assister Programs this year reported helping consumers apply for exemptions from the individual mandate (61% this year vs. 50% last year).
| Table 3: Assistance Activities Conducted by Assister Programs | |
| Activity | % Programs |
| Help individuals apply for Medicaid/Children’s Health Insurance Program | 90% |
| Help individuals compare private health insurance plan (QHP) options | 84% |
| Help individuals apply for premium tax credits and cost sharing subsidies | 81% |
| Outreach and public education to individuals and families | 80% |
| Help individuals with post-enrollment questions and problems (e.g., denied claims) | 79% |
| Help with ACA tax-related questions | 62% |
| Help individuals apply for exemptions from the individual responsibility requirement | 61% |
| Help individuals appeal eligibility determinations | 58% |
| Help other Assister Program staff resolve questions or problems for their clients | 58% |
| Outreach and public education to small businesses | 27% |
Most Programs returned to help consumers for a second year, and almost half of those experienced changes in their staff size and budget. This year 91% of responding Programs said they had also provided consumer assistance during the first Open Enrollment period. Roughly half said their budget and staff size in year two were about the same as in year one. About one-in five Programs grew while about one-in-four experienced declines in their staff or budget. (Figure 2)
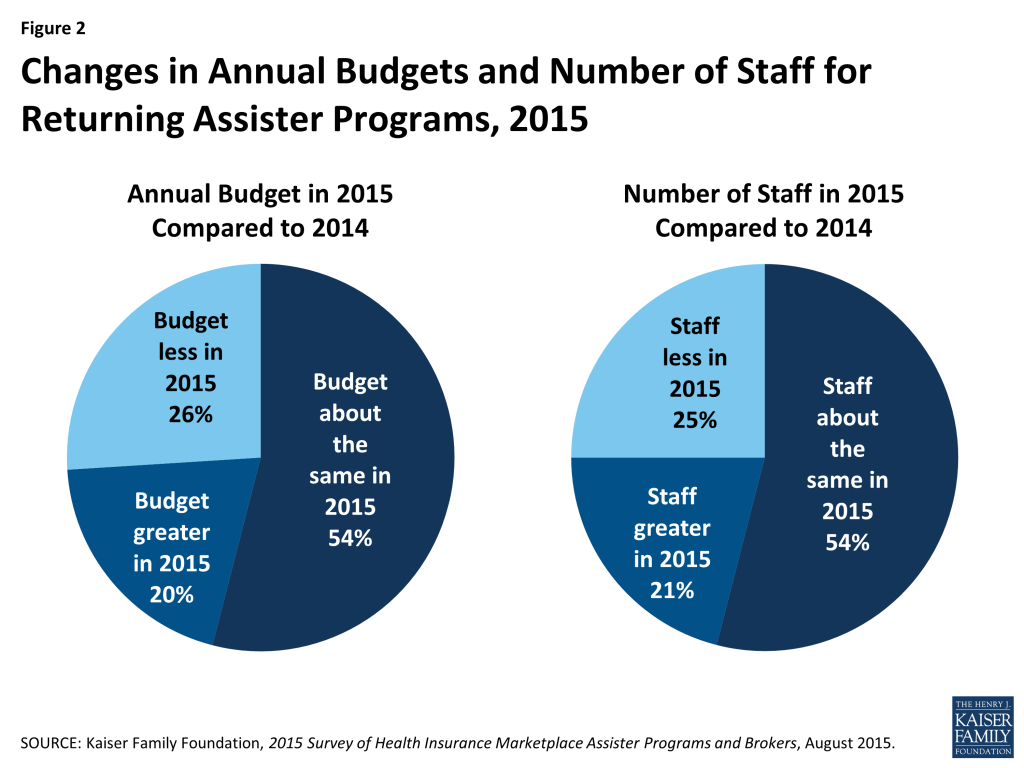
Staff continuity was strong in returning Programs. More than three-quarters of returning Programs said most or almost all of their staff from year one returned to help consumers in year two.
Report: Section 2: How Many Assisters Are There And How Many People Did They Help?
An estimated 30,400 Assisters together helped more than 5.9 million people during the second Open Enrollment period. Based on numbers of staff reported by survey respondents, we estimate all Programs combined employed at least 30,400 full-time equivalent (FTE) staff and volunteers to provide assistance across the country. This is roughly a 7% increase over the number of FTE Assisters in Year 1.In addition, we estimate Assisters together helped more than 5.9 million people apply for coverage and financial assistance during the second Open Enrollment period.7 Two things about this national estimate are noteworthy.
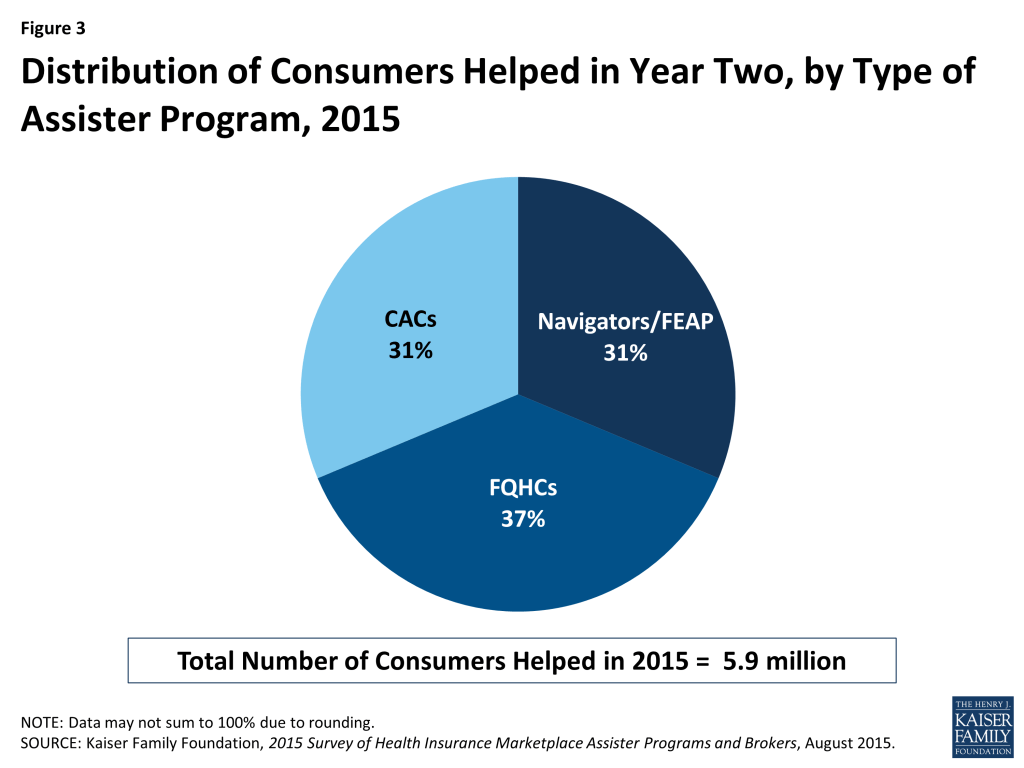
Assister Programs that received Marketplace funding or HRSA funding helped most of the consumers. Navigators and FEAPs, which comprise 15% of all Assister Programs nationwide, helped 31% of all consumers who received assistance this year. FQHCs, which account for 25% of all Assister Programs, assisted 37% of all consumers helped. By contrast, CACs, which make up 61% of all Assister Programs, assisted 31% of consumers helped. While the contribution of volunteer CAC Programs is substantial and not to be taken for granted, it was the formally funded Assister Programs – which had more resources and larger staff – that provided most of the help. (Figure 3)
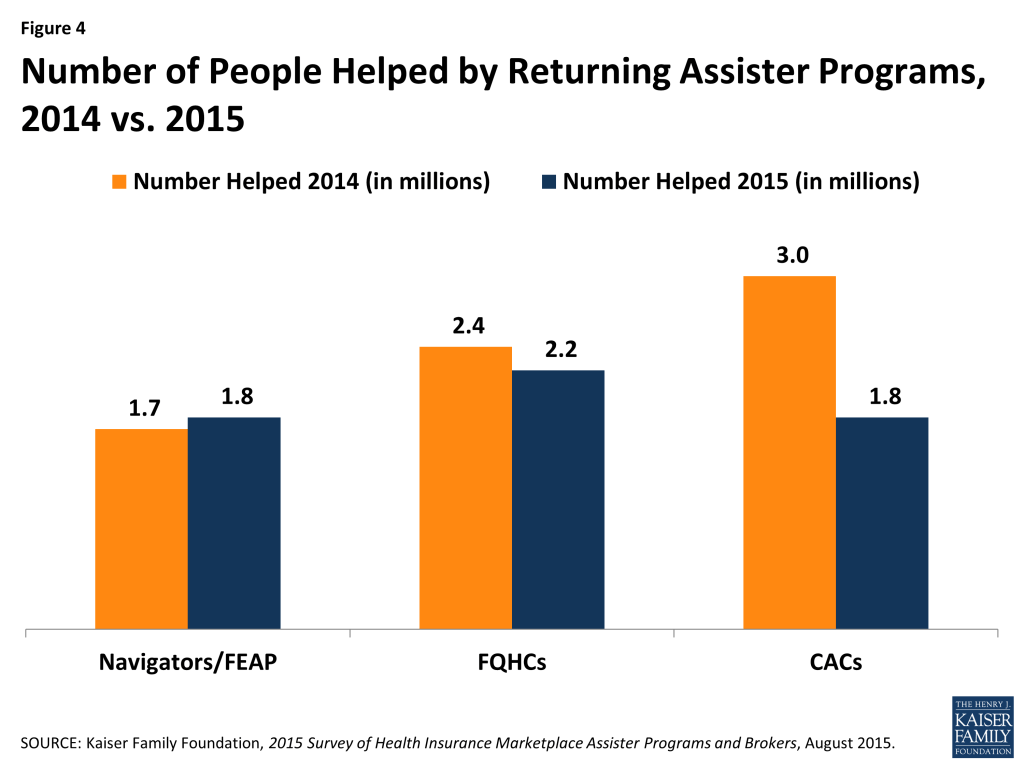
Returning Navigator and FQHC Programs helped about the same number of people this year, while the number helped by returning CACs declined sharply. Based on data reported by returning Assister Programs, the estimated number of people helped this year declined by 19% overall compared to last year. Returning Programs report helping 7.1 million in year one vs. 5.8 million this year. However, CAC Programs, as a group, account for most of the decline. Returning Navigators and FQHCs, together, helped about the same number of people they did last year (4.1 million in year one vs. 4 million in year two), while the number of people helped by returning CACs fell 40 percent. (3 million in year one to 1.8 million in year two). (Figure 4)
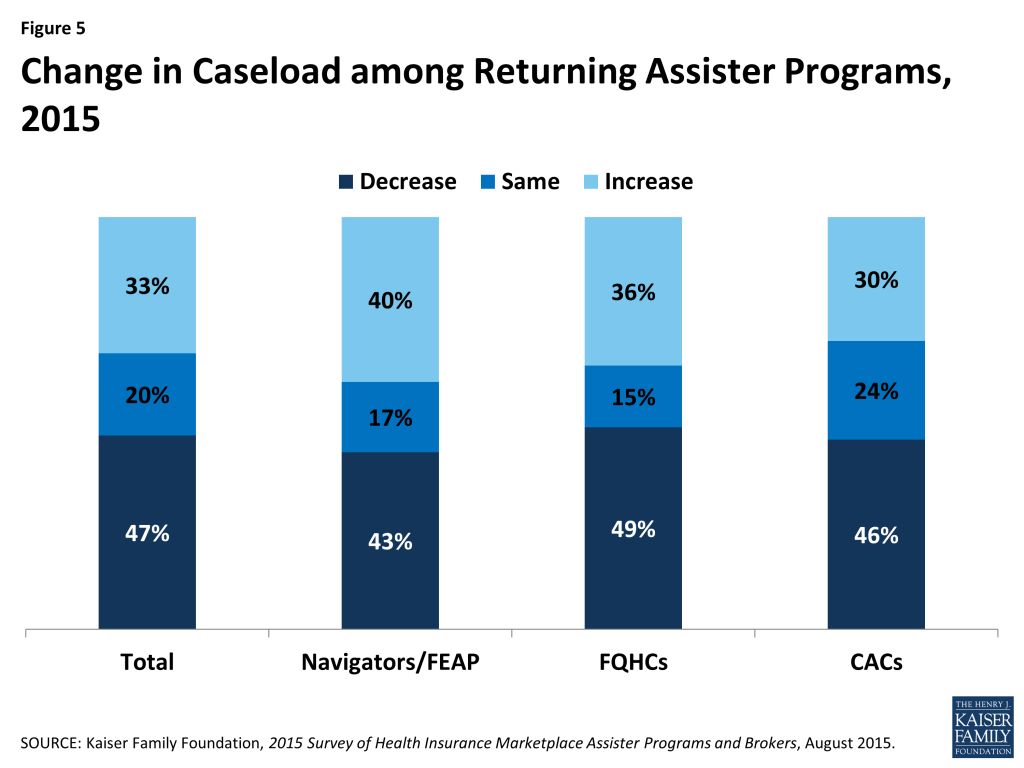
Even within Program types, however, there was also variation in the number of people helped in year two vs. year one. For example, 40% of returning Navigator Programs helped more people this year compared to last year, as did 30% of returning CACs. (Figure 5)
A number of differences between the first and second Open Enrollment periods could have affected the numbers of consumers helped, such as:
- The second Open Enrollment period was half as long as the first one (3 months vs. 6 months)
- Most Marketplace websites worked better in the second year, and website difficulties led many consumers to seek in-person help in year one.
- About half of all enrollees during the second Open Enrollment period (4.2 million individuals) had first enrolled the year before and fewer of these consumers may have needed help; more than 2 million returning enrollees auto-renewed their health coverage and subsidies for 2015.
- On the other hand, people who were uninsured as the second Open Enrollment period began may have been harder to reach. First year Marketplace enrollees tended to be the most motivated and capable, while those who remained uninsured were likely less informed about the ACA and/or more burdened by language barriers, transportation problems, and other limitations.
National Estimates and Method Changes–Our national estimate of 5.9 million consumers helped by Assister Programs this year cannot be compared to our estimate of the total number helped during the first Open Enrollment Period due to changes in the way the question was asked. However, returning Assister Programs were asked separately this year to compare the number of people they helped during the first and second Open Enrollment periods. Estimates based on those responses are not impacted by the survey method changes. The responses by returning assisters suggest a 19 percent decline in number of people helped this year, compared to last year.
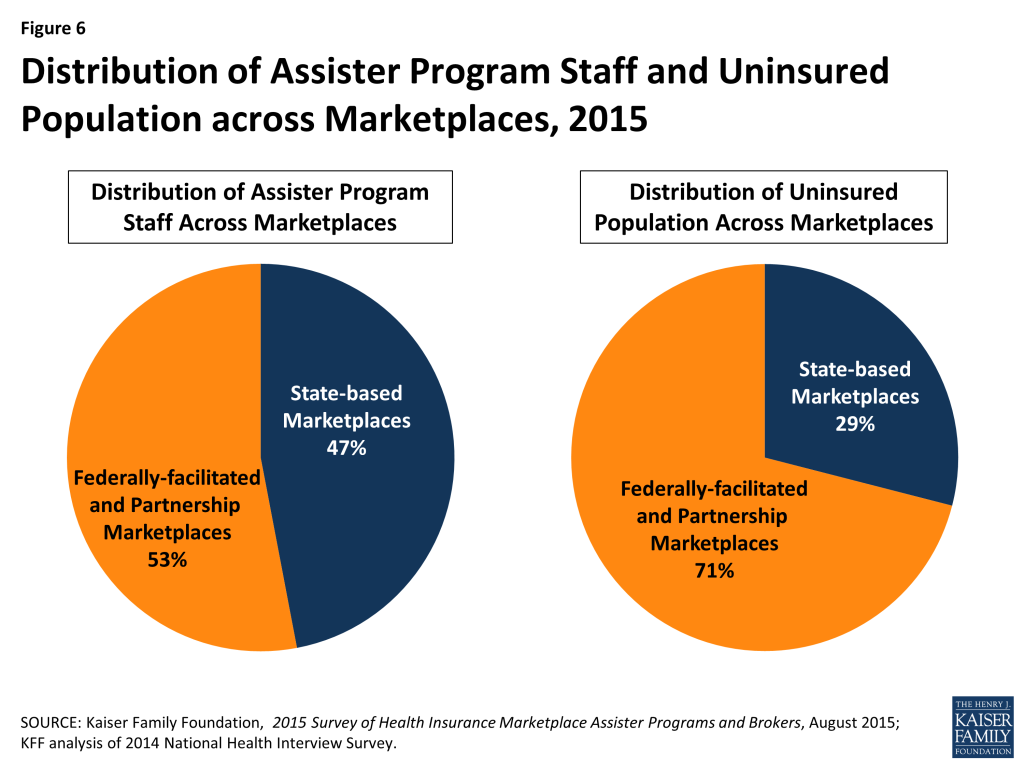
Consumer Assistance resources continue to be unevenly distributed across Marketplaces. Forty-seven percent of all Assisters nationwide worked in the 16 states and the District of Columbia with a SBM and 53% worked in the 34 states with a FFM or FPM, while 29% of the uninsured in 2014 resided in SBM states and 71% lived in FFM or FPM states. (Figure 6) As a result FFM and FPM states, on average, have fewer than half the number of Assisters per 10,000 uninsured compared to SBM states. A similar distribution was observed during year one. (Figure 7)
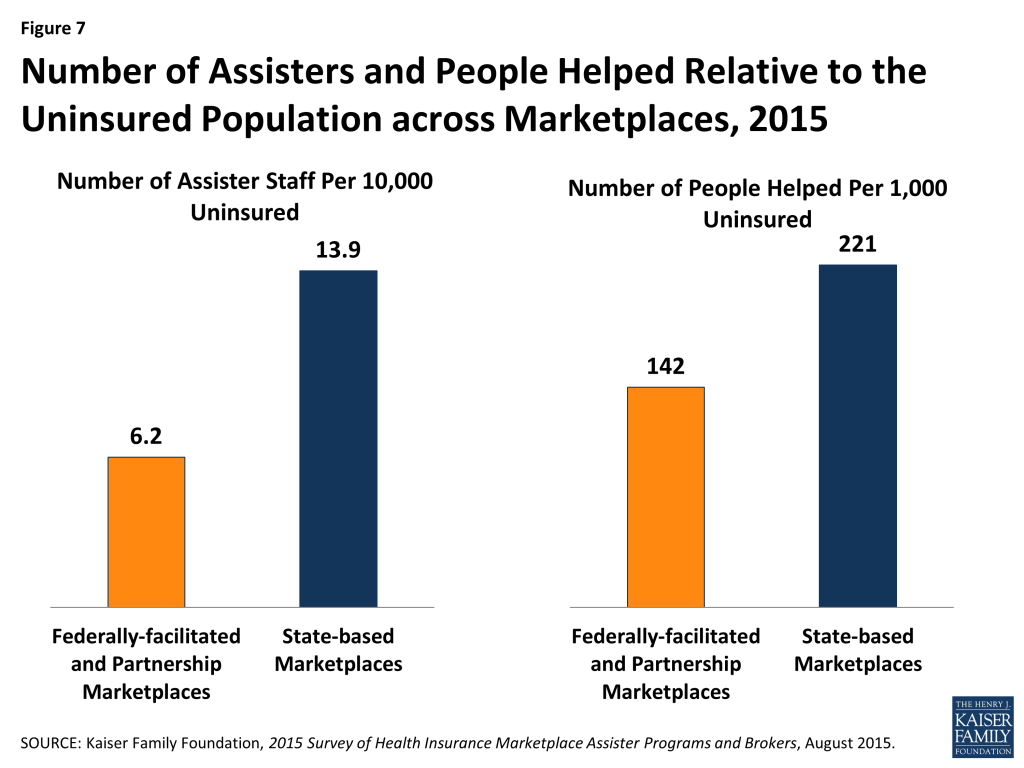
Relative to the number of uninsured, more people were helped in SBM states compared to FFM/FPM states. Of the estimated 5.9 million people helped during the second Open Enrollment period almost 3.7 million, or 62%, lived in FFM/FPM states and almost 2.3 million, or 38%, were in SBM states. Expressed relative to the uninsured population, an estimated 142 people were helped per 1,000 uninsured in FFM/FPM states, and 221 were helped per 1,000 uninsured in SBM states. (Figure 7) This difference is likely driven in part by the disparity in Assister staff across SBM and FFM/FPM states. Another factor may be that a smaller share of FFM states had expanded Medicaid. The Medicaid coverage gap may have discouraged some poor uninsured from seeking help if they thought they would not qualify for coverage.
Report: Section 3: Why Did Consumers Seek Help?
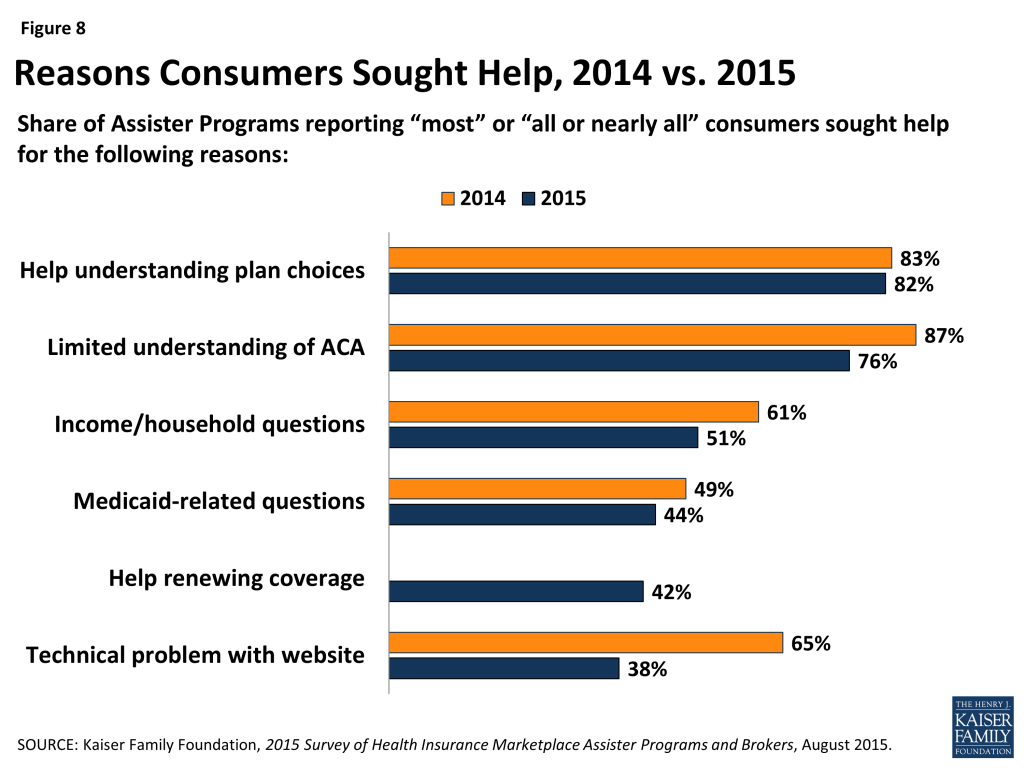
Lack of understanding of the ACA and health insurance motivated many consumers to seek assistance. Like last year, three-quarters of Assister Programs reported consumers sought help because they didn’t understand the ACA, didn’t understand health insurance, or lacked confidence to apply for coverage and financial assistance on their own. Overwhelmingly these were the top three reasons cited by Assister Programs last year and this year.
With millions of consumers returning to the Marketplace in year two to renew or change coverage, Assister Programs were less likely this year than last year to cite Marketplace website glitches as a major factor leading consumers to seek help. But in similar numbers to last year, Programs reported that consumers needed help answering Marketplace questions about their households and income, about their eligibility for Medicaid, and about other tax related questions. Also this year, for the first time, more than 40% of Programs said most consumers they served needed help renewing their coverage or updating their application for financial assistance for year two. (Figure 8)
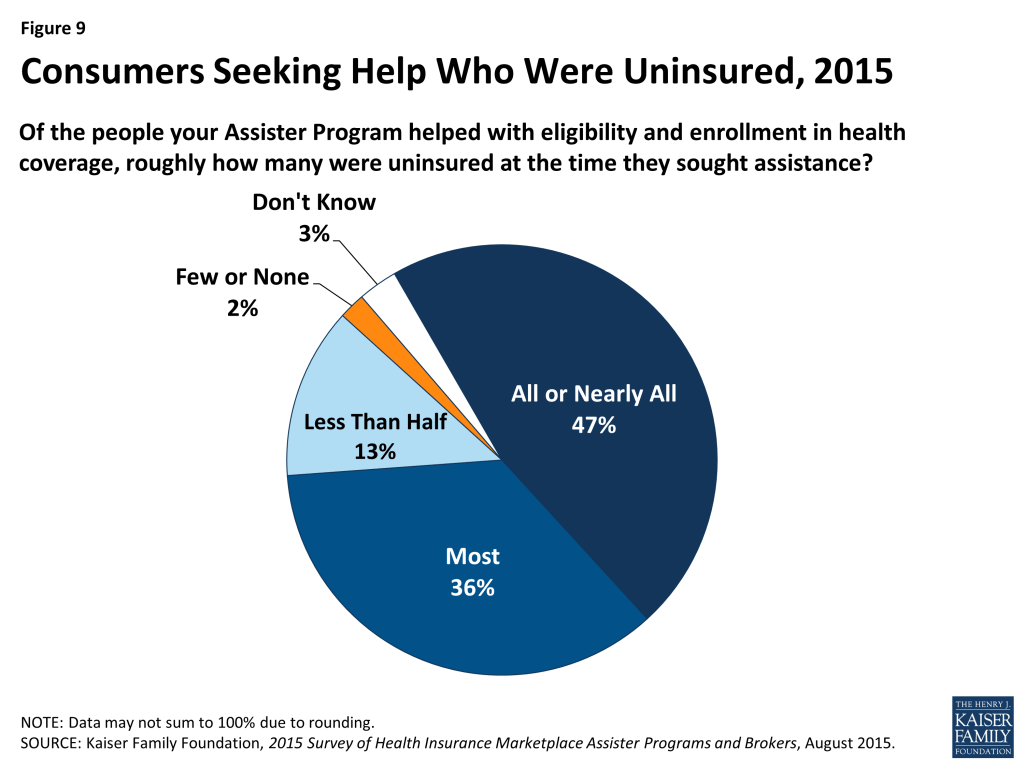
Most who sought help were uninsured. This year, 83% of Assister Programs reported that most to nearly all of the consumers they helped were uninsured at the time they sought assistance, slightly lower than the 89% of Programs last year reporting most to nearly all of the consumers they helped were uninsured. (Figure 9 and Appendix Table A1) This year for the first time some consumers sought help renewing coverage. Even so, most Assister Programs may remain focused primarily on outreach and assistance to uninsured individuals in year two. This may change in future years as more uninsured people get and keep health coverage.
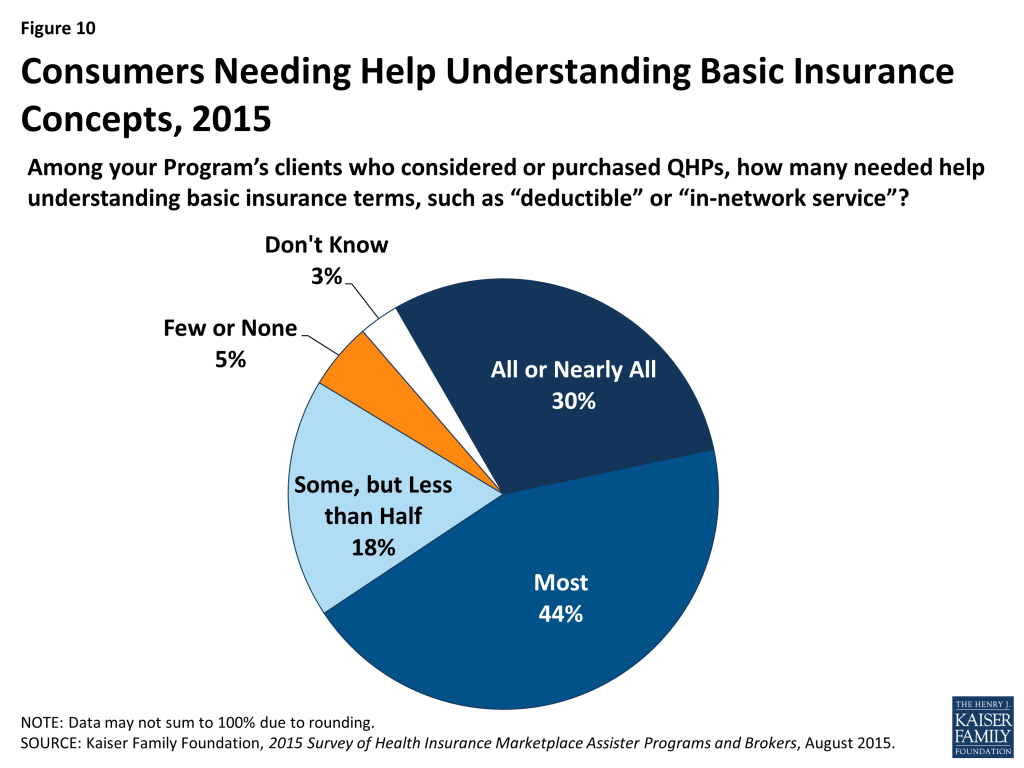
Most who sought help also had limited health insurance literacy. Unchanged from last year, 74% of Assister Programs said most to nearly all of their clients who shopped for or purchased private health plans needed help understanding basic insurance terms and concepts such as “deductible” and “in-network service.” (Figure 10 and Appendix Table A1)
Helping consumers renew coverage took less time. When helping consumers who were returning to the Marketplace this year to renew or change coverage they had selected last year, the process was faster. Nearly half of Assister Programs said it took less than one hour, on average, to help consumers who were returning to the Marketplace. (Figure 11)
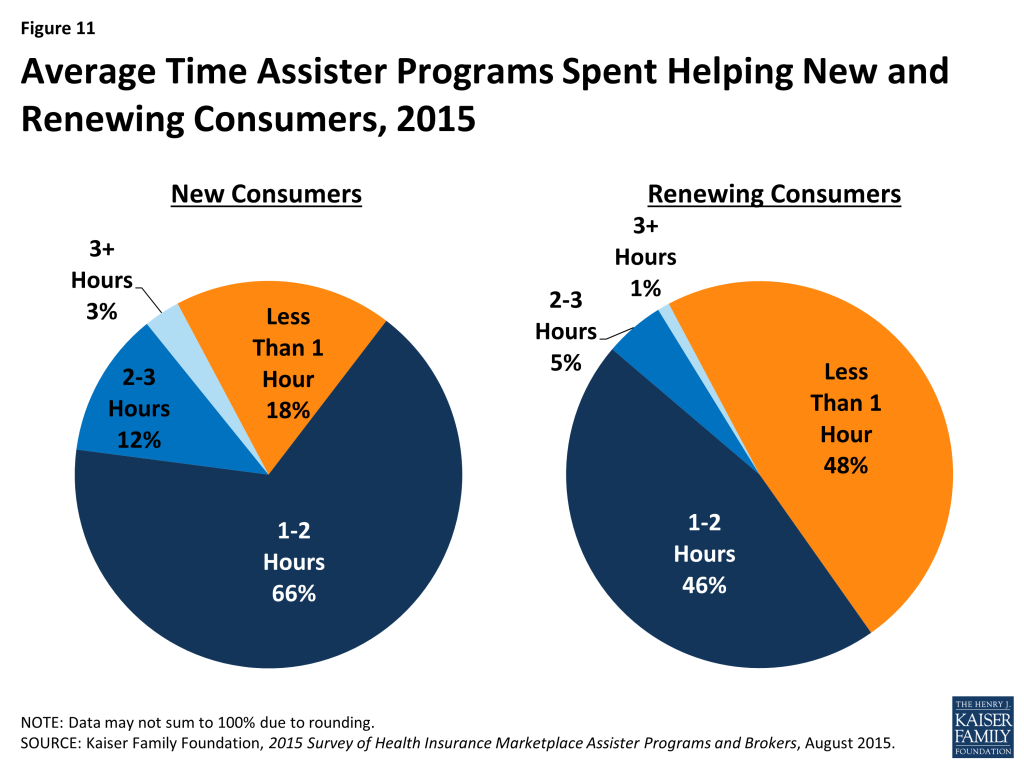
Eligibility and enrollment assistance is time-intensive. Similar to last year, about two-thirds of Assister Programs said it took one to two hours, on average, to help each consumer who was applying to the Marketplace for the first time. (Figure 11) However, there was a small increase in the number of Programs who said the average application took less than one hour, and a small decrease in the number reporting the average application took more than 2 hours. (Appendix Table A2) This uptick in appointments lasting less than an hour may reflect better functioning websites and more Assister experience using the application.
Appointment time efficiency gains appear to have been spent productively, with more Assisters able to complete the enrollment process with consumers this year, including selection of a health plan. Last year 61% of Assister Programs said they knew the plan choice outcome for most or nearly all consumers they helped. This year 71% said this was the case. (Figure 12)

Help Between Open Enrollment Periods
Assister Programs helped at least 630,000 consumers with special enrollment periods and at least 290,000 consumers report mid-year changes. This year we asked returning Assister Programs about help they provided consumers outside of Open Enrollment periods. Most Programs were available throughout the year to help consumers who became eligible for special enrollment periods (SEPs or who needed to report other mid-year income or family changes to the Marketplace in order to update their application for subsidies.
On average, returning Programs each helped 183 consumers apply for SEPs last year. Forty-seven percent helped fewer than 50, but 24% of Programs helped more than 100. Navigator Programs and FQHCs helped more consumers with SEPs on average, compared to CACs. (Table 4) Nationwide, we estimate Assister Programs helped more than 630,000 consumer apply for SEPs in 2014.
| Table 4: Help with Special Enrollment Periods and Mid-Year Changes | ||||
| All Assister Programs | by Program Type | |||
| Navigator and FEAP | FQHC | CAC | ||
| Number of People Helped with Special Enrollment Periods | ||||
| Up to 50 people | 47% | 27% | 33% | 60%*^ |
| 51-100 people | 15% | 19% | 19% | 12% |
| 101-500 people | 17% | 29% | 25% | 9%*^ |
| More than 500 people | 7% | 11% | 10% | 5%* |
| Don’t know/No answer | 13% | 13% | 12% | 14% |
| Number of People Helped with Mid-Year Changes | ||||
| Up to 50 people | 42% | 44% | 53% | 71%*^ |
| 51-100 people | 18% | 10% | 13% | 5%*^ |
| 101-500 people | 19% | 16% | 14% | 5%*^ |
| More than 500 people | 8% | 5% | 3% | 1% |
| Don’t know/No answer | 13% | 25% | 17% | 18% |
| *Significantly different from Navigator and FEAP estimate at the 95% confidence level; ^Significantly different from FQHC at the 95% confidence levelNOTE: Columns may not sum to 100% due to rounding. | ||||
Assister Programs also helped consumers report mid-year changes in their subsidy eligibility, though fewer consumers, overall, came in for this type of help. On average, each Program helped about 90 consumers report mid-year changes last year, although Navigator Programs and FQHCs helped more consumers report mid-year changes compared to CACs. (Table 4) Nationwide, we estimate Assister Programs helped more than 290,000 consumers report mid-year changes to the Marketplaces in 2014.
Assister Programs provided post-enrollment help to nearly 800,000 consumers between the first and second Open Enrollment period. During the 6-month period between Open Enrollments, nearly all returning Assister Programs also offered to help consumers with post-enrollment problems, though they are not required to do so. Those Programs that did provide post-enrollment assistance, on average, helped about 250 consumers. Again, Navigator Programs and FQHCs helped more consumers with post-enrollment problems compared to CACs. (Table 5)
| Table 5: Help with Post-Enrollment Problems | ||||
| All Assister Programs | by Program Type | |||
| Navigator and FEAP | FQHC | CAC | ||
| Number of People Helped with Post-Enrollment Problems | ||||
| Up to 50 people | 42% | 29% | 32% | 51%*^ |
| 51-100 people | 18% | 14% | 19% | 19% |
| 101-500 people | 19% | 28% | 26% | 13%*^ |
| More than 500 people | 8% | 13% | 14% | 3%*^ |
| Don’t know/No answer | 13% | 16% | 9% | 14% |
| *Significantly different from Navigator and FEAP estimate at the 95% confidence level; ^Significantly different from FQHC at the 95% confidence level NOTE: Columns may not sum to 100% due to rounding. | ||||
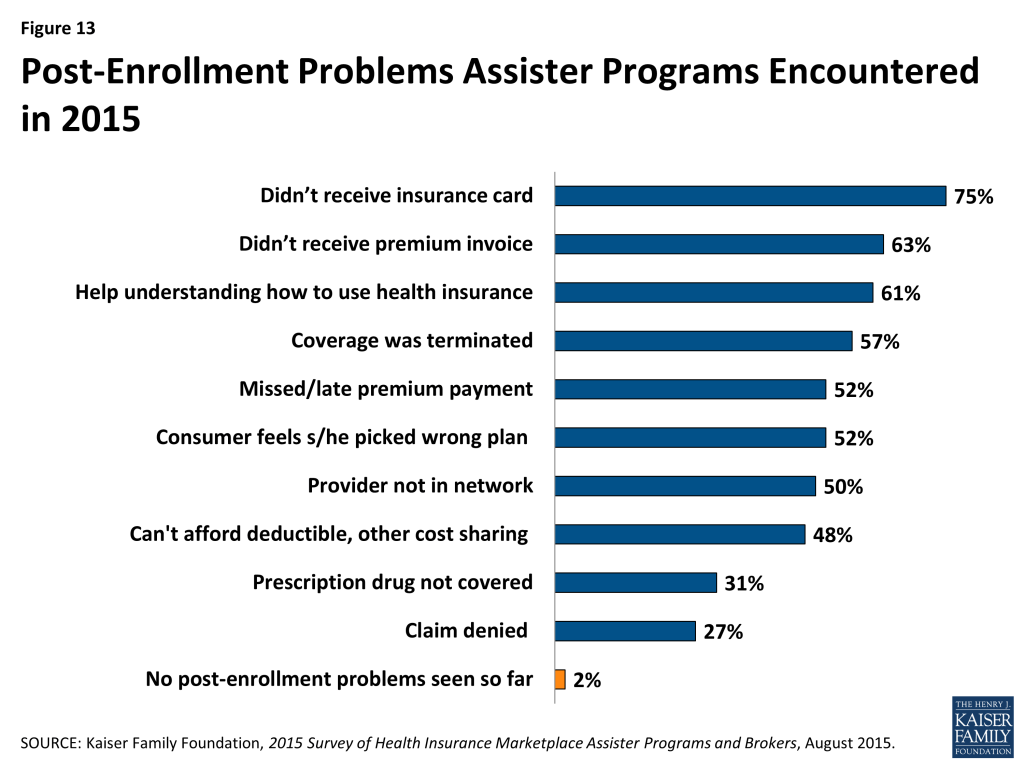
Consumers sought help with premium payment and invoicing problems, claims denials, and when their health providers were not in-network. Consumers also returned for help because they did not understand how to use their health coverage. (Figure 13) Most Assister Programs (69%) say they could help consumers successfully resolve post-enrollment problems most of the time; 27% said they succeeded just some of the time and 4% said not very often.
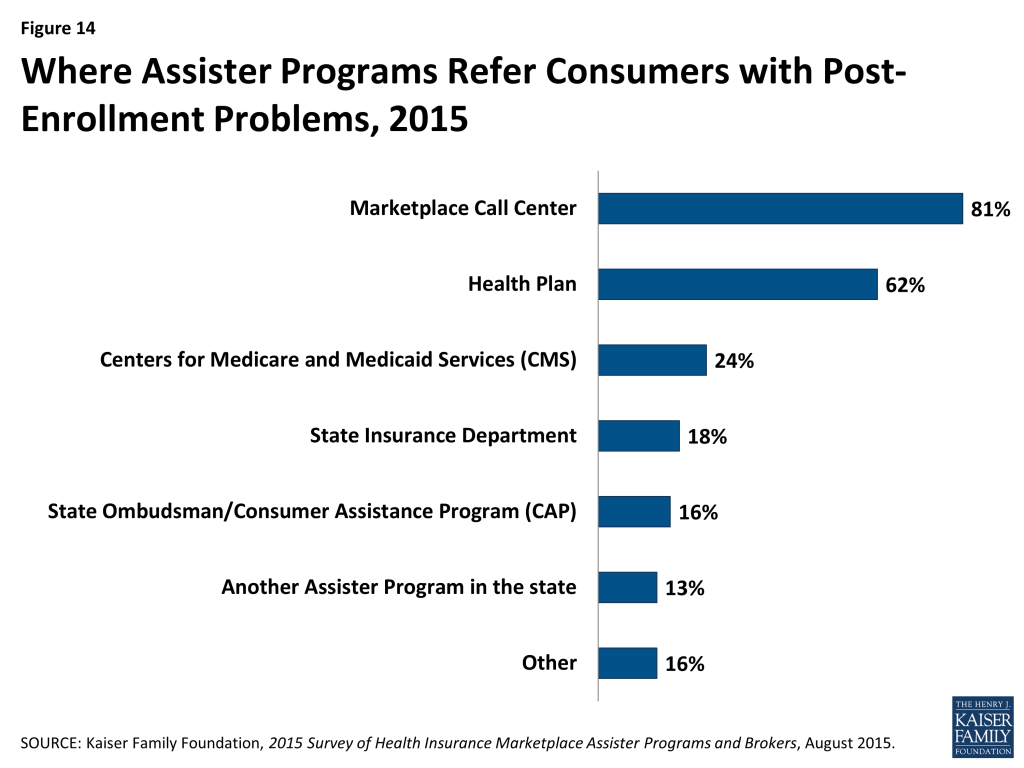
The ACA requires Navigators to refer consumers with post-enrollment problems to state Consumer Assistance Programs, or CAPs. However, federal funding for CAPs has not continued, and while many remain operational, Marketplace Assisters mostly refer consumers with post-enrollment problems elsewhere. When asked where they refer consumers with post-enrollment problems they cannot resolve, only 16% of Assister Programs mention CAPs. Instead, like last year, Assisters mostly refer consumers to the Marketplace Call Center (81%) or back to their health plan (62%). (Figure 14)
Report: Section 4: Challenges Facing Assister Programs
Demand for consumer assistance sometimes exceeded capacity, though less so than last year. For the second Open Enrollment period overall, 19% of Assister Programs said they could not help all who sought assistance. (Figure 15) In the final weeks of Open Enrollment, 22% of Programs said they had to turn at least some consumers away. This contrasts with 37% of Programs that were stretched beyond capacity overall during year one, and nearly half that had to turn away at least some consumers during the final weeks.
The shift in capacity relative to demand during the final weeks of Open Enrollment may be due to the fact that half of Marketplace enrollees this year were re-enrolling for a second year. In order to maintain continuous coverage on January 1, 2015, consumers had to re-enroll by mid-December. In addition, half of returning enrollees elected the auto-renewal option for 2015.
With respect to Marketplace consumer assistance capacity overall, it may be that capacity is coming more into alignment with the demand for help for many Assister Programs, though a significant number of Programs still are being asked for more help than they have capacity to provide.
Client continuity was low. Returning Assister Programs were asked approximately how many consumers they helped during the second Open Enrollment were returning clients they had helped the year before. Two-thirds of Programs responded that most to nearly all of the consumers helped this year were new. (Figure 16)

FQHCs were somewhat more likely to have an ongoing relationship with clients from year one. Over a third of FQHCs reported most clients they helped during the second open enrollment period were returning compared to less than a quarter of Navigators and CACs. In many Marketplaces, rules governing retention of identifiable personal information may have limited Programs’ ability to follow up with consumers. Also, some consumers who needed help enrolling in year one may not have needed help in year two. In addition, many Programs still focus heavily on outreach and assistance to uninsured consumers. As more consumers gain coverage, the extent to which ongoing relationships develop between consumers and Assisters remains to be seen.
Reported shortcomings in available health plan information hindered the ability of Assister Programs to help consumers evaluate QHPs in some cases. Assister Programs continue to report that at least some of their clients who considered QHPs had questions about plans that weren’t answered by information on the Marketplace website. However, the number of Programs indicating this was often or almost always the case declined to 31% this year, compared to 41% last year. (Figure 17)

Respondents also report that insurers selling coverage in the Marketplace tend not to offer training on their health plans to Assister Programs; 74% of Programs say few or none of the insurers in their Marketplace do so.
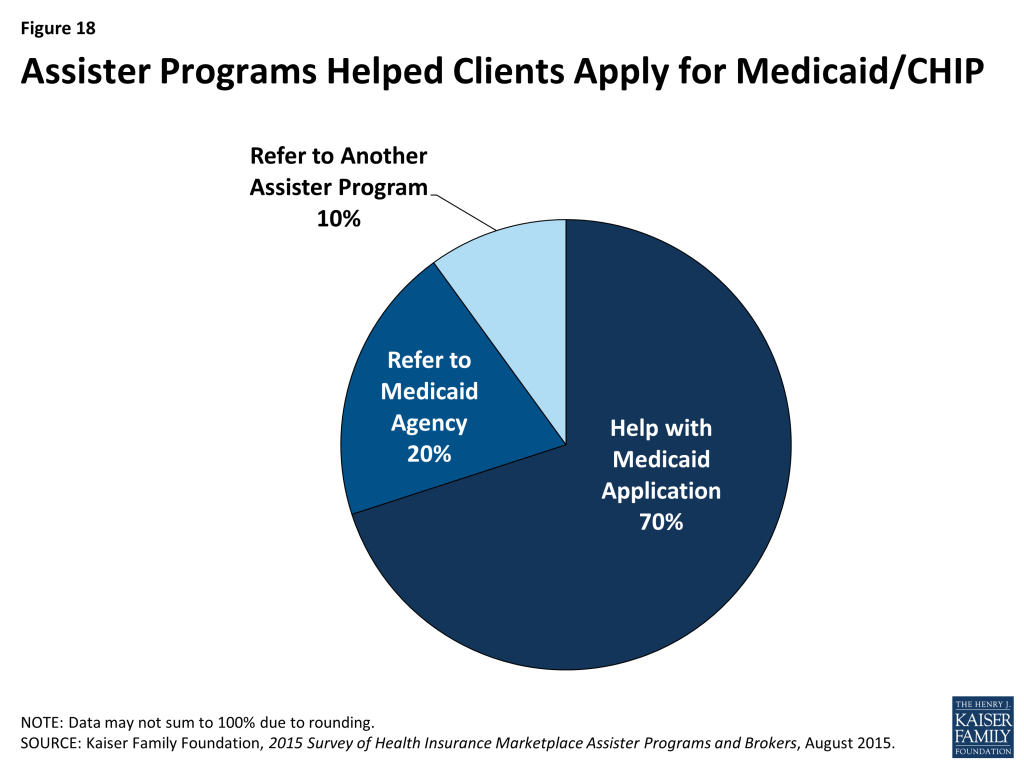
Most Assister Programs help clients apply for Medicaid and CHIP, but completing these applications often took multiple visits. Under the ACA, Marketplaces must provide a single streamlined application process for individuals seeking financial assistance, whether through premium tax credits and cost sharing subsidies for QHPs or through Medicaid and CHIP. In many states so far, though, including most FFM states, Marketplace IT systems are not sufficiently integrated with Medicaid to seamlessly transfer applications and enroll eligible individuals in a single transaction. Instead, when the Marketplace assesses an individual is likely eligible for Medicaid or CHIP, that person must often make a separate application to the state Medicaid agency, re-entering information already submitted to the Marketplace.
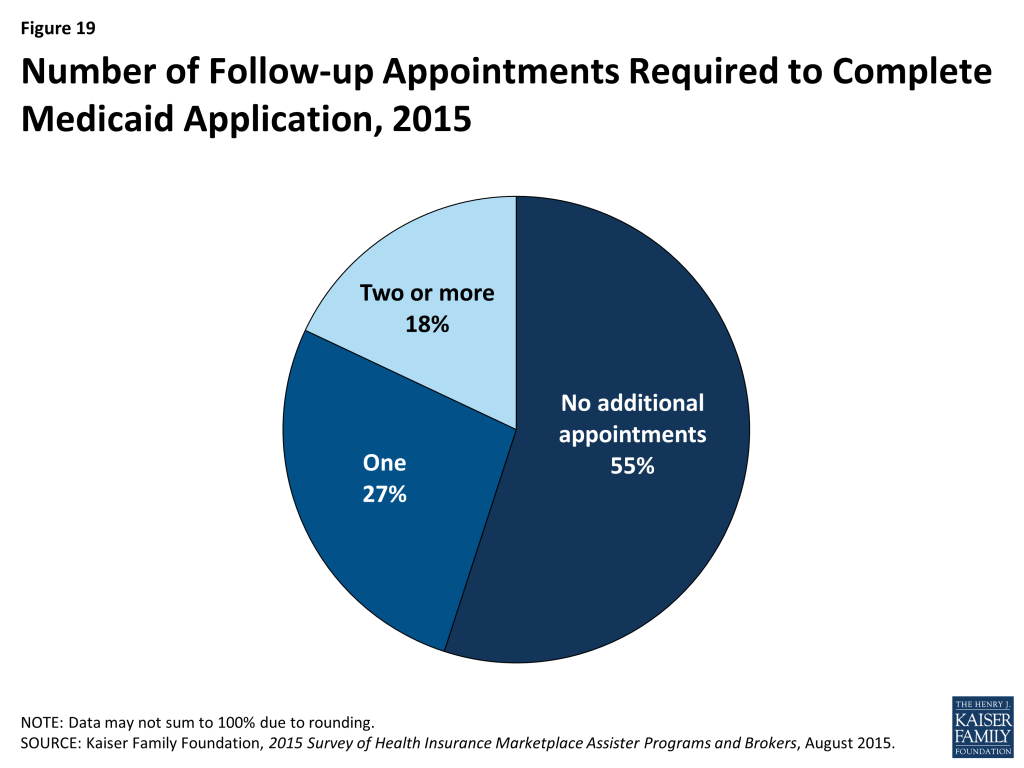
Most Programs said they will help consumers file a separate application for Medicaid or CHIP, while 30% refer consumers to another Assister Program or to apply on their own. (Figure 18) When Programs do help, 55% said the separate Medicaid application could usually be completed during the same appointment, while the rest said that it typically took multiple visits to help the client complete the transaction with Medicaid. (Figure 19)
Call Center technical support was uneven. Last year Programs reported that technical support from Marketplace call centers was not always effective. Last year Programs also listed types of consumer problems that could be especially difficult to resolve, including the need for translation services, immigration-related questions, tax-related questions, and help understanding QHP choices. This year, the survey asked Programs how often they turned to Call Centers for technical assistance when consumers presented with these types of problems and, when they did, how often they found Call Center technical assistance to be effective. (Table 6)
| Table 6: Necessity and Effectiveness of Technical Help from Marketplace For Assister Programs | ||||||
| % That Sought Technical Help from Marketplace | % That Said Technical Help from Marketplace Was Effective | |||||
| Most/all of the time | Some of the time | Rarely/never | Most/all of the time | Some of the time | Rarely/never | |
| Translation Services | 18% | 13% | 69% | 50% | 27% | 23% |
| Immigration Questions | 24% | 29% | 47% | 41% | 36% | 24% |
| Tax Questions | 18% | 35% | 47% | 45% | 37% | 19% |
| Questions About QHP Choices | 7% | 21% | 72% | 39% | 42% | 20% |
| NOTE: Numbers may not sum to 100% due to rounding. | ||||||
Assister Programs were more likely to seek help from the Call Center on cases involving immigration questions or tax related questions. Most Programs said they contacted the Call Center for help at least some of the time when faced with such cases. By contrast, 7 in 10 Assister Programs said they rarely if ever contacted the Call Center for help with translation services or questions about QHP choices.
When Programs did seek technical assistance, they said help from the Call Centers was uneven. Half of Assister Programs said Call Center help with translation was effective most to nearly all of the time. However, 39-45% of Programs ranked Call Center help as reliable on immigration, tax, and QHP questions. Between 19 and 24% of Programs said Call Centers rarely if ever provided effective help on these four topics.
Last year, Assisters in some SBM states reported they had access to dedicated staff at the Marketplace Call Center who could expedite service and help resolve more complex questions. This year the FFM launched a dedicated help center for Assister Programs called the Assister Help Resource Center (AHRC). The new center was launched on a test basis in a few states after Open Enrollment began and was available for all FFM Assisters by the end of Open Enrollment. The AHRC was operated separately from the FFM Call Center and offered policy-related technical assistance (e.g., explaining eligibility rules for immigrants) but no application assistance (e.g., AHRC staff could not check on the status of an application or re-set a password). Survey respondents this year were not asked about the AHRC.
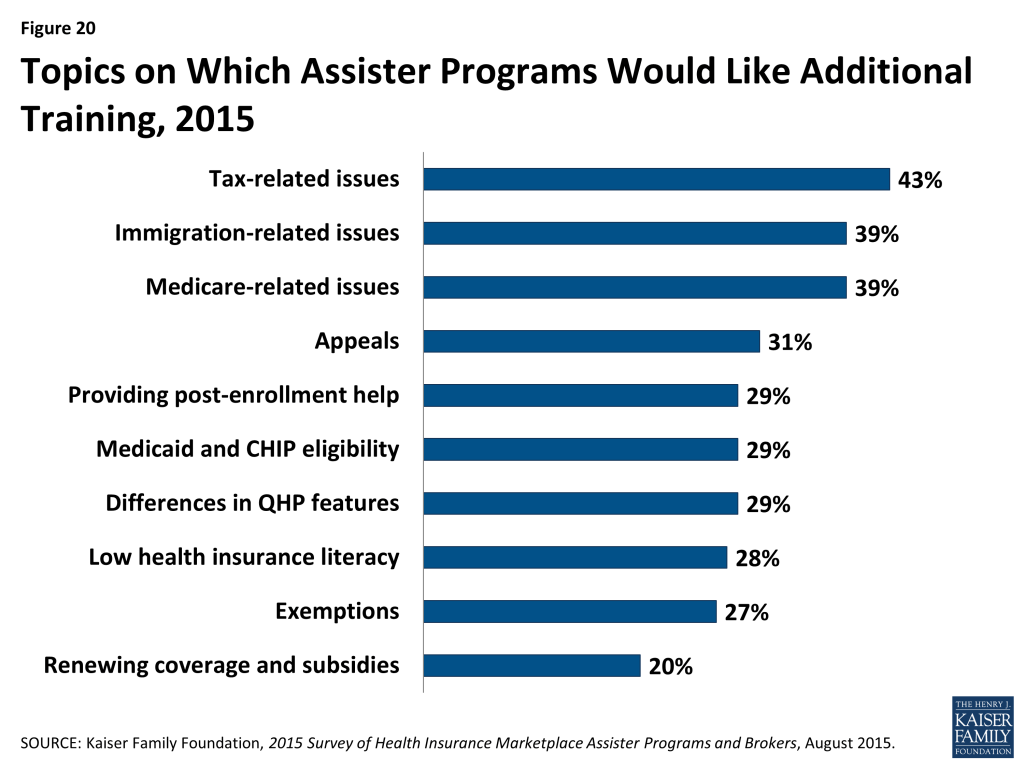
Most Assister Programs reported they would like additional training on specific issues. All Assister Program staff must complete initial training to be certified by Marketplaces, and returning staff had to be recertified to work in year two. In FFM and FPM states, Navigators were required to complete 30 hours of federal training, while CAC Assisters had to complete at least 5 hours of federal training. Depending on the applicable training curriculum, topics include eligibility standards for financial assistance, initial and renewal application procedures, and general standards for qualified health plans. In addition, during the year, Marketplaces may offer supplemental training. The FFM, for example, publishes a weekly newsletter for Assisters with updates on various topics. CMS also hosts periodic webinars to provide additional information during the year. Participation by Assisters is voluntary.
Nearly all Assister Programs (86%) indicated they would like additional training on a range of complex issues. Last year, more than 90% of Assister Programs indicated additional training would be helpful. Topics for which further training is desired are similar to those identified last year, except that further training on renewing health coverage and subsidies is new on the list this year. (Figure 20 and Appendix Table A3)
While nearly all Assister Programs recognize the value of coordinating with other Programs on activities and to share best practices, a majority reported that they did not often coordinate with other Programs. Like last year, Assister Programs strongly indicated that coordination with other Assister Programs improves effectiveness; 90% of Programs said coordination is somewhat or very important to operating effectively. But like last year, a majority of Programs say they seldom if ever coordinate with other Assister Programs. Just 46% said they coordinated often with other Programs. Navigators were most likely (60%) to report coordinating often with other Assister Programs, followed by FQHCs (50%). (Figure 21)
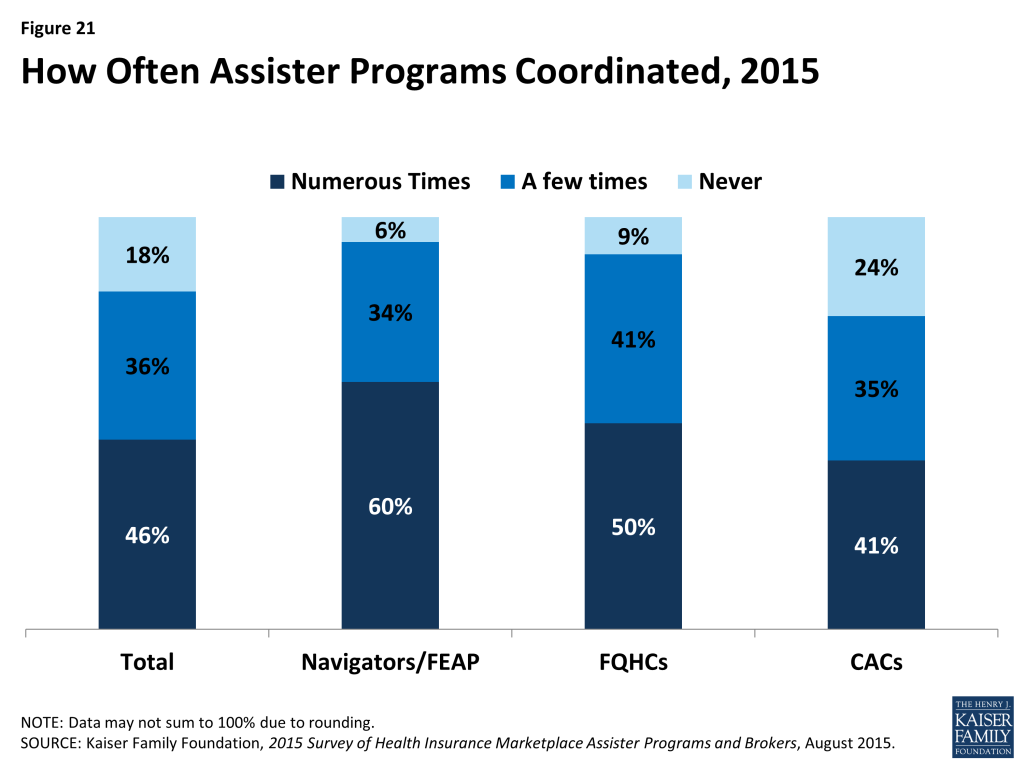
Coordination was most often initiated by Assisters themselves or by an outside third party. Nine percent of Programs say the Marketplace facilitated coordination, though in SBM states, it was 19%. When Marketplaces did help Programs coordinate, this was most often the case for Navigators. (Table 7) Most FQHCs receive coordinating help from their state Primary Care Associations, which receive separate HRSA grants to support FQHC Assisters.
| Table 7: Who Initiates Coordination Among Assister Programs | ||||||||
| All Programs | Program Type | Marketplace Type | ||||||
| Navigator/ FEAP | FQHCs | CACs | FFM/FPM | SBM | ||||
| Marketplace | 9% | 22% | 7%* | 7%* | 3% | 19%** | ||
| Other third party | 33% | 28% | 43%* | 29%^ | 31% | 34% | ||
| Programs coordinate on their own | 64% | 73% | 61%* | 63%* | 71% | 55%** | ||
| *Significantly different from Navigator and FEAP at the 95% confidence level; ^Significantly different from FQHC at the 95% confidence level**Significantly different from FFM/FPM at the 95% confidence level. | ||||||||
Report: Section 5: Consumer Assistance By Health Insurance Brokers
For the first time this year, the survey included health insurance brokers who helped consumers apply for non-group coverage in the Marketplace. Most, though not all state Marketplaces provided contact information for their certified brokers. As a result, survey findings are generalizable to most states but may not reflect experiences unique to some states.
Characteristics of Marketplace brokers
The vast majority (86%) of brokers who sold non-group coverage in the Marketplace this year had done so during the first Open Enrollment period and prior to 2014. Similar to Assistance Programs, 80% of returning brokers said they thought this year’s Open Enrollment went better than the first.
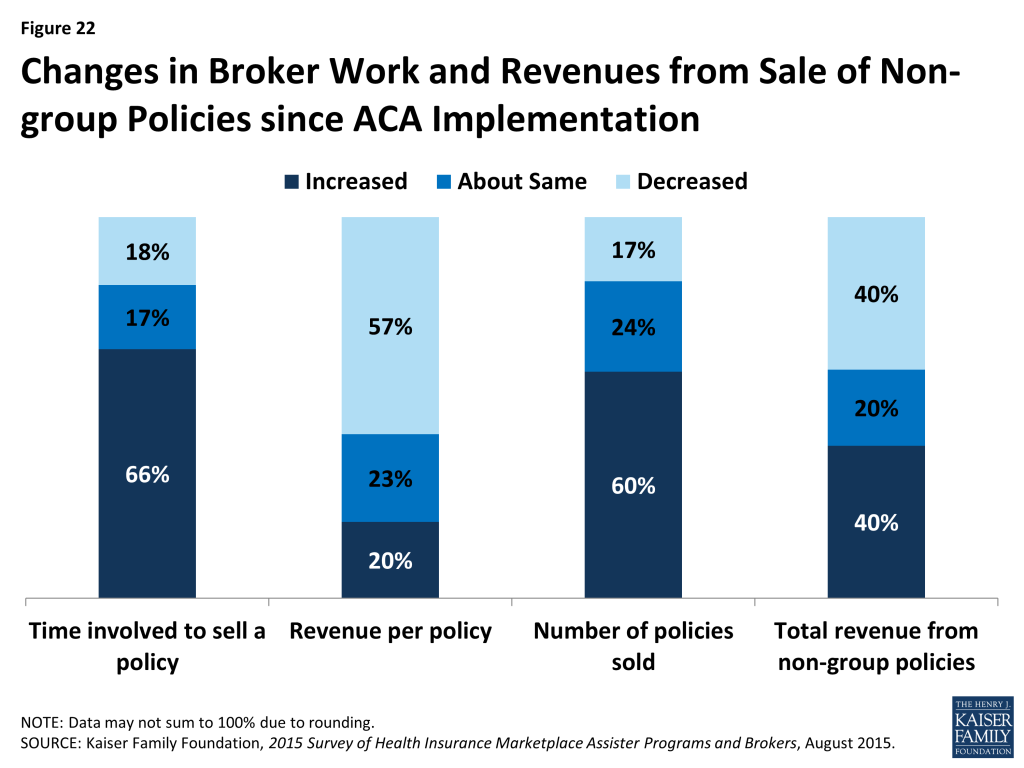
The opening of ACA Marketplaces in January 2014 changed the business of selling non-group health insurance for most brokers. Most say the time involved in selling a private policy has increased relative to pre-ACA days (66%), and revenue earned per policy has decreased (57%); but most also say they sell more non-group policies overall than they did pre-ACA (60%). Forty percent of brokers say their overall revenue from the sale of non-group policies has increased, 40% say overall revenue has decreased, and 20% say it is about the same. (Figure 22)
Most brokers who sold Marketplace coverage (79%) also sold policies outside of the Marketplace. On average, brokers report helping about 140 consumers, both in and outside of the Marketplace, with eligibility and enrollment during the second Open Enrollment period. On average, brokers helped almost twice as many clients apply for coverage through the Marketplace (91) compared to outside of the Marketplace (49).
Some brokers were busier than others. Sixty percent said they helped up to 50 Marketplace consumers during this Open Enrollment period, while 20% of brokers said they helped more than 100. (Figure 23) Returning brokers, on average, helped about 8% fewer consumers this year compared to year one.

Comparing Activities of brokers and Assister Programs
Brokers generally engaged in similar consumer assistance activities as Assister Programs, but with emphasis on different services. For example, the vast majority of both brokers and Assister Programs said they help consumers compare and select QHPs, apply for premium tax credits, and resolve post-enrollment problems. But, compared to Assister Programs, brokers were less likely to engage in outreach and public education activities (33% vs 80%) and less likely to help consumers appeal Marketplace eligibility decisions (39% vs 58%). Compared to Assister Programs brokers were more likely to help small businesses select coverage (34% vs 9%).
Brokers were also less likely, compared to Assister Programs to help individuals apply for Medicaid and CHIP (49% vs 90%). Brokers who said they helped consumers with Medicaid applications were more likely to be from SBM states, where Marketplace websites are better integrated with Medicaid. However, when Marketplaces determined that consumers should complete a separate Medicaid application, brokers helped them do this less often than did Assister Programs. (13% vs. 69%)
Similar to Assister Programs, most brokers said, on average it took about one-to-two hours to help each client that was applying to the Marketplace for the first time, and about one hour to help clients who were returning to renew or change their Marketplace coverage.
Also similar to Assister Programs, most brokers said they would like to receive additional training on a range of topics, including tax related issues, Marketplace appeals and renewal procedures, Medicare, and Medicaid. And, similar to Assister Programs, brokers report that when they did need to seek technical assistance from Marketplace Call Centers, help was often inconsistent or ineffective. (Table 8)
| Table 8: Use and Effectiveness of Technical Help from Marketplace For Brokers | ||||||
| % That Sought Technical Help from Marketplace | % That Said Technical Help from Marketplace Was Effective | |||||
| Most/all of the time | Some of the time | Rarely/never | Most/all of the time | Some of the time | Rarely/never | |
| Translation Services | 14% | 10% | 76% | 48% | 20% | 32% |
| Immigration Questions | 27% | 13% | 60% | 47% | 28% | 25% |
| Tax Questions | 16% | 25% | 58% | 37% | 30% | 33% |
| Questions About QHP Choices | 4% | 6% | 89% | 44% | 25% | 32% |
| NOTE: Numbers may not sum to 100% due to rounding | ||||||
Comparing clients of brokers and Assister Programs
Similar to Assister Programs, brokers overwhelmingly said the consumers they helped had limited understanding of the ACA and limited health insurance literacy. In other respects, though, brokers served a somewhat different clientele. For example,
- 82% of brokers said few or none of their clients needed language translation help, compared to 53% of Assister Programs
- 9% of brokers said most or all of their clients lacked internet at home, compared to 35% of Assister Programs
- 49% of brokers said they helped Latino clients, compared to 77% of Assister Programs
- 50% of brokers said most or nearly all clients they served were uninsured when they sought help, compared to 83% of Assister Programs
- 8% of brokers said most or nearly all clients had income low enough to qualify for Medicaid, compared to 50% of Assister Programs.
Brokers also reported higher rates of client continuity and were more likely than Assister Programs (47% vs 29%) to say most of the consumers they helped this year were people whom they had also helped during the first Open Enrollment period.
Report: Discussion
Last year, we reported the establishment of new consumer assistance resources under the ACA was a significant new development in the health coverage system. The ACA enabled millions of new consumers to enroll in coverage and created a new process for applying for coverage and financial assistance. Last year, we reported the new consumer assistance infrastructure faced many challenges, including inexperience and IT problems. This year most Programs are more seasoned and websites worked better. But challenges remain.Returning Assister Programs helped 19% fewer people during the second Open Enrollment period. Returning Navigator and FQHC Programs (supported by Marketplace and HRSA grants, respectively) helped about the same number of consumers this year; voluntary CAC Programs experienced most of the decline in people helped. Two years do not make a trend. But because the level of consumer assistance provided this year was more sustained in grant funded programs compared to volunteer programs, this suggests that continued investment in Marketplace consumer assistance would make a difference. So far, though, a minority (27%) of Assister Programs overall say they are very certain funding will be available to support their work next year.
Programs also suggest other changes that could improve their efficiency and effectiveness. Strengthening the technical assistance offered by Marketplace Call Centers, and fully integrating Marketplace and Medicaid websites are steps that could streamline the enrollment process.
Facilitating coordination between Assister Programs is something else Marketplaces could undertake to strengthen consumer assistance. Returning Programs that coordinated often with other Assister Programs were more likely to increase the number of people they helped this year. In some states, so-called super Navigators have been designated (formally by the Marketplace or informally) to promote coordination, centralize training and mentor new Assisters, facilitate scheduling and referrals, and help on complex cases.
Further capacity building may also still be important, though capacity constraints were less severe than in year one. One-in-five Assister Programs this year said they could not help all consumers who needed it. Because voluntary CAC Programs continue to provide a significant portion of all consumer assistance, Marketplaces could consider targeting additional financial support or coordination to at least some of these Programs, as well.
For a second year, enrollment assistance was time intensive. This year more Programs were able to complete the process through consumer selection of a health plan. But plan comparison and selection continued to pose challenges. Help comparing plans is still one of the leading reasons why consumers seek in-person help. Assisters still report many consumers have questions about plan choices that were not answered by information on Marketplace websites. Low health insurance literacy among consumers also persists. Because consumers may be faced with dozens of Marketplace plan choices, improving this process will be challenging. The FFM and some state Marketplaces are working to gradually improve the quality of health plan information and to develop new plan comparison tools for consumers in the future. But consumers will likely need a substantial amount of in person help, in addition, for years to come.
Outside of Open Enrollment, many Assister Programs remained busy. During the 6-month period between enrollment periods, Assister Programs helped nearly 300,000 people report mid-year changes and more than 600,000 people apply for special enrollment periods (SEP). Over the same period Assister Programs also helped nearly 800,000 individuals with post-enrollment problems. The ACA provided for state-based ombudsman programs (CAPs) to help with post enrollment problems and requires Navigators to refer consumers to CAPs for this kind of help. However this part of the ACA consumer assistance infrastructure is the least developed. CAPs were established in most states in 2010, but most have not received any new federal funding since 2012.
Brokers also continue their traditional role helping consumers in the non-group market, and are an important source of assistance for consumers seeking marketplace coverage. Most in this space today sold non-group coverage prior to the ACA. Most say it now takes more time to sell a non-group policy and the per-policy commission is lower. But most also say they are earning as much or more in total non-group revenue today compared to pre-2014, though a substantial minority also report earning less. Brokers also continue to help consumers buy coverage outside of the Marketplace. On average, brokers sell one policy outside for every two Marketplace policies they sell.
Brokers and Assister Programs engage in many of the same activities, though brokers are less likely to help consumers apply for Medicaid and more likely to help small businesses apply for small group plans. Brokers also appear less likely, compared to Assister Programs, to help some other of the most vulnerable consumers, including those who lack internet at home and those who need translation assistance. The implication for Marketplaces would seem to be that brokers and Assister Programs are not interchangeable. To ensure that all consumers who need help receive it, both types of professionals will need to continue their key roles.
Methodology
The Kaiser Family Foundation 2015 Survey of Health Insurance Marketplace Assister Programs and Brokers was designed and analyzed by KFF researchers and administered by Davis Research. This nationwide survey was conducted through an online questionnaire from March 31, 2015 through May 3, 2015.
Assister Programs
To recruit Assister Program survey participants, we asked officials CMS and from States operating SBM or FPM Marketplaces to provide contact information for the directors of their certified Assister Programs. In addition, we requested contact information for the directors of enrollment assistance activities in each of the FQHCs from HRSA. All Assister Programs received an email with a link to the survey inviting the director to participate. In the event the person receiving the survey was not the appropriate person to complete it, they were asked to provide the contact name and email for the appropriate person within their organization.
To analyze results, we assigned Assister Programs to one of four types based on their primary source of funding. The first type, Navigators, were those identified by Marketplace officials contracted with and received grant funding directly from the Marketplace. Of note, last year we distinguished between Marketplace-funded Programs that were supported with Section 1311 grant funds – called In Person Assisters (IPAs) – and those that received other Marketplace funding – Navigators. Because Section 1311 grant funds were discontinued, this year we categorized as Navigators all Assister Programs that received direct grant funding from a Marketplace. The second type, FEAP, were those identified by CMS as contractors that operate in certain FFM states and that otherwise act as Navigators. We tracked FEAP responses separately in the survey, but for most data analysis presented in this report we combined responses of FEAPs and Navigators. The third type, FQHCs, were those that received grant funding from HRSA to provide enrollment assistance. We identified FQHCs using the contact list provided by HRSA. A small percentage of FQHC Programs receive both HRSA grants and Marketplace Navigator grant funding; these were categorized as Navigators for our analysis. All other Assister Programs certified to provide assistance in Marketplaces were designated as CACs.
A total of 4,680 Programs were invited to participate in the study, and 713 Programs responded and were included (for a response rate of 15%). Because response rates varied by Program type, data were weighted to reflect the distribution in the initial sample by Program type and Marketplace type (FFM, FPM, or SBM). Weighted and unweighted proportions of the final sample by Program type are shown in the table below.
| Unweighted % of total | Weighted % of total | |
| FFM CAC | 23% | 34% |
| FFM FQHC | 15% | 14% |
| FFM Navigator/FEAP | 7% | 2% |
| FPM CAC | 3% | 4% |
| FPM FQHC | 2% | 2% |
| FPM Navigator/FEAP | 3% | 2% |
| SBM CAC | 18% | 22% |
| SBM FQHC | 11% | 8% |
| SBM Navigator/FEAP | 18% | 11% |
Nationwide Estimates
Using responses provided by Assister Programs in the study, we were able to estimate the number of Assister Program staff and the number of consumers they helped with eligibility and enrollment in Medicaid/CHIP and Qualified Health Plans during the second Open Enrollment period nationwide, by extrapolating response data to the national level. Survey participants were asked to provide the number of full-time equivalent Assisters in their Program and the number of consumers helped. Respondents who did not provide a numeric value for the number of consumers helped were asked to estimate a number using a range of options. In making our calculation, we used the midpoint value for responses that provided a range of numbers of consumers helped. Non-responses were imputed based on the type of Assister Program.
We also surveyed the work of Assister Programs outside of Open Enrollment as they helped people apply for Special Enrollment Periods, report mid-year changes to the Marketplace, and resolve post-enrollment problems. Using response data provided by returning Assister Programs, we were able to estimate the number of people nationally who received help from Assister Programs between the first and second Open Enrollment periods with each of these types of issues.
Brokers
To recruit brokers in the Federally-Facilitated Marketplace (FFM) states, we obtained contact information from a comprehensive file of brokers in the FFM states, made publicly available through HealthCare.gov.8 To obtain broker contact information from the SBM and FPM states, we asked Marketplaces to provide contact information, and when that was not provided, compiled contact information that was publicly available on Marketplace websites. As we estimate that there are tens of thousands of brokers selling non-group Marketplace policies nationwide, we drew a sample of 9,700 brokers based on their distribution by Marketplace type (FFM, FPM, or SBM). Our general sampling rule was to randomly select 10% of all contacts in each state; we oversampled in ten states where we had fewer than 500 contacts to begin with. Because we did not have a complete sample of Marketplace brokers in all states, we were not able to compute national estimates of the numbers of consumers helped by brokers.
Out of the 9,700 brokers who were invited to participate in the study, 662 responded and were included (for a response rate of 7%).
Toplines and Margin of Sampling Error
Survey toplines with overall frequencies of both Assister Programs and Brokers for all survey questions are available at https://www.kff.org/health-reform/report/2015-survey-of-health-insurance-marketplace-assister-programs-and-brokers/.
The sample size and margin of sampling error (MOSE) for the total sample and key subgroups of Assister Programs are shown in the table below. All statistical tests of significance account for the effect of weighting.
| Group | N (unweighted) | MOSE |
| Total | 713 | +/-4 percentage points |
| CAC | 311 | +/-6 percentage points |
| FQHC | 202 | +/-7 percentage points |
| Navigator and FEAP | 200 | +/-7 percentage points |
| Brokers | N (unweighted) | MOSE |
| Total | 662 | +/-4 percentage points |
Appendix
| Table A1: Characteristics of Consumers Helped by Assister Programs, 2014 vs. 2015 | ||
| Clients who were uninsured at time of assistance | 2014 | 2015 |
| All or nearly all | 46% | 36%* |
| Most | 43% | 47% |
| Some, but less than half | 7% | 13%* |
| Few or none | 2% | 2% |
| Don’t know | 18% | 19% |
| Clients determined eligible for Medicaid or CHIP | ||
| All or nearly all | 6% | 13%* |
| Most | 38% | 37% |
| Some, but less than half | 33% | 29% |
| Few or none | 16% | 19% |
| Don’t know | 6% | 3% |
| Clients falling into the coverage gap | ||
| All or nearly all | 1% | 4%* |
| Most | 12% | 11% |
| Some, but less than half | 36% | 36% |
| Few or none | 41% | 44% |
| Don’t know | 10% | 6% |
| Clients determined eligible for premium tax credits | ||
| All or nearly all | 8% | 11%* |
| Most | 38% | 40% |
| Some, but less than half | 40% | 35% |
| Few or none | 10% | 11% |
| Don’t know | 5% | 4% |
| Clients eligible for Marketplace coverage without premium tax credits | ||
| All or nearly all | 0% | 1% |
| Most | 3% | 5%* |
| Some, but less than half | 26% | 26% |
| Few or none | 65% | 65% |
| Don’t know | 5% | 3% |
| Clients needing help understanding basic insurance concepts | ||
| All or nearly all | 33% | 30% |
| Most | 41% | 44% |
| Some, but less than half | 19% | 18% |
| Few or none | 5% | 5% |
| Don’t know | 2% | 3% |
| *Significantly different from 2014 estimate at the 95% confidence levelNOTE: Numbers may not sum to 100% due to rounding | ||
| Table A2: Average Time Assister Programs Spent Helping Each Client New to Marketplace | ||
| 2014 | 2015 | |
| Less than one hour | 13% | 18%* |
| One hour up to two hours | 64% | 66% |
| Two hours up to three hours | 18% | 12%* |
| Three hours up to four hours | 3% | 2% |
| Four hours or longer | 2% | 1% |
| Mean | 1.7 hours | 1.5 hours* |
| Median | 1.6 hours | 1.5 hours |
| *Significantly different from 2014 estimate at the 95% confidence levelNOTE: Numbers may not sum to 100% due to rounding | ||
| Table A3: Topics on Which Assister Programs Would Like Additional Training, 2014 vs. 2015 | ||
| 2014 | 2015 | |
| Tax-related Issues | 41% | 43% |
| Immigration-related Issues | 39% | 39% |
| Medicare-related Issues | 34% | 33% |
| Appeals | 36% | 31%* |
| Providing Post-enrollment Help | 41% | 29%* |
| Medicaid and CHIP Eligibility | 35% | 29%* |
| Differences in QHP Features | 39% | 29%* |
| Low Health Insurance Literacy | 34% | 28%* |
| Exemptions | 33% | 27%* |
| Renewing Coverage and Subsidies | – | 20%* |
| Eligibility for Premium Tax Credits | 32% | 20%* |
| Special Enrollment Periods | 27% | 15%* |
| *Significantly different from 2014 estimate at the 95% confidence level | ||
Endnotes
- Center for Consumer Information and Insurance Oversight, “Navigator Grant Recipients for States with Federally-facilitated or State Partnership Marketplace, ” available at http://www.cms.gov/CCIIO/Programs-and-Initiatives/Health-Insurance-Marketplaces/Downloads/Navigator-Grantee-Summaries-UPDATED-05-05-15.pdf. ↩︎
- The 14 SBM states in year two were California, Colorado, Connecticut, District of Columbia, Hawaii, Idaho, Kentucky, Maryland, Massachusetts, Minnesota, New York, Rhode Island, Vermont and Washington. The 4 consumer assistance FPM states were Delaware, Illinois, New Hampshire and West Virginia. Arkansas has been approved for status as a consumer assistance FPM in year one, but ceased providing state support for consumer assistance in year two and so was included with FFM states for this analysis. ↩︎
- Information on funding for In-person Assisters and Navigators provided by state-based marketplaces collected by KFF staff through information available on state websites and through conversations with state officials. ↩︎
- During the second Open Enrollment period, FEAPs operated in Arizona, Florida, Georgia, Indiana, Louisiana, North Carolina, New Jersey, Ohio, Pennsylvania, and Texas. ↩︎
- Twelve CAP programs received limited supplemental grants for FY 2015: California, Connecticut, District of Columbia, Maine, Maryland, Massachusetts, Michigan, Mississippi, Missouri, New York, North Carolina, and Vermont. ↩︎
- In year one, California provided for a type of Assister Program called Certified Enrollment Counselors (CECs) that were paid by the Marketplace on a per-enrollment basis. Subsequently, federal regulations prohibited Marketplaces from funding Navigators on a per-enrollment basis. For year two, California established a new Navigator Program, funded through Marketplace grants. The CEC program continues in California, though not all CECs receive Marketplace reimbursement. During the first two years, there were between 600 and 700 CEC Programs in California. During the first year of this survey, all CECs were classified as Navigator/In-Person Assister Programs. During the second year of this survey, CECs were included in the CAC classification. This change in classification accounts for roughly a 10 percentage point change, from year 1 to year 2, in the proportion of total Assister Programs that are CACs. ↩︎
- Estimates were derived by extrapolating survey responses (on how many staff worked for Assister Programs and hope many people were helped) to data on the number of Assister Programs nationwide collected from the Marketplaces. ↩︎
- https://localhelp.healthcare.gov/ ↩︎