Kaiser Health Tracking Poll – June 2018: Views Towards Older Adults and Access to Guns
Findings
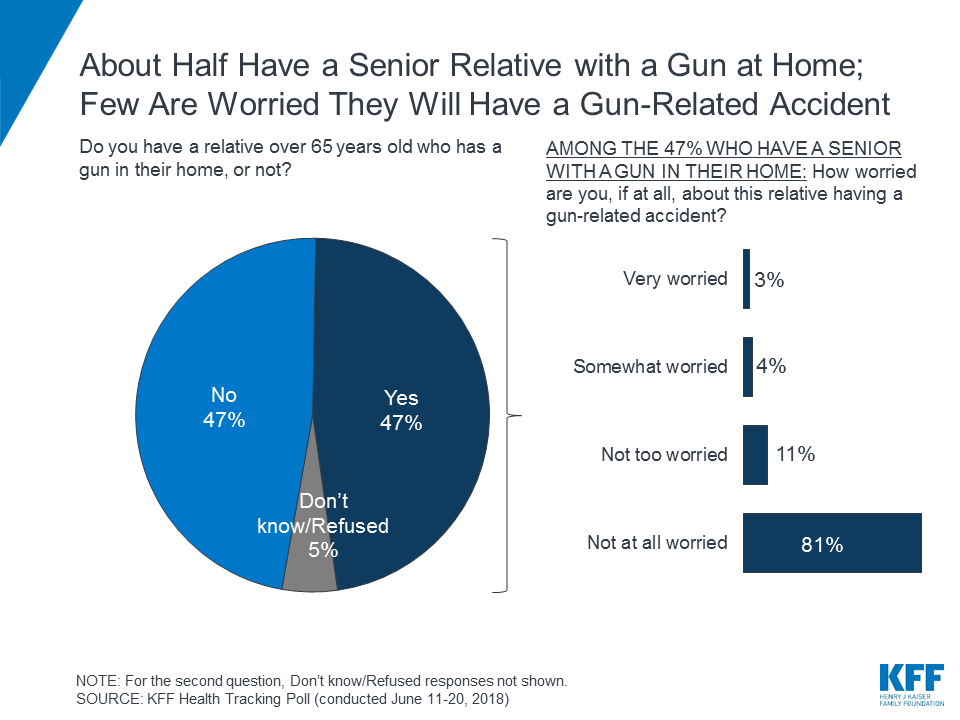
This month’s Kaiser Health Tracking Poll asked the public about access to guns among seniors. Nearly half (47 percent) say they have an older relative, over the age of 65, who has a gun in their home. Yet, few of these individuals report being worried that their relative will have a gun-related accident. Few (7 percent) say they are either “very worried” or “somewhat worried” that their senior relative will have a gun-related accident while the vast majority say they are “not at all worried” (81 percent) or “not too worried” (11 percent).
Methodology: Designed and analyzed by public opinion researchers at the Kaiser Family Foundation, the poll was conducted from June 11-20, 2018 among a nationally representative random digit dial telephone sample of 1,492 adults. Interviews were conducted in English and Spanish by landline (319) and cell phone (1,173). The margin of sampling error is plus or minus 3 percentage points for the full sample. For results based on subgroups, the margin of sampling error may be higher.
Methodology
This Kaiser Health Tracking Poll was designed and analyzed by public opinion researchers at the Kaiser Family Foundation (KFF). The survey was conducted June 11th–20th 2018, among a nationally representative random digit dial telephone sample of 1,492 adults ages 18 and older, living in the United States, including Alaska and Hawaii (note: persons without a telephone could not be included in the random selection process). Computer-assisted telephone interviews conducted by landline (319) and cell phone (1,173, including 793 who had no landline telephone) were carried out in English and Spanish by SSRS of Glen Mills, PA. To efficiently obtain a sample of lower-income and non-White respondents, the sample also included an oversample of prepaid (pay-as-you-go) telephone numbers (25% of the cell phone sample consisted of prepaid numbers) as well as a subsample of respondents who had previously completed Spanish language interviews on the SSRS Omnibus poll (n=10). Both the random digit dial landline and cell phone samples were provided by Marketing Systems Group (MSG). For the landline sample, respondents were selected by asking for the youngest adult male or female currently at home based on a random rotation. If no one of that gender was available, interviewers asked to speak with the youngest adult of the opposite gender. For the cell phone sample, interviews were conducted with the adult who answered the phone. KFF paid for all costs associated with the survey.
This month’s poll also includes an analysis of young women under the age of 45 (n=402). To obtain a large enough sample, the sampling frame included an oversample of women using cell phones (n=59) as well as callbacks among women who fit the screening criteria using the SSRS Omnibus poll (n=182).
The combined landline and cell phone sample was weighted to balance the sample demographics to match estimates for the national population using data from the Census Bureau’s 2016 American Community Survey (ACS) on sex, age, education, race, Hispanic origin, and region along with data from the 2010 Census on population density. The sample was also weighted to match current patterns of telephone use using data from the July-December 2017 National Health Interview Survey. The weight takes into account the fact that respondents with both a landline and cell phone have a higher probability of selection in the combined sample and also adjusts for the household size for the landline sample, and design modifications, namely, the oversampling of prepaid cell phones and likelihood of non-response for the re-contacted sample. All statistical tests of significance account for the effect of weighting.
The margin of sampling error including the design effect for the full sample is plus or minus 3 percentage points. Numbers of respondents and margins of sampling error for key subgroups are shown in the table below. For results based on other subgroups, the margin of sampling error may be higher. Sample sizes and margins of sampling error for other subgroups are available by request. Note that sampling error is only one of many potential sources of error in this or any other public opinion poll. Kaiser Family Foundation public opinion and survey research is a charter member of the Transparency Initiative of the American Association for Public Opinion Research.
Group | N (unweighted) | M.O.S.E. |
| Total | 1,492 | ±3 percentage points |
| Party Identification | ||
| Democrats | 495 | ±5 percentage points |
| Republicans | 376 | ±6 percentage points |
| Independents | 445 | ±5 percentage points |
| Voter registration | ||
| Registered voters | 1,177 | ±3 percentage points |
Democratic voters | 411 | ±6 percentage points |
Republican voters | 333 | ±6 percentage points |
Independent voters | 329 | ±6 percentage points |
| Gender and Age | ||
| Men | 649 | ±4 percentage points |
| Women | 843 | ±4 percentage points |
Women <45 years old | 402 | ±6 percentage points |