Sun Belt Voices Project
Sun Belt Voters
Throughout the 2020 election, the Kaiser Family Foundation and Cook Political Report have collaborated on a series of projects examining the attitudes and experiences of voters in several key battleground states leading up the 2020 presidential election. In November 2019, we released the Blue Wall Voices Project, a survey of 3,222 voters in the four states constituting the “Democratic Blue Wall” – the area in the Upper Midwest that was previously considered a Democratic stronghold. The Sun Belt Voices Project is our newest collaboration and includes 3,479 interviews with voters in Arizona, Florida, and North Carolina – three states in which shifting population characteristics may give Democrats an advantage in the more traditionally Republican region of the U.S. Using an innovative probability-based approach of contacting registered voters and allowing poll respondents to participate online or over the telephone, KFF and The Cook Political Report interviewed 1,298 voters in Arizona, 1,009 voters in Florida, and 1,172 voters in North Carolina from August 29 to September 13, 2020. For more details, please see the methodology section of this report.
Sun Belt Voices Project
A Collaboration Between KFF and The Cook Political Report
Key Findings
- Most voters have made up their minds about how they will vote for president, with results suggesting very close elections in each of the three Sun Belt states included in this project. With most voters in Arizona, Florida, and North Carolina reporting they have already made up their minds about which presidential candidate they plan to vote for in November, the poll, fielded August 29-September 13, finds former Vice President Joe Biden with a slight lead in Arizona (Trump: 40%, Biden: 45%), and the results in Florida and North Carolina within the margin of sampling error; Florida (Trump: 42%, Biden: 43%), North Carolina (Trump: 43%, Biden: 45%).
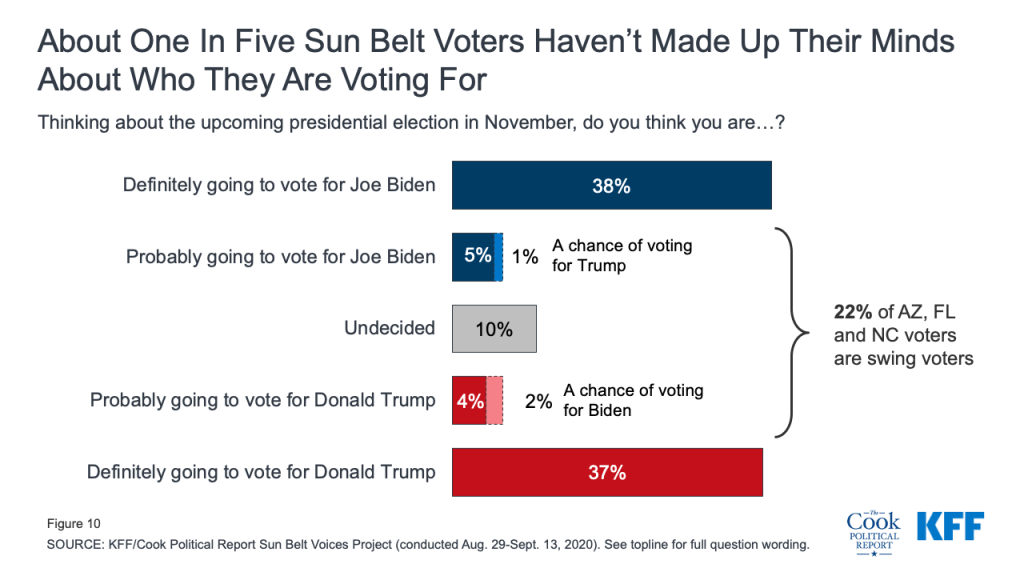
- About one in five voters are “swing voters” but that doesn’t mean all of these votes are up for grabs. In all three states, nearly one-fourth of voters are swing voters. This includes about one in ten voters who say they are truly “undecided” and a similar share of voters who say they are “probably” going to vote for one candidate, but haven’t definitively made up their minds. Few of those who say they are “probably” going to vote for one candidate say there is a “chance” they would vote for the other candidate, suggesting that some of these “swing” voters just may not vote on election day.
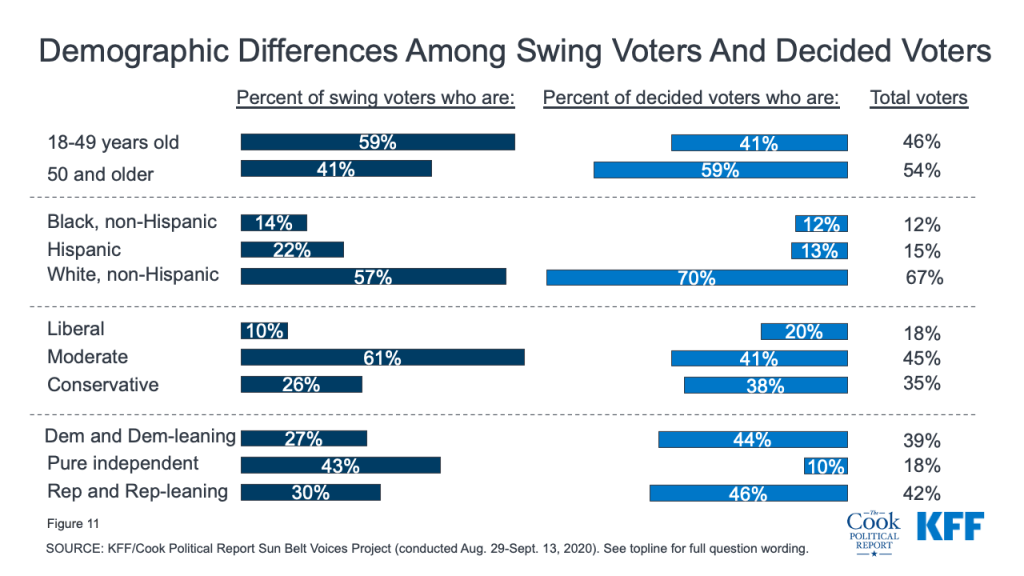
- Swing voters are younger, have more moderate views, and a larger share are Hispanic voters, and also give Biden higher approval ratings than Trump. The crucial group of voters who have not yet decided who they plan to vote for in the 2020 election are younger, and larger shares identify as political moderates and independents. In addition, a larger share of swing voters than decided voters are Hispanic voters. They are also more likely to approve of former Vice President Biden than President Trump.
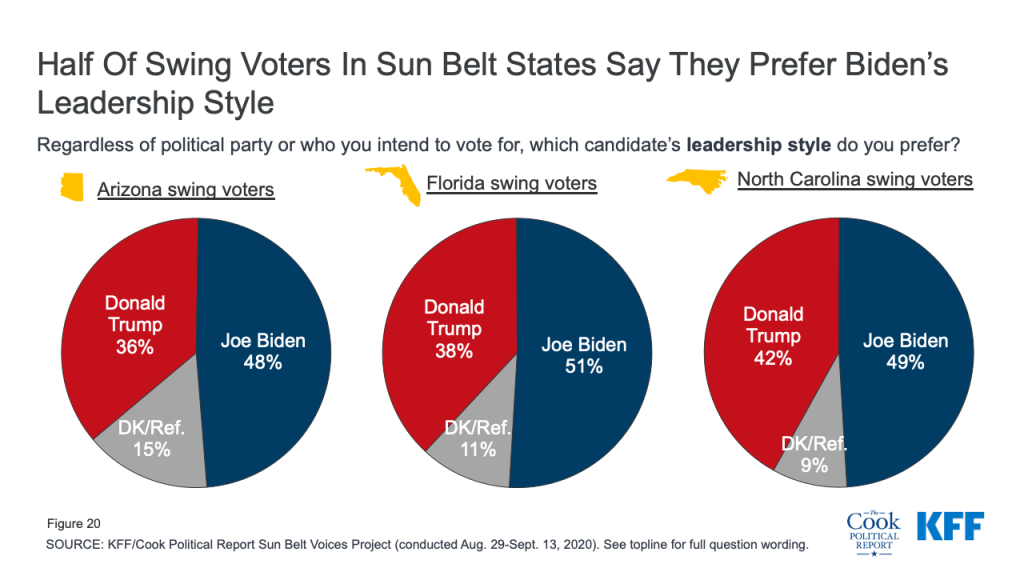
- Half of swing voters prefer Biden’s leadership style but less than half see either candidate as a “strong leader.” Half of swing voters say, regardless of who they plan to vote for, they prefer Biden’s leadership style over President Trump’s (39% say they prefer Trump’s leadership style). Yet, less than half of swing voters say strong leader describes either President Trump (46%) or Joe Biden (39%). In addition, nearly two-thirds (64%) of swing voters say President Trump is unpredictable and this is a bad thing including a majority of swing voters in Arizona, Florida, and North Carolina.
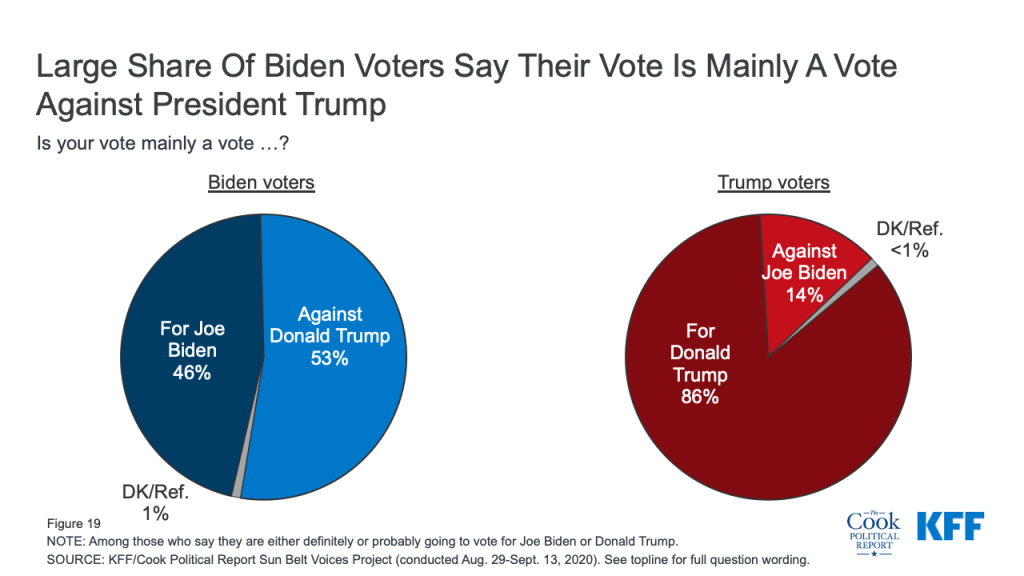
- President Trump is a motivating force for both Trump voters and Biden voters. Large majorities of voters who say they are going to vote for President Trump (either “definitely” or “probably”) say their vote is mainly a vote for Trump rather than a vote against Biden (86% v. 14%). On the other hand, more than half of Biden voters (53%) say their vote is mainly a vote against President Trump rather than a vote for Biden.
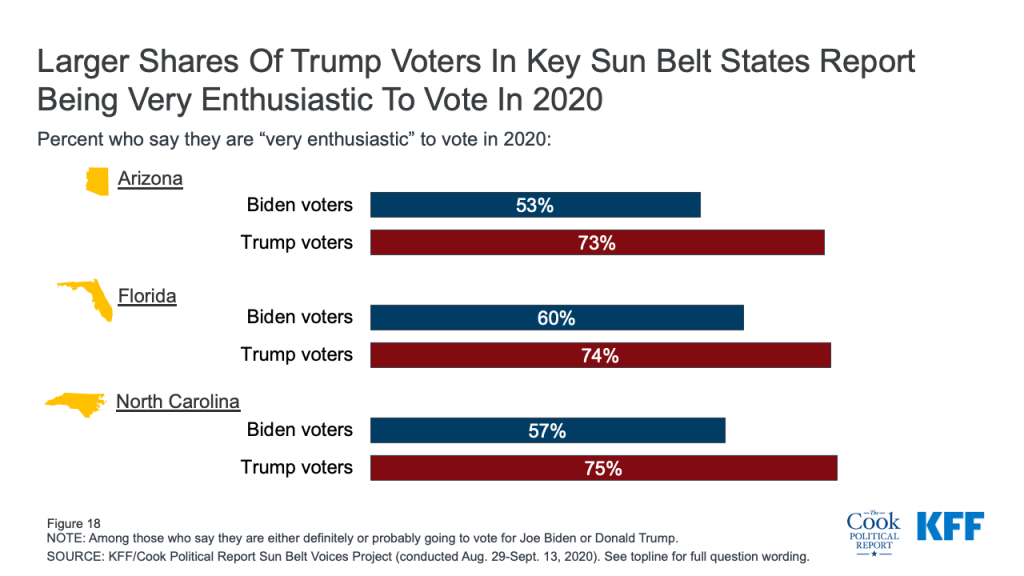
- Trump voters report higher levels of enthusiasm than Biden voters. President Trump’s voters have the enthusiasm advantage in each of the three Sun Belt states included in this poll with about three-fourths of Trump voters in Arizona (73%), Florida (74%), and North Carolina (75%) saying they are “very enthusiastic” to vote for him. Comparatively, about six in ten Biden voters in each of these states say the same (Arizona: 53%, Florida: 60%, N.C.: 57%).
- The 2020 election is about different issues, depending on voters’ party identification. Similar to national poll results, the economy is the top presidential election issue for Republican Sun Belt voters, while Democratic voters are prioritizing the coronavirus outbreak and race relations. On most issues, a larger share of voters trust Joe Biden to do a better job than President Trump. However, on the economy – voters’ top issue overall – more voters trust Trump than Biden (54% compared to 44%).
Top Issues for Sun Belt Voters
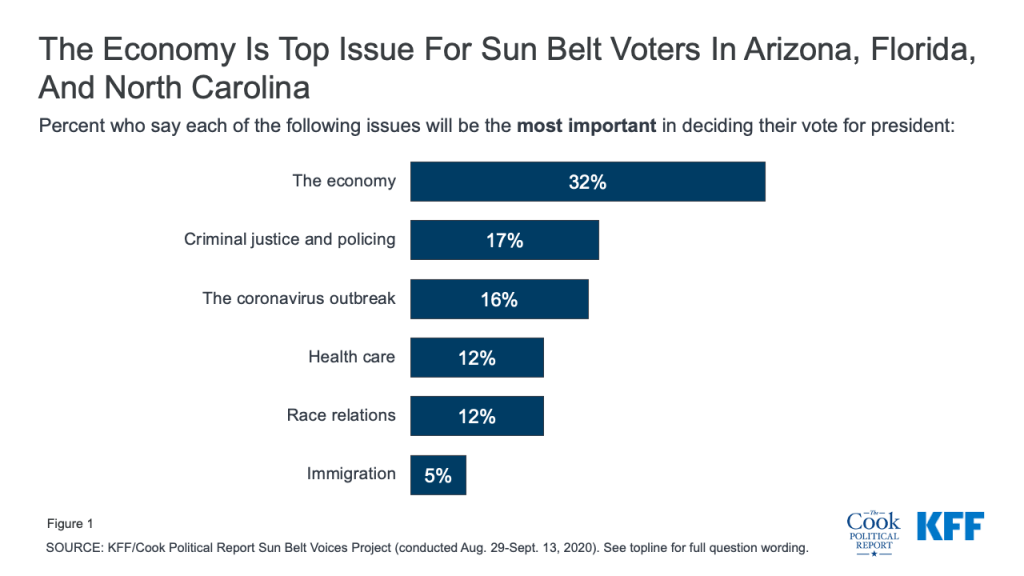
One-third of voters (32%) in Arizona, Florida, and North Carolina, three key states in the West and South’s Sun Belt region, say the economy is going to be the most important issue in their 2020 vote choice. This is followed by, criminal justice and policing (17%), the coronavirus outbreak (16%) health care (12%), and race relations (12%). Few voters (5%) say immigration is their top issue. This is also consistent with a recent shift in national polling in which the economy and the coronavirus outbreak, a public health issue, has displaced health care more generally as the top issue for voters.
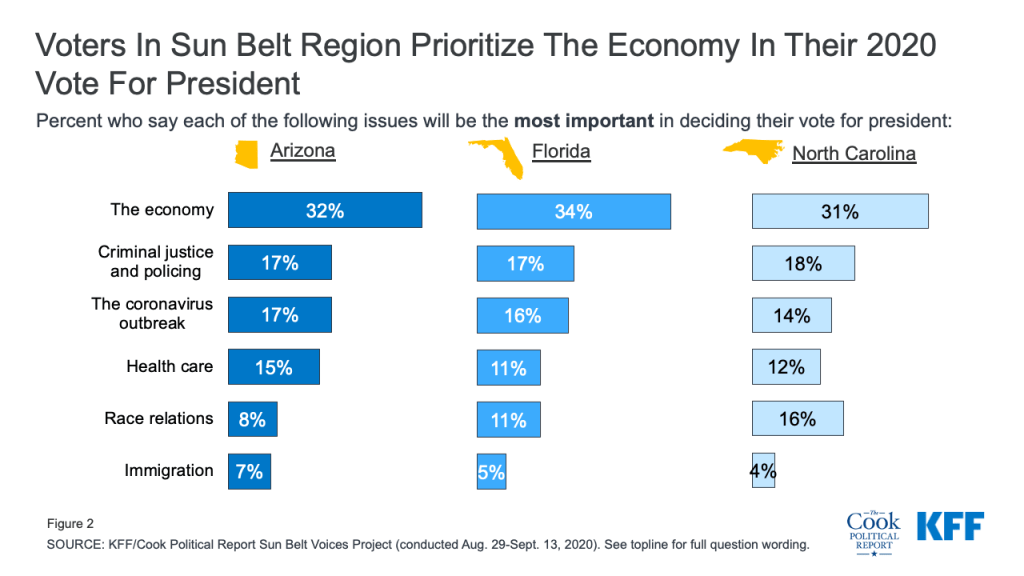
The economy is the top issue among voters in Arizona (32%), Florida (34%), and North Carolina (31%), followed by criminal justice and policing and the coronavirus outbreak, with both of these two issues ranking similarly among Arizona, Florida, and North Carolina voters.
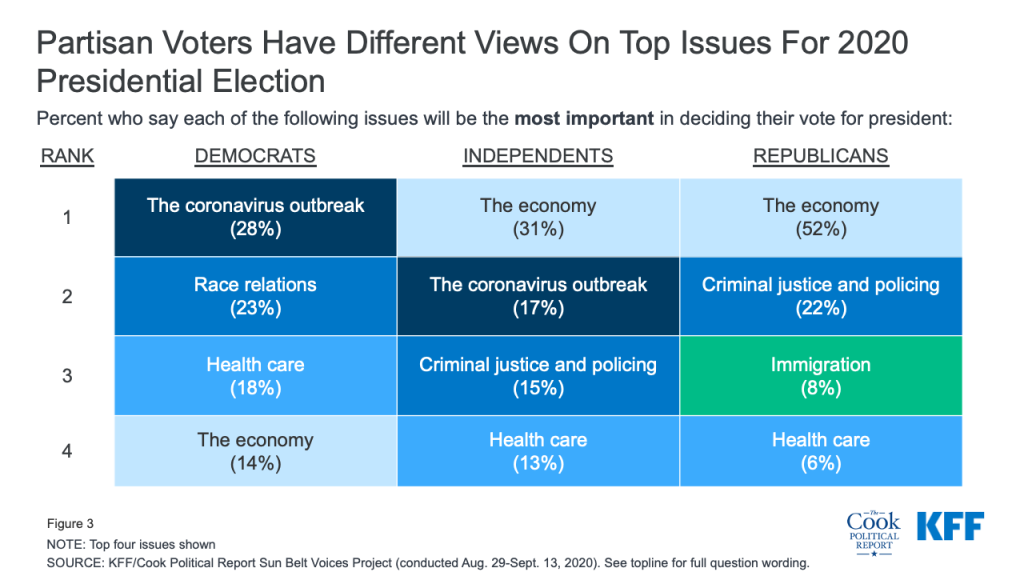
Partisan voters have very different priorities for the 2020 election when it comes to the top issues driving their votes. Overall, half of Republican voters in these 3 states (52%) say the economy is the most important issue in their 2020 vote choice, more than twice as many as say any other issue. One in five (22%) choose criminal justice and policing, an issue touted often by President Trump, as the most important issue. Democrats, on the other hand, are prioritizing the coronavirus outbreak in their 2020 vote choice with nearly three in ten saying it is the most important issue (28%), followed by race relations (23%) health care (18%), and the economy (14%). Three in ten independents (31%) say the economy is the most important issue followed by the coronavirus outbreak (17%).
This partisan divide on the key issues in the 2020 election is consistent across each of the three states examined in this poll with large shares of Republican voters in Arizona, Florida, and N.C. saying the economy is the most important issue while Democratic voters in Arizona and Florida chose the coronavirus outbreak as their top issue. N.C. Democratic voters were divided between the coronavirus outbreak and race relations as their top issues. Few Republican voters in any of the three states chose either the coronavirus outbreak or race relations as their top issue. About three in ten independent voters chose the economy as their top issue.
| Table 1: Partisans Across Key Sun Belt States Are Divided On Most Important Issue For 2020 | |||||
| Percent of voters who say each issue will be the most important in deciding their vote for president: | The economy | The coronavirus outbreak | Criminal justice and policing | Race relations | |
| Democratic voters | AZ | 15% | 30% | 7% | 18% |
| FL | 14 | 31 | 13 | 22 | |
| NC | 15 | 22 | 15 | 27 | |
| Independent voters | AZ | 31 | 20 | 16 | 8 |
| FL | 32 | 17 | 16 | 8 | |
| NC | 30 | 16 | 13 | 14 | |
| Republican voters | AZ | 47 | 7 | 26 | <1% |
| FL | 54 | 4 | 20 | 3 | |
| NC | 50 | 4 | 24 | 3 | |
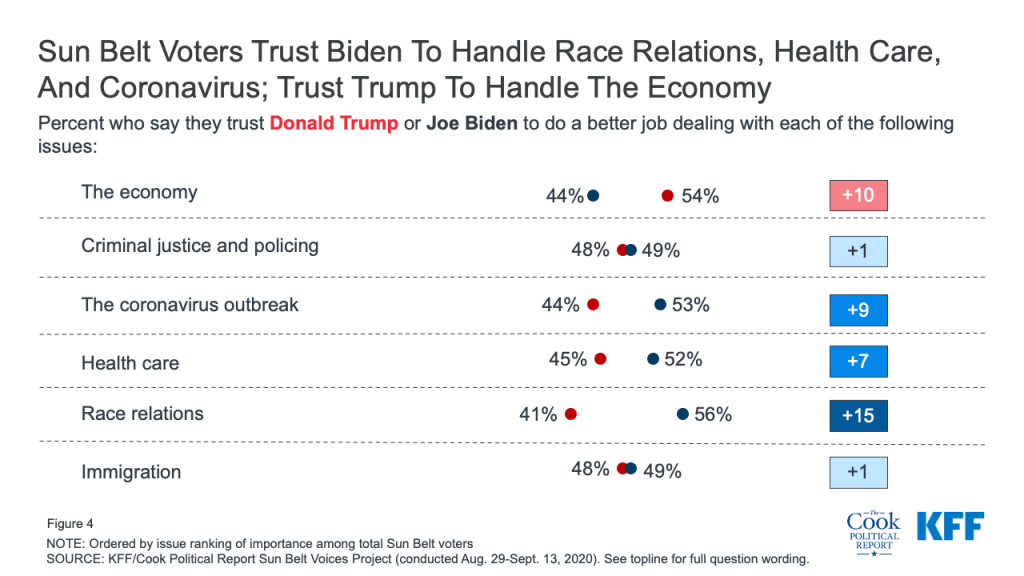
With the economy topping the issues for voters heading into the 2020 election, the Sun Belt Voices Project finds that this is the one issue on which President Trump has a trust advantage over Joe Biden. Slightly more than half (54%) of voters in the Sun Belt states say they trust Donald Trump to do a better job dealing with the economy compared to 44% who say they trust Joe Biden. Joe Biden, on the other hand, has the advantage on other key issues such as health care, race relations, and the coronavirus outbreak. Voters were split between the two candidates on who they trust to do a better job handling immigration and criminal justice and policing.
Once again, this is consistent across all three states with only one variation; President Trump has the advantage when it comes to the economy while Biden holds an advantage on health care, race relations, and the coronavirus outbreak. On immigration and criminal justice and policing, voters are more divided on which candidate they think will do a better job.
| Table 2: Who Do Voters Trust To Handle Key Issues? | |||
| Percent of voters who say they trust… will do a better job dealing with each of the following issues: | Arizona | Florida | North Carolina |
| Race relations | |||
| Trump | 40% | 41% | 42% |
| Biden | 57 | 56 | 55 |
| Biden +17 | Biden +15 | Biden +13 | |
| The coronavirus outbreak | |||
| Trump | 43 | 45 | 43 |
| Biden | 54 | 52 | 54 |
| Biden +11 | Biden +7 | Biden +11 | |
| Health care | |||
| Trump | 44 | 45 | 45 |
| Biden | 53 | 52 | 53 |
| Biden +9 | Biden +7 | Biden +8 | |
| Criminal justice and policing | |||
| Trump | 47 | 49 | 48 |
| Biden | 50 | 48 | 50 |
| Biden +3 | Trump +1 | Biden +2 | |
| Immigration | |||
| Trump | 47 | 48 | 49 |
| Biden | 51 | 49 | 49 |
| Biden +4 | Biden +1 | — | |
| The economy | |||
| Trump | 52 | 55 | 53 |
| Biden | 45 | 43 | 45 |
| Trump +7 | Trump +12 | Trump +8 | |
The Current State Of Races In Key Sun Belt States
President Trump and former Vice President Biden have slightly fewer than four in ten voters in each of the three states saying they are “definitely” going to vote for them. Thirty-eight percent of Arizona voters as well as 37% of Florida voters and 39% of N.C voters say they are “definitely going to vote for Joe Biden.” This is similar to the share of voters who say they are “definitely going to vote for President Trump” in Arizona (35%), Florida (37%), and North Carolina (37%). One in ten voters say they are “probably going to vote for President Trump” (AZ: 5%; FL: 5%; N.C: 6%), or “probably going to vote for Joe Biden” (AZ: 7%; FL: 6%; N.C: 6%); while another one in ten say they are undecided (AZ: 11%; FL: 11%; N.C: 9%),
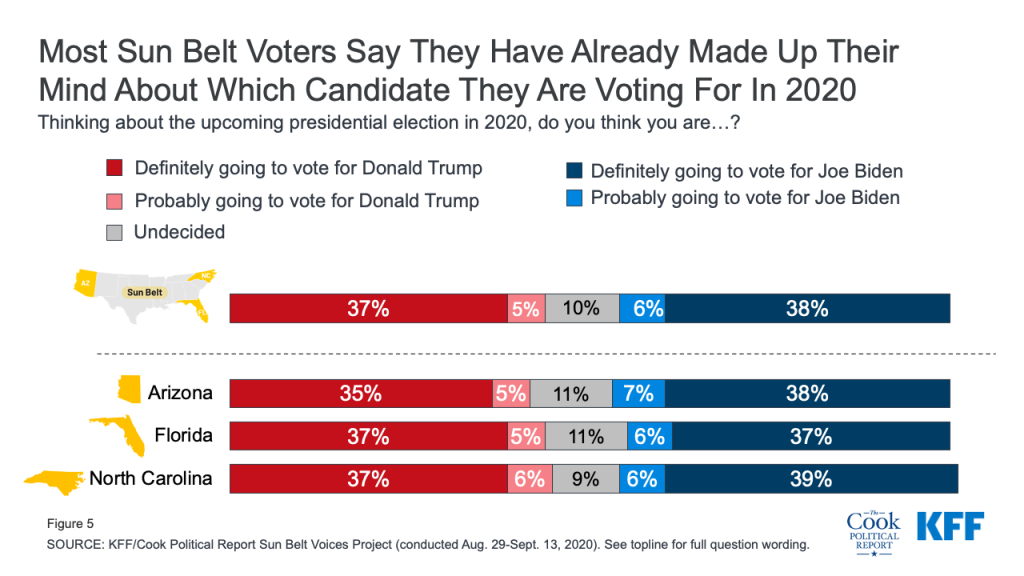
Putting together “definitely” and “probably” groups, these results indicate that, with less than two months before the 2020 November election, the presidential race in each of these three Sun Belt states is very close with Biden having a slight edge in Arizona (Trump: 40%, Biden: 45%), and within the margin of sampling error in Florida (Trump: 42%, Biden: 43%) and North Carolina (Trump: 43%, Biden: 45%).
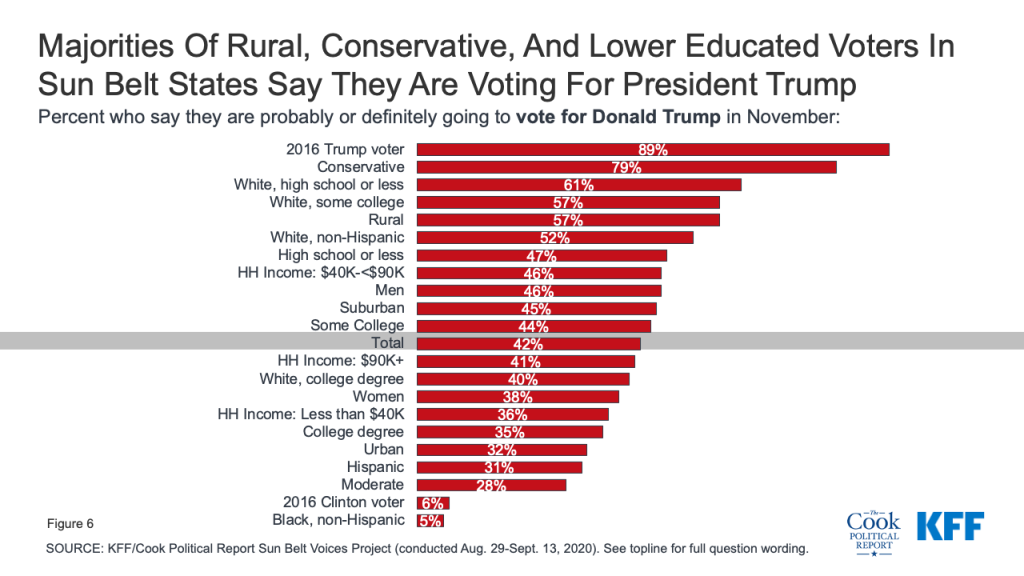
Overwhelmingly, President Trump and Vice President Joe Biden are garnering support from their key “bases,” the groups that tend to support one party’s candidate over another and are predicted to vote in favor of the candidate. President Trump has majority support among conservative voters, rural voters, as well as white voters with lower levels of education. In addition, nine in ten (89%) voters who voted for him in 2016 say they plan to vote for him in 2020 while 5% of these voters say they are going to vote for Biden and 5% are still undecided.
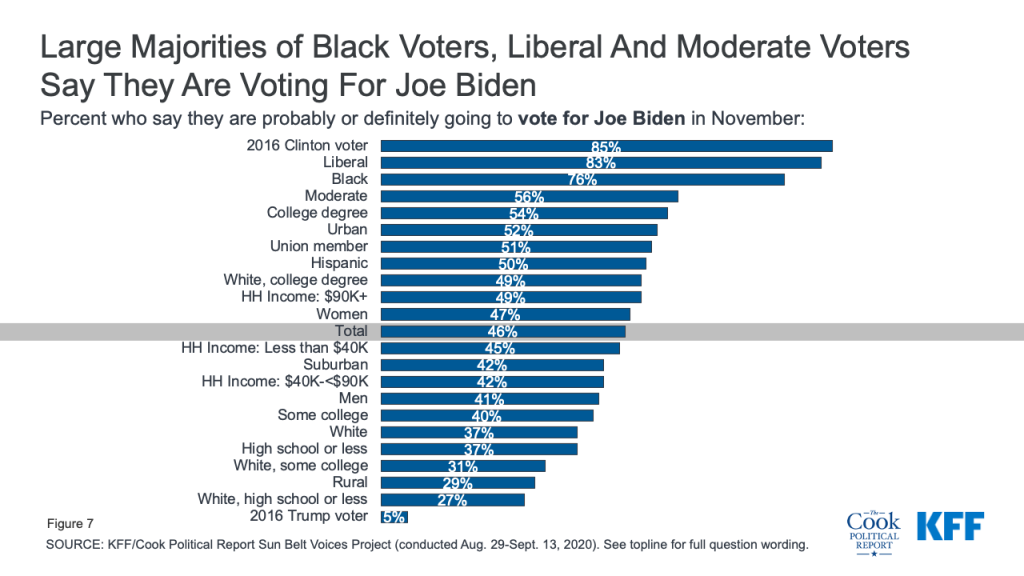
Biden, on the other hand, garners majority support from black voters, liberal voters, voters who voted for Secretary Clinton in 2016. More than half of moderate voters (56%) also say they are going to vote for Biden in November.
Who Are the Decided Voters and Swing voters?
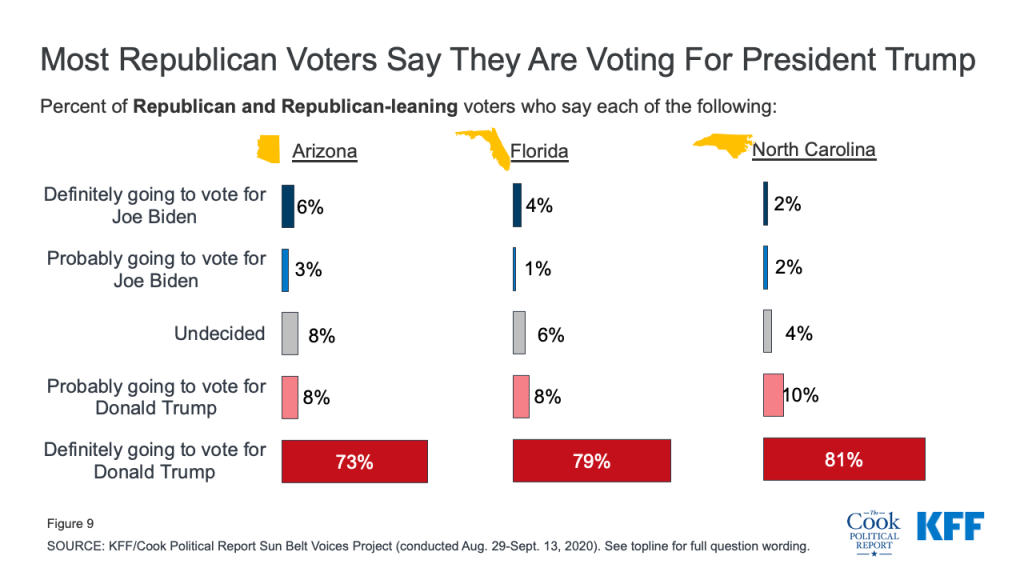
Three-fourths of voters in Arizona, Florida, and North Carolina say they have already made up their minds about which candidate they plan to vote for in the 2020 presidential election and the results indicate a very close election in these states. A majority of Democratic voters and Republican voters in each state say they aren’t going to cast a vote for the other party’s candidate. About eight in ten Democratic and Democratic-leaning independent voters in Arizona (81%), Florida (83%) and North Carolina (80%) say they are definitely going to vote for Joe Biden.
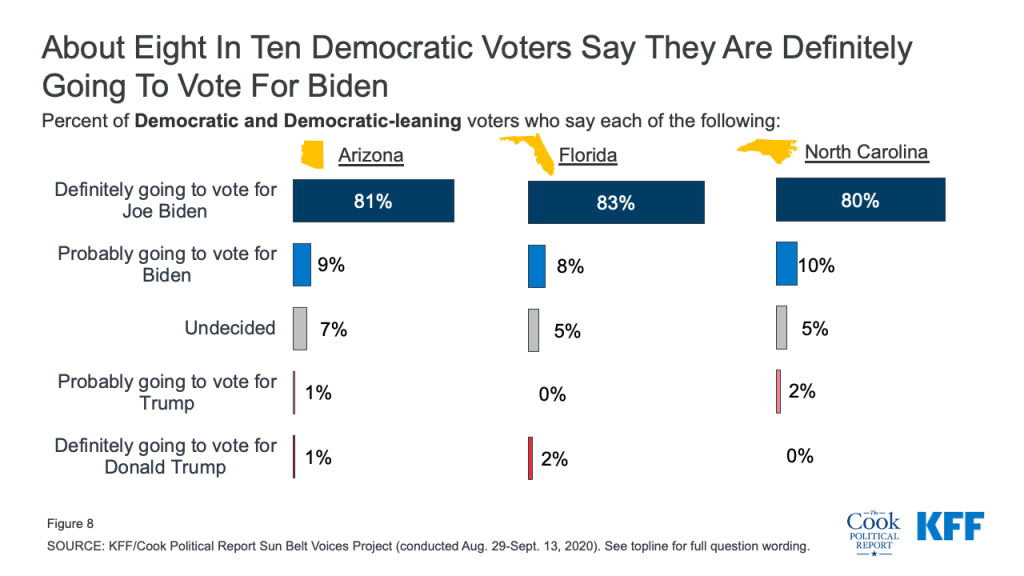
Similar shares of Republican and Republican-leaning voters say they are “definitely going to vote for President Trump” including three-fourths of Arizona (73%), and eight in ten voters in Florida (79%), and N.C. (81%). There is a small but noticeable share of Republican and Republican-leaning voters who say they are “definitely” going to vote for Joe Biden, including 6% in Arizona.
Nearly one-fourth of voters in each of the three states are “swing voters,” a crucial group of voters who have not yet made up their minds about which candidate they plan to vote for. There are not significant differences on the share of voters who are “swing voters” across these Sun Belt states, with similar shares of voters in Arizona (23%), Florida (22%), and North Carolina (21%) saying they are either “probably” going to vote for a candidate or are “undecided.” This is also consistent with our national KFF Health Tracking Poll data which also finds about one-fourth of voters are “swing voters.”
It is important to note that not all “swing voters” could potentially change their vote to support the other party’s candidate. One-third of those who say they are probably going to vote for President Trump say there is “a chance” they will vote for Joe Biden (2% of all voters) and one-fifth of those who say they are probably going to vote for Joe Biden say there is “a chance” they are going to vote for President Trump (1% of all voters); most “probably” voters, on the other side of the ballot, say there is “no chance” they will vote for the other party’s candidate (67% of voters probably voting for President Trump or 4% overall, 80% of voters probably voting for Joe Biden or 5% overall). This is similar across Arizona, Florida, and North Carolina with few voters saying they are “probably” going to vote for one candidate but there is “a chance” they would vote for the other candidate.
On most demographics, swing voters look very similar to their counterparts (voters who say they have already decided who they are going to vote for in the 2020 election), but they differ on three key variables: age, party identification, and ideology. Swing voters generally are more likely to say they are moderate in terms of their ideology (61%) and a larger share identify as political independents (43%) than their decided counterparts (10%). In addition, swing voters are slightly younger as a whole with about six in ten under the age of 50. In addition, nearly one in four swing voters are Hispanic voters (22%) compared to 13% of decided voters.
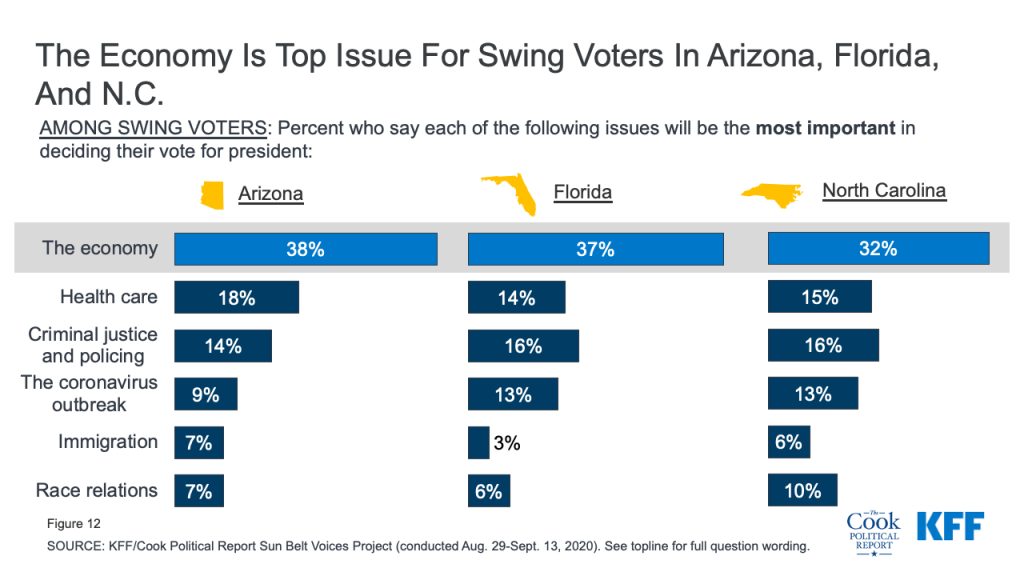
While a similar share of swing voters say they are Democrats or Democratic-leaning independents (27%) as say they are Republicans or Republican-leaning independents (30%), their top issue for their vote choice is more like the priorities of Republicans than Democrats. Large shares of swing voters in each of the three states (AZ: 38%, FL: 37%, N.C.: 32%) say the economy is going to be the most important issue in deciding their vote for president while significantly fewer say the same about any other issue – including the coronavirus outbreak (AZ: 9%, FL: 13%, N.C.: 13%).
Job Approval
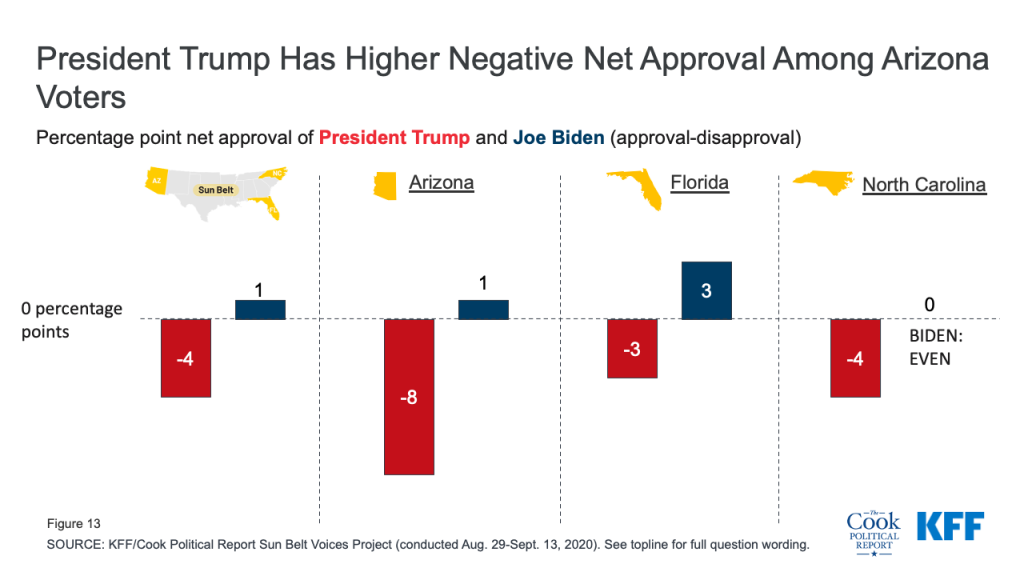
Throughout President Trump’s presidency, his overall net approval as remained largely stable except for a short dip over the summer – perhaps in response to his handling of the coronavirus outbreak. More recently, his overall job approval has been around 45% in national polling. President Trump has similar job approval among voters in these Sun Belt states – with one notable exception. Arizona voters are more disapproving than approving of the job Trump is doing as president, resulting in a negative net approval of – 8 percentage points.
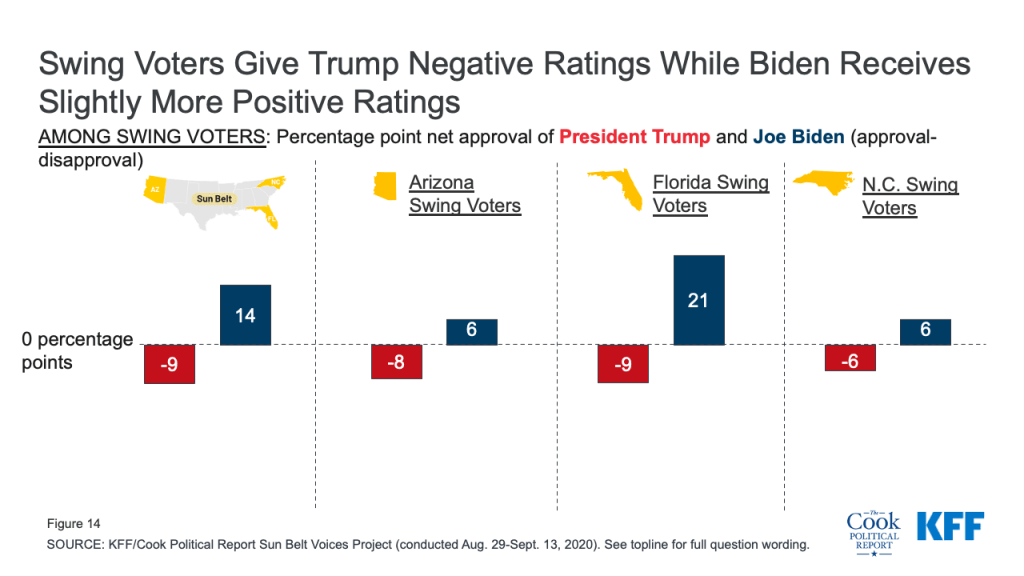
Among the small share of voters who haven’t made up their minds about which candidate to vote for, these swing voters are divided on their views of both President Trump and former Vice President Biden with a slightly larger share saying they approve of Biden. Overall, about half of swing voters approve, which is about as many as disapprove, of both the job Donald Trump is doing as president (Approve: 45%; Disapprove: 54%) and of Joe Biden generally (Approve: 56%; Disapprove: 42%), with slight variations within states. To see the full percentages for job approval for both President Trump and Biden in each of the three states, see the Appendix Table 1.
The connection between voters’ overall approval of both candidates and their ultimate choice in which candidate to vote for has been illustrated by others, especially in light of President Trump’s relatively stable overall job approval numbers throughout his presidency. Despite the twists and turns of the campaign and the various national issues that have captured voters’ attention, voters’ approval of the candidates continues to be one of the strongest predictors of vote choice. Our analysis of these Sun Belt states finds there is a small share of voters (5%) who say they “approve” of both former Vice President Biden and the job Donald Trump is doing as president (5% of voters in Arizona, 6% of voters in Florida, and 3% of voters in North Carolina). Overall, these voters tend to be less partisan, are more likely to identify as independents and moderates, and more than half are swing voters with 53% saying they are currently undecided about which candidate they plan to vote for while 9% say they are probably going to vote for President Trump and 7% say they are going vote for Biden.
Other Key races to Watch
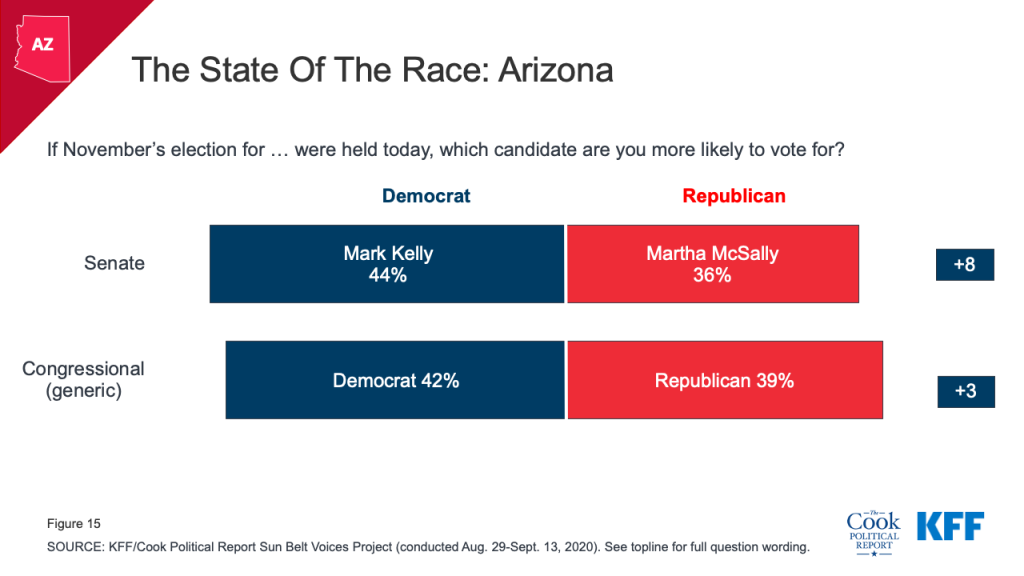
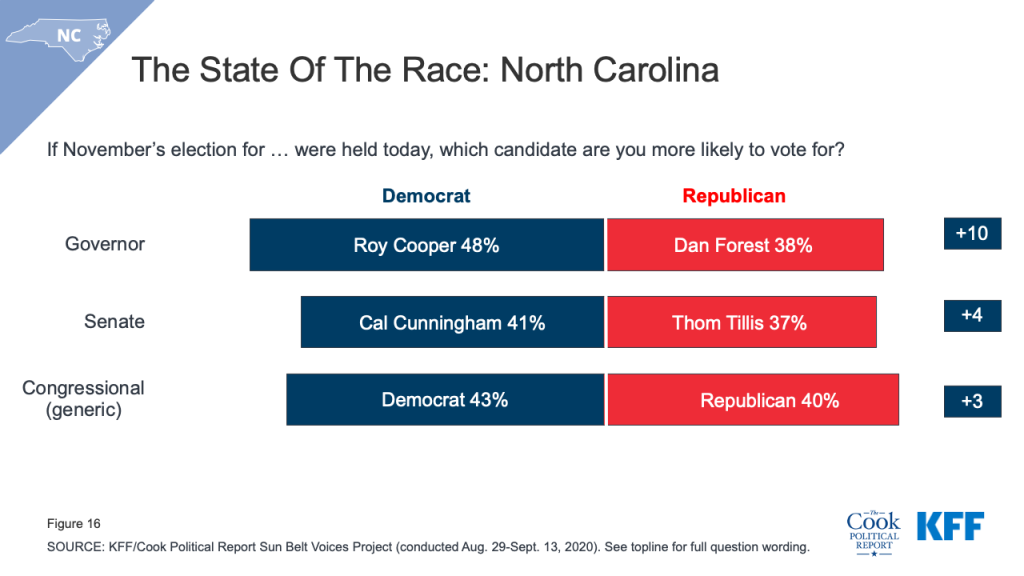
In addition to the presidential election, there are other important Senate races in Arizona and North Carolina, a gubernatorial race in North Carolina, as well as congressional races throughout each of the three states. To see the views of voters across demographics within each state, check out our state interactives.
As of the second week of September, a larger share of voters in Arizona say they are voting for Mark Kelly, NASA astronaut than incumbent Sen. Martha McSally (44% compared to 36%).
In North Carolina, Democratic Governor Roy Cooper (48%) has a lead over Republican Lt Governor Dan Forrest (38%), while the Senate election between Republican incumbent Thom Tillis and Cal Cunningham is within the margin of error.
Trump Voters Report Higher Enthusiasm In Key Sun Belt States, Motivation To Turnout Is Equal Across Partisans
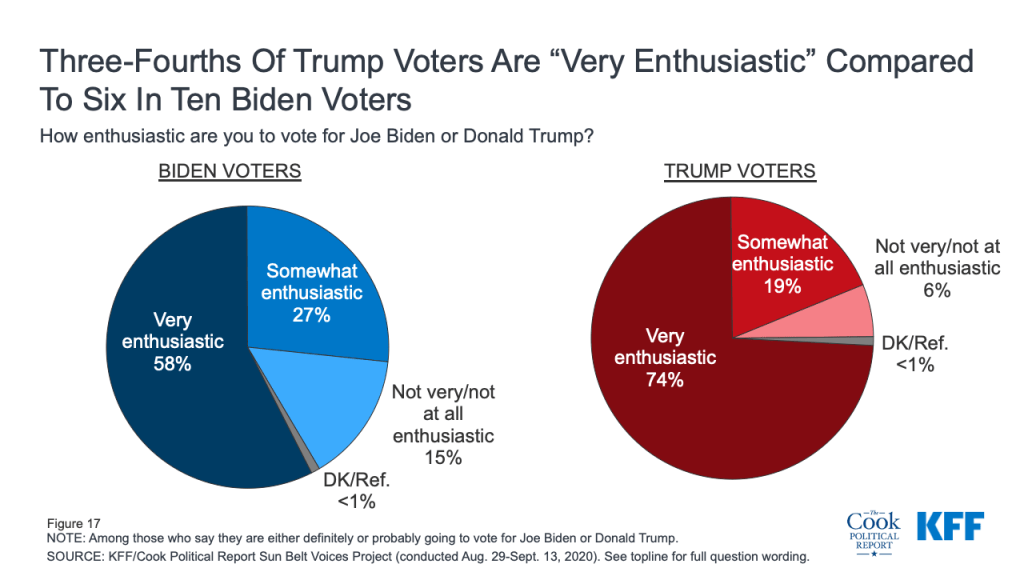
Three-fourths of voters (74%) who say they are voting for President Trump report being “very enthusiastic” about their vote with an additional one-fifth (19%) saying they are “somewhat enthusiastic.” Voters who say they are voting for Joe Biden report lower levels of enthusiasm with six in ten (58%) saying they are “very enthusiastic” with an additional 27% saying they are “somewhat enthusiastic.” One in seven Biden voters (15%) say they are either “not very enthusiastic” or “not at all enthusiastic” about voting for him compared to 6% of Trump voters who report the same.
Six in ten (61%) Biden voters say that his choice of Sen. Kamala Harris as his running mate makes them “more enthusiastic” about voting for him while one-third (34%) say “it does not make a difference.” Only 5% of Biden voters say the choice of Harris as the Vice President nominee makes them “less enthusiastic” about voting for the Democratic ticket.
President Trump’s voters have the enthusiasm advantage in each of the three Sun Belt states included in this poll with about three-fourths of Trump voters in Arizona (73%), Florida (74%), and North Carolina (75%) saying they are “very enthusiastic” to vote for him. Comparatively, about half of Biden voters in Arizona (53%) and about six in ten Biden voters in Florida (60%) and N.C. (57%) say they are “very enthusiastic” about their vote.
Last year’s Blue Wall Voices Project found that a larger share of Democratic voters saying they were “more motivated” to vote in the 2020 election compared to the 2016 election. The latest polling in these Sun Belt states finds that majorities of both Democratic and Republican voters say they are “more motivated” to vote in this year’s election.
| Table 3: Neither Party Has Advantage On Motivation | |||
| Percent who say they are more motivated to vote in the 2020 election than in the 2016 election: | Arizona | Florida | North Carolina |
| Total | 58% | 59% | 66% |
| Democratic voters | 64 | 63 | 71 |
| Independent voters | 50 | 55 | 63 |
| Republican voters | 65 | 67 | 71 |
Trump Is A Motivating Force For Voters
While Biden voters may not be as enthusiastic about their vote choice as Trump voters, this doesn’t mean that they aren’t motivated to vote. Instead, their motivation may be less for their vote choice, and more against President Trump.
Half of Biden voters (53%) in the Sun Belt states polled say their vote is mainly a vote “against Donald Trump” compared to 14% of Trump voters who say their vote is mainly one “against Joe Biden.” Nearly nine in ten (86%) Trump voters say their vote is mainly one “for Donald Trump.”
Biden voters who say their vote is mainly a vote “against Donald Trump” are younger and less partisan than their counterparts (those who say their vote is “for Joe Biden”).
Voters Still See Trump As The Unconventional Candidate
President Trump has long touted his unconventional leadership style and in 2016, he ran as the candidate who was going to deliver a shock to business as usual in Washington, D.C. Perhaps unsurprisingly, vast majorities of Democrats say they prefer Biden’s leadership style (96%) over President Trump’s (3%), while most Republicans say they prefer President Trump’s leadership style (92%). Independents in these three Sun Belt states slightly prefer Biden’s leadership style as do a majority of swing voters. Half of swing voters say regardless of who they intend to vote for, they prefer Joe Biden’s leadership style over President Trump’s. Four in ten (39%) swing voters say they prefer Trump’s leadership style while one in ten (11%) are unsure which style they prefer.
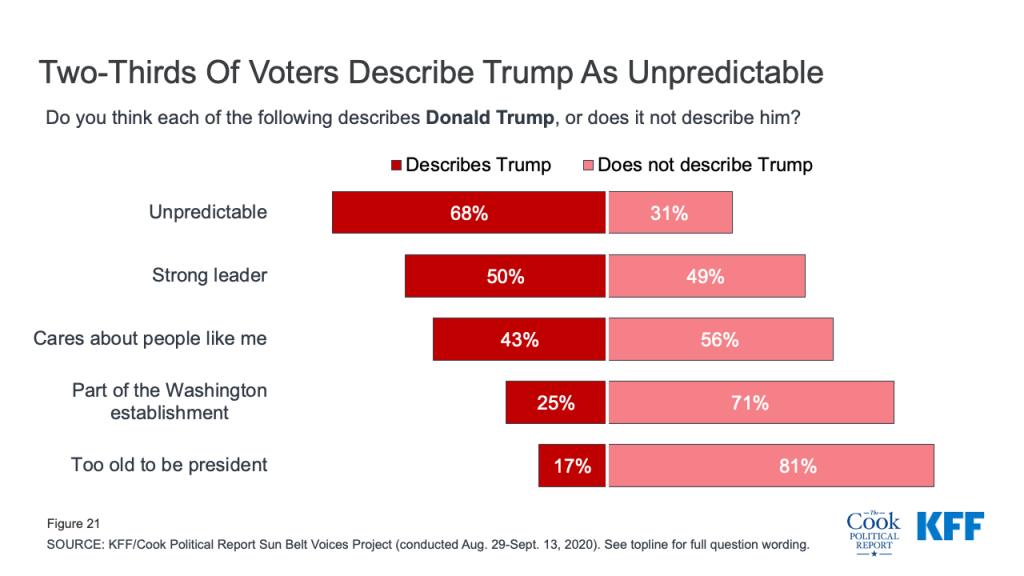
When given a list of characteristics that could describe President Trump, two-thirds of voters say unpredictable (68%) is a term that describes him while most voters say that being too old to be president (81%) and part of the Washington establishment (71%) are not terms to describe him. Most voters also say that cares about people like me is also not a description of President Trump (56%); however, 85% of Republican voters say this does describe him. Partisans are also divided on whether a strong leader is a good describer of President Trump with 92% of Republican voters saying it “does describe him” while 90% of Democratic voters and 53% of independent voters say it “does not describe him.”
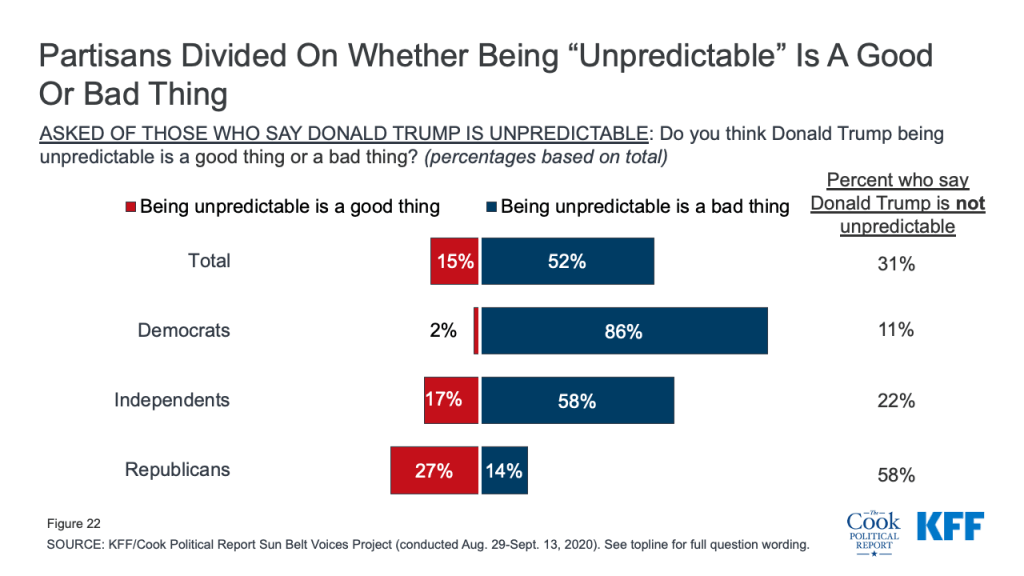
Two-thirds of voters say unpredictable is a characteristic that describes President Trump but whether that is a “good thing” or a “bad thing” depends on partisanship. Four in ten Republican voters (41%) say President Trump is unpredictable but 27% of them say being unpredictable is a “good thing” while the vast majority of Democrats (86%) as well as most independent voters (58%) say that Donald Trump is unpredictable and this is a “bad thing.”
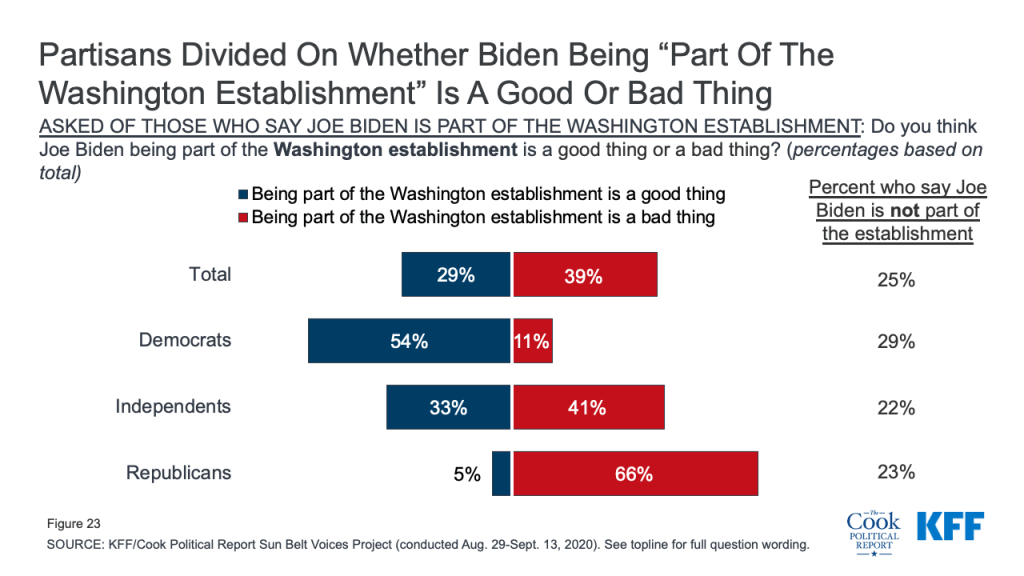
Majorities of voters say that being part of the Washington establishment describes Joe Biden (72%) but once again, whether that is a “good thing” or a “bad thing” depends on partisanship. Two-thirds of Democratic voters say being part of the establishment describes Joe Biden but most (53% of all Democratic voters) say Biden being part of the Washington establishment is a “good thing,” while most Republicans (66%) and half of independent voters (41%) say Biden is part of the establishment and this is a “bad thing.”
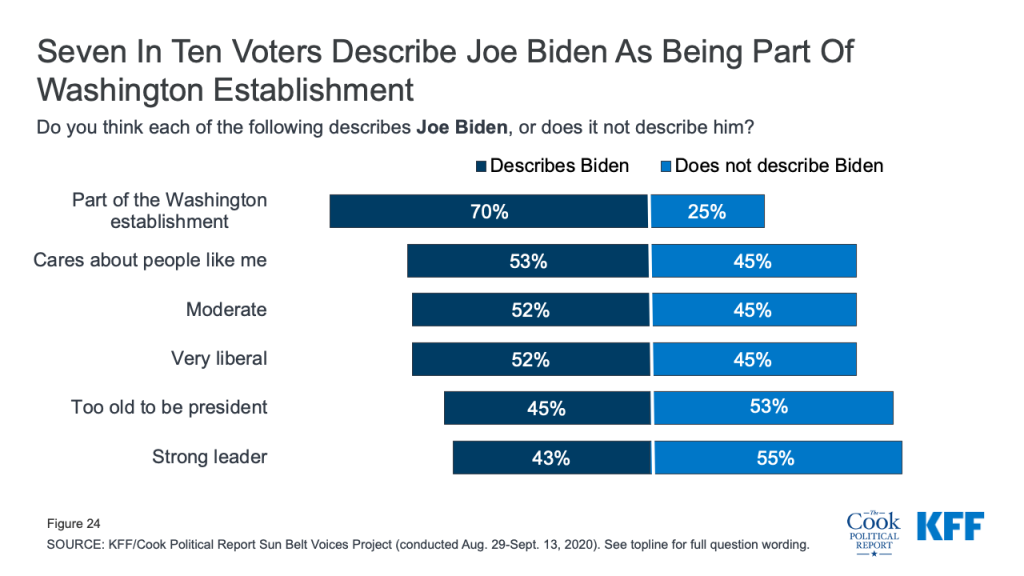
Seven in ten voters say being part of the Washington establishment describe Biden, about half of voters say cares about people like me (53%), very liberal (53%), and moderate (52%) describes Biden. Slightly more than half of voters say being too old to be president and strong leader do not describe Biden (53% and 55%, respectively).
Views of what characteristics describe and do not describe Biden and Trump fall largely along party lines with majorities of Democratic voters saying strong leader describes Biden and most Republican voters say the same about President Trump.
Swing voters, on the other hand, may have their voting decisions impacted by such messages. Most swing voters say that moderate is a term that describes Biden well, with most of them and nearly half of voters overall saying this is a “good thing” (AZ: 44%, FL: 49%, N.C.: 46%). In addition, six in ten swing voters in Florida and N.C. say cares about people like me is something that describes Biden well.
| Table 4: Swing Voters’ Views Of Biden | |||
| Percent of swing voters who say each of the following describes Joe Biden… | Arizona swing voters | Florida swing voters | N.C. swing voters |
| Too old to be president | 51% | 42% | 39% |
| Part of the Washington establishment | 69 | 70 | 62 |
| Is this a good thing? | 25 | 35 | 25 |
| Is this a bad thing? | 41 | 32 | 35 |
| Very liberal | 52 | 42 | 45 |
| Is this a good thing? | 17 | 15 | 16 |
| Is this a bad thing? | 34 | 26 | 29 |
| Moderate | 59 | 62 | 54 |
| Is this a good thing? | 44 | 49 | 46 |
| Is this a bad thing? | 13 | 11 | 7 |
| Cares about people like me | 46 | 61 | 57 |
| Strong leader | 38 | 38 | 42 |
A majority of swing voters in Arizona (59%), Florida (66%), and North Carolina (61%) say President Trump is unpredictable and this is a bad thing. Less than half of this share say President Trump cares about people like me and no more than half say that being a strong leader describes him well.
| Table 5: Swing Voters’ Views Of Trump | |||
| Percent of swing voters who say each of the following describes Donald Trump… | Arizona swing voters | Florida swing voters | N.C. swing voters |
| Too old to be president | 19% | 16% | 17% |
| Part of the Washington establishment | 25 | 28 | 26 |
| Is this a good thing? | 9 | 13 | 12 |
| Is this a bad thing? | 15 | 15 | 12 |
| Unpredictable | 74 | 82 | 81 |
| Is this a good thing? | 14 | 14 | 18 |
| Is this a bad thing? | 59 | 66 | 61 |
| Cares about people like me | 25 | 30 | 34 |
| Strong leader | 45 | 46 | 46 |
The Aca And Health Care
These additional findings were released September 23.
With the recent news of the passing of Supreme Court Justice Ruth Bader Ginsburg, the latest from the Sun Belt Voices Project – a collaboration between KFF and The Cook Political Report – takes a look at how increased attention to California v. Texas, the Supreme Court case challenging the constitutionality of the Affordable Care Act, could motivate voters in the 2020 election. The poll, conducted prior to the death of Justice Ginsburg, found that the top issues for Arizona, Florida and N.C. voters two months out from the 2020 election were the economy, the coronavirus outbreak, race relations and criminal justice and policing. Health care as an election issue ranked lower for these voters. Yet with less than two months before the Supreme Court hearing of the highly politicized ACA case, health care policy may once again dominate election coverage.
Key Findings
- Joe Biden has a slight advantage over President Trump among Arizona, Florida, and North Carolina voters on two key health care issues in the 2020 presidential campaign: the future of the Affordable Care Act and maintaining protections for people with pre-existing conditions. Yet, these are largely driven by partisanship with majorities of Democratic voters saying Biden has the better approach while most Republican voters say the same about President Trump.
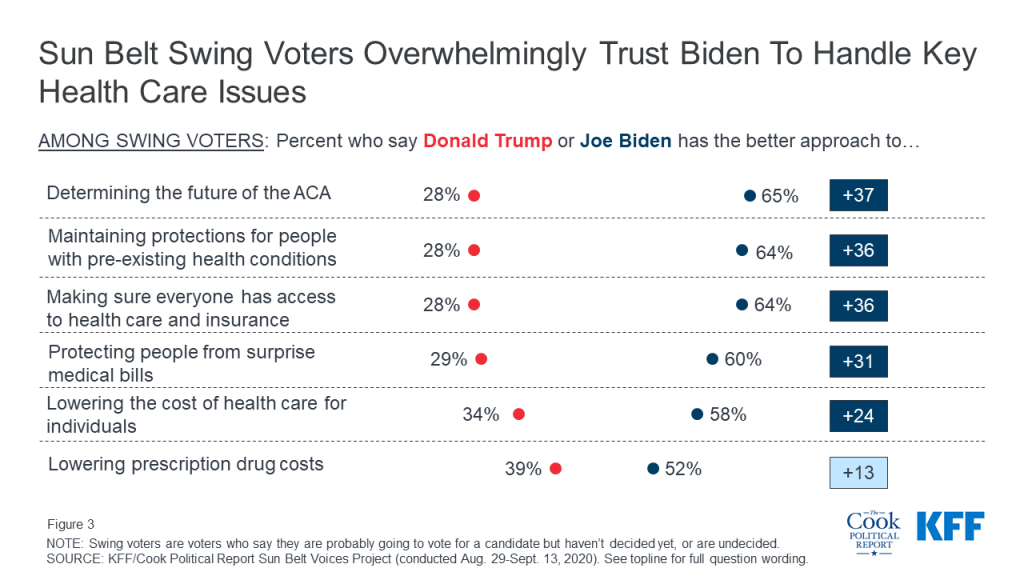
- Swing voters, on the other hand, give Biden the overwhelming advantage on all key health care issues including the ACA (Biden: 65%, Trump: 28%) and pre-existing condition protections (Biden: 64%, Trump: 28%). These are voters who say they are either entirely undecided or not firm in their vote choice and for some, there is a chance they may vote for the other candidate
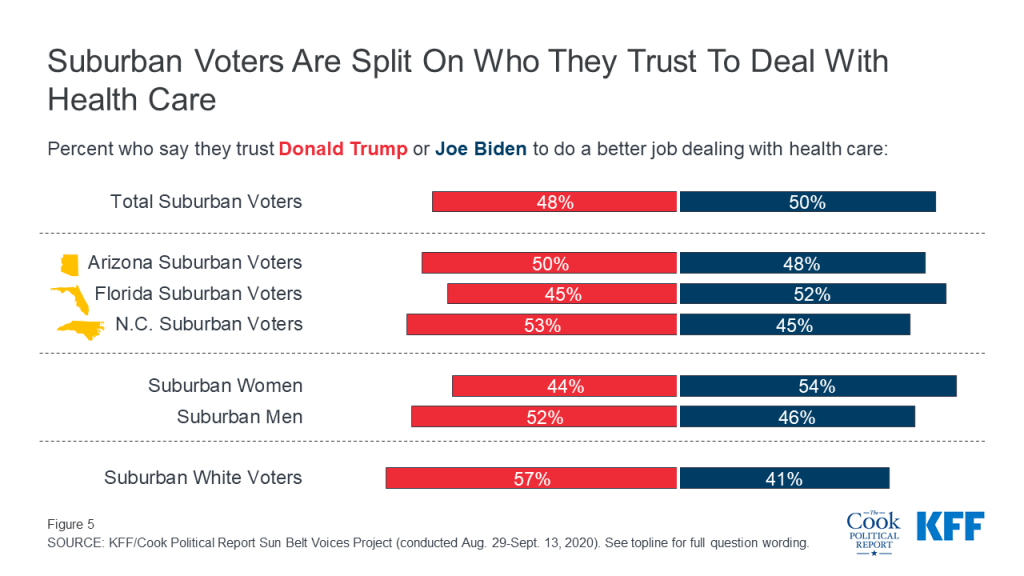
- Health care has long been an important voting issue among suburban voters, including in the 2018 midterm elections. The latest polling in Arizona, Florida, and North Carolina finds suburban voters are closely divided on which presidential candidate they trust to handle health care. Suburban women give Biden a slight edge on his handling of heath care, while other groups of suburban voters say they trust Trump. When it comes to specific key health care policy areas, suburban voters prefer Biden on the ACA (Biden +10 percentage points) and maintaining pre-existing conditions protections (Biden +8 percentage points), but are divided on their trust of the candidates to lower the costs of health care and prescription drugs.
The Future Of The Affordable Care Act
One of the top issues deciding the 2018 election was health care, most notably – the continued protections for people with pre-existing medical conditions. An analysis of campaign advertisements by the Wesleyan Media Project found nearly half (46%) of airings in federal races mentioned health care as did three in ten gubernatorial ads. In addition, one-third of health care ads were about coverage for people with pre-existing conditions. This is consistent with KFF polling which found voters in two bellwether states, Florida and Nevada, were more likely to say they would vote for candidates who wanted to maintain the ACA’s protections for people with pre-existing conditions.
With the Supreme Court deciding not to hear California v. Texas, the case challenging the future of the ACA, until after the 2020 election, many experts expected this issue to be a smaller issue during the campaigns. Yet with the recent passing of Supreme Court Justice Ginsburg, this case is now front-and-center in the 2020 election as a new justice could determine the future of the 2010 Affordable Care Act.
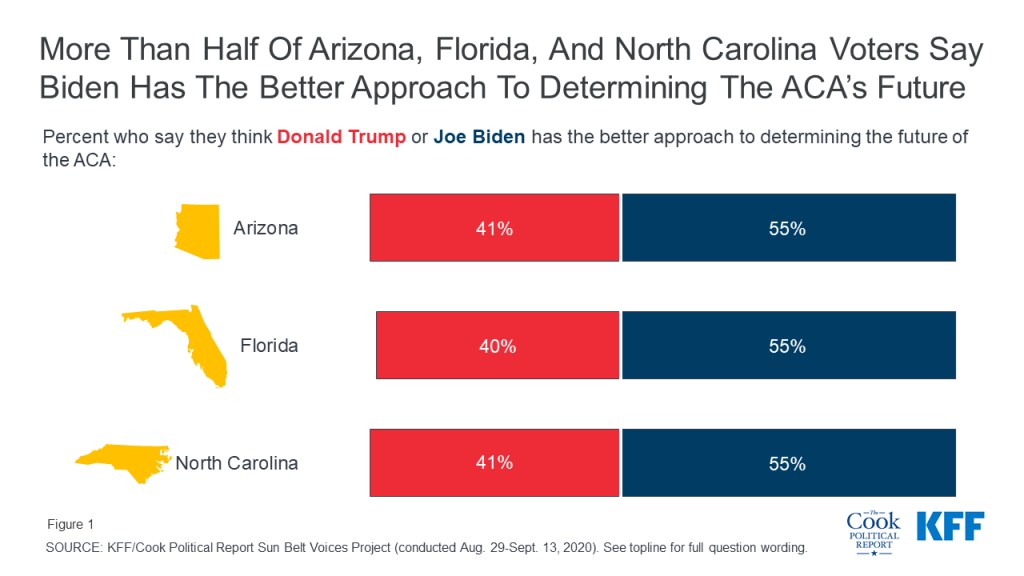
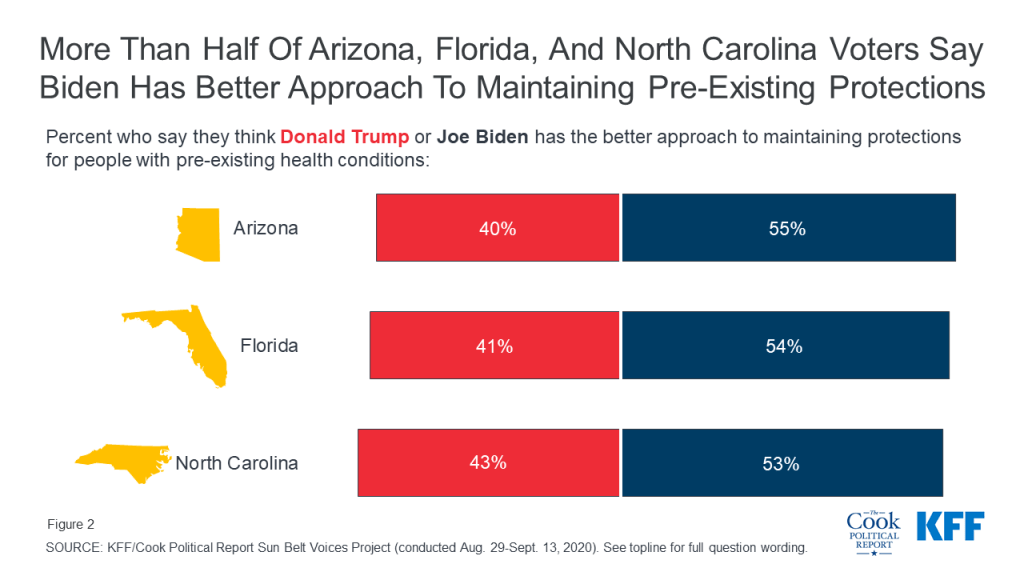
The latest polling from three key sun belt states (Arizona, Florida, and North Carolina) finds former Vice President Biden has a considerable advantage among voters on which presidential candidate they think has the better approach to determining the future of the Affordable Care Act as well as maintaining protections for people with pre-existing health conditions. More than half of voters in Arizona, Florida, and North Carolina say Joe Biden has the better approach on the ACA (AZ: 55%, FL: 55%, N.C.: 55%) compared to four in ten voters from each state who say Donald Trump.
This is similar to the share who say Biden has the better approach to maintaining protections for people with pre-existing conditions (AZ: 55%, FL: 54%, N.C.: 53%) compared to President Trump (AZ: 40%, FL: 41%, N.C.: 43%).
Views on which candidate has the better approach to handle all health care issues – including the future of the ACA and pre-existing conditions – are largely driven by party identification. As seen in Table 1, vast majorities of Democratic voters in Arizona, Florida, and North Carolina say Biden has the better approach on health care issues while at least eight in ten Republicans voters in each of the three states say Trump has the better approach. Independents in Arizona and Florida mostly give the advantage on health care issue to Biden, while independent voters in North Carolina are more divided on some health care issues.
| Table 1: Partisans Say Their Party’s Candidate Has Better Approach to Handle Key Health Care Issues | |||||||||
| Do you think Donald Trump or Joe Biden has the better approach to…? | Arizona | Florida | North Carolina | ||||||
| Dem | Ind | Rep | Dem | Ind | Rep | Dem | Ind | Rep | |
| …lowering the cost of health care for individuals | |||||||||
| Donald Trump | 3% | 36% | 87% | 2% | 41% | 86% | 4% | 45% | 91% |
| Joe Biden | 95 | 58 | 8 | 96 | 56 | 11 | 95 | 50 | 6 |
| …determining the future of the Affordable Care Act, sometimes called Obamacare | |||||||||
| Donald Trump | 3 | 36 | 82 | 3 | 34 | 80 | 2 | 39 | 87 |
| Joe Biden | 96 | 60 | 14 | 95 | 59 | 15 | 98 | 57 | 9 |
| …lowering prescription drug costs | |||||||||
| Donald Trump | 5 | 39 | 87 | 3 | 45 | 87 | 5 | 48 | 93 |
| Joe Biden | 92 | 53 | 8 | 94 | 51 | 9 | 93 | 49 | 6 |
| …protecting people from surprise medical bills from out-of-network care | |||||||||
| Donald Trump | 4 | 33 | 82 | 3 | 35 | 84 | 3 | 40 | 87 |
| Joe Biden | 92 | 57 | 11 | 94 | 58 | 10 | 95 | 53 | 8 |
| …making sure everyone has access to health care and insurance | |||||||||
| Donald Trump | 3 | 30 | 81 | 2 | 38 | 85 | 3 | 39 | 88 |
| Joe Biden | 96 | 63 | 14 | 96 | 61 | 12 | 96 | 57 | 9 |
| …maintaining protections for people with pre-existing health conditions | |||||||||
| Donald Trump | 3 | 32 | 82 | 3 | 34 | 84 | 3 | 39 | 88 |
| Joe Biden | 95 | 61 | 14 | 95 | 61 | 11 | 96 | 57 | 8 |
Swing Voters Give Biden Advantage On health Care Issues
Swing voters, the crucial group of voters who are either entirely undecided or probably going to vote for a candidate but haven’t decided yet, overwhelmingly give Biden the advantage on all key health care issues including the ACA and maintaining pre-existing conditions. More than twice as many swing voters say Biden (65%) has the better approach on the ACA than President Trump (28%) as well as on maintaining pre-existing condition protections (64% v. 28%). In fact, on all key health care issues asked about in the survey, Biden has the advantage among swing voters. This is despite the fact swing voters don’t have a candidate preference with 24% saying they are probably going to vote for President Trump, 29% saying they are probably going to vote for Joe Biden, and 47% truly undecided.
The advantage Biden has on key health care issues is consistent among swing voters in Arizona, Florida, and North Carolina.
| Table 2: Swing Voters In Key Sun Belt States Trust Biden On Health Care Issues | |||
| Do you think Donald Trump or Joe Biden has the better approach to…? | Arizona Swing Voters | Florida Swing Voters | North Carolina Swing Voters |
| …lowering the cost of health care for individuals | |||
| Donald Trump | 35 | 31 | 41 |
| Joe Biden | 53 | 63 | 50 |
| …determining the future of the Affordable Care Act, sometimes called Obamacare | |||
| Donald Trump | 32 | 24 | 33 |
| Joe Biden | 60 | 69 | 61 |
| …lowering prescription drug costs | |||
| Donald Trump | 38 | 39 | 42 |
| Joe Biden | 49 | 54 | 51 |
| …protecting people from surprise medical bills from out-of-network care | |||
| Donald Trump | 30 | 27 | 32 |
| Joe Biden | 55 | 63 | 56 |
| …making sure everyone has access to health care and insurance | |||
| Donald Trump | 25 | 27 | 32 |
| Joe Biden | 63 | 67 | 60 |
| …maintaining protections for people with pre-existing health conditions | |||
| Donald Trump | 28 | 26 | 33 |
| Joe Biden | 60 | 68 | 59 |
Suburban Voters and Health Care
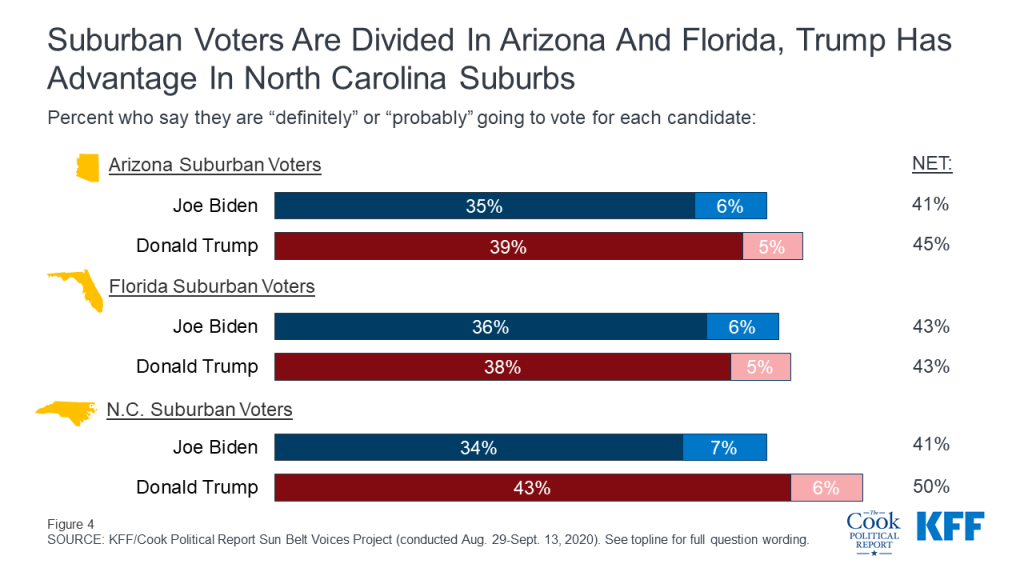
In the 2016 presidential election, President Trump won overwhelming support from rural voters while Secretary Clinton garnered majority support from urban voters; suburban voters were more divided between the two candidates. The Sun Belt Voices Project interviewed over 500 suburban voters in each of the three states polled (571 in Arizona, 683 in Florida, and 527 in North Carolina) and finds President Trump holding a slight lead among North Carolina suburban voters (50% v. 41%) while suburban voters in Arizona and Florida are more divided (AZ: 45% v. 41%, FL: 43% v. 43%).
But the suburbs are increasingly demographically diverse and candidate preference varies across key demographic groups. President Trump garners support from at least half of suburban men (51%), white suburban voters (54%), and suburban voters with lower levels of education (50% of those with a high school diploma or less). Former Vice President Biden, on the other hand, garners support from at least half of Black (73%) and Hispanic voters (50%) living in the suburbs, and those with higher levels of education (52% of those with at least a college degree).
Not All Suburbs Are The Same
Just as suburban areas are becoming increasingly demographically diverse, many suburban areas within states look and vote very differently. Looking at suburban voters in Arizona, Florida, and North Carolina, we examine some key suburban areas:
Arizona – Former Vice President Joe Biden has a strong lead in Pima County (the area around Tucson) over President Trump, but voters in Maricopa County are more divided in their 2020 vote choice with similar shares of voters in this county saying they plan to vote for President Trump (42%) and Joe Biden (42%). Within Maricopa County, Phoenix voters overwhelmingly support Biden. The economy is by far the top issue for Maricopa County voters (34%) while Pima County voters are divided between the economy (28%) and the coronavirus outbreak (24%).
Florida – Florida suburbs are also divided along geographic regions of the state with Miami suburbs voting very differently than northern parts of the state including the panhandle. Recent elections have looked closely at areas along the expanded I-4 corridor, an area many experts say is crucial to President Trump’s re-election. Voters in this area of Florida choose the economy as their top 2020 issue (28%) but are currently divided in which presidential candidate they plan to vote for with 40% saying President Trump and 45% saying Joe Biden. Biden has a commanding lead in the Miami suburbs while President Trump holds the advantage in the northern part of the state.
North Carolina – There is an increasing trend within N.C. with voters living on the edges of urban city centers voting more like traditionally suburban voters. Using categories developed by Old North State Politics we find that “urban county suburban” voters are one group that are prioritizing criminal justice and policing (22%) as a top 2020 voting issue along with the economy (27%). In addition, voters in these areas within North Carolina are more divided in their vote choice with 42% saying they plan to vote for President Trump and 48% saying they plan to vote for Joe Biden.
Suburban Voters Are divided On Which Candidate They Trust On Health Care, But Most Say Biden Has Better APproach to ACA ANd Pre-Existing COndition Protections
Suburban voters are divided on which candidate they trust to do a better job handling health care with half of suburban voters saying they trust each candidate. A larger share of suburban women voters say they trust Joe Biden on health care, while President Trump garners more support among all suburban white voters. To see which candidate suburban voters trust to handle all key issues, see Appendix Table 2.
While suburban voters overall are divided on which candidate they trust to do a better job dealing with health care, when it comes to the future of the Affordable Care Act and maintaining pre-existing conditions protections, a slightly majority of suburban voters give Biden the advantage.
Among suburban voters, Former Vice President Biden has a 10 point advantage over President Trump on determining the future of the ACA (53% v. 43%), a landmark legislation of the Obama/Biden presidency. In addition, Biden also has a slight advantage on maintaining pre-existing condition protections (52% v. 44%). On all other key issues, the difference between the two candidates is within the margin of sampling error.
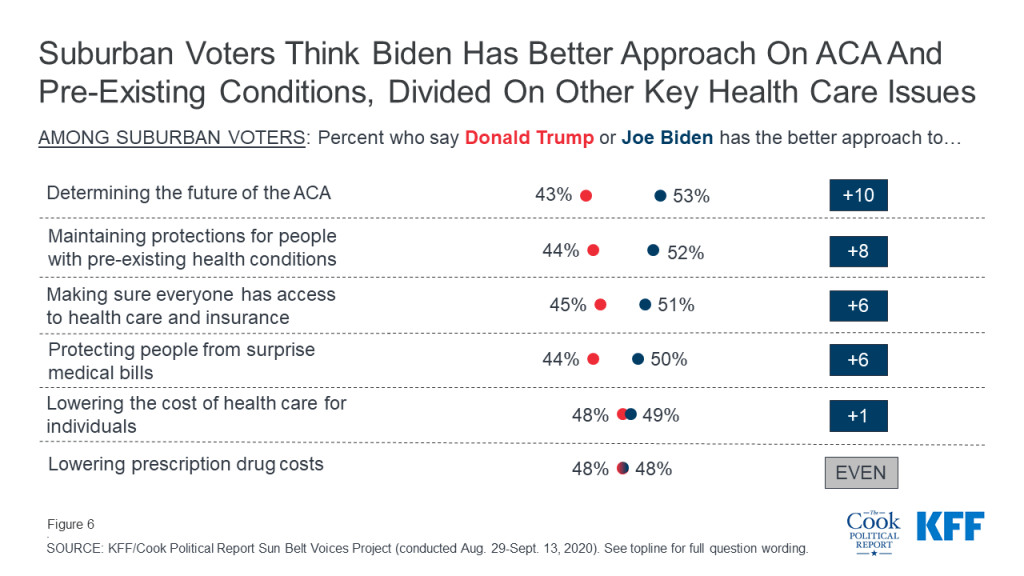
There is some variation across states with North Carolina suburban voters more closely divided in which candidate has the better approach to handle some health care issue including the future of the ACA and maintaining protections for people with pre-existing conditions, and President Trump having a clear advantage on lowering overall health care costs and prescription drug costs.
| Table 3: Suburban Voters On Which Candidate Has The Better Approach To Deal With Key Health Care Issues | |||
| Do you think Donald Trump or Joe Biden has the better approach to…? | Arizona Suburban Voters | Florida Suburban Voters | North Carolina Suburban Voters |
| …determining the future of the Affordable Care Act, sometimes called Obamacare | |||
| Donald Trump | 46% | 40% | 49% |
| Joe Biden | 51 | 55 | 48 |
| …maintaining protections for people with pre-existing health conditions | |||
| Donald Trump | 46 | 42 | 49 |
| Joe Biden | 50 | 54 | 47 |
| …lowering the cost of health care for individuals | |||
| Donald Trump | 49 | 45 | 55 |
| Joe Biden | 47 | 52 | 42 |
| …lowering prescription drug costs | |||
| Donald Trump | 51 | 45 | 55 |
| Joe Biden | 45 | 51 | 43 |
| …protecting people from surprise medical bills from out-of-network care | |||
| Donald Trump | 47 | 42 | 50 |
| Joe Biden | 47 | 52 | 44 |
| …making sure everyone has access to health care and insurance | |||
| Donald Trump | 45 | 44 | 51 |
| Joe Biden | 51 | 53 | 46 |
How Votes Will Be Cast In 2020
These additional findings were released September 25.
As part of the latest collaboration between KFF and The Cook Political Report, this analysis examines how the coronavirus outbreak is changing voting in the 2020 election. With former Vice President Biden holding a slight lead over President Trump in Arizona (Biden 45%, Trump 40%), and the race is within the margin of sampling error in Florida and North Carolina, how many Americans will vote in the 2020 election, especially with strong differences among partisans, may have significant implications on the narrative of the 2020 election results.
Key Findings
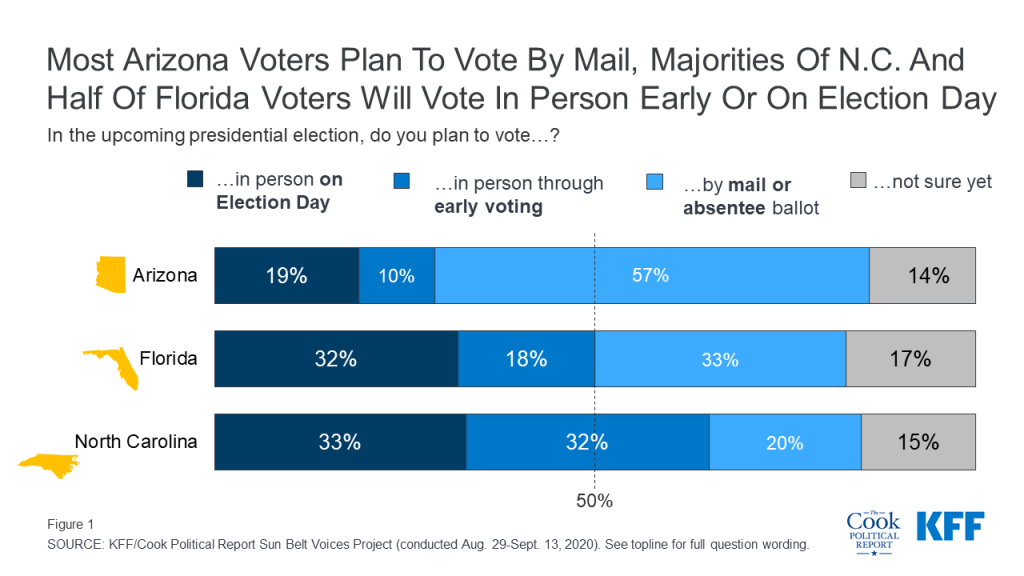
- With the coronavirus pandemic changing how many Americans plan to cast their vote, the latest release from the Sun Belt Voices Project finds that only one in five Arizona voters, and one-third of N.C. voters (33%) and Florida voters (32%) say they still plan on voting in person on Election Day.
- This poll suggests that many of the last ballots to be counted in North Carolina, where mail-in ballots will be accepted up to three days after Election Day as long as they are postmarked by November 3rd. Most of those who plan to vote by mail in Arizona, Florida, and North Carolina say they will be voting for Joe Biden (AZ: 56%, FL: 64%, N.C.: 71%). Voters who plan to vote in-person on Election Day, on the other hand, say they plan on casting a ballot for President Trump (AZ: 66%, FL: 60%, N.C.: 66%).
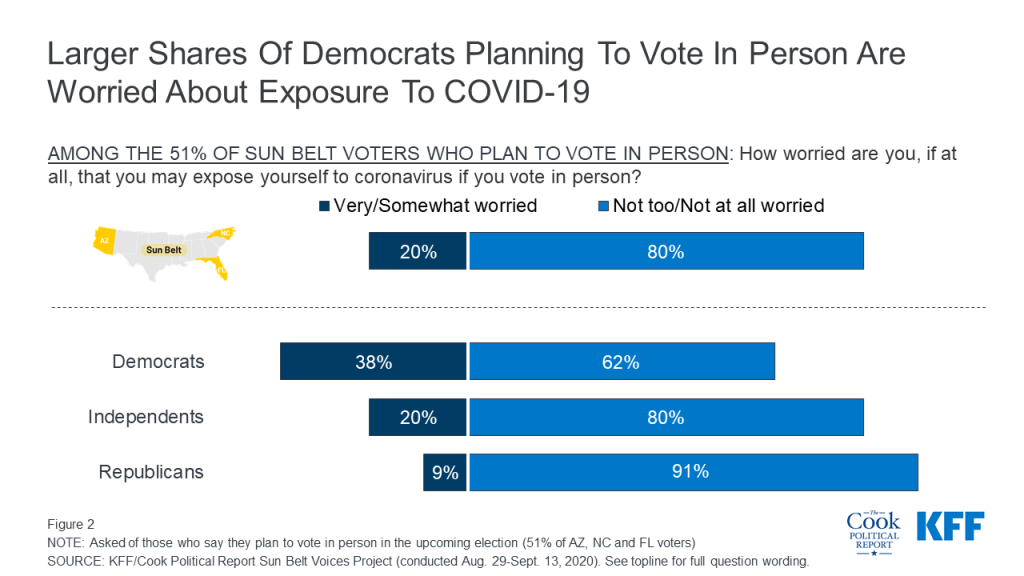
- Among those who say they are planning to head to the physical polls in November, about one in five are worried that voting in person may expose them to coronavirus (10% of voters overall). A smaller share of Republican voters express concerns about voting in person (9%) compared to independent (20%) and Democratic voters (38%).
- In addition to concerns about exposure to coronavirus, majorities of Arizona, Florida, and N.C. voters in each of the states say they are worried about various factors that could interfere with having a fair and accurate 2020 election including voter suppression (AZ: 62%, FL: 62%, N.C.: 65%) and voter fraud (AZ: 56%, FL: 59%, N.C.: 58%). Yet, partisan voters hold very different views, with most Democratic voters worried about voter suppression and most Republican voters in Arizona, Florida, and N.C. worried about voter fraud.
Voting During A Pandemic
With the expectation that millions of Americans will cast their votes using mail-in ballots for the first time in the 2020 election, there has been criticism from the Trump Administration about the validity of voting-by-mail while Democrats have raised concerns about potential voter suppression.
Arizona, Florida, and North Carolina are three states in which voters can ask to vote-by-mail due to the coronavirus outbreak. Arizona has a longer history of voting-by-mail with the state legislature allowing any Arizona voter to vote-by-mail for any reason as early as 1991. In 2016, 75% of Arizona voters voted by mail. Florida has had vote-by-mail in place since 2002 but, prior to the coronavirus outbreak, only about 29% of Florida voters chose to cast a mail-in ballot. Mail-in voting has been a contentious issue in North Carolina, but in June the state legislature passed a bill designed to making voting by mail easier during the coronavirus pandemic. In 2016, 4% of North Carolina voters voted by mail.
Democrats and Biden Supporters plan to vote by mail while Republicans and Trump supporters plan to vote in person
Due to concerns over the spread of COVID-19, voting by mail is expected to account for a large portion of ballots in November with larger shares of voters nationwide saying they plan to vote by mail.
More than half of Arizona voters (57%) say they plan to vote by mail, as do one-third of Florida voters (33%) and one in five North Carolina voters (20%). One-third of N.C. voters (33%) and Florida voters (32%) say they plan to vote in person on Election Day, as do one in five (19%) Arizona voters.
While Arizona and Florida have had “no excuse” absentee or mail-in voting options prior to this year’s election, mail-in voting is new to many North Carolina voters. Arizona is the only one of these three states that has had large shares of absentee or vote-by mail records, which is made easier by the state’s legislation to allow residents able to be put on a permanent vote-by-mail list, as opposed to most states’ requirements that each ballot is applied for, and in N.C.’s case, a witness is required for application. Among the highest in the country, 75% of Arizona’s ballots were collected early, through absentee or by mail in the 2016 general election.
Larger shares of voters choosing to vote by mail or absentee ballot poses challenges for both state election boards as well as news organizations covering the election night results. While ballots must be received by the end of Election Day, November 3rd, in both Arizona and Florida, North Carolina ballots must be postmarked by November 3rd and received by November 6th.
This poll suggests that many of the last ballots to be counted in North Carolina may be disproportionately for former Vice President Joe Biden. Most in-person Election Day voters say they plan on casting a ballot for President Trump (AZ 66%; FL 60%; N.C. 66%), while majorities of the voters who say they plan on voting by mail say they will be voting for Joe Biden (AZ 56%; FL 64%; N.C. 71%). Due to the high prevalence of mail voting that already exists in Arizona, three in ten voters (31%) who plan on voting by mail in Arizona say they are voting for President Trump.
| Table 1: Voters In Key Sun Belt States Plan To Cast Their In Person Votes For President Trump, Mail In Ballots For Joe Biden | ||||
| Percent who say they are… | “Probably” or “Definitely” voting for Joe Biden | “Probably” or “Definitely” voting for President Trump | ||
| Among Arizona voters who say they plan to vote… | …in person on Election Day | 20% | 66% | |
| …in person through early voting | 46 | 46 | ||
| …by mail or absentee ballot | 56 | 31 | ||
| Among Florida voters who say they plan to vote… | …in person on Election Day | 27 | 60 | |
| …in person through early voting | 43 | 50 | ||
| …by mail or absentee ballot | 64 | 25 | ||
| Among North Carolina voters who say they plan to vote… | …in person on Election Day | 24 | 66 | |
| …in person through early voting | 53 | 41 | ||
| …by mail or absentee ballot | 71 | 17 | ||
Swing voters – those who say they are either probably voting for President Trump or Joe Biden or are undecided – are less settled on their preferred method of voting which may indicate their reluctance to vote at all. One-fifth of swing voters in Arizona say they are unsure of how they plan to vote (18%), as are one-fourth of swing voters in Florida and N.C. (26% and 25%, respectively). This is compared to 11% of decided voters in Arizona and N.C., and 14% in Florida who say they are unsure.
Voting in Person
Among those who are choosing to still head to the physical polls in November, about one in five are worried that voting in person may expose them to the coronavirus (10% of voters overall). Partisans differ in their worry. While majorities of voters across partisans who say they plan to vote in person are not too or not at all worried about exposure to coronavirus while doing so, nearly four in ten Democrats say they are very or somewhat worried (38%) and one in ten Republicans say the same (9%). Of course, the decision to vote in person may have taken into account any potential worry.
A Fair And Accurate Election
About nine in ten voters (92%) in these three states are worried about at least one threat to holding a fair and accurate presidential election in 2020, and more than half of voters say they are worried about each of the possible threats provided in the survey. More than half of voters in Arizona, Florida, and North Carolina are worried that voter suppression (63%), the coronavirus outbreak (61%), voter fraud (58%), technical problems at polling places (57%), or interference by a foreign country (54%) will interfere with the 2020 election.
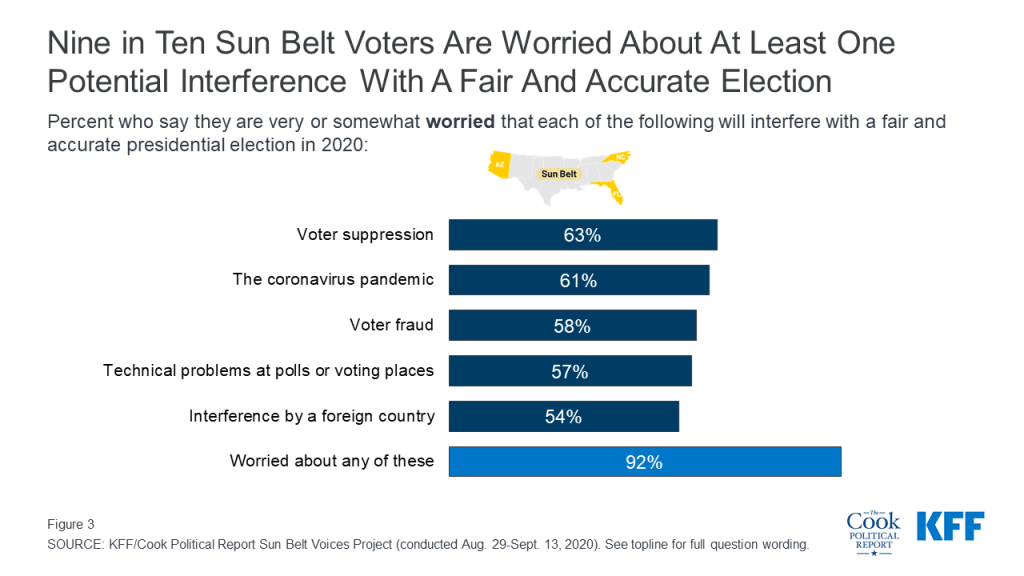
Majorities of voters in each of the states say they are at least “somewhat worried” that each of these will interfere with the election, and nine in ten are worried about at least one of the potential interferences.
| Table 2. Voters In Arizona, Florida, and North Carolina Share Worries Around The 2020 Election | |||
| Percent who say they are very or somewhat worried that each of the following will interfere with a fair and accurate presidential election in 2020: | Arizona Voters | Florida Voters | North Carolina Voters |
| Voter suppression | 62% | 62% | 65% |
| The coronavirus pandemic | 59 | 60 | 64 |
| Voter fraud | 56 | 59 | 58 |
| Technical problems at polls or voting places | 58 | 58 | 54 |
| Interference by a foreign country | 57 | 53 | 56 |
| Worried about any of these (NET): | 92 | 92 | 93 |
The sources of potential worry around the 2020 election vary across partisans. Larger shares of Democrats than Republicans say that they are at least somewhat worried that voter suppression (84% v. 44%), foreign interference (77% v. 33%), the coronavirus pandemic (74% v. 51%) and technical problems at polling locations (66% v. 52%) will interfere with a fair and accurate presidential election.
On the other hand, voter fraud caused by people who are ineligible to vote casting ballots in the election is a larger worry for Republicans (80%) than Democratic voters (40%) or independent voters (54%).
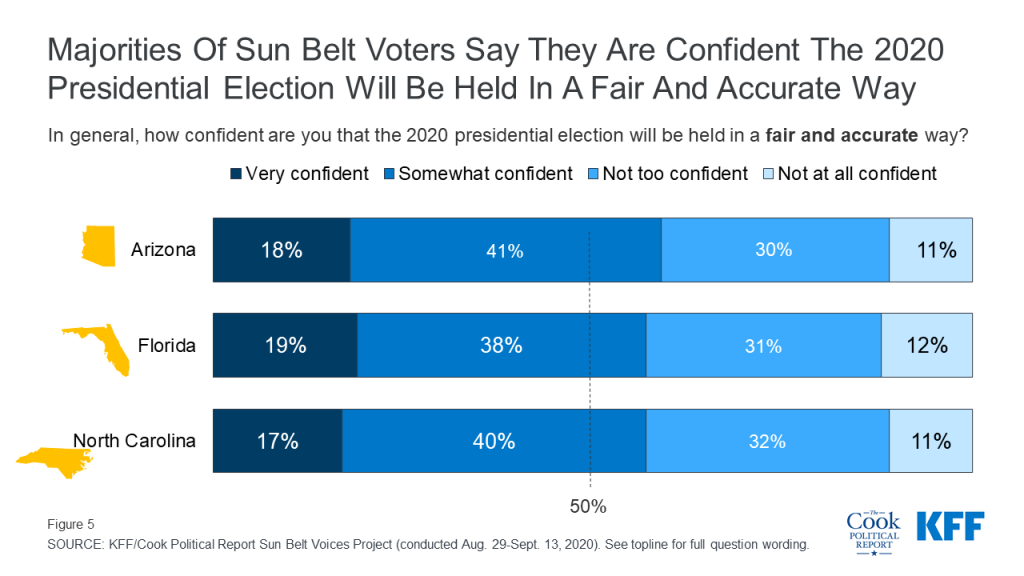
Despite this, majorities of voters – across partisanship – are still confident that the 2020 presidential election will be held in a fair and accurate way (59% of Arizona voters, and 57% of Florida voters and N.C. voters) with one in five voters saying they are “very confident” (AZ: 18%, FL: 19%, N.C.: 17%). This is consistent across party identification with about six in ten Democrats (59%), Republicans (62%), and independent voters (56%) saying they are at least somewhat confident that the 2020 election will be fair and accurate.
Black And Hispanic Voters
These additional findings were released October 7, 2020.
The latest release from KFF and The Cook Political Report’s Sun Belt Voices Project looks at what is motivating the vote choices of both Black and Hispanic voters in Arizona, Florida, and North Carolina – three key battleground states. While larger shares of Black and Hispanic voters report being impacted by the coronavirus, either by knowing someone who has gotten sick or by losing their income or job, it is no more of a voting issue for voters of color than it is for White voters. And while majorities of Black voters across the three states say they are voting for Vice President Biden, Hispanic voters in Florida and Arizona have different voting plans with Biden garnering majority support in Arizona and President Trump leading among Florida Hispanic voters.
The Coronavirus Outbreak
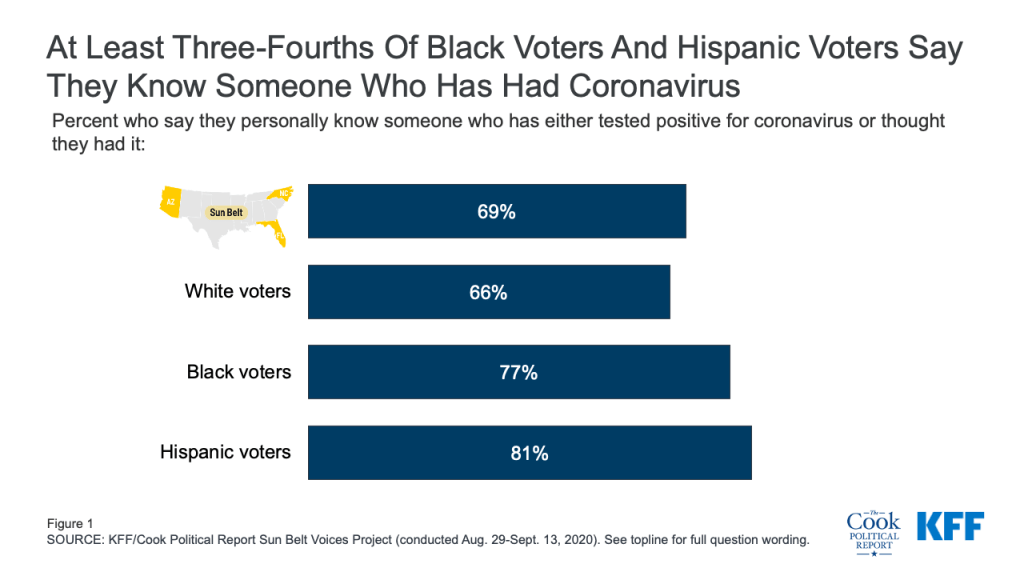
Black and Hispanic people in the U.S. have been disproportionately impacted by the coronavirus outbreak both in terms of the share of populations who have been hospitalized or died due to COVID-19 or reported that they lost their job or income because of a coronavirus-related layoff. Black and Hispanic voters in Arizona, Florida, and North Carolina are no exception with three-fourths of Black voters (77%) and eight in ten Hispanic voters (81%) in these states saying they know someone who has either tested positive for coronavirus or thought they had it, compared to two-thirds of white voters.
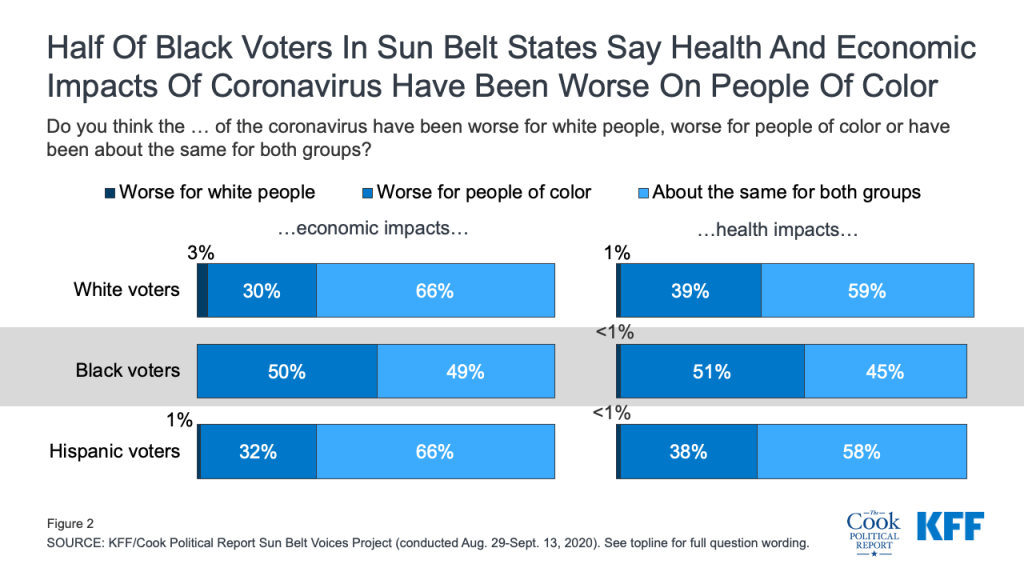
In addition, nearly four in ten Black (36%) and Hispanic voters (41%) say they have lost a job or income due to the coronavirus compared to three in ten White voters (28%). Black voters are also more likely than White or Hispanic voters to say that both the health impacts and economic impacts of the coronavirus have been “worse for people of color.” Majorities of White voters say the impacts of coronavirus on White people and people of color have been about the same.
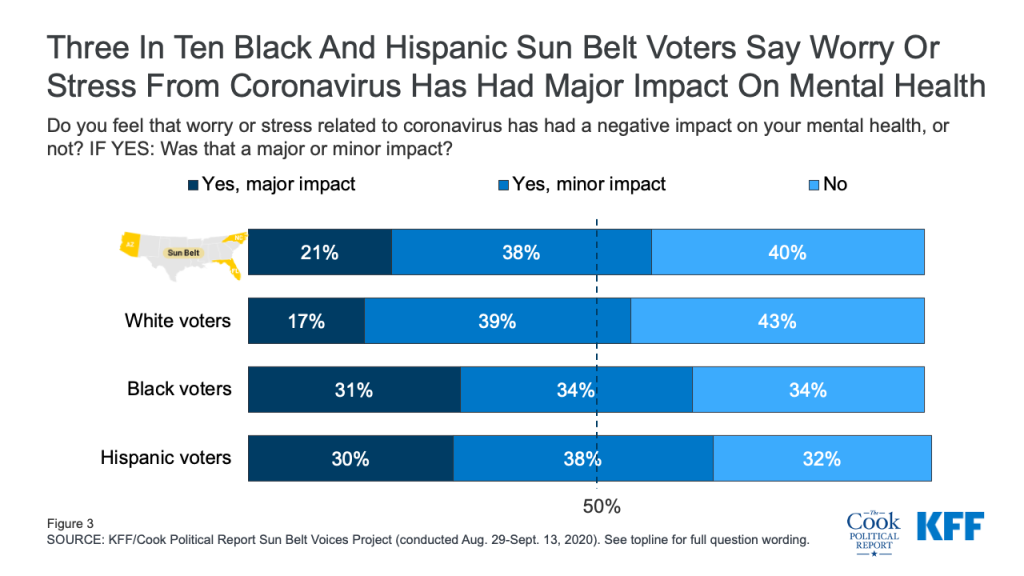
With larger shares of Black and Hispanic voters being directly affected by the coronavirus outbreak, it is not surprising that about two-thirds of Black voters (66%) and Hispanic voters (68%) report that worry or stress related to the coronavirus has had a negative impact on their mental health – including three in ten who say it has had a “major impact.” This is compared to 56% of white voters who say the same, including 17% who say it has had a “major impact.”
What Is Driving Black Voters and Hispanic voters?
Yet, Black and Hispanic voters in these Sun Belt states are no more likely to say coronavirus is an important issue to their 2020 vote choice than White voters. About one in six Black voters (14%), White voters (16%), and Hispanic voters (15%) say the coronavirus outbreak is the most important issue to their 2020 presidential vote. Other issues, most notably, the economy rank higher. The economy is among the top issues for voters across racial groups but a larger share of Black voters also say race relations (29%) is the top issue driving their 2020 vote choice compared to one in ten White and Hispanic voters (9%). This is in light of recent protests in response to police shootings of unarmed Black Americans and President Trump’s focus on “law and order.”
| Table 1: Top Issues In 2020 Presidential Election Among Sun Belt Voters | ||||
| Percent who say each of the following is the most important issue to their vote: | Total Voters | Black Voters | Hispanic Voters | White Voters |
| The economy | 32% | 24% | 32% | 34% |
| Criminal justice and policing | 17 | 19 | 14 | 18 |
| The coronavirus outbreak | 16 | 14 | 15 | 16 |
| Race relations | 12 | 29 | 9 | 9 |
| Health care | 12 | 10 | 17 | 11 |
| Immigration | 5 | 2 | 9 | 5 |
| None of these issues are important | 5 | 2 | 4 | 6 |
Which Candidate Do Black Voters and Hispanic Voters Support?
The majority of Black voters in the Sun Belt states (75%) say they plan on voting for Joe Biden in the November presidential election and few (5%) say they plan on voting for President Trump. This is consistent with Black adults’ views of President Trump throughout his presidency, in which he has never garnered higher than 25% favorability among Black adults in the past 3 and a half years.
Hispanic Voters In Two Key Battlegrounds
Florida and Arizona are two battleground states with Hispanic voters increasingly making up larger shares of the electorate with one in four 2018 voters in Arizona identifying as Hispanic as were two in ten Florida voters.
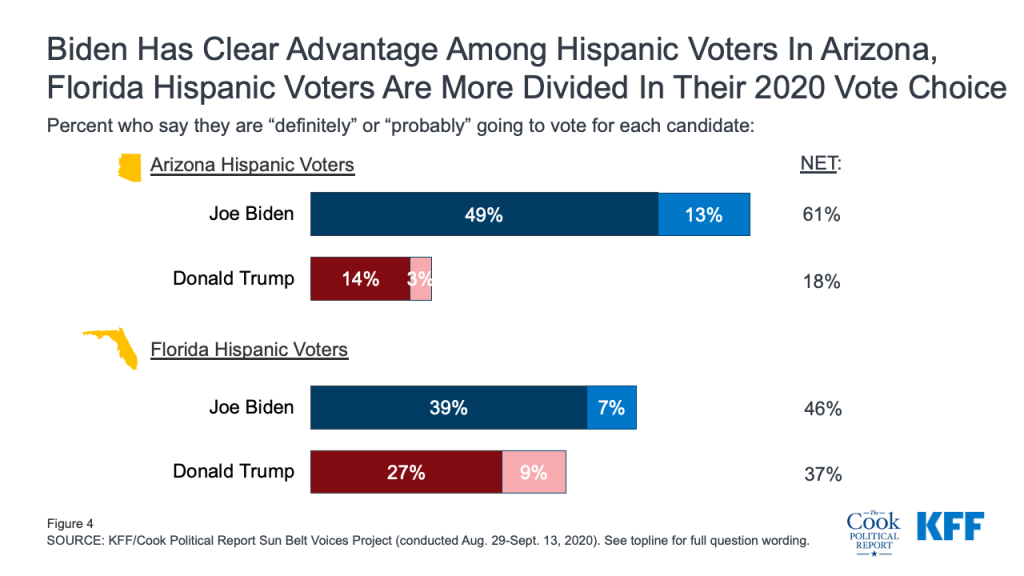
Now, six in ten Hispanic voters in Arizona say they are either “probably” or “definitely” going to vote for Joe Biden (61%) with 18% say they are going to vote for President Trump, another 16% are undecided. In Florida, Hispanics are more divided but lean in favor of former Vice President Biden. About half of Hispanic voters in Florida (46%) say they plan on voting for Joe Biden while 37% say they plan on voting for President Trump, which is within the margin of sampling error for this small subgroup of voters.
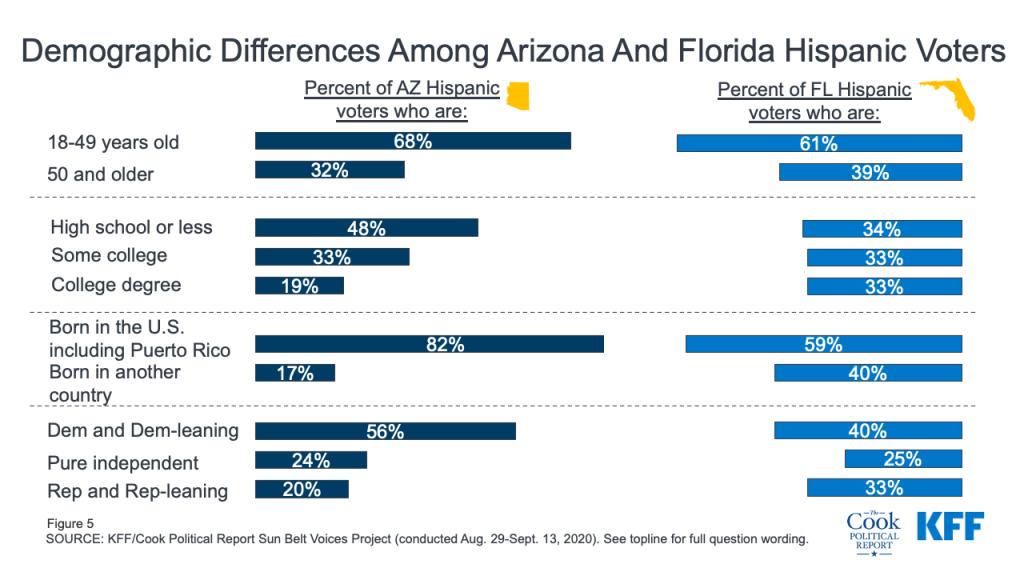
There are many reasons why Hispanic voters in Arizona and Florida have different 2020 presidential vote preferences as there are significant demographic differences between the two voting groups including their education levels, their nativity, and their party affiliation.
Florida Hispanic voters weren’t always divided in their support for the Democratic and Republican nominees for President. In 2016, the vast majority of Hispanic voters supported Hillary Clinton. Even in the Sun Belt Voices project, only one-fourth of Florida Hispanic voters say they voted for President Trump in the 2016 election (68% say they voted for Hillary Clinton). The poll finds one in ten Florida Hispanic voters (10%) say they voted for Clinton in 2016 and are now voting for President Trump in 2020 while 3% of Hispanic voters saying they vote for Trump in 2016 and are now voting for Biden.
How Voters Plan To Cast Ballots
A previous KFF and The Cook Political Report release analyzed how voters planned to cast ballots in each of the three Sun Belt states. When we look at how people plan to vote among different racial and ethnic groups we find about one-fourth of Black voters saying they plan to vote by mail or absentee (27%) compared to one-third of White voters, and four in ten (39%) Hispanic voters. Black voters, especially in Southern states, have historically been more likely to show up to vote in-person but with the coronavirus pandemic upending usual voting behaviors, it is important to better understand how people plan to vote. The latest data from North Carolina’s State Board of Elections, compiled by Michael McDonald of the University of Florida, finds that while similar shares of White and Black voters have begun returning ballots in North Carolina, the rate at which the ballots are being rejected for error is larger among Black voters.
| Table 2: How Black Voters, Hispanic Voters, And White Voters Plan To Cast Their Ballots | ||||
| Percent who say in the upcoming election, they plan to vote… | Total Voters | Black Voters | Hispanic Voters | White Voters |
| Planning to vote in-person (NET) | 51% | 50% | 42% | 53% |
| …in-person on Election Day | 30 | 23 | 30 | 32 |
| …in-person through early voting | 20 | 27 | 12 | 21 |
| Planning to vote by mail or absentee ballot | 33 | 27 | 39 | 33 |
| Not sure yet | 16 | 22 | 20 | 14 |
Arizona Crosstabs
Florida Crosstabs
North Carolina Crosstabs
Methodology
The Sun Belt Voices Project was designed and analyzed by public opinion researchers at the Kaiser Family Foundation (KFF) in collaboration with the Cook Political Report. The survey was conducted August 29th – September 13th, 2020, among a representative random sample of 3,479 registered voters in three Sun Belt states (1,298 in Arizona, 1,009 in Florida, and 1,172 in North Carolina). All registered voters included in the sample were sent an invitation letter including a link to complete the survey online, a toll-free number that respondents could call to complete the survey with a telephone interviewer, and $2 pre-incentive. Respondents who were living in Census block-groups identified as low-education and respondents identified as likely Hispanic were offered $10 post-incentive if they completed the survey. All respondents were then sent a reminder postcard, which included a QR code. Respondents who were flagged in the voter file as both a) speaking Spanish and b) speaking either primarily or only their native language, received bilingual mailings, including text in both English and Spanish.
The sample was designed to reach respondents less likely to complete surveys online, by oversampling areas with a relatively low percentage of college graduates. Sample that could be matched to telephone numbers and that had not yet completed the survey online or by inbound computer-assisted telephone interview (CATI) were called by CATI interviewers to attempt to convert this sample to completed interviews. A total of 3,116 respondents completed the questionnaire online, 89 by calling in to complete, and 274 were completed as outbound CATI interviews. Data collection was carried out in English and Spanish by SSRS of Glen Mills, PA. The registered voter sample was provided by L2. KFF paid for all costs associated with the survey.
A series of data quality checks were run on the final data, which resulted in 37 completes being removed from the data. Weighting involved multiple stages: First, each state sample was weighted to account for sampling methodology including the oversampling of low-educational attainment areas and to the proportions of the voter file reachable or unreachable by outbound phone-call. Second, each state’s sample was weighted to match the voter file distribution on gender, age, race/ethnicity, metropolitan status, state region, as well as the 2018 CPS Voter Supplement estimates for educational attainment, including race by education. To address additional non-response among partisans not accounted for by demographics, the weight was adjusted to match registered party identification and both 2018 voter turnout and 2016 voter turnout from voter file. The final weight combined each state’s weight and balanced the combined total sample to state distributions. All statistical tests of significance account for the effect of weighting.
The margin of sampling error including the design effect for the full sample is plus or minus 2 percentage points. Numbers of respondents and margins of sampling error for key subgroups are shown in the table below. For results based on other subgroups, the margin of sampling error may be higher. Sample sizes and margins of sampling error for other subgroups are available by request. Note that sampling error is only one of many potential sources of error in this or any other public opinion poll. Kaiser Family Foundation public opinion and survey research is a charter member of the Transparency Initiative of the American Association for Public Opinion Research.
| Group | N (unweighted) | M.O.S.E. |
| Total | 3,479 | ±2 percentage points |
| Arizona | 1,298 | ±3 percentage points |
| Florida | 1,009 | ±4 percentage points |
| North Carolina | 1,172 | ±3 percentage points |
Appendix
| Appendix Table 1 | |||||||||||||
| Percent who say they approve or disapprove of: | Total Voters | Swing Voters | |||||||||||
| Total Sun Belt Voters | Arizona | Florida | North Carolina | Total Sun Belt Swing Voters | Arizona Swing Voters | Florida Swing Voters | N.C. Swing Voters | ||||||
| Donald Trump | |||||||||||||
| Approve (NET) | 48% | 46% | 48% | 48% | 45% | 46% | 45% | 47% | |||||
| Strongly approve | 32 | 31 | 31 | 33 | 7 | 9 | 7 | 7 | |||||
| Somewhat approve | 16 | 15 | 17 | 15 | 38 | 36 | 38 | 40 | |||||
| Disapprove (NET) | 52 | 54 | 51 | 52 | 54 | 54 | 54 | 53 | |||||
| Somewhat disapprove | 8 | 7 | 8 | 7 | 23 | 21 | 24 | 24 | |||||
| Strongly disapprove | 44 | 46 | 43 | 45 | 30 | 32 | 30 | 29 | |||||
| Net approval (percentage points) | -4 | -8 | -3 | -4 | -9 | -8 | -9 | -6 | |||||
| Joe Biden | |||||||||||||
| Approve (NET) | 50% | 50% | 51% | 50% | 56% | 52% | 60% | 52% | |||||
| Strongly approve | 25 | 22 | 25 | 26 | 7 | 5 | 7 | 7 | |||||
| Somewhat approve | 26 | 28 | 26 | 24 | 50 | 47 | 53 | 44 | |||||
| Disapprove (NET) | 49 | 49 | 48 | 50 | 42 | 46 | 39 | 46 | |||||
| Somewhat disapprove | 13 | 13 | 13 | 12 | 27 | 30 | 26 | 27 | |||||
| Strongly disapprove | 36 | 36 | 35 | 37 | 15 | 16 | 12 | 19 | |||||
| Net approval (percentage points) | +1 | +1 | +3 | 0 | +14 | +6 | +21 | +6 | |||||
| *Swing voters include those who said they will probably vote for Donald Trump, probably vote for Joe Biden, are undecided, or don’t know who they will vote for in the upcoming election. | |||||||||||||
| Appendix Table 2 | |||||||||||||
Percent who say they trust … to better handle each of the following issues: | Suburban Voters In Arizona, Florida, and North Carolina | ||||||||||||
| Total Suburban Voters | Men | Women | White, Non-Hispanic | Black, Non-Hispanic | Hispanic | HS diploma or less | Some college | College degree + | |||||
| The economy | |||||||||||||
| Donald Trump | 56% | 61% | 52% | 65% | 19% | 46% | 61% | 59% | 49% | ||||
| Joe Biden | 41 | 38 | 45 | 34 | 73 | 50 | 36 | 40 | 48 | ||||
| Criminal justice and policing | |||||||||||||
| Donald Trump | 51 | 56 | 47 | 62 | 12 | 36 | 57 | 55 | 43 | ||||
| Joe Biden | 46 | 42 | 50 | 37 | 82 | 60 | 40 | 44 | 56 | ||||
| The coronavirus outbreak | |||||||||||||
| Donald Trump | 47 | 52 | 43 | 57 | 14 | 28 | 54 | 49 | 39 | ||||
| Joe Biden | 49 | 46 | 52 | 40 | 78 | 66 | 43 | 48 | 57 | ||||
| Race relations | |||||||||||||
| Donald Trump | 44 | 48 | 40 | 54 | 11 | 23 | 50 | 47 | 35 | ||||
| Joe Biden | 53 | 50 | 56 | 44 | 84 | 70 | 47 | 50 | 62 | ||||
| Health care | |||||||||||||
| Donald Trump | 48 | 52 | 44 | 57 | 10 | 32 | 55 | 49 | 39 | ||||
| Joe Biden | 50 | 46 | 54 | 41 | 84 | 65 | 42 | 49 | 59 | ||||
| Immigration | |||||||||||||
| Donald Trump | 51 | 57 | 46 | 61 | 14 | 36 | 55 | 56 | 42 | ||||
| Joe Biden | 47 | 42 | 51 | 38 | 81 | 61 | 42 | 42 | 56 | ||||