Medicare Part D: A First Look at Plan Offerings in 2015
The Centers for Medicare & Medicaid Services (CMS) recently released information about the Medicare Part D stand-alone prescription drug plans (PDPs) that will be available in 2015. Of the 37.9 million Medicare beneficiaries enrolled in Part D plans, about 61 percent (23.2 million) are in PDPs; the others are enrolled in Medicare Advantage drug plans. This issue brief provides an overview of the 2015 stand-alone PDP options and key changes from prior years. The analysis focuses on Part D plan availability, premiums, benefit design, and low income subsidy plan availability. It shows that Medicare Part D in 2015 continues to be a marketplace with an array of competing plans offered at a wide range of premiums and benefit designs. The analysis is authored by researchers at Georgetown University, NORC at the University of Chicago, and the Foundation.
Introduction
The Centers for Medicare & Medicaid Services (CMS) recently released information about the Medicare Part D stand-alone prescription drug plans (PDPs) that will be available in 2015.1 Of the 37.9 million beneficiaries enrolled in Part D plans, about 61 percent (23.2 million) are in PDPs; the others are enrolled in Medicare Advantage drug plans.2 This issue brief provides an overview of the 2015 stand-alone PDP options and key changes from prior years.3
Summary of Key Findings
Medicare Part D continues to be a marketplace with an array of competing plans offered at a wide range of premiums and benefit designs.
- In 2015, there will be 1,001 stand-alone PDPs available nationwide, fewer than in any year since Part D began in 2006. Despite the reduction in plan availability nationwide, Medicare beneficiaries in each region will have a choice of 30 stand-alone PDPs, on average, down by five from 2014.
- The average premium (weighted by 2014 plan enrollment) is expected to increase by 4 percent across all PDPs from 2014 to 2015, from $37.27 to $38.83 per month, unless many new or current enrollees select lower-priced plans.
- As in prior years, the average 2015 monthly premium masks a significant amount of variation across plans. Enrollees in six of the ten most popular PDPs will experience double-digit premium increases if they stay in the same plans in 2015, while enrollees in three of the ten most popular PDPs will see double-digit premium decreases.
- Beneficiaries receiving Low-Income Subsidies (LIS) will have access to fewer plans for no monthly premium (“benchmark plans”) in 2015 compared to 2014. About 1.8 million LIS enrollees who are slated to be in PDPs without so-called “benchmark” status for 2015 must switch plans (or be reassigned by CMS) in order to have premium-free coverage in 2015; an estimated 500,000 of these LIS beneficiaries will be reassigned by CMS.
- Other notable trends for 2015 include:
- Nearly all PDPs (87 percent) use pharmacy networks with preferred (lower) cost sharing offered in selected network pharmacies, up from 72 percent of PDPs in 2014, and a significant increase from just a few years ago when only a small share of plans used this type of preferred pricing (7 percent in 2011).
- The use of formulary tiers has been common since the program’s beginning in 2006, but for the first time in 2015, all PDPs will use tiered cost sharing. Most PDPs will use five tiers (two for generic drugs, two for brand-name drugs, and one for higher-cost specialty drugs).
- A growing share of PDPs has shifted from charging flat copayments to coinsurance for at least one of the tiers for brand-name drugs.
Key Findings
Part D Plan Availability
In 2015, a total of 1,001 PDPs will be offered nationwide, down by 14 percent from the 1,169 PDPs offered in 2014 and the lowest number of PDPs in the program’s history. (Exhibit 1) The lower number of plans reflects both the cumulative effect of mergers among plan sponsors and the response to CMS policies that encourage plan sponsors to eliminate low-enrollment plans and to maintain meaningful differences between multiple plan offerings.
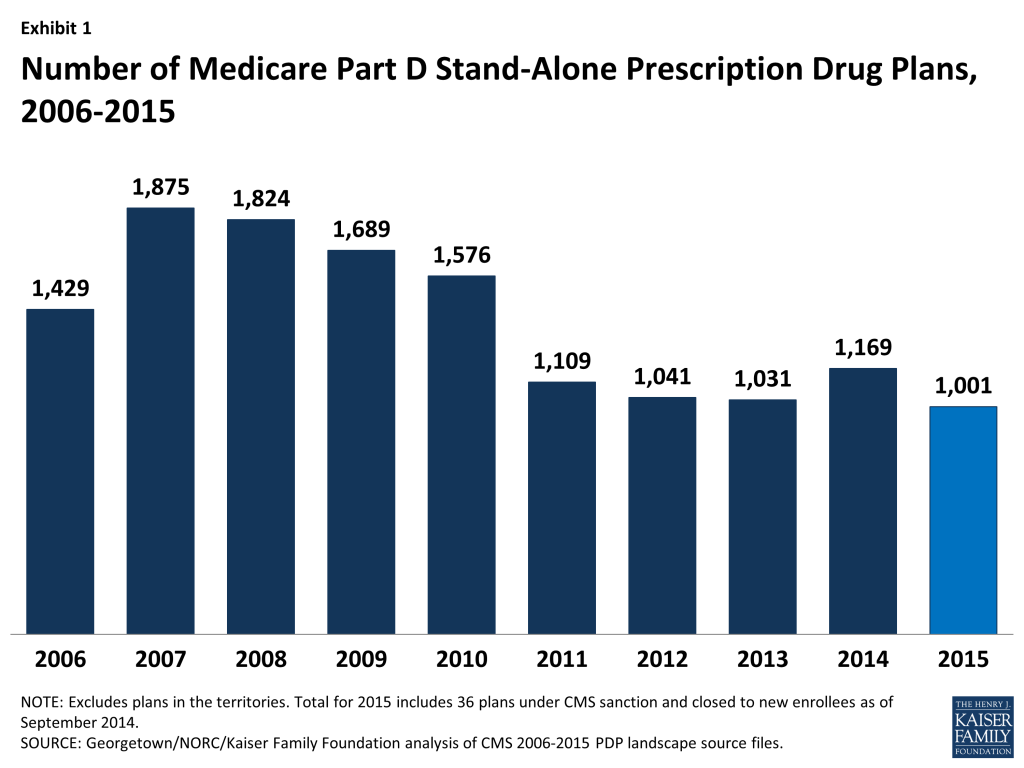
- The total number of PDPs in 2015 represents 874 fewer PDPs than the peak level in 2007 of 1,875 plans.
- In 2015, there are 11 plan sponsors offering 26 PDPs on a national or near-national basis. By contrast, in 2009, before new CMS policies designed to reduce duplicative plan offerings were introduced, 18 national or near-national plan sponsors offered 46 different PDPs.
Despite a reduction in the number of PDPs nationwide, beneficiaries across the country continue to have a substantial number of Part D plan choices. The average beneficiary will have a choice of 30 stand-alone PDPs in 2015.4 (Exhibit 2; Appendix 1, Table A1)
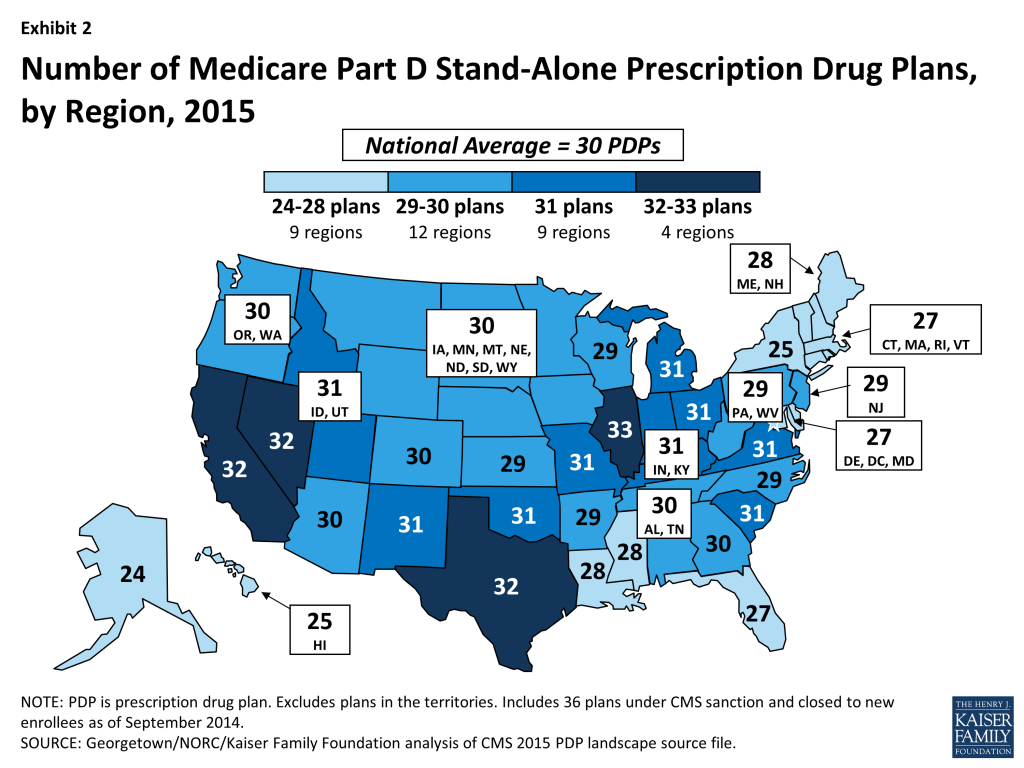
- The number of PDPs per region in 2015 will range from a low of 24 PDPs in the Alaska region to a high of 33 PDPs in the Illinois region. The number of plans is lower in every region compared to 2014; for example, down by ten in the Pennsylvania/West Virginia region and by nine in the Delaware/Maryland/District of Columbia region and down by just two in Nevada.
Inside the Part D marketplace, 70 new PDPs are joining the program for 2015, and 238 PDPs exited the program. Among the exiting plans, 70 PDPs exited the market entirely, whereas the other 168 PDPs were consolidated with another PDP.
- Among the 70 new PDPs in the market, only three are offered by sponsors totally new to the program: Colorado Access Advantage (one PDP) and Senior Care Plus (two PDPs in Nevada). The other new PDPs are additional offerings by three smaller national or near-national plan sponsors (EnvisionRxPlus, Symphonix Heath, and United American) and two local plan sponsors already participating in Part D.
- The two largest plan exits reflect decisions by plan sponsors to streamline their PDP offerings after corporate acquisitions that occurred in earlier years. Cigna consolidated its acquired HealthSpring PDPs (34 PDPs with 364,000 enrollees, mostly Low-Income Subsidy enrollees) into an existing Cigna PDP and rebranded all its PDPs as Cigna-HealthSpring. Similarly, Aetna began consolidating the PDPs acquired from Coventry and now sponsors four PDPs instead of five.
- Several plan sponsors left the program completely, including HealthMarkets (34 PDPs with 22,000 enrollees), CareFirst Blue Cross Blue Shield (two PDPs with 20,000 enrollees), AmeriHealth (two PDPs with 9,000 enrollees), Emblem Health (one PDP with 6,000 enrollees), and Secure Advantage (four PDPs with 6,000 enrollees). Other than HealthMarkets, these sponsors operated in just one or two regions.
- One notable plan exit is from Anthem Wellpoint, which terminated its 26 MedicareRx Rewards PDPs (43,000 enrollees), a set of offerings first introduced in 2006. Anthem Wellpoint continues to participate in regions where it has local affiliated companies. There are now five regions with no participating Blue Cross Blue Shield plans and only one region (California) with competing Blues plan sponsors.
- Two other plan sponsors (UnitedHealth and CVS Health) reduced offerings by eliminating one of three options in each region and transferring enrollees to other plans they sponsor. These transfers affect nearly 500,000 enrollees across the two organizations.
- In 2013, the SmartD Rx Saver PDP, operated by Express Scripts with just 63,000 enrollees, was placed under a sanction that banned marketing activities and new enrollments. That sanction was in place for the 2014 open enrollment period and continues during the 2015 enrollment period. Avalon Insurance Company, operating two SecureRx PDPs in Pennsylvania and West Virginia (6,000 enrollees) is also under sanction this year.
Monthly Premiums
The projected average monthly PDP premium for 2015 will be $38.83 (weighted by 2014 enrollment, assuming beneficiaries remain in their current plan).5 (Exhibit 3) This is a 4 percent increase ($1.56) from the weighted average monthly premium of $37.27 in 2013, and a 50 percent increase from $25.93 in 2006, the first year of the Medicare Part D drug benefit. As a point of comparison, since 2006, the medical care consumer price index (CPI) has increased 28 percent and the CPI for all items has increased 18 percent.
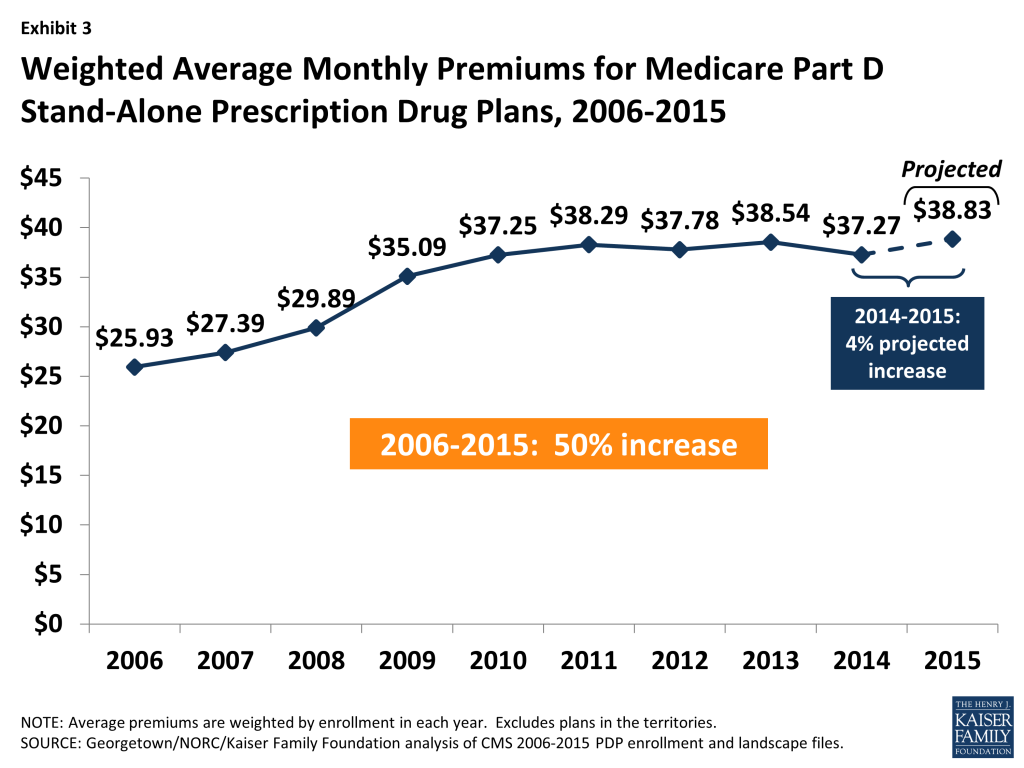
Average monthly PDP premiums (weighted by enrollment in each year) have been essentially flat from 2010 to 2014, corresponding with a time during which many popular brand-name drugs gained generic competitors and when several new low-premium PDPs entered the market. If even a relatively few beneficiaries are enrolled in different plans, effective in January 2015, then the average for 2015 will probably end up roughly the same as in 2014.
CMS has reported that the average premium for standard Part D coverage offered by PDPs and Medicare Advantage drug plans between 2014 and 2015 is increasing by about $1; the slightly higher premium increase reported here is based on PDPs only, excluding Medicare Advantage drug plans, and also includes PDPs offering enhanced coverage, which typically have higher premiums. For PDPs offering only the basic benefit, the 2015 premium is projected to be 0.5 percent lower than in 2014 (based on current enrollment patterns), whereas premiums for enhanced PDPs are projected to rise by about 7 percent.6 Enrollment changes during the annual enrollment period are likely to reduce modestly the weighted average increase reported here.
Underneath these overall program trends, premium changes for individual PDPs from 2014 to 2015 vary widely. A greater share of enrollees is projected to pay more per month if they stay in their current plans than the share expected to pay less or a similar amount. (Exhibit 4)
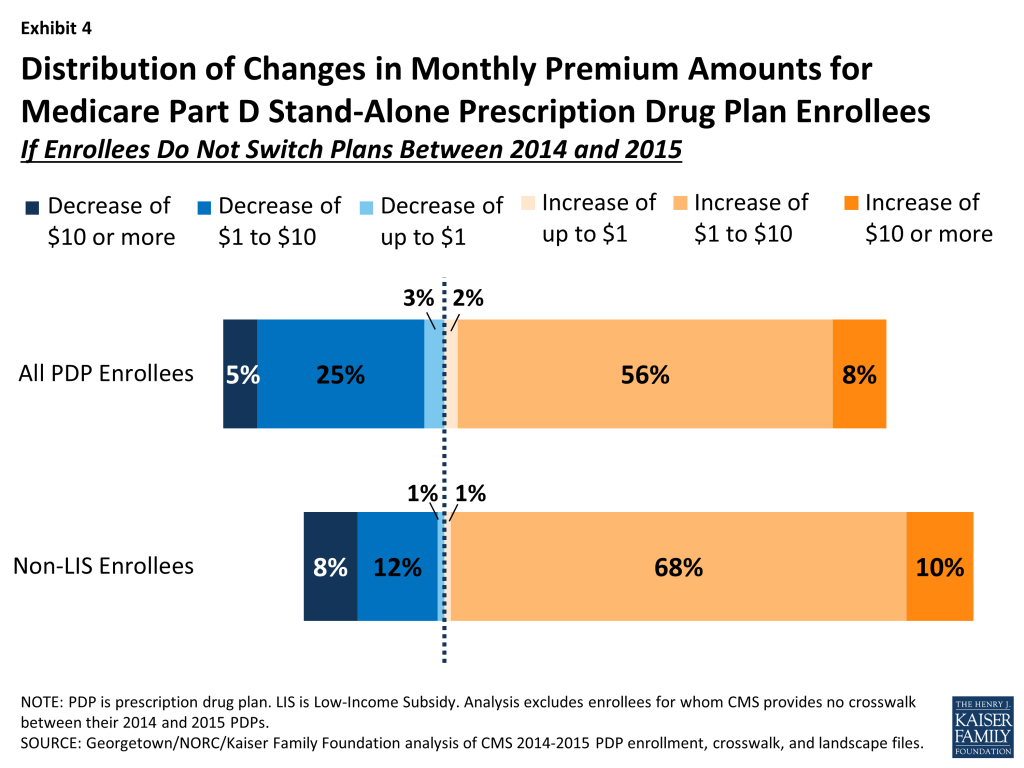
- Nearly two-thirds of all PDP enrollees (64 percent) are projected to pay at least $1 more per month if they stay in their current plans; this includes 8 percent (1.5 million beneficiaries) who will experience an increase of $10 or more in their monthly premium in 2015 unless they select a less expensive plan and another 56 percent who would pay from $1 to $10 more if they remain in their current plan in 2015.
- By contrast, 30 percent of all PDP enrollees are projected to see a decrease of $1 per month or more if they stay in their current plans in 2015; this includes 5 percent of PDP enrollees (approximately 985,000 beneficiaries) who would see premium reductions of at least $10 if they stay with their current PDPs, and another 25 percent who would experience a premium decrease of between $1 and $10.
- The remaining 5 percent of PDP enrollees will face a minimal change in their monthly premium (no more than a $1 increase or decrease) if they stay in their current plan in 2015.
- Excluding LIS enrollees who are not necessarily responsible for paying the increased premium (see the LIS discussion below for more information), the share of non-LIS PDP enrollees projected to have a premium increase of at least $1 is even larger—78 percent of all enrollees. About one in ten non-LIS enrollees are projected to experience a premium increase of at least $10 per month. Conversely, 20 percent are projected to experience a premium decrease of at least $1 per month, while 2 percent are projected to face a minimal premium change.
Changes to premiums from 2014 to 2015, averaged across regions and weighted by 2014 enrollment, vary widely across some of the most popular Part D PDPs. (Exhibit 5)
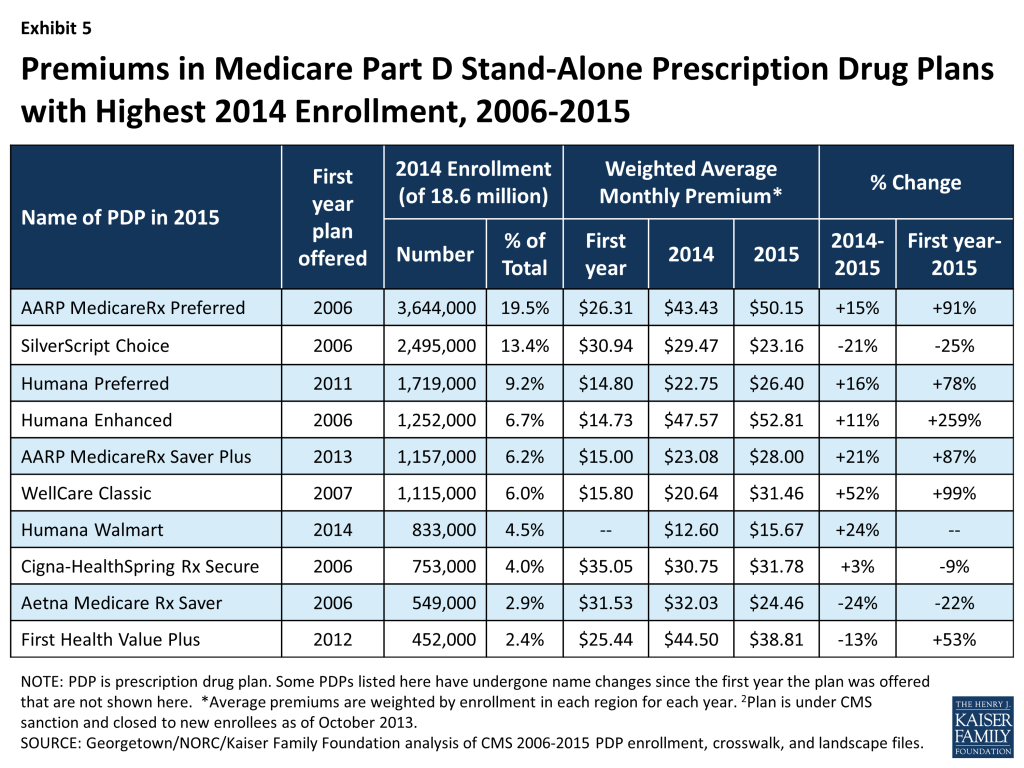
- Premiums for seven of the ten largest PDPs will increase for 2015.
- The highest increase is for WellCare Classic, with 1.1 million enrollees in 2014, rising 52 percent from $20.64 to $31.46. The average monthly premium for the PDP with the most enrollees in 2014, AARP MedicareRx Preferred, with 3.6 million enrollees, will increase by 15 percent between 2014 and 2015, from $43.43 to $50.15.
- The monthly premiums for three large PDPs that entered the market in recent years featuring pharmacy networks with preferred cost sharing will increase by double-digit percentages.
- Humana’s Preferred Rx PDP premium will increase by 16 percent (from $22.75 to $26.40); this plan’s premium has increased by 78 percent in the four years since it entered the market. The premium for United HealthCare’s AARP Medicare Rx Saver Plus, which was new to the market in 2013, is increasing by 21 percent from $23.08 to $28.00, which is nearly double its initial $15.00 premium in 2013. The monthly premium for Humana’s Walmart Rx PDP, new in 2014, will rise by 24 percent from $12.60 to $15.67.
- By contrast, enrollees in another three of the largest PDPs will experience, on average, double-digit percentage decreases in their monthly premium if they stay in the same plan.
- The average monthly premium for First Health Value Plus, which was new to the market in 2012 and is now operated by Aetna, is decreasing by 13 percent from $44.50 to $38.81, after a 51 percent increase between 2013 and 2014. Aetna’s Medicare Rx Saver PDP will have a 24 percent lower premium in 2015 compared to 2014 ($24.46 versus $32.03), and SilverScript Choice (formerly called SilverScript Basic) will have a 21 percent lower premium ($23.16 in 2015 versus $29.47 in 2014).
Monthly premiums for the most popular PDPs available since the start of the Part D program in 2006 have changed in different ways.
- The average premium for Humana PDP Enhanced, with 1.3 million enrollees in 2014, will increase 11 percent over 2014 but is more than three times higher than it was in 2006, having increased from $14.73 to $52.81. Of this ten most popular PDPs, this plan is projected to have the most expensive monthly premium in 2015.
- The average premium for the PDP with the most enrollees in 2014 (3.6 million), UnitedHealth’s AARP Preferred MedicareRx PDP, has nearly doubled (up 91 percent) since 2006, from $26.31 to $50.15.
- By contrast, the monthly premium for SilverScript Choice, operated by CVS Health, with 2.5 million enrollees in 2014, is 25 percent lower in 2015 ($23.16) than it was in 2006 ($30.94).
Average PDP monthly premiums, weighted by 2014 enrollment, will vary widely in 2015 across regions, ranging from $27.91 per month for PDPs in the New Mexico region (one of only five regions with an average under $35) to $44.56 per month for PDPs in New Jersey and $43.84 in the Idaho/Utah region. (Appendix 1, Table A2)
- Premium changes from 2014 to 2015 vary considerably by region. For example, average premiums in four regions are projected to fall slightly, whereas average premiums will be 9 percent higher in Arizona, North Carolina, and Illinois. (Exhibit 6)

These average and plan-level premium amounts do not take into account the income-related Part D premium that took effect in 2011 for Part D enrollees with higher annual incomes ($85,000/individual and $170,000/couple). Established by the Affordable Care Act of 2010 (ACA), the income-related Part D premium requires higher-income enrollees to make an additional payment to the government for Part D coverage, regardless of the plan selected. In 2015, the monthly surcharge will range from $12.30 to $70.80, depending on income, in addition to the monthly premium payment for the specific Part D plan.7 In 2013, 4 percent of Part D enrollees were required to make these additional payments.8 Under current law, the income thresholds are not indexed to increase annually until 2020, meaning that by 2019, a projected 9 percent of Part D enrollees will pay income-related premiums.
Benefit Design: Deductibles and the Coverage Gap
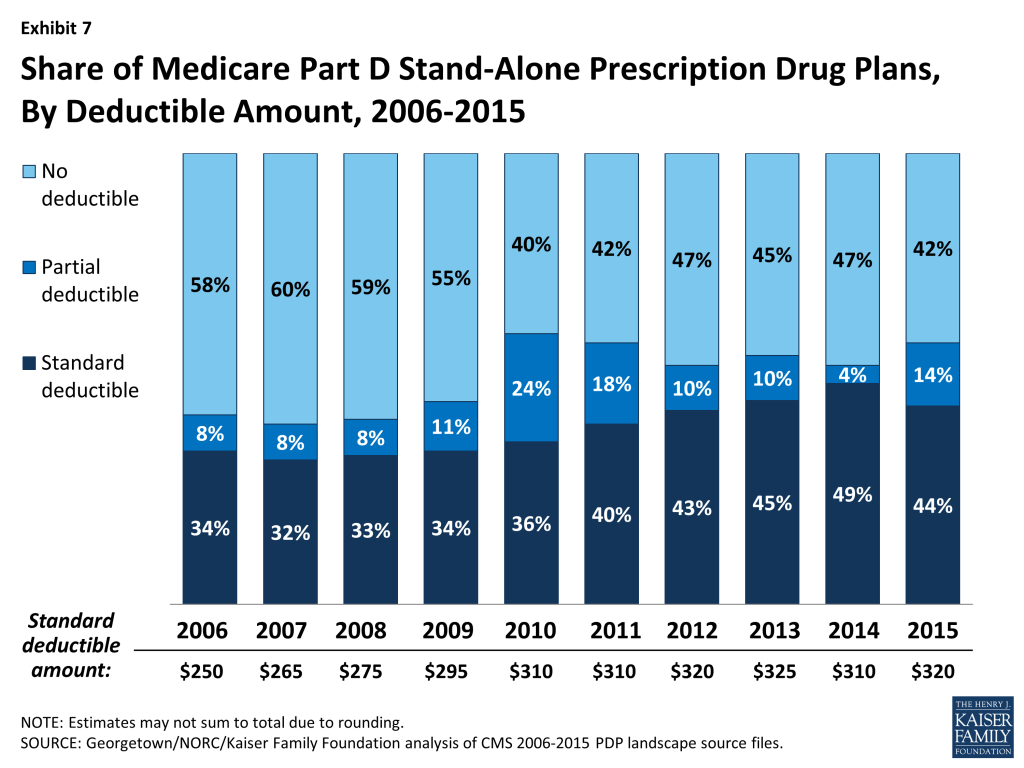
In 2015, for the first time since the program started in 2006, all Part D PDPs will offer an alternative benefit design to the defined standard benefit, which has a $320 deductible in 2015 and 25 percent coinsurance for all covered drugs. Some plans modify or eliminate the deductible, and all PDPs use some type of varying cost-sharing tiers for covered generic and brand-name drugs.
- A majority of PDPs (58 percent) will charge a deductible in 2015, up modestly from 53 percent in 2014. Most PDPs with a deductible (44 percent) will charge the standard $320 amount. Among PDPs that charge a deductible, the share with a deductible below the standard amount has increased from 2014 (4 percent to 14 percent), but remains a relatively small share of plans. (Exhibit 7)
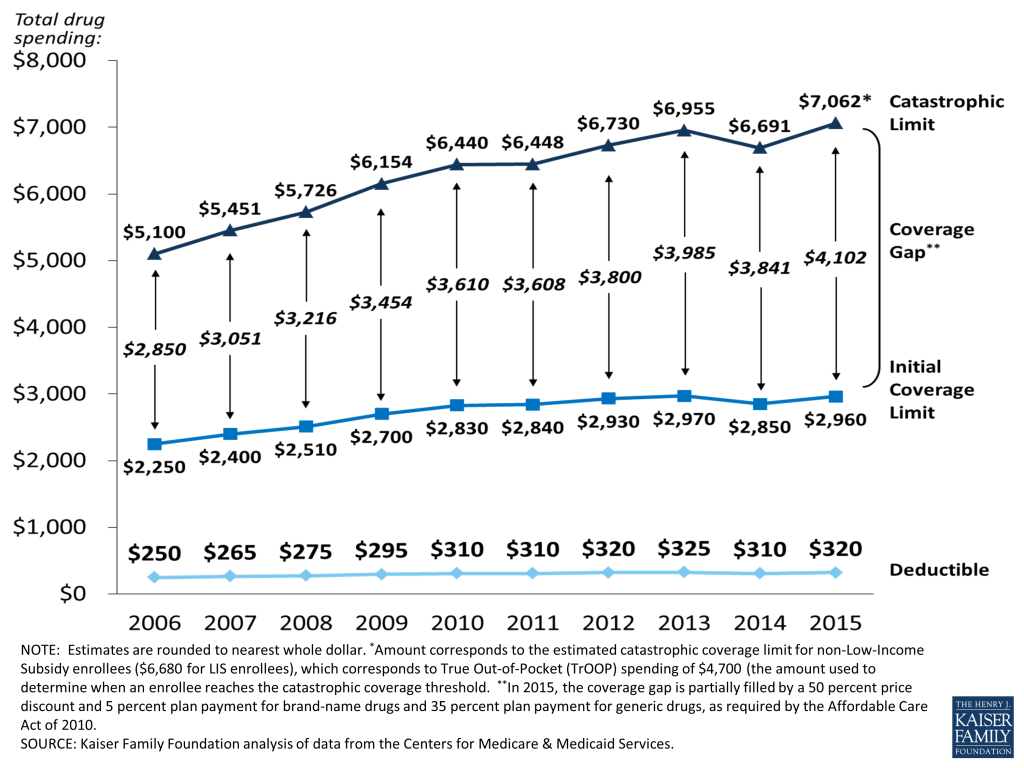
The coverage gap, or “doughnut hole,” is gradually becoming a less salient feature of the Part D benefit design, as a result of changes made by the ACA, and will be fully eliminated as of 2020, when beneficiaries will only be responsible for 25 percent of their total drug costs in the gap. Since 2011, any beneficiary with drug costs high enough to reach the gap has paid less than the full cost of the price of their drugs. In 2015, manufacturer prices for brand-name drugs purchased in the gap will be discounted by 50 percent, with plans paying an additional 5 percent of the cost and enrollees paying the remaining 45 percent. Plans will pay 35 percent of the cost for generic drugs in the gap, with enrollees paying 65 percent. In 2015, the coverage gap begins after an enrollee incurs $2,960 in total drug spending and ends after an enrollee has spent a total of $4,700 out of pocket (or $7,062 in total drug costs under the standard benefit).9 At that point, catastrophic coverage begins, where enrollees generally pay only 5 percent of drug costs. (Appendix 2)
Most Part D plans will offer no gap coverage in 2015 beyond what is required by the ACA under the standard benefit. With all Part D enrollees now getting coverage for a share of their costs in the gap, the value of additional gap coverage offered by plans will become lower each year until 2020, when the gap is fully closed.
- In 2015, about 74 percent of all PDPs will offer no additional gap coverage. This is a small decrease from 2014, when 76 percent of PDPs offered no additional gap coverage—meaning a slightly larger share of plans will offer some gap coverage beyond what the ACA requires in 2015 than in 2014. For 2015, CMS has changed the way it reports gap coverage, no longer making distinctions between plans based on the share of formulary drugs covered in the gap or on whether both brand and generic drugs are included. In 2014, about one-fourth of PDPs with some additional coverage in the gap included fewer than 10 percent of formulary drugs in that coverage. (Appendix 1, Table A3)
Low-income Subsidy (“Benchmark”) Plans
In 2015, the total availability of premium-free “benchmark” plans—that is, PDPs available for no monthly premium to Low-Income Subsidy (LIS) enrollees—will be at its lowest level in the program’s ten years.
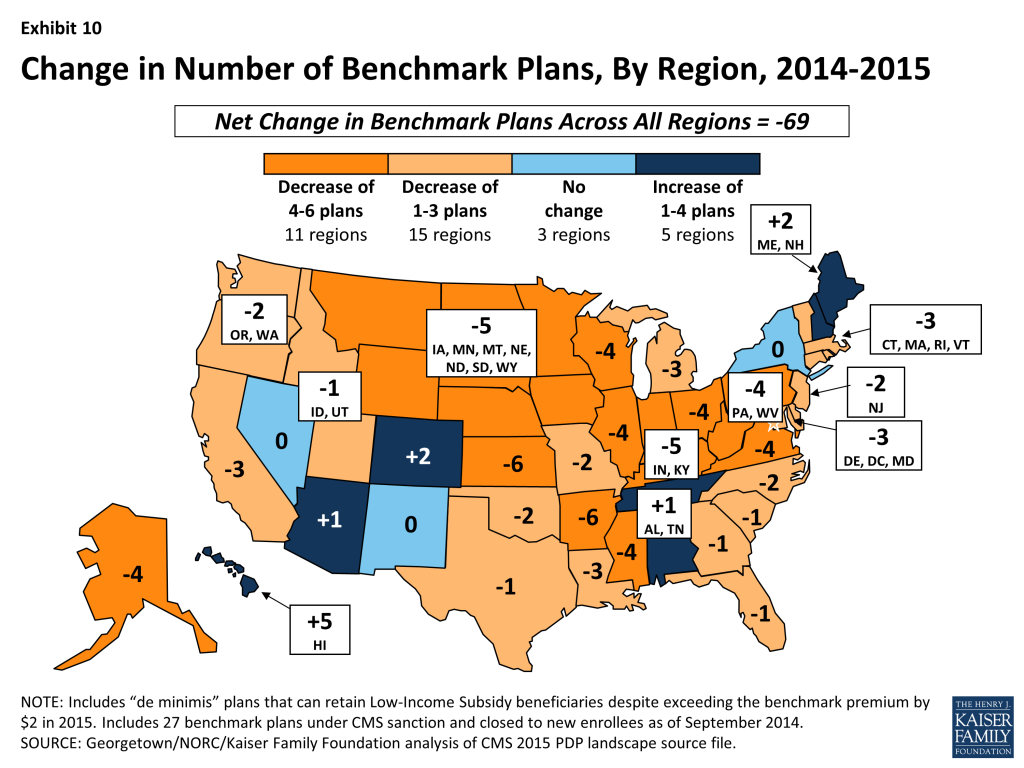
- In 2015, 283 plans will be available for enrollment of LIS recipients for zero premium. This represents a 20 percent decrease in plans for LIS recipients, or 69 fewer plans than in 2014. (Exhibit 8; Appendix 1, Table A4)
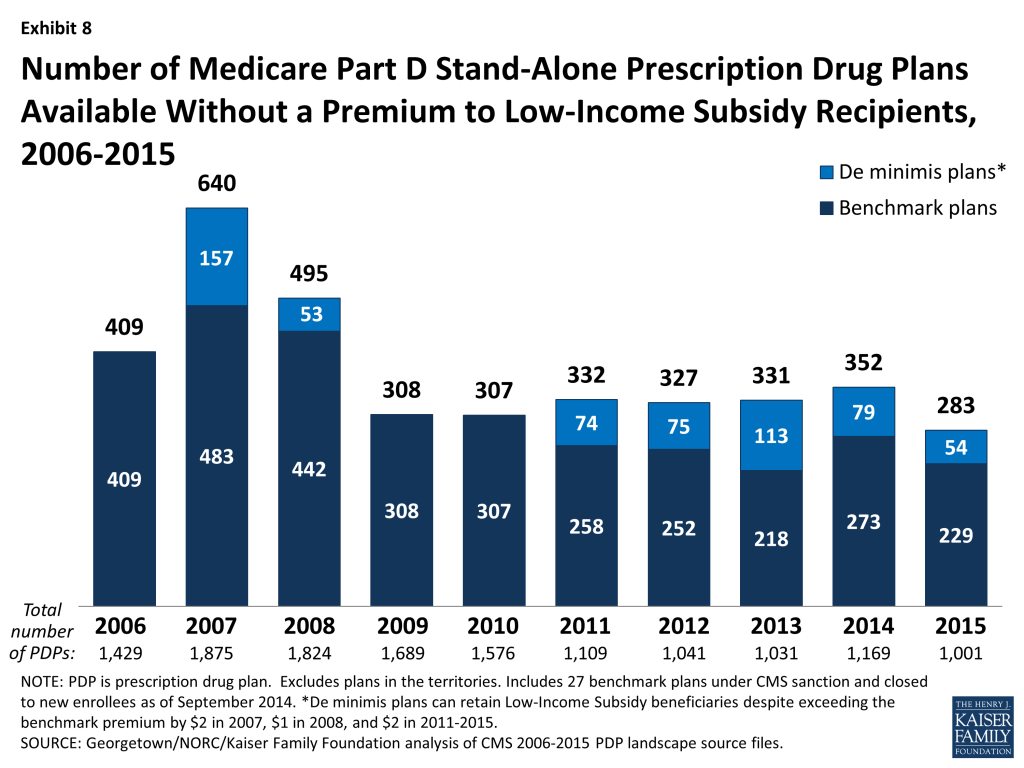
- Policies adopted by CMS in previous years make it easier for PDPs to qualify as benchmark plans, including the “de minimis” policy that allows plans to waive a premium amount of up to $2 in order to retain their LIS enrollees.10 Of the 283 benchmark plans in 2015, about one in five (54 plans) qualify through the “de minimis” policy—fewer than the 79 “de minimis” plans in 2014.
- Among the 2014 benchmark plans that will continue to participate in Part D in 2015, 64 PDPs have lost their benchmark status due to either higher premiums in 2015 or to a lower regional benchmark in 2015; the sponsors of another 24 benchmark plans exited the market completely. About 574,000 LIS beneficiaries (7 percent of LIS enrollment in PDPs in 2014) are enrolled in these 88 plans, meaning these beneficiaries may experience some disruption in their coverage for 2015.
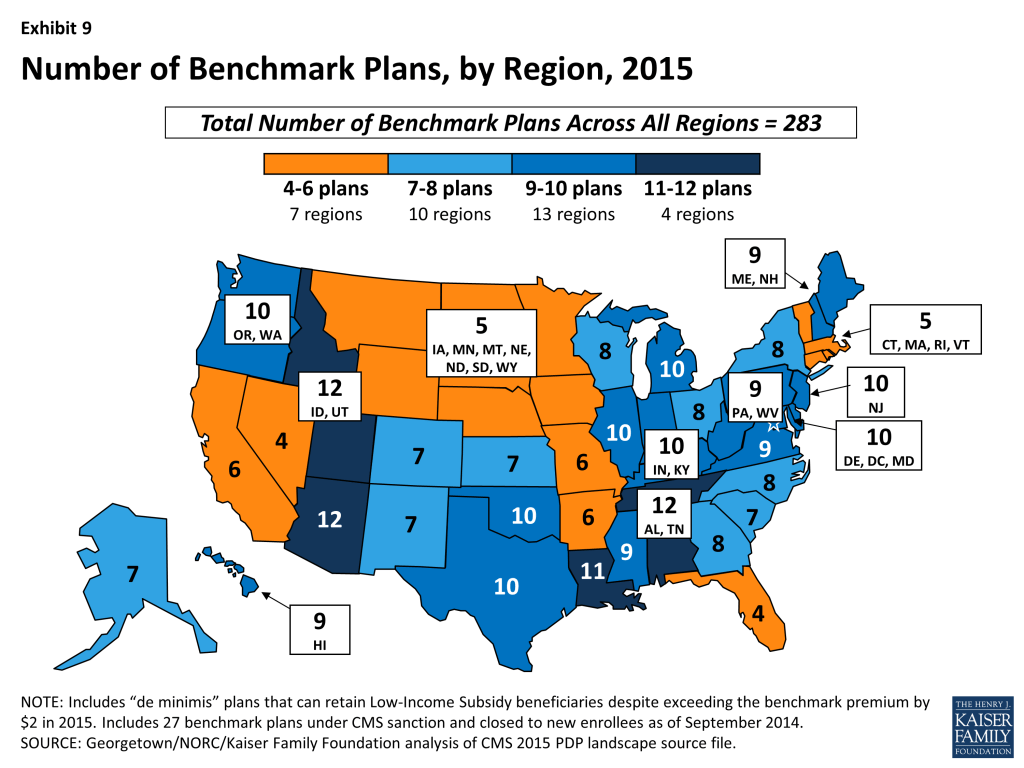
- The number of benchmark plans available in 2015 will vary by region, from 4 benchmark PDPs in the Nevada region (out of 32 PDPs) to 12 benchmark PDPs in the Arizona, Idaho/Utah, and Alabama/Tennessee regions. (Exhibit 9)
- Benchmark plan availability will decline in 26 of 34 regions between 2014 and 2015, while more LIS plans will be available in 5 regions. Year-to-year changes in most regions are relatively modest; the largest changes are the loss of six benchmark plans in the Arkansas and Kansas regions. Hawaii gained five benchmark plans after losing six one year earlier. (Exhibit 10)
About 1.8 million people—more than one in five LIS beneficiaries (22 percent)—are enrolled in PDPs in 2014 that will not qualify as benchmark plans in 2015. (Exhibit 11)
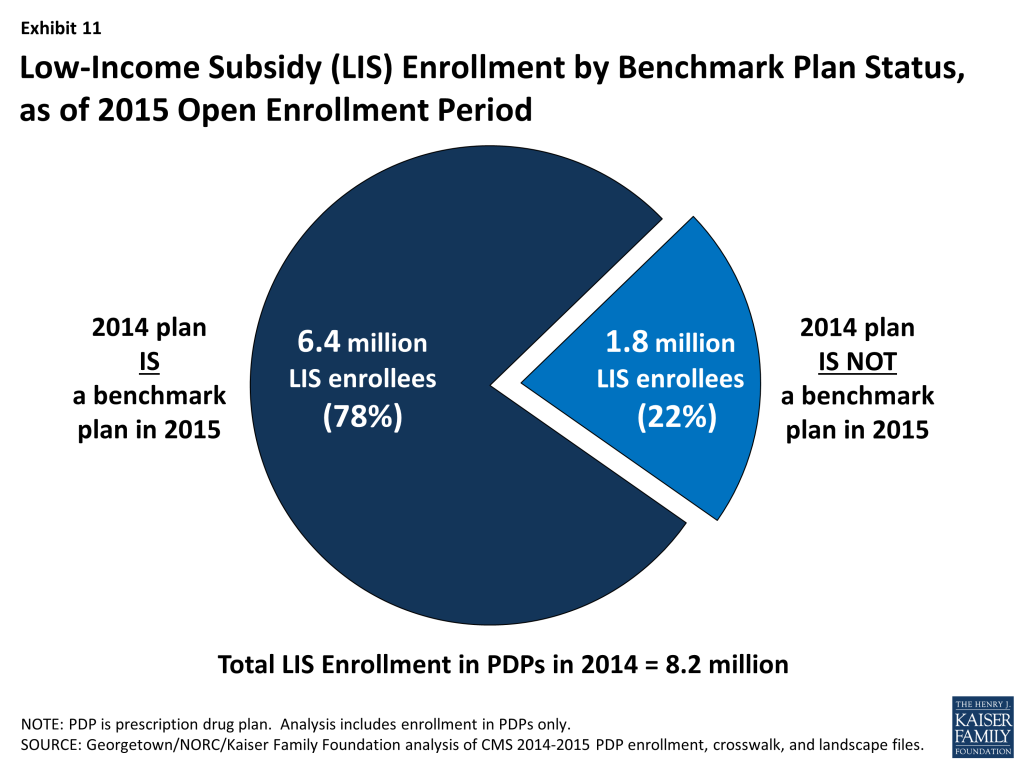
- This group includes 574,000 beneficiaries who were in benchmark plans in 2014; the remaining two-thirds (68 percent) of these beneficiaries are currently enrolled in non-benchmark plans and thus paid a premium in 2014.
- About 513,000 LIS enrollees will pay premiums of at least $20 per month and nearly 50,000 LIS enrollees will pay premiums of at least $50 per month if they do not switch to other PDPs.
The number of LIS beneficiaries who will potentially pay a premium in 2015 unless they enroll in (or are switched to) benchmark plans (1.8 million) is down slightly from the 1.9 million LIS beneficiaries who were in a similar situation at the time of the 2014 open enrollment period.
- CMS will reassign an estimated 500,000 of these LIS enrollees, specifically those who were randomly assigned by CMS to their current plan (for 2014, one-third of those scheduled to pay a premium were reassigned), and several states will help reassign those enrolled in their state pharmacy assistance programs (SPAPs).11 But many other LIS beneficiaries who are currently not enrolled in plans that will be premium-free in 2015 must switch plans on their own or pay a premium if they remain in their 2014 plan. Those in the latter group will not be automatically reassigned by CMS because in the past they or someone assisting them made a choice to switch plans. Most affected LIS beneficiaries will receive a letter from CMS or their SPAP either informing them of their reassignment or reminding them that they can choose a different plan and avoid paying a premium.
The number of premium-free plans for LIS enrollees offered by the major Part D organizations has fluctuated substantially during the program’s ten years. This year, nine PDP sponsors will offer benchmark plans in at least half of the 34 regions.12 Two sponsors (Aetna and Humana) will offer benchmark plans in all 34 regions in 2015.
In 2014, about 70 percent of LIS enrollees in PDPs are in plans operated by just four plan sponsors (CVS Health, Humana, UnitedHealthcare, and Cigna). The first three of these sponsors offer PDPs that qualify as benchmark plans in at least 28 of the 34 PDP regions in 2015. By contrast, Cigna offers PDPs that qualify as premium-free in 23 regions in 2015, down from 27 in 2014. (Exhibit 12)
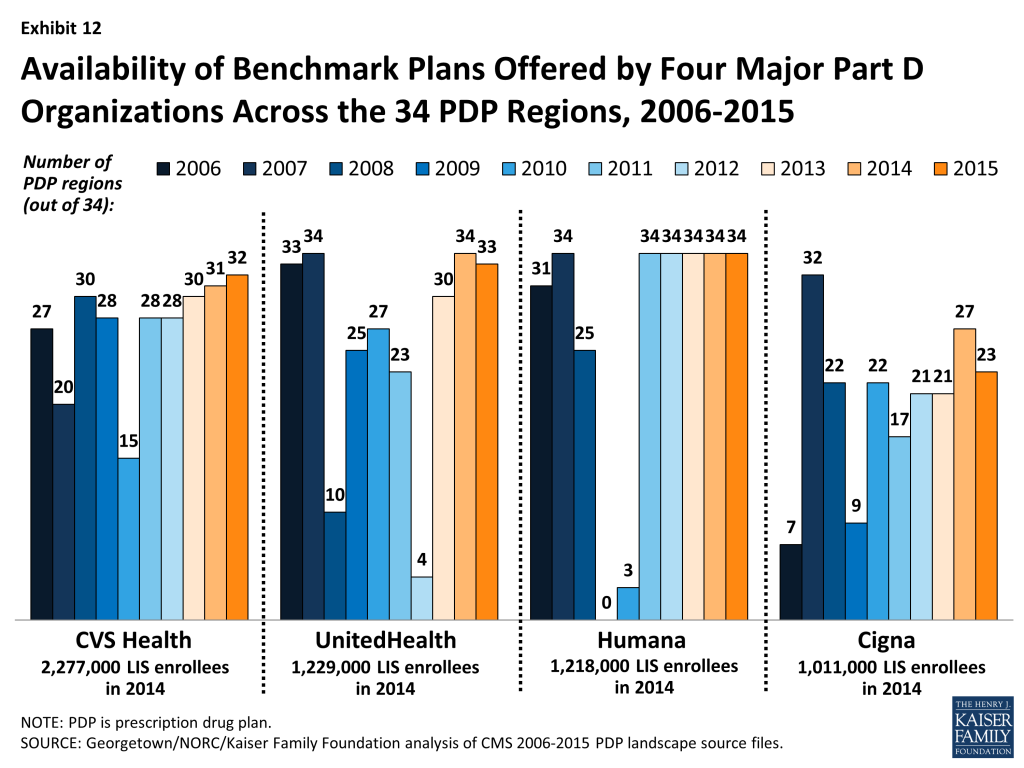
- Although these four sponsors offer PDPs that qualify as benchmark plans in most regions, their LIS enrollees may be split between premium-free benchmark plans and other plans operated by these sponsors. For example, 53 percent of UnitedHealthcare’s LIS enrollees are in non-benchmark PDPs and thus pay premiums of $19.02 on average (although this share is down from 71 percent one year earlier). Most of them are in the AARP Medicare Rx Preferred PDP, which qualified as a benchmark PDP in the program’s earlier years. By contrast, only 10 percent of Cigna’s LIS enrollees and only 1 percent of CVS Health’s LIS enrollees are in those sponsors’ non-benchmark PDPs.
Other Notable Trends for 2015
Three other notable trends characterize the Part D program for 2015:
- Nearly all PDPs (87 percent) use pharmacy networks with preferred (lower) cost sharing offered in selected network pharmacies. In these networks, enrollees pay lower cost sharing for their prescriptions when they use a pharmacy that offers preferred cost sharing. This share is up from 72 percent of PDPs using pharmacy networks with preferred cost sharing in 2014, and a significant increase from just a few years ago when only a small share of plans used this type of preferred pricing (7 percent in 2011).13 Among the national and near-national PDPs with this type of preferred cost sharing, the AARP MedicareRx Saver Plus PDP charges a $20 copayment for a preferred brand drug in a pharmacy that offers preferred cost sharing and $45 in another network pharmacy that does not offer preferred cost sharing, while the Humana Walmart Rx PDP charges a $1 copayment for preferred generic drugs and $4 for non-preferred generics at a pharmacy with preferred cost sharing, compared to $10 and $33, respectively, at other network pharmacies where preferred cost sharing is not offered.
- The use of formulary tiers has been common since the program’s beginning in 2006, but for the first time in 2015, all PDPs will use tiered cost sharing. Most PDPs will use five tiers (two for generic drugs, two for brand-name drugs, and one for higher-cost specialty drugs). By 2013, this five-tier benefit design had become common, and in 2014, three-fourths of all PDPs used this design.14 Based on preliminary analysis of national and near-national PDPs, nearly 90 percent of these PDPs are using the five-tier design in 2015. In fact, there are no remaining PDPs using the Part D standard benefit as defined in law (25 percent coinsurance for all drugs).
- Over the years, there has been a trend toward the use of coinsurance in place of flat copayments for some formulary tiers. About two-thirds of national and near-national PDPs are using coinsurance for their non-preferred brand tiers in 2015; about one-fourth do so for their preferred brand tiers. One implication is that coinsurance for drugs in the non-preferred brand tier is higher than that for specialty-tier drugs by as much as 25 percentage points.
Discussion
In 2015, there will be 1,001 Medicare Part D stand-alone prescription drug plans available nationwide, fewer PDPs than in any year since the program began. Beneficiaries will still have many options; the average beneficiary will have a choice of 30 PDPs, and most will also have access to several Medicare Advantage drug plans. The smaller number of plans reflects the combined effect of mergers among Part D plan sponsors and the response of sponsors to CMS policies put in place in recent years encouraging sponsors to eliminate PDPs with low enrollment and to drop multiple PDPs that are not meaningfully different from each other. The reduced set of offerings could make the process of comparing and reviewing plan options somewhat easier for beneficiaries to undertake during the open enrollment period from October 15 to December 7, 2014.
On average, plan enrollees who remain in the same plan will see a modest 4 percent premium increase ($1.56 per month) if they stay enrolled in the same plan in 2015. But the changes affect individual plan enrollees differently. Enrollees in six of the program’s most popular PDPs will experience premium increases of at least 10 percent, and those enrolled in one of these PDPs face an increase of 52 percent. By contrast, enrollees in three other popular PDPs will see substantially lower premiums. About one-third of all PDP enrollees are in plans that will experience a premium reduction in 2015 and about 8 percent of PDP enrollees will see a premium increase of $10 or more.
Although the majority of plans offered in 2015 will offer no gap coverage beyond that which is required by the Affordable Care Act, the presence of this gap coverage is becoming less important as the Medicare Part D “doughnut hole” gradually closes by 2020.
Nationwide, beneficiaries receiving Low-Income Subsidies will have 69 fewer plans available to them for no monthly premium in 2015 than in 2014. This reduction in premium-free plan availability is one reason why nearly one in four LIS beneficiaries will need to change plans between 2014 and 2015 to avoid paying a premium. Although some of the latter group will be reassigned by CMS to benchmark plans, many are likely to stay with their current plans and end up paying premiums for drug coverage in 2015, despite having the option to enroll in a zero-premium plan.
This evaluation of the Part D plan landscape for 2015 and changes over time indicates that many PDP enrollees will face some changes in their current plan, whether in the form of higher or lower premiums, deductibles, cost sharing, pharmacy networks, or other benefit design features. Changes in Part D plan costs and benefit design from one year to the next have been a defining featuring of the program since its beginning. While the annual enrollment period is the best opportunity for people on Medicare to evaluate their coverage options and make changes, our analysis of plan switching showed that about 87 percent of all PDP enrollees stayed in the same plan in annual enrollment periods between 2006 and 2010.15 Even when they were projected to face large premium increases, a majority of PDP enrollees stayed in the same plan from one year to the next. And even when PDP enrollees responded to premium changes by switching plans, they did not always end up with lower out-of-pocket costs for their prescription drug purchases. Finding ways to get more Part D enrollees engaged in comparing and reviewing plans and making changes that could save them money remains an ongoing challenge for CMS and policymakers.
Jack Hoadley and Laura Summer are with the Health Policy Institute, Georgetown University; Elizabeth Hargrave is with NORC at the University of Chicago;Juliette Cubanski is with the Kaiser Family Foundation.
Appendix
Appendix 1: Information about Medicare Stand-Alone Prescription Drug Plans by State
| Table A1: Number of Stand-Alone Prescription Drug Plans by State, 2006-2015 | ||||||||||||
| STATE/TERRITORY | 2006 | 2007 | 2008 | 2009 | 2010 | 2011 | 2012 | 2013 | 2014 | 2015 | 2014-2015 change | |
| U.S. Total | 1,429 | 1,875 | 1,824 | 1,689 | 1,576 | 1,109 | 1,041 | 1,031 | 1,169 | 1,001 | -168 | |
| Alabama | 41 | 56 | 53 | 49 | 46 | 34 | 32 | 33 | 35 | 30 | -5 | |
| Alaska | 27 | 45 | 47 | 45 | 41 | 29 | 25 | 23 | 28 | 24 | -4 | |
| Arizona | 43 | 53 | 51 | 49 | 46 | 30 | 30 | 29 | 34 | 30 | -4 | |
| Arkansas | 40 | 58 | 55 | 52 | 49 | 34 | 30 | 30 | 34 | 29 | -5 | |
| California | 47 | 55 | 56 | 51 | 47 | 33 | 33 | 32 | 36 | 32 | -4 | |
| Colorado | 43 | 55 | 55 | 53 | 48 | 31 | 28 | 29 | 34 | 30 | -4 | |
| Connecticut | 44 | 51 | 51 | 47 | 48 | 34 | 30 | 30 | 33 | 27 | -6 | |
| Delaware | 47 | 55 | 52 | 48 | 45 | 33 | 31 | 29 | 36 | 27 | -9 | |
| District of Columbia | 47 | 55 | 52 | 48 | 45 | 33 | 31 | 29 | 36 | 27 | -9 | |
| Florida | 43 | 57 | 58 | 54 | 49 | 32 | 33 | 34 | 35 | 27 | -8 | |
| Georgia | 42 | 55 | 54 | 50 | 45 | 32 | 30 | 30 | 34 | 30 | -4 | |
| Hawaii | 29 | 46 | 49 | 47 | 41 | 28 | 25 | 23 | 29 | 25 | -4 | |
| Idaho | 44 | 56 | 54 | 51 | 48 | 35 | 33 | 32 | 37 | 31 | -6 | |
| Illinois | 42 | 56 | 53 | 49 | 46 | 35 | 33 | 32 | 38 | 33 | -5 | |
| Indiana | 42 | 53 | 52 | 48 | 44 | 32 | 31 | 31 | 35 | 31 | -4 | |
| Iowa | 41 | 53 | 52 | 48 | 46 | 33 | 33 | 32 | 34 | 30 | -4 | |
| Kansas | 40 | 53 | 52 | 48 | 46 | 33 | 31 | 30 | 33 | 29 | -4 | |
| Kentucky | 42 | 53 | 52 | 48 | 44 | 32 | 31 | 31 | 35 | 31 | -4 | |
| Louisiana | 39 | 52 | 50 | 47 | 45 | 32 | 30 | 30 | 33 | 28 | -5 | |
| Maine | 41 | 53 | 53 | 46 | 43 | 30 | 28 | 28 | 32 | 28 | -4 | |
| Maryland | 47 | 55 | 52 | 48 | 45 | 33 | 31 | 29 | 36 | 27 | -9 | |
| Massachusetts | 44 | 51 | 51 | 47 | 48 | 34 | 30 | 30 | 33 | 27 | -6 | |
| Michigan | 40 | 54 | 55 | 51 | 46 | 35 | 34 | 33 | 36 | 31 | -5 | |
| Minnesota | 41 | 53 | 52 | 48 | 46 | 33 | 33 | 32 | 34 | 30 | -4 | |
| Mississippi | 38 | 52 | 49 | 47 | 45 | 32 | 30 | 29 | 33 | 28 | -5 | |
| Missouri | 41 | 53 | 52 | 48 | 45 | 32 | 30 | 31 | 35 | 31 | -4 | |
| Montana | 41 | 53 | 52 | 48 | 46 | 33 | 33 | 32 | 34 | 30 | -4 | |
| Nebraska | 41 | 53 | 52 | 48 | 46 | 33 | 33 | 32 | 34 | 30 | -4 | |
| Nevada | 44 | 54 | 53 | 49 | 46 | 31 | 29 | 29 | 34 | 32 | -2 | |
| New Hampshire | 41 | 53 | 53 | 46 | 43 | 30 | 28 | 28 | 32 | 28 | -4 | |
| New Jersey | 44 | 57 | 57 | 52 | 47 | 33 | 30 | 29 | 34 | 29 | -5 | |
| New Mexico | 43 | 57 | 55 | 50 | 47 | 32 | 30 | 30 | 36 | 31 | -5 | |
| New York | 46 | 61 | 55 | 51 | 50 | 33 | 29 | 28 | 31 | 25 | -6 | |
| North Carolina | 38 | 51 | 52 | 49 | 47 | 33 | 30 | 30 | 34 | 29 | -5 | |
| North Dakota | 41 | 53 | 52 | 48 | 46 | 33 | 33 | 32 | 34 | 30 | -4 | |
| Ohio | 43 | 60 | 58 | 49 | 46 | 34 | 33 | 33 | 37 | 31 | -6 | |
| Oklahoma | 42 | 56 | 52 | 49 | 46 | 33 | 30 | 30 | 36 | 31 | -5 | |
| Oregon | 45 | 57 | 55 | 48 | 44 | 32 | 30 | 30 | 35 | 30 | -5 | |
| Pennsylvania | 52 | 66 | 63 | 57 | 55 | 38 | 36 | 38 | 39 | 29 | -10 | |
| Rhode Island | 44 | 51 | 51 | 47 | 48 | 34 | 30 | 30 | 33 | 27 | -6 | |
| South Carolina | 45 | 59 | 56 | 53 | 47 | 34 | 32 | 31 | 35 | 31 | -4 | |
| South Dakota | 41 | 53 | 52 | 48 | 46 | 33 | 33 | 32 | 34 | 30 | -4 | |
| Tennessee | 41 | 56 | 53 | 49 | 46 | 34 | 32 | 33 | 35 | 30 | -5 | |
| Texas | 47 | 60 | 56 | 53 | 50 | 33 | 33 | 32 | 36 | 32 | -4 | |
| Utah | 44 | 56 | 54 | 51 | 48 | 35 | 33 | 32 | 37 | 31 | -6 | |
| Vermont | 44 | 51 | 51 | 47 | 48 | 34 | 30 | 30 | 33 | 27 | -6 | |
| Virginia | 41 | 53 | 52 | 48 | 44 | 32 | 30 | 31 | 35 | 31 | -4 | |
| Washington | 45 | 57 | 55 | 48 | 44 | 32 | 30 | 30 | 35 | 30 | -5 | |
| West Virginia | 52 | 66 | 63 | 57 | 55 | 38 | 36 | 38 | 39 | 29 | -10 | |
| Wisconsin | 45 | 54 | 57 | 53 | 48 | 32 | 29 | 30 | 33 | 29 | -4 | |
| Wyoming | 41 | 53 | 52 | 48 | 46 | 33 | 33 | 32 | 34 | 30 | -4 | |
| TERRITORY | ||||||||||||
| American Samoa | 1 | 3 | 4 | 4 | 3 | 2 | 1 | 1 | 1 | 1 | 0 | |
| Guam | 1 | 3 | 4 | 4 | 3 | 2 | 1 | 1 | 1 | 2 | 1 | |
| Northern Mariana Islands | 1 | 3 | 4 | 4 | 3 | 2 | 1 | 1 | 1 | 1 | 0 | |
| Puerto Rico | 10 | 28 | 34 | 33 | 29 | 17 | 16 | 16 | 13 | 7 | -6 | |
| Virgin Islands | 4 | 6 | 7 | 7 | 6 | 4 | 3 | 1 | 1 | 1 | 0 | |
| NOTE: Analysis includes 37 plans under CMS sanction and closed to new enrollees as of September 2014.SOURCE: Georgetown/NORC/Kaiser Family Foundation analysis of CMS 2014-2015 PDP crosswalk and landscape source files. | ||||||||||||
| Table A2: Monthly Premiums for Stand-Alone Prescription Drug Plans by State, 2015 | ||||
STATE/TERRITORY | Minimum Premium | Maximum Premium | Weighted Average Premium | % Change,2014-2015 |
| U.S. Total | $12.60 | $171.90 | $37.20 | 4.4% |
| Alabama | $15.60 | $133.10 | $37.92 | 0.1% |
| Alaska | $15.60 | $135.20 | $34.91 | 7.3% |
| Arizona | $15.70 | $133.70 | $31.57 | 8.6% |
| Arkansas | $15.60 | $138.60 | $38.25 | -0.8% |
| California | $15.70 | $145.70 | $36.87 | 6.1% |
| Colorado | $15.60 | $131.40 | $37.71 | 5.0% |
| Connecticut | $15.60 | $128.80 | $34.34 | 7.4% |
| Delaware | $15.70 | $127.10 | $39.56 | -5.2% |
| District of Columbia | $15.70 | $127.10 | $39.56 | -5.2% |
| Florida | $15.70 | $171.90 | $37.21 | 6.8% |
| Georgia | $15.70 | $127.10 | $36.30 | 2.4% |
| Hawaii | $15.60 | $127.10 | $30.33 | 2.3% |
| Idaho | $15.70 | $144.70 | $42.23 | 3.8% |
| Illinois | $15.70 | $131.90 | $35.99 | 9.4% |
| Indiana | $15.70 | $131.30 | $38.37 | 1.6% |
| Iowa | $15.70 | $139.20 | $36.81 | 7.7% |
| Kansas | $15.60 | $139.40 | $37.19 | 5.9% |
| Kentucky | $15.70 | $131.30 | $38.37 | 1.6% |
| Louisiana | $15.70 | $129.80 | $35.59 | -2.6% |
| Maine | $15.60 | $127.10 | $32.59 | 5.1% |
| Maryland | $15.70 | $127.10 | $39.56 | -5.2% |
| Massachusetts | $15.60 | $128.80 | $34.34 | 7.4% |
| Michigan | $15.70 | $107.10 | $38.01 | 4.8% |
| Minnesota | $15.70 | $139.20 | $36.81 | 7.7% |
| Mississippi | $15.60 | $127.10 | $36.81 | -0.3% |
| Missouri | $15.70 | $136.50 | $37.09 | 2.4% |
| Montana | $15.70 | $139.20 | $36.81 | 7.7% |
| Nebraska | $15.70 | $139.20 | $36.81 | 7.7% |
| Nevada | $15.70 | $127.10 | $35.46 | 4.0% |
| New Hampshire | $15.60 | $127.10 | $32.59 | 5.1% |
| New Jersey | $15.70 | $137.10 | $42.37 | 5.2% |
| New Mexico | $12.60 | $127.10 | $26.66 | 4.7% |
| New York | $15.70 | $143.00 | $38.58 | 1.4% |
| North Carolina | $15.70 | $133.50 | $37.32 | 9.0% |
| North Dakota | $15.70 | $139.20 | $36.81 | 7.7% |
| Ohio | $15.60 | $114.00 | $34.94 | 5.0% |
| Oklahoma | $15.70 | $140.90 | $37.69 | 5.0% |
| Oregon | $15.70 | $155.50 | $38.18 | 3.1% |
| Pennsylvania | $15.70 | $151.80 | $38.04 | 3.4% |
| Rhode Island | $15.60 | $128.80 | $34.34 | 7.4% |
| South Carolina | $15.60 | $141.70 | $40.47 | 3.5% |
| South Dakota | $15.70 | $139.20 | $36.81 | 7.7% |
| Tennessee | $15.60 | $133.10 | $37.92 | 0.1% |
| Texas | $15.60 | $152.10 | $37.05 | 2.7% |
| Utah | $15.70 | $144.70 | $42.23 | 3.8% |
| Vermont | $15.60 | $128.80 | $34.34 | 7.4% |
| Virginia | $15.60 | $126.00 | $36.63 | 6.9% |
| Washington | $15.70 | $155.50 | $38.18 | 3.1% |
| West Virginia | $15.70 | $151.80 | $38.04 | 3.4% |
| Wisconsin | $15.70 | $130.00 | $38.53 | 5.3% |
| Wyoming | $15.70 | $139.20 | $36.81 | 7.7% |
TERRITORY | ||||
| American Samoa | $24.80 | $24.80 | $24.80 | 22.8% |
| Guam | $21.40 | $23.70 | $21.40 | 4.4% |
| Northern Mariana Islands | $11.70 | $11.70 | $11.70 | 8.3% |
| Puerto Rico | $0.10 | $63.50 | $38.94 | 8.5% |
| Virgin Islands | $43.60 | $43.60 | $43.60 | 33.7% |
| NOTE: Analysis includes 37 plans under CMS sanction and closed to new enrollees as of September 2014. Average monthly premium is weighted by 2014 enrollments for the region in which the state is located. Terminated plans are excluded in calculation of premium change.SOURCE: Georgetown/NORC/Kaiser Family Foundation analysis of CMS 2014-2015 PDP crosswalk and landscape source files. | ||||
| Table A3: Number of Stand-Alone Prescription Drug Plans With No Coverage in the Gap by State, 2006-2015* | ||||||||||
| STATE/TERRITORY | 2006 | 2007 | 2008 | 2009 | 2010 | 2011 | 2012 | 2013 | 2014 | 2015 |
| U.S. Total | 1,208 | 1,328 | 1,295 | 1,273 | 1,268 | 744 | 771 | 684 | 891 | 740 |
| Alabama | 35 | 39 | 38 | 38 | 37 | 24 | 24 | 22 | 28 | 23 |
| Alaska | 22 | 33 | 33 | 34 | 34 | 20 | 19 | 16 | 22 | 19 |
| Arizona | 37 | 38 | 36 | 37 | 38 | 21 | 23 | 19 | 27 | 23 |
| Arkansas | 34 | 40 | 39 | 39 | 39 | 23 | 22 | 21 | 27 | 22 |
| California | 40 | 41 | 41 | 39 | 38 | 22 | 23 | 21 | 27 | 23 |
| Colorado | 36 | 40 | 39 | 40 | 39 | 21 | 21 | 19 | 25 | 22 |
| Connecticut | 37 | 36 | 36 | 35 | 38 | 23 | 23 | 20 | 25 | 20 |
| Delaware | 41 | 39 | 37 | 36 | 36 | 22 | 23 | 20 | 27 | 20 |
| District of Columbia | 41 | 39 | 37 | 36 | 36 | 22 | 23 | 20 | 27 | 20 |
| Florida | 35 | 41 | 40 | 39 | 39 | 21 | 23 | 21 | 26 | 20 |
| Georgia | 35 | 39 | 39 | 38 | 36 | 21 | 22 | 19 | 25 | 21 |
| Hawaii | 24 | 34 | 34 | 35 | 32 | 19 | 19 | 16 | 23 | 20 |
| Idaho | 38 | 40 | 39 | 39 | 39 | 24 | 26 | 23 | 29 | 24 |
| Illinois | 36 | 40 | 38 | 37 | 37 | 23 | 24 | 21 | 30 | 25 |
| Indiana | 35 | 37 | 37 | 36 | 35 | 21 | 22 | 19 | 26 | 22 |
| Iowa | 34 | 38 | 36 | 36 | 37 | 22 | 24 | 21 | 26 | 22 |
| Kansas | 33 | 37 | 37 | 36 | 37 | 22 | 23 | 20 | 25 | 21 |
| Kentucky | 35 | 37 | 37 | 36 | 35 | 21 | 22 | 19 | 26 | 22 |
| Louisiana | 33 | 37 | 36 | 36 | 37 | 22 | 23 | 21 | 26 | 21 |
| Maine | 35 | 37 | 37 | 34 | 35 | 20 | 21 | 18 | 24 | 21 |
| Maryland | 41 | 39 | 37 | 36 | 36 | 22 | 23 | 20 | 27 | 20 |
| Massachusetts | 37 | 36 | 36 | 35 | 38 | 23 | 23 | 20 | 25 | 20 |
| Michigan | 34 | 39 | 39 | 38 | 37 | 24 | 25 | 22 | 28 | 23 |
| Minnesota | 34 | 38 | 36 | 36 | 37 | 22 | 24 | 21 | 26 | 22 |
| Mississippi | 32 | 37 | 35 | 36 | 37 | 22 | 23 | 20 | 26 | 21 |
| Missouri | 34 | 37 | 37 | 36 | 36 | 21 | 22 | 20 | 26 | 22 |
| Montana | 34 | 38 | 36 | 36 | 37 | 22 | 24 | 21 | 26 | 22 |
| Nebraska | 34 | 38 | 36 | 36 | 37 | 22 | 24 | 21 | 26 | 22 |
| Nevada | 37 | 38 | 38 | 37 | 38 | 21 | 22 | 19 | 25 | 22 |
| New Hampshire | 35 | 37 | 37 | 34 | 35 | 20 | 21 | 18 | 24 | 21 |
| New Jersey | 38 | 40 | 39 | 39 | 37 | 22 | 23 | 20 | 26 | 21 |
| New Mexico | 37 | 40 | 39 | 38 | 39 | 22 | 23 | 20 | 27 | 23 |
| New York | 40 | 44 | 40 | 39 | 41 | 23 | 22 | 20 | 24 | 19 |
| North Carolina | 31 | 36 | 36 | 36 | 37 | 22 | 22 | 20 | 26 | 21 |
| North Dakota | 34 | 38 | 36 | 36 | 37 | 22 | 24 | 21 | 26 | 22 |
| Ohio | 36 | 43 | 41 | 37 | 37 | 22 | 23 | 20 | 27 | 22 |
| Oklahoma | 35 | 40 | 37 | 37 | 37 | 22 | 23 | 21 | 28 | 23 |
| Oregon | 39 | 40 | 38 | 36 | 35 | 21 | 23 | 21 | 27 | 23 |
| Pennsylvania | 44 | 47 | 46 | 44 | 44 | 25 | 25 | 23 | 29 | 22 |
| Rhode Island | 37 | 36 | 36 | 35 | 38 | 23 | 23 | 20 | 25 | 20 |
| South Carolina | 39 | 43 | 41 | 41 | 38 | 23 | 24 | 21 | 27 | 23 |
| South Dakota | 34 | 38 | 36 | 36 | 37 | 22 | 24 | 21 | 26 | 22 |
| Tennessee | 35 | 39 | 38 | 38 | 37 | 24 | 24 | 22 | 28 | 23 |
| Texas | 41 | 43 | 40 | 40 | 40 | 22 | 24 | 21 | 28 | 24 |
| Utah | 38 | 40 | 39 | 39 | 39 | 24 | 26 | 23 | 29 | 24 |
| Vermont | 37 | 36 | 36 | 35 | 38 | 23 | 23 | 20 | 25 | 20 |
| Virginia | 35 | 37 | 37 | 36 | 35 | 21 | 22 | 20 | 26 | 22 |
| Washington | 39 | 40 | 38 | 36 | 35 | 21 | 23 | 21 | 27 | 23 |
| West Virginia | 44 | 47 | 46 | 44 | 44 | 25 | 25 | 23 | 29 | 22 |
| Wisconsin | 36 | 38 | 40 | 39 | 37 | 20 | 20 | 19 | 23 | 20 |
| Wyoming | 34 | 38 | 36 | 36 | 37 | 22 | 24 | 21 | 26 | 22 |
| TERRITORY | ||||||||||
| American Samoa | 1 | 2 | 3 | 3 | 2 | 1 | 1 | 1 | 0 | 1 |
| Guam | 1 | 2 | 3 | 3 | 2 | 1 | 1 | 1 | 0 | 2 |
| Northern Mariana Islands | 1 | 2 | 3 | 3 | 2 | 1 | 1 | 1 | 0 | 1 |
| Puerto Rico | 9 | 21 | 22 | 22 | 21 | 11 | 13 | 11 | 9 | 6 |
| Virgin Islands | 4 | 4 | 5 | 5 | 4 | 3 | 3 | 1 | 0 | 1 |
| NOTE: Total for 2015 includes 37 plans under CMS sanction and closed to new enrollees as of September 2014. Prior to 2015, plan counts reflect the number of plans offering no coverage in the gap, excluding plans that offer coverage of “few” brands or generics in the gap (where “few” is defined as more than zero percent to less than 10 percent of formulary drugs). *2011-2015 numbers reflect plans not offering additional coverage in the gap beyond what the law requires. Beginning in 2011, all Part D plans were required to offer additional coverage of drug costs in the coverage gap (a provision in the Affordable Care Act of 2010). In 2015, beneficiaries will receive a 50% price discount and a 5% payment by plans toward the cost of brand-name drugs and 35% plan payment toward the cost of generic drugs. By 2020, the coverage gap will be phased out and beneficiaries will be responsible for 25% of their total drug costs prior to qualifying for catastrophic coverage.SOURCE: Georgetown/NORC/Kaiser Family Foundation analysis of CMS 2006-2015 PDP landscape source files. | ||||||||||
| Table A4: Number of Stand-Alone Prescription Drug Plans Below Low-Income Subsidy Benchmark by State, 2006-2015 | ||||||||||
STATE/TERRITORY | 2006 | 2007 | 2008 | 2009 | 2010 | 2011 | 2012 | 2013 | 2014 | 2015 |
| U.S. Total | 409 | 640 | 495 | 308 | 307 | 332 | 327 | 331 | 352 | 283 |
| Alabama | 9 | 17 | 15 | 12 | 9 | 11 | 12 | 13 | 11 | 12 |
| Alaska | 8 | 17 | 15 | 7 | 6 | 5 | 4 | 7 | 11 | 7 |
| Arizona | 6 | 10 | 7 | 2 | 8 | 9 | 10 | 10 | 11 | 12 |
| Arkansas | 13 | 23 | 18 | 12 | 15 | 17 | 15 | 15 | 12 | 6 |
| California | 10 | 14 | 9 | 6 | 7 | 5 | 6 | 6 | 9 | 6 |
| Colorado | 10 | 19 | 12 | 8 | 6 | 7 | 5 | 4 | 5 | 7 |
| Connecticut | 11 | 20 | 14 | 12 | 13 | 12 | 10 | 6 | 8 | 5 |
| Delaware | 15 | 21 | 18 | 11 | 11 | 12 | 13 | 13 | 13 | 10 |
| District of Columbia | 15 | 21 | 18 | 11 | 11 | 12 | 13 | 13 | 13 | 10 |
| Florida | 6 | 10 | 8 | 5 | 5 | 4 | 3 | 2 | 5 | 4 |
| Georgia | 14 | 21 | 18 | 11 | 8 | 14 | 12 | 13 | 9 | 8 |
| Hawaii | 8 | 18 | 10 | 5 | 7 | 6 | 10 | 10 | 4 | 9 |
| Idaho | 14 | 20 | 14 | 9 | 9 | 11 | 12 | 10 | 13 | 12 |
| Illinois | 15 | 23 | 19 | 12 | 10 | 10 | 10 | 10 | 14 | 10 |
| Indiana | 13 | 19 | 17 | 12 | 9 | 14 | 13 | 11 | 15 | 10 |
| Iowa | 14 | 20 | 16 | 9 | 8 | 10 | 9 | 8 | 10 | 5 |
| Kansas | 11 | 20 | 17 | 10 | 9 | 12 | 10 | 10 | 13 | 7 |
| Kentucky | 13 | 19 | 17 | 12 | 9 | 14 | 13 | 11 | 15 | 10 |
| Louisiana | 11 | 12 | 10 | 7 | 13 | 10 | 12 | 14 | 14 | 11 |
| Maine | 14 | 21 | 18 | 5 | 4 | 7 | 8 | 10 | 7 | 9 |
| Maryland | 15 | 21 | 18 | 11 | 11 | 12 | 13 | 13 | 13 | 10 |
| Massachusetts | 11 | 20 | 14 | 12 | 13 | 12 | 10 | 6 | 8 | 5 |
| Michigan | 14 | 26 | 17 | 11 | 9 | 12 | 12 | 10 | 13 | 10 |
| Minnesota | 14 | 20 | 16 | 9 | 8 | 10 | 9 | 8 | 10 | 5 |
| Mississippi | 12 | 21 | 15 | 13 | 10 | 14 | 12 | 13 | 13 | 9 |
| Missouri | 10 | 15 | 13 | 6 | 13 | 5 | 8 | 8 | 8 | 6 |
| Montana | 14 | 20 | 16 | 9 | 8 | 10 | 9 | 8 | 10 | 5 |
| Nebraska | 14 | 20 | 16 | 9 | 8 | 10 | 9 | 8 | 10 | 5 |
| Nevada | 7 | 9 | 5 | 1 | 5 | 4 | 2 | 2 | 4 | 4 |
| New Hampshire | 14 | 21 | 18 | 5 | 4 | 7 | 8 | 10 | 7 | 9 |
| New Jersey | 14 | 20 | 18 | 7 | 6 | 6 | 9 | 10 | 12 | 10 |
| New Mexico | 8 | 14 | 11 | 7 | 8 | 8 | 6 | 7 | 7 | 7 |
| New York | 15 | 16 | 15 | 9 | 11 | 11 | 12 | 12 | 8 | 8 |
| North Carolina | 13 | 21 | 17 | 11 | 8 | 11 | 9 | 8 | 10 | 8 |
| North Dakota | 14 | 20 | 16 | 9 | 8 | 10 | 9 | 8 | 10 | 5 |
| Ohio | 10 | 22 | 15 | 6 | 5 | 8 | 8 | 8 | 12 | 8 |
| Oklahoma | 12 | 20 | 13 | 8 | 10 | 10 | 9 | 11 | 12 | 10 |
| Oregon | 15 | 20 | 15 | 7 | 9 | 8 | 9 | 10 | 12 | 10 |
| Pennsylvania | 15 | 26 | 18 | 9 | 11 | 12 | 12 | 14 | 13 | 9 |
| Rhode Island | 11 | 20 | 14 | 12 | 13 | 12 | 10 | 6 | 8 | 5 |
| South Carolina | 16 | 26 | 20 | 15 | 13 | 15 | 12 | 14 | 8 | 7 |
| South Dakota | 14 | 20 | 16 | 9 | 8 | 10 | 9 | 8 | 10 | 5 |
| Tennessee | 9 | 17 | 15 | 12 | 9 | 11 | 12 | 13 | 11 | 12 |
| Texas | 16 | 19 | 15 | 14 | 11 | 12 | 13 | 12 | 11 | 10 |
| Utah | 14 | 20 | 14 | 9 | 9 | 11 | 12 | 10 | 13 | 12 |
| Vermont | 11 | 20 | 14 | 12 | 13 | 12 | 10 | 6 | 8 | 5 |
| Virginia | 16 | 21 | 17 | 13 | 11 | 10 | 10 | 10 | 13 | 9 |
| Washington | 15 | 20 | 15 | 7 | 9 | 8 | 9 | 10 | 12 | 10 |
| West Virginia | 15 | 26 | 18 | 9 | 11 | 12 | 12 | 14 | 13 | 9 |
| Wisconsin | 14 | 21 | 16 | 16 | 10 | 10 | 10 | 10 | 12 | 8 |
| Wyoming | 14 | 20 | 16 | 9 | 8 | 10 | 9 | 8 | 10 | 5 |
TERRITORY | ||||||||||
| American Samoa | N/A | N/A | N/A | N/A | N/A | N/A | N/A | N/A | N/A | N/A |
| Guam | N/A | N/A | N/A | N/A | N/A | N/A | N/A | N/A | N/A | N/A |
| Northern Mariana Islands | N/A | N/A | N/A | N/A | N/A | N/A | N/A | N/A | N/A | N/A |
| Puerto Rico | N/A | N/A | N/A | N/A | N/A | N/A | N/A | N/A | N/A | N/A |
| Virgin Islands | N/A | N/A | N/A | N/A | N/A | N/A | N/A | N/A | N/A | N/A |
| NOTE: Benchmark plans are not designated (N/A) in the territories because low-income beneficiaries residing in the territories are not eligible for the low-income subsidy. Analysis for 2015 includes 27 benchmark plans under CMS sanction and closed to new enrollees as of September 2014.SOURCE: Georgetown/NORC/Kaiser Family Foundation analysis of CMS 2006-2015 PDP landscape source files. | ||||||||||
Appendix 2: Medicare Part D Standard Benefit Parameters, 2006-2015
Endnotes
- Centers for Medicare and Medicaid Services, “Medicare Advantage enrollment at all-time high; premiums remain affordable,” September 18, 2014; 2015 PDP, MA, and SNP Landscape Source Files and related files are available at http://www.cms.hhs.gov/PrescriptionDrugCovGenIn/. ↩︎
- These enrollment counts from September 2014 include 6.6 million Part D enrollees in employer-only plans, not otherwise analyzed for this spotlight. ↩︎
- Analysis of the 2014 Part D marketplace is available at https://modern.kff.org/medicare/report/medicare-part-d-in-its-ninth-year-the-2014-marketplace-and-key-trends-2006-2014/ and https://modern.kff.org/medicare/issue-brief/medicare-part-d-a-first-look-at-plan-offerings-in-2014/; analysis of the 2013 Part D marketplace is available at https://modern.kff.org/medicare/issue-brief/medicare-part-d-prescription-drug-plans-the-marketplace-in-2013-and-key-trends-2006-2013/ and https://modern.kff.org/medicare/report/medicare-part-d-first-look-at-2013-plan-offerings/. Analysis of the Part D marketplace for earlier years is available at https://modern.kff.org/. ↩︎
- The average is weighted by enrollment. ↩︎
- Based on authors’ analysis using the CMS 2015 Part D Crosswalk file. ↩︎
- The average premium will decrease from $29.25 in 2014 to $29.10 in 2015 for basic-benefit PDPs and will increase from $47.90 to $51.43 for enhanced-benefit PDPs. However, enrollees in 33 PDPs where beneficiaries are reassigned due to plan consolidation will switch from a basic PDP to an enhanced PDP, and enrollees in 68 PDPs will switch from enhanced to basic. If those enrollees are excluded, enrollees in basic PDPs will have on average a 3.8 percent premium increase, while those in enhanced PDPs will have a 7.5 percent increase. ↩︎
- Centers for Medicare & Medicaid Services, “Annual Release of Part D National Average Bid Amount and Other Part C & D Bid Related Information,” July 31, 2014. ↩︎
- Juliette Cubanski et al., “Raising Medicare Premiums for Higher-Income Beneficiaries: Assessing the Implications,” February 2012, available at https://modern.kff.org/medicare/issue-brief/income-relating-medicare-part-b-and-part/. ↩︎
- This amount corresponds to the estimated catastrophic coverage limit for non-Low-Income Subsidy enrollees ($6,680 for LIS enrollees), which corresponds to True Out-of-Pocket (TrOOP) spending of $4,700 (the amount used to determine when an enrollee reaches the catastrophic coverage threshold). ↩︎
- Plans qualifying through the de minimis policy are eligible for new enrollees, but will not receive auto-assigned enrollees. ↩︎
- Estimates for the total number of beneficiaries subject to paying a premium are based on plan data from the landscape and crosswalk files, together with CMS enrollment reports. The estimate of the number scheduled to be reassigned is based on personal communication from CMS; a final number will be released by CMS in November 2014. ↩︎
- These counts of benchmark plans include those designated as de minimis plans, which will not receive auto-assigned enrollees. ↩︎
- CMS has modified the terminology for what were previously called preferred pharmacy networks. Jack Hoadley, Laura Summer, Elizabeth Hargrave, Juliette Cubanski, and Tricia Neuman, “Medicare Part D in Its Ninth Year: The 2014 Marketplace and Key Trends,” Kaiser Family Foundation, August 2014, available at https://modern.kff.org/medicare/report/medicare-part-d-in-its-ninth-year-the-2014-marketplace-and-key-trends-2006-2014/. ↩︎
- Jack Hoadley, Laura Summer, Elizabeth Hargrave, Juliette Cubanski, and Tricia Neuman, “Medicare Part D in Its Ninth Year: The 2014 Marketplace and Key Trends.” ↩︎
- Jack Hoadley, Elizabeth Hargrave, Laura Summer, Juliette Cubanski, and Tricia Neuman, “To Switch or Not to Switch: Are Medicare Beneficiaries Switching Drug Plans To Save Money?” Kaiser Family Foundation, October 2013, available at https://modern.kff.org/medicare/issue-brief/to-switch-or-not-to-switch-are-medicare-beneficiaries-switching-drug-plans-to-save-money/. ↩︎