What’s In and What’s Out? Medicare Advantage Market Entries and Exits for 2016
Issue Brief
During the debate surrounding the Affordable Care Act (ACA), some questioned whether plans would exit as a result of the payment reductions to Medicare Advantage plans, leading to a drop in plan choices, and eventually, a decline in enrollment. Instead, Medicare Advantage enrollment growth has exceeded expectations, increasing from 24 percent of beneficiaries in 2010 to almost one-third (31%) of beneficiaries in 2015.1 Between 2010 and 2015, the total number of plans declined modestly, but beneficiaries in 2015 still had the option to choose among 18 Medicare Advantage plans, on average.2
This Data Note examines the availability of plans nationwide and by state, in 2016, and tracks changes in plan availability since 2012. The analysis uses the Centers for Medicare and Medicaid Services (CMS) 2016 Medicare Advantage Landscape Source file released September 15, 2015 and the 2016 Part C&D Plan Crosswalk file released October 1, 2015; the analysis excludes employer-based (group) Medicare Advantage plans, Special Needs Plans (SNPs) and other plans not available for general enrollment. It documents the number and share of Medicare Advantage enrollees affected by plan withdrawals each year, the characteristics of plans that will be entering or exiting the market in 2016, and the potential implications of these changes for Medicare Advantage enrollees.3
Our analysis finds that the Medicare Advantage market is relatively stable in terms of plan participation and beneficiary choice.
- On average, Medicare beneficiaries will be able to choose among 19 Medicare Advantage plans in 2016, a slight increase from last year (18 plans per beneficiary).
- The majority of plans available in 2015 will continue to be offered in 2016.
- A smaller number of plans will exit or enter the market than in any year since 2012.
- In most states, the total number of plans offered in 2016 will be greater than or equal to the number offered in 2015.
- Among the minority of 2015 plans exiting the market in 2016, most have relatively low enrollment, which means that relatively few beneficiaries will be affected by the market exits.
- Several firms will offer Medicare Advantage plans for the first time in 2016, including some that will be led by local, established health care systems.
Medicare Advantage Plan Availability
Nationwide
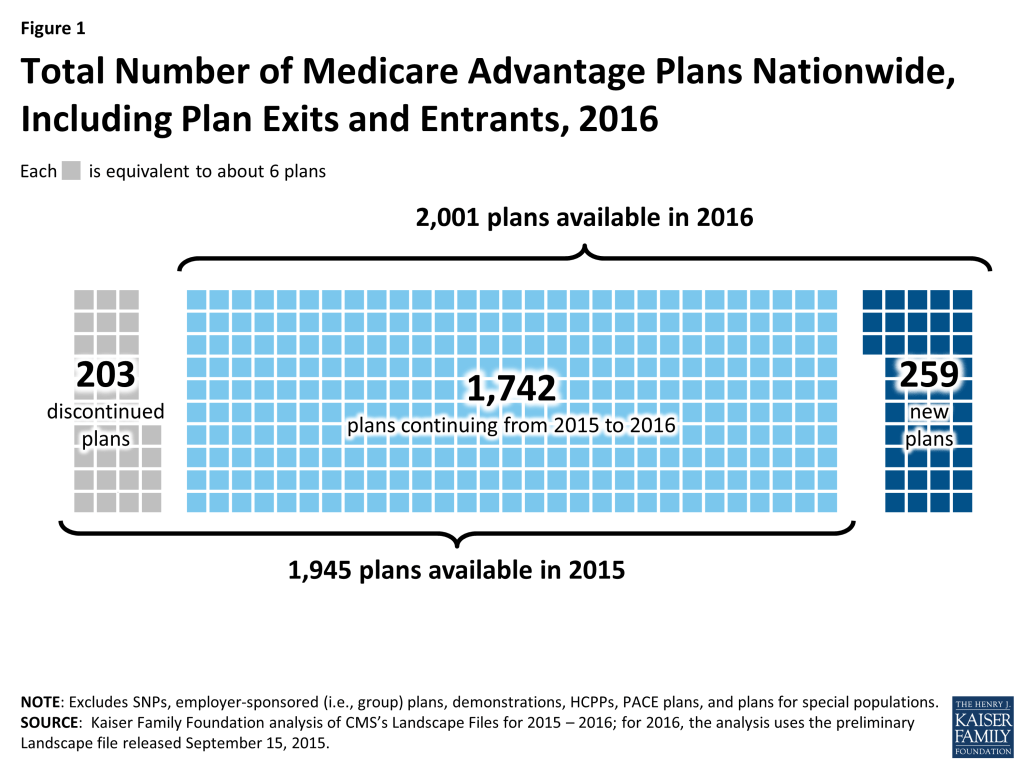
The total number of Medicare Advantage plans will be similar in 2016 to the number in 2015, increasing by 3 percent from 1,945 plans in 2015 to 2,001 plans in 2016 (Figure 1). The number of plans reflects both plan exits and entries. Between 2015 and 2016, fewer Medicare Advantage plans will exit than enter: 203 plans will exit markets across the country at the end of 2015 while 259 new plans will enter markets in 2016. The majority of plans that will be offered in 2016 (87%) were also available in 2015.
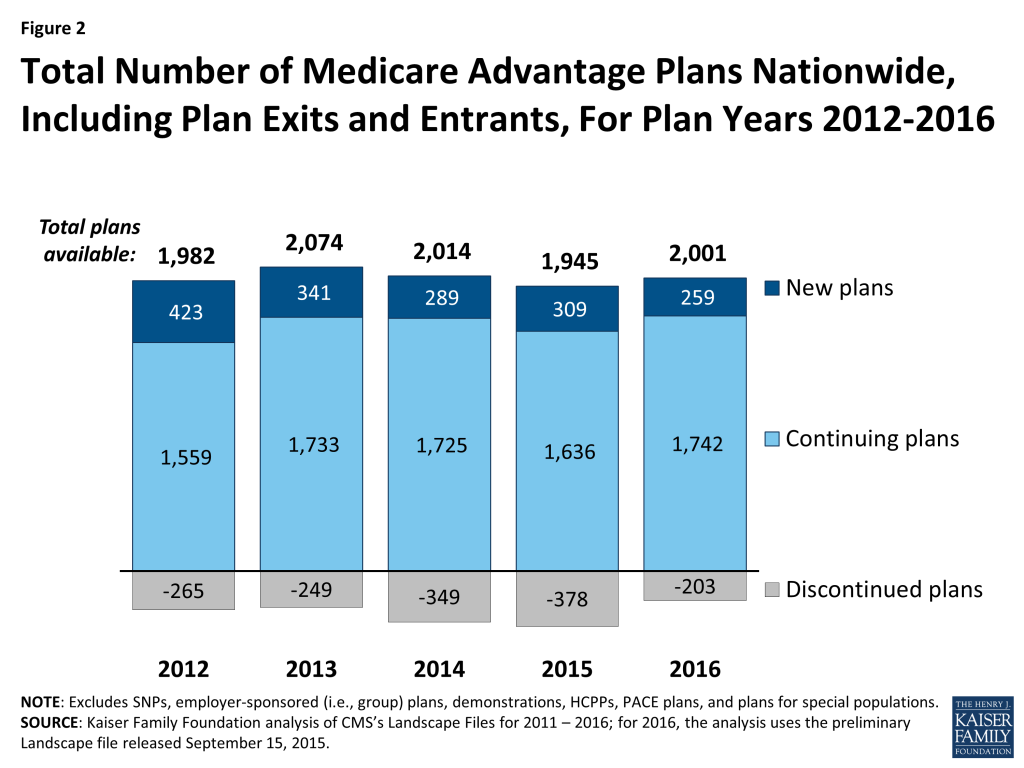
A smaller number of Medicare Advantage plans will exit the market in 2016 than in any year since 2012 (Figure 2). Similarly, a smaller number of plans will enter the market in 2016 than in any year since 2012.
By State
In 37 states and the District of Columbia, the total number of plans offered in 2016 will be greater than or equal to the number offered in 2015. In 13 states, the number of plans offered in 2016 will equal the number offered in 2015, including five states that will have no departing plans or new plans. Ohio and Washington will experience the largest net increase in the number of plans offered between 2015 and 2016 (15 plans and 12 plans, respectively). In the remaining 13 states and Puerto Rico, there will be fewer plans offered in 2016. Beneficiaries in two states (CA and NY) will see large numbers of both new plans and departing plans (20 or more) in 2016.
Plans per Beneficiary
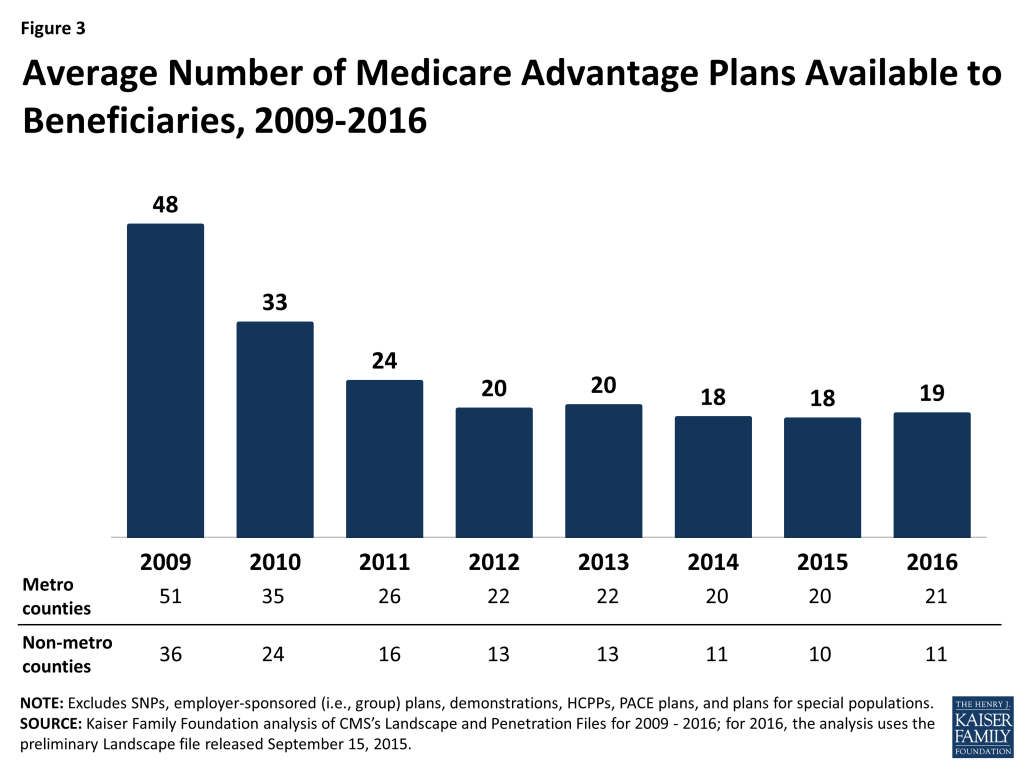
Medicare beneficiaries will be able to choose among 19 plans, on average, in 2016, a slight increase from the number available to beneficiaries in 2015 (Figure 3). Beneficiaries in metropolitan areas will be able to choose from 21 plans, on average, and beneficiaries in non-metropolitan areas will be able to choose from among 11 plans. Among the 19 Medicare Advantage plans available to the average beneficiary in 2016, 16 plans will offer Part D prescription drug coverage (MA-PDs).
New Firms
Several firms will offer Medicare Advantage plans for the first time in 2016. Some of these firms, such as Johns Hopkins, are led by local, established health care systems that have less experience as insurers. Other firms, such as Medical Mutual of Ohio, are large, established health insurers that are branching out to Medicare Advantage. Firms entering the Medicare Advantage market for the first time in 2016 will be offering plans in nine states (AR, FL, IA, KY, MD, MN, NC, OH, and OK). In four of these states (AR, IA, MD, and OK), the average Medicare Advantage penetration was less than 20 percent – far below the national average of 31 percent. Firms may perceive these states as ripe for Medicare Advantage enrollment growth.
Effect of Plan Exits on Enrollees
The vast majority of Medicare Advantage enrollees will not be affected by plans exiting the market in 2016. Three percent of Medicare Advantage enrollees (about 328,000 enrollees) are in plans that are exiting the market at the end of 2015 and will need to find an alternative source of Medicare coverage, either another Medicare Advantage plan or traditional Medicare (Appendix Table 1). At the end of 2014, a larger number (roughly 480,000 enrollees) and a slightly larger share (about 4%) of the Medicare Advantage population were affected by plan departures.4
The share of Medicare Advantage enrollees affected by plan departures ranges from less than 1 percent in 15 states, the District of Columbia, and Puerto Rico to more than 10 percent in 2 states (AL and WY). New York will have the largest number of enrollees in plans that will not be offered in 2016 (roughly 70,000 enrollees) – more than twice the number of enrollees in exiting plans in North Carolina (about 31,000 enrollees), the state with the second largest number of affected enrollees. However, in both of these states, the affected enrollees account for a relatively small share of the state’s total Medicare Advantage enrollment (9% and 8%, respectively). In two states (AL and WY), a larger share (14% and 13%, respectively) but smaller number (less than 25,000 and less than 300, respectively) of enrollees are in plans that will not be offered in 2016. In 18 states, the District of Columbia, and Puerto Rico, fewer than 1,000 people are enrolled in plans in 2015 that will not be offered in 2016.
Characteristics of Medicare Advantage Market Exits and Entries
Plan Type
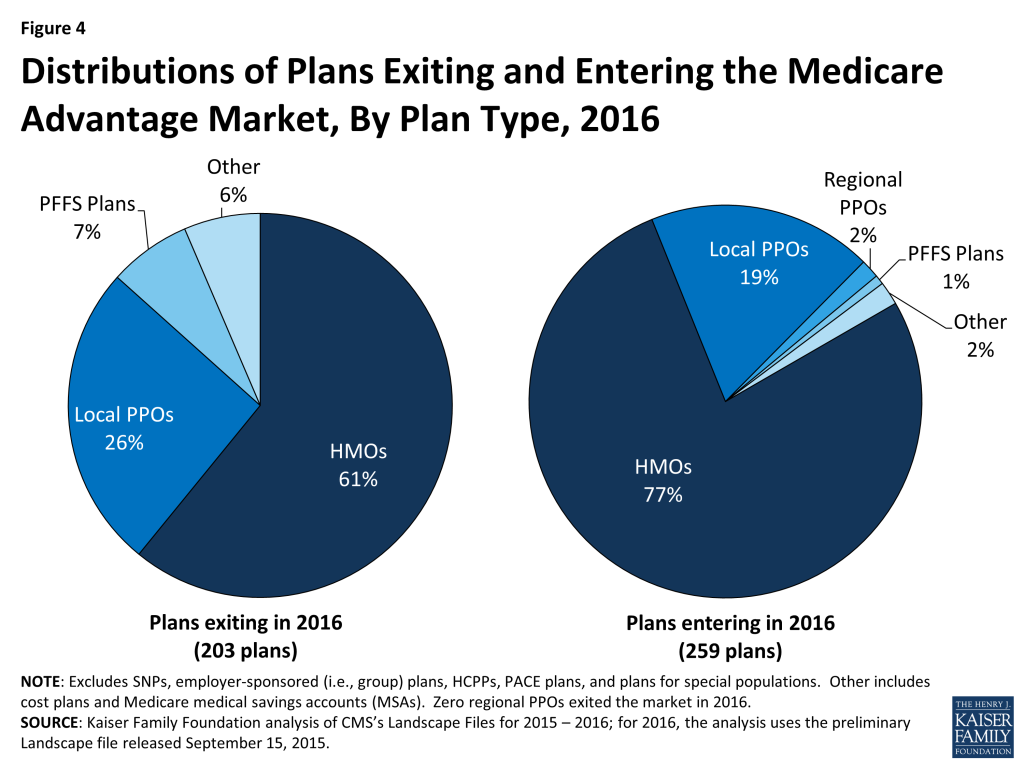
Among the relatively few plans exiting the Medicare Advantage market in 2016, most (61%) are HMOs and about one-quarter (26%) are local PPOs (Figure 4). These shares are similar to the overall composition of plan offerings in 2015. PFFS plans are somewhat overrepresented among departing plans. The reduction in PFFS plans available between 2015 and 2016 continues the trend in PFFS plan exits that has been observed since the enactment of the Medicare Improvements for Patients and Providers Act (MIPPA) of 2008, which required most PFFS plans to adopt provider networks. HMOs comprise the about three-fourths (77%) of the new plans that will be offered in 2016, but a somewhat smaller share (68%) of all Medicare Advantage plans offered in 2016 (Figure 4).
Tax Status
The majority of the 203 plans departing the market at the end of 2015 are for-profit plans (77%), a share which is similar to the proportion of available plans in 2015 that were for-profit (Appendix Table 2). Similarly, most new plans are for-profit plans (71%) in 2016.
Enrollment
Among the relatively small number of plans that are departing from the market (excluding those that consolidated into new plans) before 2016, most have relatively few enrollees in 2015. Nearly three-quarters (74%) have 1,000 or fewer enrollees, and more than half (59%) have fewer than 500 enrollees in 2015 (Figure 5; Appendix Table 3). The average number of enrollees in a plan available for general enrollment was 6,164 in 2015. This analysis excludes the plans that will consolidate into new plans, because the plans that are consolidating often have different enrollment levels in the various areas in which they serve, which cannot be separately analyzed.
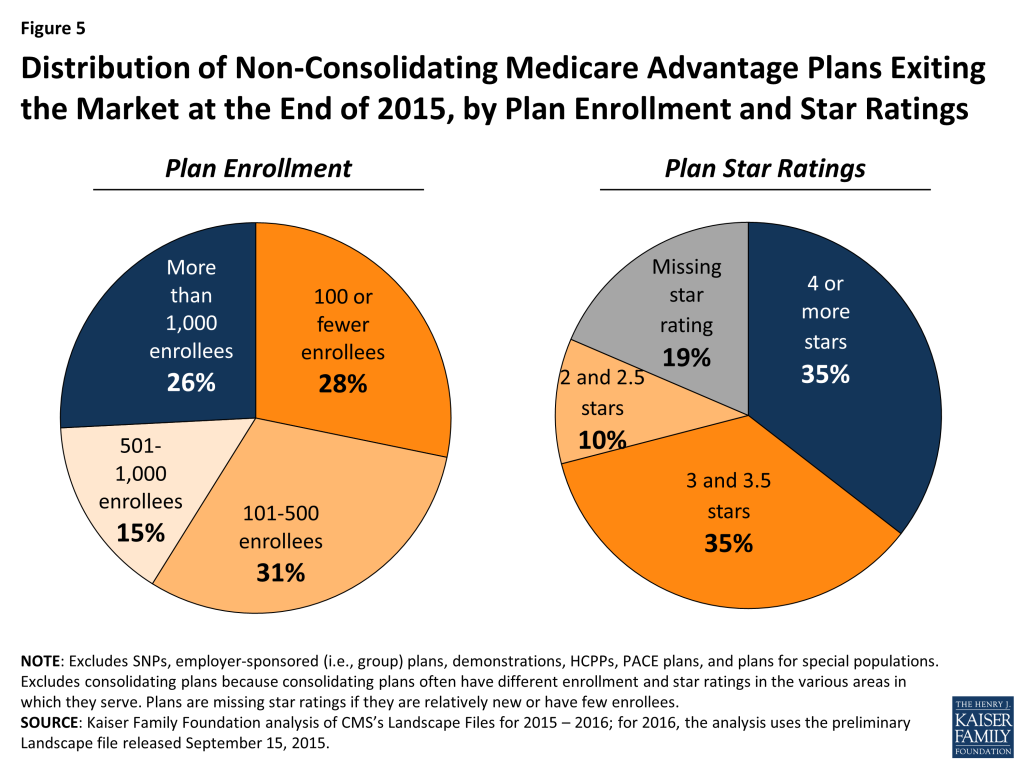
Quality Ratings
The majority of rated plans exiting the market at the end of 2015 have average or below average ratings (3.5 stars or fewer), or are missing star ratings (Figure 5). Plans with below average ratings (2 or 2.5 stars) represent a small share of all departing plans (13%), but among these plans with below average ratings, a disproportionate share (25%) is departing (Appendix Table 3). The departing plans that are missing star ratings never were rated because they were too new or had too few enrollees. This analysis excludes the plans that will consolidate into new plans, because the plans that are consolidating often have different star ratings in the various areas in which they serve, which cannot be separately analyzed.
Discussion
More Medicare Advantage plans will be offered in 2016 than in 2015, nationally and in many states, with the fewest market exits in any year since 2012. The vast majority of plans that were available in 2015 will continue to be available in 2016. Among the 203 plans (10% of plans) exiting the market, most had relatively low enrollment. Overall, 3 percent of all Medicare Advantage enrollees are in plans in 2015 that will not be offered in 2016. In all likelihood, beneficiaries affected by plan exits will have other Medicare Advantage options available, including new plans vying for beneficiaries, in addition to traditional Medicare.
Gretchen Jacobson and Tricia Neuman are with the Kaiser Family Foundation; and Anthony Damico is an independent consultant.
Appendix
| Appendix Table 1: Plan Entries and Exits in the Medicare Advantage Market, 2015-2016 | |||||||
| State | Total plans in 2015 | Plans departingby January 2016 | Plans continuing (post-consolidation) in 2016 | New plans in 2016 | Total plans in 2016 | Number of 2015 market enrollees in departing plans | Percent of 2015 market enrollees in departing plans |
| Total U.S. | 1945 | 203 | 1742 | 259 | 2001 | 327,787 | 3% |
| Alabama | 25 | 1 | 24 | 4 | 28 | 24,665 | 14% |
| Alaska | 0 | 0 | 0 | 0 | 0 | – | N/A |
| Arizona | 41 | 8 | 33 | 5 | 38 | 15,433 | 5% |
| Arkansas | 28 | 3 | 25 | 2 | 27 | 173 | 0% |
| California | 202 | 24 | 178 | 20 | 198 | 28,610 | 2% |
| Colorado | 50 | 3 | 47 | 1 | 48 | 2,586 | 1% |
| Connecticut | 23 | 1 | 22 | 1 | 23 | 2,530 | 2% |
| Delaware | 6 | 1 | 5 | 3 | 8 | 490 | 6% |
| District of Columbia | 11 | 0 | 11 | 1 | 12 | – | 0% |
| Florida | 154 | 22 | 132 | 15 | 147 | 18,630 | 2% |
| Georgia | 32 | 5 | 27 | 5 | 32 | 14,331 | 6% |
| Hawaii | 14 | 1 | 13 | 0 | 13 | 2,431 | 4% |
| Idaho | 38 | 1 | 37 | 1 | 38 | 3,973 | 5% |
| Illinois | 68 | 4 | 64 | 4 | 68 | 3,573 | 2% |
| Indiana | 40 | 5 | 35 | 13 | 48 | 11,832 | 5% |
| Iowa | 32 | 5 | 27 | 2 | 29 | 1,651 | 2% |
| Kansas | 31 | 2 | 29 | 4 | 33 | 200 | 0% |
| Kentucky | 35 | 1 | 34 | 8 | 42 | – | 0% |
| Louisiana | 31 | 2 | 29 | 5 | 34 | 1,021 | 1% |
| Maine | 32 | 3 | 29 | 7 | 36 | 3,458 | 6% |
| Maryland | 15 | 2 | 13 | 6 | 19 | 2,914 | 7% |
| Massachusetts | 46 | 2 | 44 | 4 | 48 | 579 | 0% |
| Michigan | 56 | 6 | 50 | 3 | 53 | 3,910 | 1% |
| Minnesota | 33 | 1 | 32 | 4 | 36 | – | 0% |
| Mississippi | 17 | 1 | 16 | 0 | 16 | 143 | 0% |
| Missouri | 46 | 3 | 43 | 5 | 48 | 7,443 | 3% |
| Montana | 13 | 1 | 12 | 2 | 14 | 950 | 3% |
| Nebraska | 16 | 1 | 15 | 1 | 16 | 1,291 | 4% |
| Nevada | 26 | 3 | 23 | 1 | 24 | 1,415 | 1% |
| New Hampshire | 10 | 0 | 10 | 4 | 14 | – | 0% |
| New Jersey | 38 | 2 | 36 | 5 | 41 | 635 | 0% |
| New Mexico | 22 | 4 | 18 | 0 | 18 | 3,174 | 4% |
| New York | 161 | 24 | 137 | 30 | 167 | 69,710 | 9% |
| North Carolina | 36 | 5 | 31 | 3 | 34 | 30,995 | 8% |
| North Dakota | 10 | 0 | 10 | 0 | 10 | – | 0% |
| Ohio | 89 | 5 | 84 | 20 | 104 | 1,949 | 0% |
| Oklahoma | 35 | 2 | 33 | 6 | 39 | 248 | 0% |
| Oregon | 82 | 6 | 76 | 0 | 76 | 4,623 | 2% |
| Pennsylvania | 118 | 10 | 108 | 14 | 122 | 13,518 | 2% |
| Puerto Rico | 28 | 9 | 19 | 8 | 27 | 747 | 0% |
| Rhode Island | 11 | 0 | 11 | 0 | 11 | – | 0% |
| South Carolina | 20 | 0 | 20 | 0 | 20 | 66 | 0% |
| South Dakota | 13 | 0 | 13 | 1 | 14 | – | 0% |
| Tennessee | 55 | 3 | 52 | 3 | 55 | 3,938 | 1% |
| Texas | 119 | 19 | 100 | 24 | 124 | 11,514 | 2% |
| Utah | 16 | 0 | 16 | 2 | 18 | 1,314 | 1% |
| Vermont | 7 | 0 | 7 | 0 | 7 | 557 | 8% |
| Virginia | 61 | 3 | 58 | 3 | 61 | 3,195 | 2% |
| Washington | 63 | 2 | 61 | 14 | 75 | 15,287 | 5% |
| West Virginia | 20 | 2 | 18 | 3 | 21 | 1,159 | 3% |
| Wisconsin | 50 | 3 | 47 | 8 | 55 | 10,723 | 3% |
| Wyoming | 3 | 1 | 2 | 1 | 3 | 203 | 13% |
| NOTE: Columns do not sum to the Total U.S. due to plans offered in more than one state. Plans with service area reductions were categorized as departing plans in states in which they will no longer operate, as continuing plans in states in which they will continue to operate, and as new plans in states in which they will operate for the first time. Plan counts and enrollment excludes SNPs, employer-sponsored (i.e., group) plans, demonstrations, HCPPs, PACE plans, and plans for special populations. New plans include plans that previously operated in some states and will be offered for the first time in other states in 2016.SOURCE: Kaiser Family Foundation analysis of CMS’s Landscape Files for 2015 – 2016; for 2016, the analysis uses the preliminary Landscape file released September 15, 2015. | |||||||
| Appendix Table 2: Plan Type and Tax Status of Discontinued and New Plans in 2015 and 2016 | |||||||
| Total number of plans in 2015 | Plans departing by January 2016 | Plans continuing in 2016 | New plans in 2016 | Total number of plans in 2016 | |||
| Number | Percent of total plans in 2015 | Number | Percent of total plans in 2016 | ||||
| Total | 1945 | 203 | 10% | 1742 | 259 | 13% | 2,001 |
| Plan Type | |||||||
| HMOs | 1,275 | 124 | 10% | 1,151 | 200 | 15% | 1,351 |
| Local PPOs | 465 | 52 | 11% | 413 | 48 | 10% | 461 |
| Regional PPOs | 43 | 0 | 0% | 43 | 4 | 9% | 47 |
| PFFS plans | 69 | 14 | 20% | 55 | 2 | 4% | 57 |
| Cost plans | 86 | 7 | 8% | 79 | 2 | 2% | 81 |
| MSA plans | 7 | 6 | 86% | 1 | 3 | 75% | 4 |
| Tax Status | |||||||
| Not-for-profit | 588 | 42 | 7% | 546 | 31 | 5% | 577 |
| For-profit | 1,353 | 157 | 12% | 1,196 | 184 | 13% | 1,380 |
| Unknown tax status | 4 | 4 | 100% | 0 | 44 | 100% | 44 |
| NOTE: Excludes SNPs, employer-sponsored (i.e., group) plans, demonstrations, HCPPs, PACE plans, and plans for special populations.SOURCE: Kaiser Family Foundation analysis of CMS’s Landscape Files for 2015 – 2016; for 2016, the analysis uses the preliminary Landscape file released September 15, 2015. | |||||||
| Appendix Table 3: Enrollment and Ratings of Discontinued Plans in 2015 and 2016 | |||
| Total number of plans in 2015 | Plans departing by January 2016 | ||
| Number | Percent of total plans in 2015 | ||
| Total | 1,945 | 203 | 10% |
| Consolidating Plans | n/a | 78 | n/a |
| Non-consolidating, departing plans | n/a | 125 | n/a |
| Number of Enrollees, Among Non-Consolidating Plans | |||
| 100 or fewer enrollees | 166 | 35 | 21% |
| 101-500 | 289 | 39 | 13% |
| 501-1000 | 216 | 19 | 9% |
| 1001+ | 1,274 | 32 | 3% |
| Star Rating, Among Non-Consolidating Plans | |||
| 4 or more stars | 1,059 | 44 | 4% |
| 3 and 3.5 stars | 580 | 44 | 8% |
| 2 and 2.5 stars | 52 | 13 | 25% |
| Missing star rating | 254 | 24 | 9% |
| NOTE: Excludes SNPs, employer-sponsored (i.e., group) plans, demonstrations, HCPPs, PACE plans, and plans for special populations. Consolidated plans were excluded from this analysis because they often have different enrollment levels and star ratings in the various areas in which they serve, which cannot be analyzed separately. Plans that are relatively new or have few enrollees are not rated and thus are missing star ratings. n/a denotes cells not applicable.SOURCE: Kaiser Family Foundation analysis of CMS’s Landscape Files for 2015 – 2016; for 2016, the analysis uses the preliminary Landscape file released September 15, 2015. | |||
Endnotes
- Gretchen Jacobson, Anthony Damico, Tricia Neuman, and Marsha Gold. Medicare Advantage 2015 Spotlight: Enrollment Market Update. Menlo Park (CA): 2015. https://modern.kff.org/medicare/issue-brief/medicare-advantage-2015-spotlight-enrollment-market-update/ ↩︎
- Gretchen Jacobson, Anthony Damico, Tricia Neuman, and Marsha Gold. Medicare Advantage 2015 Data Spotlight: Overview of Plan Changes. Menlo Park (CA): 2014. https://modern.kff.org/medicare/issue-brief/medicare-advantage-2015-data-spotlight-overview-of-plan-changes/ ↩︎
- Plans that consolidate or withdraw from the certain counties, but remain in others, are counted among the exiting plans for areas where they will no longer offer plans in 2016. ↩︎
- Gretchen Jacobson, Tricia Neuman, and Anthony Damico. What’s In and What’s Out? Medicare Advantage Market Entries and Exits in 2015. Menlo Park (CA): 2014. https://modern.kff.org/medicare/issue-brief/whats-in-and-whats-out-medicare-advantage-market-entries-and-exits-for-2015/ ↩︎