How Much More Than Medicare Do Private Insurers Pay? A Review of the Literature
Issue Brief
With millions expected to be hospitalized during the COVID-19 pandemic, the U.S. health care system will be tested as it never has been before. In response, Congress has passed the Coronavirus Aid, Relief, and Economic Security (CARES) Act, which allocates $100 billion in assistance for hospitals and other health care providers. The Trump administration has signaled that it will use some of these funds to reimburse hospitals for treating uninsured COVID-19 patients at Medicare payment rates, which the CARES act also increased by 20% for COVID-19 treatment during the crisis. However, some have raised concerns that even these increased Medicare rates may not be sufficient.
Prior to the outbreak, national and state-level policymakers were already debating several proposals that would build on Medicare’s payment structure – including Medicare-for-All and various public option proposals – to establish standardized rates for hospitals, physicians, and other health care providers. While supporters point to potential coverage gains and reductions in national health spending, critics contend that bringing private insurer payments closer to Medicare rates could threaten providers’ financial viability. Once the U.S. overcomes the immediate public health emergency, attention will likely return to underlying questions regarding provider payments, as well as their impact on health expenditures and out-of-pocket costs. To inform both discussions, this issue brief reviews the findings of 19 recent studies comparing Medicare and private health insurance payment rates for hospital care and physician services.
Key Findings
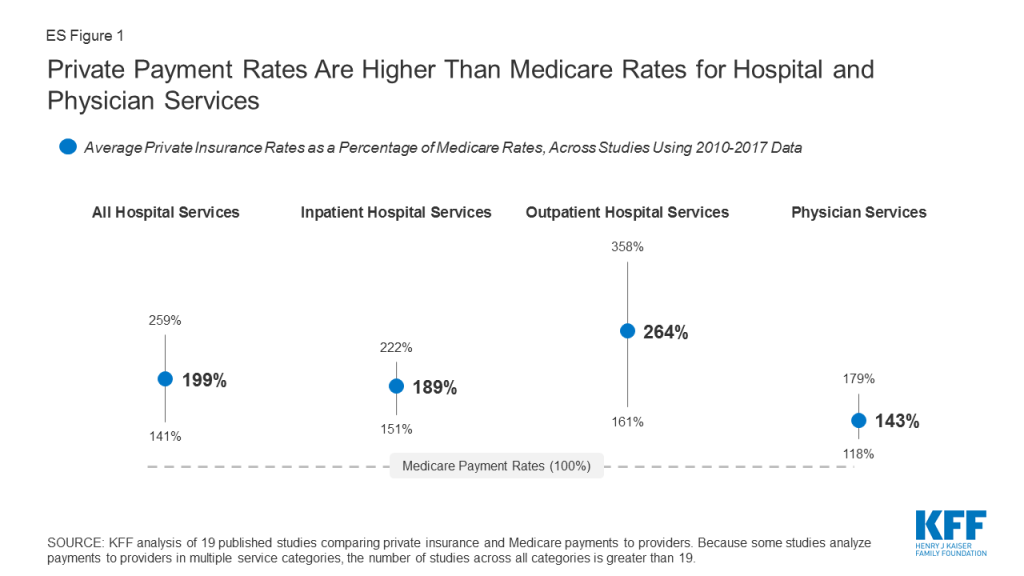
- Private insurers paid nearly double Medicare rates for all hospital services (199% of Medicare rates, on average), ranging from 141% to 259% of Medicare rates across the reviewed studies.
- The difference between private and Medicare rates was greater for outpatient than inpatient hospital services, which averaged 264% and 189% of Medicare rates overall, respectively.
- For physician services, private insurance paid 143% of Medicare rates, on average, ranging from 118% to 179% of Medicare rates across studies.
Across all studies, payments from private insurers are much higher than Medicare payments for both hospital and physician services, although the magnitude of the difference varies (ES Figure 1). Differences across studies may be due to a number of factors, including the representativeness of hospitals, physicians, and insurers used in the analysis, the data collection period, and the characteristics of the markets examined by each study, with some studies focusing on highly consolidated health care markets where providers have stronger negotiating leverage over insurers. (For study descriptions, see the Appendix Table).
Policymakers and analysts continue to debate whether relatively high payments from private payers are necessary to compensate for lower Medicare payments, and the extent to which providers could operate more efficiently to reduce costs. If provider payments were phased down closer to Medicare levels, providers would have stronger incentives to become more efficient, which could help make health coverage and care more affordable for patients and employers. However, even some relatively efficient providers appear to have been be losing money on Medicare patients over the past few years, prompting some leading public option and Medicare for all proposals to set hospital payments somewhat above current Medicare rates. While providers may be able to operate more efficiently than they do today, a transition period may be needed to give providers and payers time to adapt to lower payments, and to assess the potential implications for the quality and accessibility of care.
Background
Health care spending in the United States is high and growing faster than the economy. In 2018, health expenditures accounted for 17.7% of the national gross domestic product (GDP), and are projected to grow to a fifth of the national GDP by 2027.1 Several recent health reform proposals aim to reduce future spending on health care while also expanding coverage to the nearly 28 million Americans who remain uninsured, and providing a more affordable source of coverage for people who struggle to pay their premiums.2 Some have argued that these goals can be achieved by aligning provider payments more closely with Medicare rates, whether in a public program, like Medicare-for-All, a national or state-based public option, or through state rate-setting initiatives.3 ,4 ,5 ,6 ,7 ,8 9 ,10 ,11
Moreover, the global COVID-19 pandemic has heightened the urgency surrounding Medicare provider payments. In response to rising financial strain on hospitals during the crisis, Congress passed the Coronavirus Aid, Relief, and Economic Security (CARES) Act, which allocates $100 billion to assist hospitals and other providers. The Trump administration has signaled that it will use some of this funding to reimburse hospitals for treating uninsured COVID-19 patients at Medicare payment rates. Additionally, the CARES Act temporarily suspended 2% Medicare payment reductions that had been mandated under federal sequestration, and increased Medicare rates for COVID-19 hospitalizations by 20% during the legislation’s emergency period.12 However, some have raised concerns that even these payments may not be sufficient, and that hospitals’ financial viability will become increasingly tenuous throughout the crisis.13 Thus, these two debates over the adequacy of Medicare’s payment structure – to meet the needs of the pandemic response in the short term, and to serve as a basis for broader national or state-level health reform in the long term – merit a close look at how Medicare provider payments fit into the broader U.S. health insurance system.
Private insurers currently play a dominant role in the U.S. In 2018, private insurance accounted for more than 40% of expenditures on both hospital care and physician services. In comparison, Medicare accounted for about one quarter of these expenditures in the same year.14 Consequently, adjustments to private insurers’ provider payment rates could have a profound impact on providers’ revenues, employers’ and privately insured Americans’ health spending, and national health spending overall.
Over the years, Medicare has adopted a number of payment systems to manage Medicare spending and encourage providers to operate more efficiently, which in turn has helped slow the growth in premiums and other costs for beneficiaries. For example, Medicare adopted its prospective payment system in 1983, which sets payment rates for hospitals in advance based on categories of hospital services known as diagnosis-related groups (DRGs). These payments are updated periodically to account for changes in providers’ operating costs, and are adjusted for factors such as direct and indirect expenses for graduate medical education (DGME and IME payments) and whether a disproportionate share of a hospitals’ patients are Medicare beneficiaries (DSH payments).15 Since then, policymakers have made numerous modifications to this methodology, including a change adopted by the ACA in 2010 that adjusts annual updates in Medicare payments to hospitals for assumed productivity increases, resulting in lower payment rates and significant savings for Medicare.16 Medicare has also adopted a number of specific payment systems for virtually every type of health care provider, building in incentives for providers to become more financially efficient.
By contrast, private insurers’ payment rates are typically determined through negotiations with providers, and so vary depending on market conditions, such as the bargaining power of individual providers relative to insurers in a community. Accordingly, Medicare has been able to limit growth in expenditures per enrollee more effectively than private insurers at several points in recent decades.17 ,18
Proponents of proposals to broaden the use of Medicare rates, or to use a multiplier of Medicare rates as a benchmark, say that such an approach would help make expanding coverage more affordable and reduce excess costs in the U.S. health care system. In an effort to broaden coverage through an affordable public option, Washington State recently adopted a proposal to establish a public option that would set payments at 160% of Medicare rates, and other states – most notably Colorado, which is also considering a public option with payments set at a percentage of Medicare rates – may soon follow Washington’s lead.19 ,20 Rate-setting programs in Maryland and Vermont do not tie provider payments to an explicit percentage of Medicare rates, but rather their “all-payer” programs allow their respective state governments to set payment rates for hospitals (in Maryland) and for providers in participating Accountable Care Organizations (in Vermont), and have achieved savings on state-level health expenditures by some measures.21
However, some have raised concerns that Medicare payments are not keeping pace with provider costs. For example, following the enactment of productivity adjustments to hospital payments in the ACA of 2010, and further reductions under the Budget Control Act of 2011, the Department of Health and Human Services (HHS) actuaries warned that the reductions in payments could eventually make it difficult for hospitals to operate profitably – a concern amplified by the hospital industry.22 ,23 Similar red flags were raised with respect to the formula set in law for physician payments, known as the Sustainable Growth Rate, or SGR, which Congress modified repeatedly to avoid annual reductions in Medicare payments. The SGR was ultimately repealed, but left in its wake some concern that future payments would not keep pace with practice costs.24 Citing these issues, some have argued that the financial strain imposed by lower payment rates may render many hospitals and physician practices unsustainable, jeopardizing patient care.25 ,26 Ultimately, the capacity of providers to operate successfully would likely depend on the magnitude of the gap between private and Medicare rates, and other factors such as how effectively and quickly they are able to respond to reduced payments by improving their efficiency.
To bring together available evidence on these issues, this brief first reviews recent studies comparing private insurers’ and Medicare’s provider payment rates, focusing on studies that examine hospital services and physician services over the period from 2010 to 2017. We summarize the results of studies examining payments for hospital and physician services, and explore methodological factors that may explain variation in estimates across studies. Finally, we review available literature comparing hospitals’ and physician practices’ costs to Medicare payments, and discuss the potential implications of bringing provider payments closer to Medicare rates.
Medicare vs. Private Insurance Rates: Literature Review
This brief reviews findings from studies that compare Medicare and private insurance rates for hospital and physician services. We include studies with data from 2010 onward to reflect changes to Medicare provider payment rates established by the Affordable Care Act, and subsequent policy adjustments over the past decade. We identified 19 relevant studies through keyword searches of academic search engines, as well as the websites of governmental, research, and policy organizations that publish work related to health care and health economics. These studies analyze data reported by the Centers for Medicare and Medicaid Services, private insurers, hospitals, and physician practices.
Of these 19 studies, 14 addressed payments to hospitals, eight of which addressed payments for inpatient hospital services, five addressed payments for outpatient services, and seven reported relative payment rates for both types of hospital services combined, with some overlap across studies. Eight studies addressed payment rates for physician services. The full search methodology is described in the Methods section.
To compare findings across multiple studies, we focus on private insurance payments as a percentage of corresponding Medicare payment rates reported by each study. We calculate the average across all studies, by provider category, such as inpatient hospital care. Due to the relatively small number of studies available, our calculation of an overall average gives each study equal weight, recognizing that each varies substantially in methods, data sources, the number and representativeness of providers and payers examined, and geographic focus (e.g., some studies are based on national data while others are state-specific).
For studies that report private-to-Medicare payment rate ratios for multiple years, we calculate an average across years to create one estimate used for the cross-study average. These included studies by the American Hospital Association (AHA), the Colorado Department of Health Care Policy and Financing (DHCPF), White and Whaley’s 2019 study, and two studies by Selden and colleagues published in 2015 and 2020, respectively. This approach prevents disproportionate weighting of results from studies that reported rates for multiple years. Moreover, we do not weight studies differently based on factors such as their geographic scope; studies that examined nationwide provider markets are given equal weight to those that focused on rates for provider in selected states or smaller markets, which may skew overall averages toward the prevailing private-to-Medicare payment ratios in these particular markets. (See the Appendix Table for methodological details for each study).
INPATIENT AND OUTPATIENT HOSPITAL SERVICES (COMBINED)
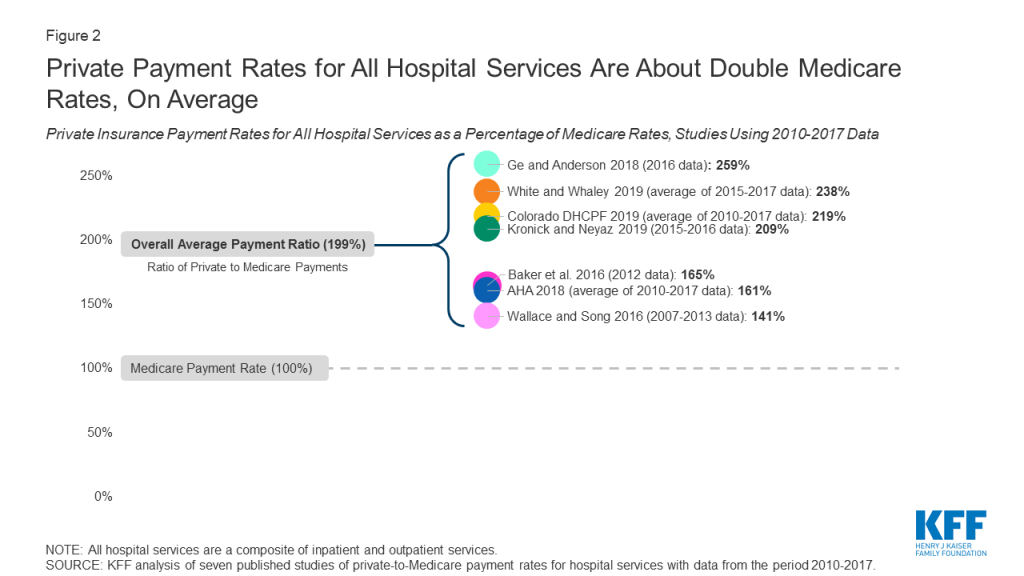
Of the eleven studies that examined differences between Medicare and private insurance rates for hospitals, seven did not distinguish between inpatient and outpatient hospital services. Across these seven studies, private insurance rates for inpatient and outpatient hospital services averaged 199% of Medicare rates, but the results varied widely, ranging from 141% (Wallace and Song, using nationwide data) to 259% (Ge and Anderson, using data specific to hospitals in Florida, which the authors note are disproportionately private, for-profit hospitals) of Medicare levels (Figure 2). However, the variation within studies was often substantially wider, as the ratio of private-to-Medicare rates often differed dramatically across markets, services, and even individual hospitals. The greatest variation was observed in Ge and Anderson’s study of Florida hospitals, which found private insurance payments ranging from 170% to over 1400% across Hospital Referral Regions (HRRs) in the state. White and Whaley’s multi-state analysis also found notably large variation at the level of individual hospitals, ranging from approximately 150% to 450% of Medicare rates for the composite of inpatient and outpatient services. These findings suggest that, even within a given health care market, some individual hospitals may be outliers in that they can command extremely high private reimbursements.
INPATIENT HOSPITAL SERVICES
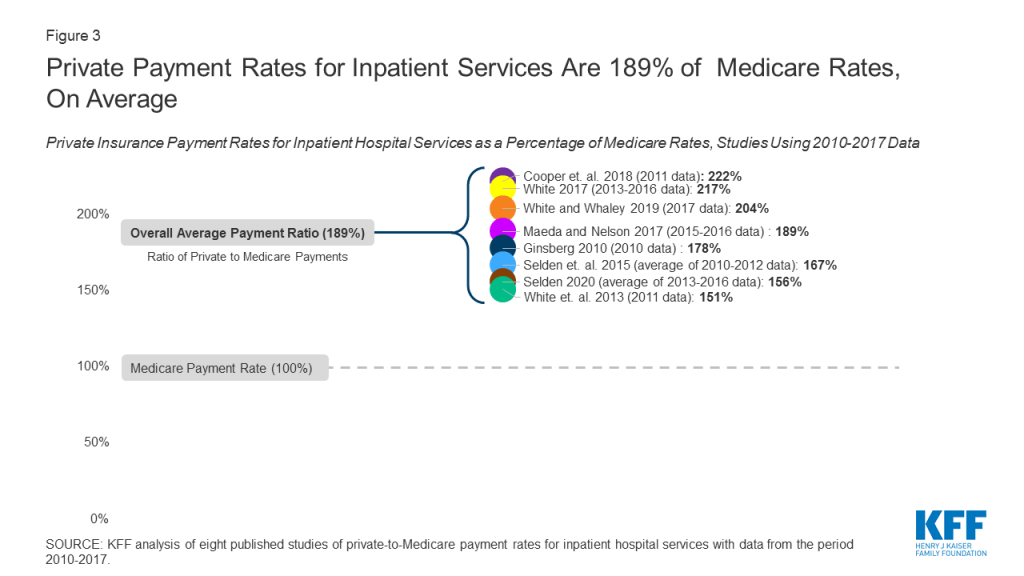
Eight studies compared private insurance and Medicare payment rates for inpatient hospital services. Private insurance payment rates for inpatient hospital services averaged 189% of Medicare rates across studies, ranging from 150% (White and colleagues, 2013 analysis) to 222% (Cooper and colleagues, 2018) (Figure 3). Within studies, the greatest variation was seen in White and Whaley’s analysis, which reported private-to-Medicare payment ratios for inpatient hospital services ranging from 34% to 581% across individual hospital systems. This range was comparable to the variation seen across specific inpatient services in Cooper and colleagues’ study, which ranged from 161% for vaginal deliveries to 400% for lower extremity MRI, as well as the range of 84% to 484% across markets reported by Ginsburg.
As with the analysis combining inpatient and outpatient services, we averaged estimates for each year in studies that present multiple years of results based on the same methodology and data source. In keeping with this approach, we also averaged results from the 2015 and 2020 studies published by Selden and colleagues, as both studies intentionally used the same data source and methodology.
There is notably less variation in the ratio of private-to-Medicare payments among studies of inpatient hospital payments than studies that examine rates for all hospital services combined, as may be expected since the range of services represented is narrower.
OUTPATIENT HOSPITAL SERVICES
Five of the reviewed studies examined the difference between private insurance rates and Medicare rates for outpatient hospital services. Across these studies, the ratio of private-to-Medicare payment rates fluctuated more than they did for combined hospital services or for inpatient hospital services. Results ranged from a low of 150% of Medicare rates in the final year of Selden’s 2020 study of hospitals nationwide to a high of 358% in White’s 2017 study of Indiana hospitals (Figure 4), averaging 264% of Medicare rates overall. Within studies, the greatest variation was seen in White and Whaley’s analysis, in which private-to-Medicare payment ratios for outpatient services ranged from 50% to as high as 2958%. Notably, Ginsburg also reported a wide range across major metropolitan markets from 158% to 718% of Medicare rates, and Cooper reported a range of 171% to 496% across specific outpatient services.

The relatively high private-to-Medicare payment ratio reported by White’s 2017 study (358%) is partly attributable to the fact that the analysis was limited to hospitals in Indiana, which, according to White and Whaley in their 2019 multi-state follow-up study, has exceptionally high degree of hospital consolidation compared to other state hospital markets. If this one study is excluded, the overall average for outpatient hospital services drops from 264% to 240% of Medicare payment rates.
FACTORS ASSOCIATED WITH VARIATION ACROSS STUDIES OF HOSPITAL RATES
Several factors may contribute to variations in estimates across studies, including: the representativeness of hospitals and private insurers; the relative market power of hospitals and insurers in the markets included in the analysis; the types of hospital services examined; the components of private insurance and Medicare payments used to calculate their respective payment rates; and the treatment of out-of-network payments. These factors are described in greater detail below and in the Appendix Table.
- Hospital and Insurer Market Power. The gap between Medicare and private insurance rates in a given market is a function of the market power of hospitals relative to that of local insurers, as hospitals or hospital systems with more negotiating leverage can generally obtain higher payment rates from insurers.27 ,28 ,29 ,30 ,31 Studies using data from markets in which hospitals exhibited a relatively high degree of market concentration tended to report higher private insurance payment rates relative to Medicare rates, such as White’s 2017 analysis of hospitals in Indiana, which White and Whaley attribute to the statewide dominance of six large hospital systems in their multi-state follow-up study.32 ,33 A similar pattern was observed in studies that looked at several different hospital markets. Ginsburg notes that the private-to-Medicare payment ratio was highest in cities with greater hospital concentration (e.g., San Francisco and Richmond) for both inpatient and outpatient hospital services, and White and Whaley report a similar trend across state-level hospital markets.34 ,35 .Conversely, studies in which private insurers had greater market power tended to report lower private insurance payment rates relative to Medicare rates. For example, the 2013 analysis by White and colleagues was limited to hospitals in Michigan, which White and Whaley found to have the lowest average hospital prices across all services among the states included in their 2019 analysis. The authors attribute this to the outsized market share of Blue Cross Blue Shield of Michigan in the statewide insurance market, which, according to the authors, gives this insurer exceptionally strong negotiating power over Michigan hospitals.36 ,37
- Hospital Type. The reviewed studies differ in the extent to which they are representative of all hospitals, which is likely to affect the ratio of private payments to Medicare rates. For example, Ge and Anderson limit their analysis to private, short-term hospitals in Florida, which the authors note has an exceptionally high proportion of for-profit hospitals compared to the national average, potentially contributing to relatively high private insurance payments relative to Medicare rates.38 In contrast, the American Hospital Association (AHA) analyses are based on a data reported by over six thousand hospitals nationwide, including academic medical centers, community hospitals, and non-profit hospitals, which may explain the lower estimates of the private-to-Medicare hospital payment ratio than for-profit hospitals.39
- Selection of Insurers. Without comparable, nationally representative private insurance payment data to compare to Medicare payment rates, some researchers have relied on convenience samples to compare the rates paid by private insurers and Medicare. Several studies, for example, use data from only a few large private insurers, which captures payments for a large share of private patients, but excludes payment rates from other insurers who may have less market power. Studies by Baker and colleagues, Cooper and colleagues, and Maeda and Nelson analyze claims provided by the Health Care Cost Institute (HCCI) for three large private insurers (UnitedHealthcare, Humana, and Aetna), and Ginsburg uses data from four payers.40 ,41 ,42 .In contrast, Wallace and Song use a claims database in which over 300 private payers are represented, reflecting a more diverse array of insurance markets across the U.S.43 Other authors use data from state all-payer claims databases or state hospital financial reports, which encompass private payments for hospital care across all commercial insurers and other private plans.
- Types of Hospital Services. The types of hospital services examined by each study may also affect the ratio of private insurance to Medicare payment rates, particularly when either procedural services or routine evaluation and management services are disproportionately represented. For example, Wallace and Song limit their analysis to services for which cost-sharing components for patients are roughly comparable across both Medicare and private insurers, leading them to focus on imaging services and surgical procedures.44 Given the concern of the Medicare Payment Advisory Commission (MedPAC) that these services are reimbursed at disproportionally higher rates by Medicare than routine evaluation and management services, this approach may skew estimated Medicare rates upward and reduce the ratio of private-to-Medicare payments.45 In contrast, studies such as White and Whaley’s analysis that include a higher proportion of claims for non-procedural services likely generate lower estimates of Medicare rates.
- Payment Components. While nearly all of the studies calculate private insurance and Medicare payment rates directly from claim reimbursement or hospital payment amounts, studies varied in the types of payments that were included in these amounts. This is particularly important in the estimation of Medicare payment rates due to the variety of hospital payments allowed under the Medicare Prospective Payment System, such as those for hospitals with IME expenses or DSH status.46 ,47 Baker and colleagues include the majority of these categories of additional Medicare payments, including outlier case payments and one-time payments for capital, which are excluded in most other studies, which as might be expected, contributes to a relatively low ratio of private-to-Medicare payment rates.48 .By contrast, the analysis by Kronick and Neyaz relies on cost and charge data reported at the level of specific hospital units (e.g., diagnostic radiology, surgical intensive care, labor and delivery, etc.), and so excludes Medicare payments that cannot be solely attributed to them, such as those for IME.49 Other studies simulate the amounts that Medicare would have paid for the same hospital services reflected in their private claims data. When actual Medicare payment data are used, payment components that are associated with specific claims (such as those for direct medical education and geographic adjustments) are included in the reported rates, which may cause Medicare payments to appear higher relative to private insurance rates..Conversely, simulating Medicare rates based only on claim-level information may result in lower estimates of Medicare payments if some of these payment components are excluded (as in the Maeda and Nelson’s analysis, which excluded IME payments), though the three analyses by White and colleagues address this by simulating these additional payments as well.50 ,51 ,52 ,53 .The reviewed studies vary in the payments they incorporate into their calculations of private insurance rates as well. For example, the AHA estimates are based on payment-to-cost ratios for hospital stays for each payer category, which, for private payments, includes stays that were paid by patients out-of-pocket without contributions from insurers.54 As Selden and colleagues note in their 2015 analysis, if hospitals do not ultimately collect as much from uninsured patients as they do from patients with private insurance, this approach would reduce estimates of average private payments, and could explain why the private-to-Medicare payment ratios derived from AHA data are lower than the overall average.55 ..Selden and colleagues’ 2015 analysis and 2020 follow-up study incorporate some payments by Medicare Advantage plans in their calculation of Medicare rates.56 ,57 However, available evidence suggests that Medicare Advantage payment rates are comparable to those paid by traditional Medicare for hospital services, so the effect of including these payments is likely minimal.58 ,59
- Out-of-Network Claims. The proportion of out-of-network claims included in each analysis may also affect private insurance rates, as payments for out-of-network services are typically much higher than in-network payments for the same services.60 While the majority of the studies in this brief intentionally exclude out-of-network claims, White and Whaley note that the data used in their 2019 analysis did not contain enough information to reliably determine whether claims were out-of-network or in-network.61 While it is not clear what proportion of claims in this study were out-of-network, these payments may contribute to the relatively high private-to-Medicare ratio that the authors report.
PHYSICIAN SERVICES
Eight studies compared private insurance and Medicare payment rates for physician services. Private insurance rates averaged 143% of Medicare rates overall, ranging from 118% (Ginsburg, 2010) to 179% (Song, 2019) of Medicare levels across studies (Figure 5). Estimates from each year of the MedPAC analysis were averaged to calculate the overall average across the studies. Within studies, the greatest variation was seen in Pelech’s analysis, which reported a range of private-to-Medicare payment ratios for specific physician services from less than 80% for established patient office visits to over 400% for the physician service component of brain MRI. Ginsburg also reported a significant range across major metropolitan markets, ranging from 82% to 251%.

Across all studies, private insurance rates for physician services are substantially closer to Medicare levels than private insurance rates for hospital services, which suggests that physician groups generally have less negotiating leverage relative to private insurers than hospital groups. Nonetheless, the reviewed studies still demonstrate pronounced variation overall.
FACTORS ASSOCIATED WITH VARIATION ACROSS STUDIES OF PHYSICIAN PAYMENTS
Much of the variation in reported physician payment rates may be explained by methodological differences, several of which echo those seen among the reviewed studies of hospital payments. The most significant of these include the relative market power of physicians and insurers in the markets being examined, the types of physician services used for the comparison, the components of private insurance and Medicare payments included in the calculation of their respective payment rates, and the authors’ treatment of out-of-network payments.
- Physician and Insurer Market Power. The results of the reviewed studies of physician payment rates appear to vary substantially due to differences in the market power of physician practices relative to private insurers. For example, Ginsburg’s analysis found: (1) lower private insurance rates relative to Medicare payments in major metropolitan areas, where physician practices face greater competition and hold less market power relative to insurers; (2) higher physician payment rates relative to Medicare in rural areas, where high demand for scarce physician services appears to give practices stronger negotiating leverage against insurers, and (3) lower private insurance payments for primary care specialties relative to Medicare, noting that specialty physician groups exhibited greater market consolidation than primary care groups in most of the markets studied.62 .Pelech’s analysis found substantial variation in the private-to-Medicare payment ratio across geographic markets throughout the U.S. Citing the substantial variation in physician practices’ degree of consolidation and integration with hospitals observed among these markets, Pelech suggests that regions with higher private insurance payments also reflect greater physician market power relative to local private insurers.63
- Types of Physician Services. The reviewed studies also differ in the types of services examined, with some emphasizing resource-intensive procedural services such as surgery and imaging, and others focusing on more “cognitive” services such as office visits and routine examinations. The majority of physician services included in Pelech’s analysis are high-RVU procedures or imaging studies, and Pelech reports a substantially higher ratio of private insurance payments relative to Medicare.64 In contrast, studies that limit their analysis to physician office visits (e.g., Biener and Selden, 2017) find relatively low ratios of private-to-Medicare rates compared to the overall average.65 As described above, Ginsburg finds a similar trend by physician specialty across several markets, suggesting that much of the difference in the private-to-Medicare payment ratio across physician services may be better explained by the relative market power of the different physician specialties. Trish and colleagues attempt to address this issue by examining a wide variety of services across several physician specialties, and find private insurance rates very close to the cross-study average.66 .Most of the reviewed studies do not distinguish between physician services delivered in non-hospital facilities and those delivered in hospital outpatient departments. Under current Medicare policy, payment rates for some procedures rendered in hospital outpatient departments are often much higher than payments for identical services rendered in physician offices, an approach that MedPAC has recommended against in recent years.67 Consequently, Medicare rates may appear higher in areas where physicians have shifted much of their procedural care delivery to the hospital outpatient setting.
- Private Insurance Claims Data. As noted earlier, researchers are typically at a disadvantage without access to comprehensive private insurance payments from all insurers, or a sample that is representative of all private insurance claims to compare with publicly reported Medicare data. Studies that use data from larger insurers that have exceptionally strong market power relative to physicians in many markets, such as the Ginsburg 2010 study, may observe relatively low private payments.68 A similar effect may be seen in the annual analyses conducted by MedPAC, which are based on claims data from only one large commercial PPO that operates nationwide.69 In contrast, Song’s analysis makes use of data from the Truven MarketScan commercial claims database (now known as IBM MarketScan), which reflects over 300 private payers.70 Compared to studies that use data only from a few large insurers, this dataset contains claims paid by several smaller insurers that do not have nationwide market penetration.
- Payment Components. As was seen for hospitals, the payment components included in each analysis may also have a modest effect on their reported physician payment rates. The Medicare Physician Fee Schedule allows for several additions to its base payments, such as geographic cost variation, health professional shortage areas, and participation in alternative payment models such as the Merit-Based Incentive Payment System established by the Medicare Access and CHIP Reauthorization Act of 2015.71 Studies that incorporate many of these additional payments (such as those by Trish and colleagues and MedPAC) may produce higher Medicare rates and lower private-to-Medicare ratios.72 ,73 Studies that simulate how much Medicare would have paid based only on private claims that do not account for non-claim Medicare payment adjustments (such as Ginsburg’s and Song’s analyses) may produce lower estimates, although other studies simulate these additional non-claim payments as well (e.g., White and colleagues, 2013).74 ,75 The Wallace and Song analysis does not account for any of these Medicare payment adjustments, though the possible effect of these exclusions appears minimal given that their reported ratio of private-to-Medicare rates is near the overall average.76 .Finally, the reviewed studies vary in their treatment of non-claim private payments, such as those that reflect capitation payments from private insurers, or additional out-of-pocket payments for balance billing. While most analyses exclude payments made outside of the usual claims process, Biener and Selden’s analysis is based on physician office billing data, so these additional payments are reflected in their estimations of private insurance and Medicare payment rates.77 ,78 ,79 ,80 ,81 ,82 ,83 ,84
- Out-of-Network Claims. The inclusion and proportion of out-of-network claims may also contribute to the ratio of private-to-Medicare rates. For example, out-of-network claims make up a significant proportion of the total claims in Pelech’s analysis, as much as over 30% for some emergency services.85 Inclusion of these payments likely inflates estimates of private insurance rates relative to Medicare levels, which may partially explain why this study’s results are higher than the overall average. In contrast, Ginsburg and other authors exclude out-of-network claims from the source data, which may partially explain why their reported private insurance rate relative to Medicare is lower compared to the overall average across studies.86
Medicare Payments and Provider Costs
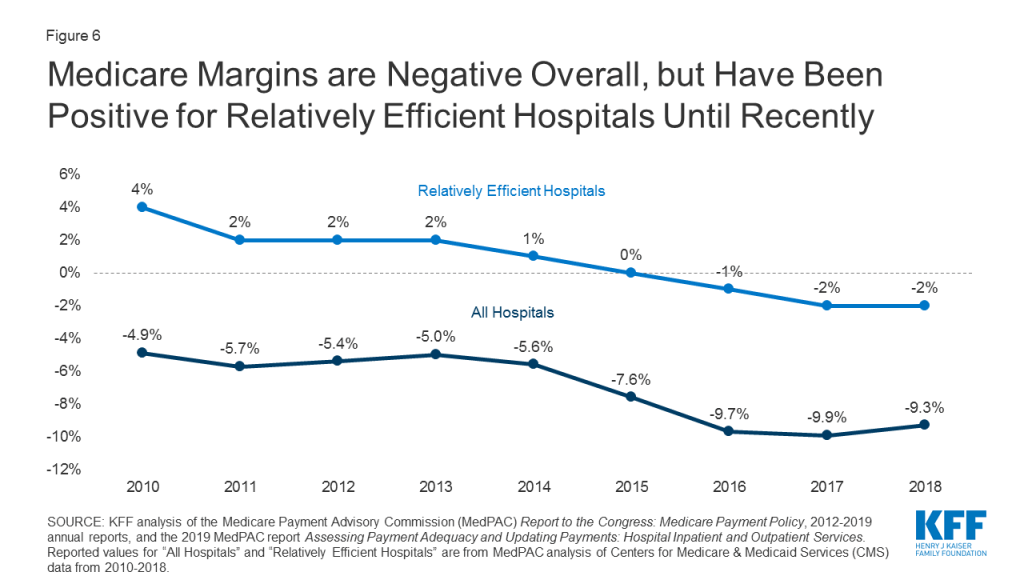
To assess the adequacy of Medicare’s hospital payment rates, MedPAC regularly compares the program’s payments to hospitals’ care delivery costs. Their findings show that, across all hospitals over the period from 2010 to 2018, costs for the treatment of Medicare beneficiaries have exceeded Medicare payments, resulting in negative and declining aggregate Medicare margins (Figure 6).87 Both MedPAC and American Hospital Association analyses show aggregate all-payer hospital margins have remained positive between 6% and 8% during the same period due to the contribution of private payers.88 ,89 Somehospital industry groups and researchers see these data as evidence that higher payment rates from private insurers are necessary to offset the financial strain of Medicare’s relatively low rates.90
However, MedPAC and other researchers have argued that hospitals could do more to contain their costs.91 ,92 ,93 ,94 ,95 ,96 ,97 ,98 ,99 ,100 ,101 ,102 ,103 They point to the nationwide trend of growing hospital consolidation through mergers and the acquisition of physician practices over the past several decades, which has given hospitals increasingly strong market power relative to insurers.104 105 ,106 ,107 Consequently, these researchers argue that outsize market power allows hospitals to negotiate increasingly high payment rates from private insurers unrelated to how Medicare’s payments compare to costs, easing the financial pressure on these hospitals to cut costs or improve their efficiency. In this alternative explanation, providers’ costs may grow faster than Medicare payments, and financial losses on Medicare patients steepen over time.108 ,109 ,110 ,111 ,112 ,113 ,114 In other words, they suggest that hospitals do not shift costs to private payers to make up for Medicare losses, but rather charge private payers what the market will bear.
Medicare payments have historically been adequate for many financially efficient providers, defined by MedPAC has separately examined Medicare margins across hospitals it designates as “relatively efficient” (with costs below a defined threshold, among other metrics), finding a consistently positive overall Medicare margin for this subset of hospitals until about 2015. However, even this margin has also been slightly negative since 2016. MedPAC has recommended that previously planned Medicare payment updates should be increased to correct for this, though maintains the view that holding Medicare payments close to efficient hospitals’ costs is desirable because it places pressure on hospitals to improve their efficiency.115
Physician groups have also pointed out discrepancies between their practice costs and Medicare payments.116 ,117 Because there is no required national cost reporting for physician practices as there is for hospitals, CMS and researchers rely on small, sporadic surveys of physicians and practice managers. These include the Physician Practice Information Survey (PPIS) conducted by the American Medical Association in 2007 and 2008. PPIS data are still used in the calculation of the Medicare Economic Index (MEI), which measures inflation in the prices of goods and services needed to operate a physician practice. CMS uses the MEI as a major factor in the determination of annual payment rate updates to the Medicare Physician Fee Schedule.118 For this reason, MedPAC also tracks changes in the MEI relative to changes in Medicare provider payments as an indirect measure of payment adequacy.
MedPAC analyses from 2010 to 2017 found that payment updates to Medicare’s Physician Fee Schedule increased cumulatively by 11% over that period, while the MEI increased cumulatively by 33%.119 To the extent that the MEI is a reliable indicator of the cost of providing care, this suggests Medicare’s payment updates may not have kept up with growing costs for some physicians. However, there has long been concern that the MEI does not accurately represent modern physician practices’ costs, given limitations in the original PPIS survey data and the fact that they are now over a decade old.120 ,121 ,122 ,123 ,124 125 Physicians and researchers have called for CMS to update its methodology for estimating practice costs.126 ,127 MedPAC has specifically recommended that CMS use data from a cohort of “relatively efficient” practices as it already does for hospitals, arguing that this would allow for a more accurate – and, likely, more favorable – determination of Medicare payment adequacy.128 MedPAC has also proposed a number of Medicare payment adjustments that would boost payment rates for primary care physicians and increase the relative valuation of routine evaluation and management services, which would likely improve the adequacy of Medicare payments for many primary care practices.129 ,130 However, as for hospitals, MedPAC maintains that holding Medicare payment rates close to practice costs incentivizes physician practices to become more efficient.131
Discussion
Based on the reviewed studies comparing Medicare and private insurance rates for hospital and physician services, this brief finds that private insurance payments are consistently greater, averaging 199% of Medicare rates for hospital services overall, 189% of Medicare rates for inpatient hospital services, 264% of Medicare rates for outpatient hospital services, and 143% of Medicare rates for physician services. However, there is wide variation across studies due to different market dynamics in different parts of the country and for different types of medical care as well as differences in the studies’ methodology and data sources. Private payment rates for hospitals averaged as high as 358% of Medicare rates in a study of a highly concentrated state-level hospital market, and as low as 151% of Medicare rates in a study of a market with one dominant private insurer, with individual studies demonstrating even greater variation across markets, services, and individual hospitals.
Some providers have argued that Medicare payment rates are too low to cover the reasonable cost of care, and that these shortfalls lead them to raise prices for private payers. However, much of the literature suggests that providers negotiate prices with private insurers irrespective of Medicare rates, and that providers with substantial market power are best positioned to command high prices, allowing them to evade financial pressure to become more efficient.
Moreover, the costs of operating a hospital or physician practice are not fixed, and fluctuate depending on factors such as available revenues. Currently, many hospitals are facing new costs associated with the infrastructure and resources needed to treat COVID-19 patients, which may require transitional funding increases such as those implemented by the CARES Act. However, once the pandemic has passed, an increased role for Medicare reimbursements could lead many hospitals and other health care providers to phase down their operating costs accordingly. Thus, predictions of widespread provider closures under Medicare-based reform proposals may be overstated, particularly for proposals that set rates higher than current Medicare rates. If private insurers’ payments were brought closer to Medicare levels, even providers whose market power has thus far protected them from financial pressure would have a strong incentive to constrain their costs, which may lead to substantial reductions in national health spending on hospital and physician services.
Proposals that would extend Medicare rates, or a multiplier of Medicare rates, to a broader population –such as Medicare-for-All and public option proposals – could also contribute to lower premiums, deductibles, and point-of-care costs for patients. Lower provider payments could lead to lower per capita spending, leading in turn to lower out-of-pocket costs. Employers could also realize savings under proposals that extend Medicare rates to private insurers, which could allow them to redirect some funds currently spent on employee health coverage, including toward wages. Particularly during the current pandemic, it is worth noting that many privately insured patients hospitalized with COVID-19 would have faced lower out-of-pocket costs if their treatment had been reimbursed at Medicare rates.
However, the fact that even some relatively efficient providers are now losing money on Medicare suggests that the capacity of providers to become more efficient will vary substantially. To address these concerns, some states are moving forward with proposals to establish rates that are higher than Medicare rates but lower than rates currently paid by private insurers, and the current Medicare program has increased payments for inpatient COVID-19 care to better meet the needs of the pandemic response. Even after overcoming the current crisis, federal and state policymakers will continue facing difficult choices as they seek to rein in health spending while safeguarding the accessibility and quality of care.
Methods
This literature review summarizes findings from 19 studies that compare payment rates paid by private insurers and Medicare for hospital care and physician services, using data pertaining to the period from 2010 to the present. Studies that only addressed other types of providers such as home health services and long-term care facilities were excluded. The studies reviewed in this brief are limited to those that compare private insurance rates with rates under traditional fee-for-service Medicare; studies that addressed only payments by Medicare Advantage plans were excluded.
To collect relevant studies that met these criteria, the authors conducted keyword searches of PubMed, Google Scholar, EconPapers, and other academic search engines, as well as the websites of governmental, research, and policy organizations that publish work related to health care and health economics. Additional studies found in the reference lists that resulted from the initial search were also included. These included a larger body of supporting research, which is cited throughout this brief to provide additional historical and scientific context to the results presented.
Nineteen studies comparing private and Medicare provider payment rates were identified. Of these, 14 studies addressed payments to hospitals, with eight addressing payments for inpatient services, five addressing payments for outpatient services, and seven reporting relative payment rates for both types of hospital services combined, with some overlap among studies. Eight of the studies identified addressed payment rates for physician services.
Studies reported their results in various formats; for the purposes of this brief, all reported results are expressed in the form of private insurance rates as a percentage of Medicare rates. For each category of study (inpatient and outpatient hospital services combined, inpatient hospital services, outpatient hospital services, and physician services), the overall average private insurance payment rate as a percentage of the Medicare rate was calculated across all studies. In these calculations, each study is given equal weight, and no outliers are removed. For studies that report private-to-Medicare payment rate ratios for multiple years, we calculate an average across years that is used in the calculation of the cross-study average, preventing disproportionate weighting of studies that reported rates for multiple years. Studies were not weighted differently based on factors such as geographic scope or the number of providers, insurers, claims, etc. included in the analysis.
This work was supported in part by Arnold Ventures. We value our funders. KFF maintains full editorial control over all of its policy analysis, polling, and journalism activities.
Eric John Lopez is a KFF-UCSF Health Policy Fellow. Tricia Neuman and Larry Levitt are with the Kaiser Family Foundation. Gretchen Jacobson was at the Kaiser Family Foundation when this report was written.
Appendix Table
| Appendix Table: Summary Of The Data Sources And Methodological Details For The Reviewed Studies | |||
| Study | Data Year(s) | Payments Addressed | Data Sources, Methodology, and Factors Influencing Results |
| American Hospital Association Annual Survey 2018 | 2010-2017 | Hospital | Source data: American Hospital Association (AHA) Annual Survey of Hospitals for 2010-2016, including facility-level payment and cost data provided by over 6000 AHA member hospitals nationwide, representing roughly 85% of U.S. hospitals. Respondents are community hospitals, defined by the AHA as all non-federal short-term hospitals, including academic medical centers and teaching hospitals.
Methods: Using hospital-reported payment data for hospitals participating in the AHA annual survey, the authors calculate overall payment-to-cost ratios (PTCRs) for each year. This review further calculates ratios of the PTCR for private payers to the Medicare PTCR, resulting in estimates of the private-to-Medicare payment ratio for each year. Methodology is consistent across years, so changes in the Medicare-private payment differential are likely to reflect true changes over time. The analysis does not control for hospital case mix or patient-specific factors such as medical complexity.
Factors Influencing Reported Rates: The hospitals included in the AHA annual survey include academic medical centers, community hospitals, and non-profit hospitals, which may result in more broadly representative estimates of the private-to-Medicare hospital payment ratio than studies that focus on for-profit hospitals. Medicare PTCRs are based on the amounts that the Centers for Medicare and Medicaid Services (CMS) actually paid, including payments for Disproportionate Share Hospital (DSH) status, indirect medical education (IME), geographic adjustments, pass-through payments including those for direct graduate medical education (DGME), etc., which may result in higher estimates of Medicare rates than studies that exclude these payment components. Self-pay and privately insured patients are not differentiated in the reported private PTCRs, which may skew estimates of private insurance payments downward. However, because the private PTCRs are based on payments rather than claims, out-of-network payments are included, which may result in higher estimates of private insurance rates than studies that exclude out-of-network claims. |
| Baker et. al. 2016 | 2012 | Hospital | Source data: Health Care Cost Institute (HCCI) claims data for 2012, which includes claims for three large nationwide private insurers – UnitedHealthcare, Humana, and Aetna, representing hospital service claims for approximately 4 million individuals nationwide. Medicare claims were obtained from the Medicare Provider Analysis and Review (MEDPAR) File for 2012, which includes individual hospital price data for all Medicare FFS enrollees.
Methods: Private insurance rates were calculated based on prices for commercial hospital claims for beneficiaries aged 65 and older and their dependents enrolled in HMO, PPO, or POS plans, aggregated to the event level. Medicare rates were calculated based on a 100% sample of Medicare FFS enrollees, aggregated to the event level. Authors compared average commercial and Medicare prices for the top 100 DRGs by volume, at both the CBSA level and nationally. The analysis does not control for patient-specific factors such as medical complexity, though calculating private insurance rates based on claims only for beneficiaries age 65 and older may partially account for differences in medical complexity among privately insured and Medicare beneficiary claims.
Factors Influencing Reported Rates: The specific insurers represented in this dataset may not reflect the national distribution of enrollees in private insurance plans, so the estimates of private insurance rates may not reflect rates negotiated by other insurers, particularly smaller local insurers with less negotiating power relative to providers that may have higher provider payments. Medicare payments are based on the amounts that CMS actually paid, including payments for DSH status, IME, geographic adjustments, pass-through payments, etc., which may result in higher estimates of Medicare rates than studies that exclude these payment components. Claims with zero or negative payments and those in the top and bottom 1% of the payment amount distribution by DRG and insurance type were excluded, reducing the effect of extreme payments relative to studies that do not exclude outliers. The data do not contain information on provider payments made outside of the usual claims process. Out-of-network claims are included, which may result in higher estimates of private insurance rates than studies that exclude out-of-network claims. |
| Biener and Selden 2017 | 2014-2015 data consolidated | Physician | Source data: Medical Expenditures Panel Survey (MEPS) Household and Medical Provider components for 2014-2015, which include provider billing records containing full established charges and payments for over 30,000 office-based physician visits, across private insurers, Medicare, and other payers.
Methods: The authors analyze payments associated with all office-based physician visits in the dataset for adults aged 18 and older (excluding visits characterized by the reporting household as emergency visits, as well as visits for counselling only, vision exams, or surgical procedures). Visit payments were regressed on coverage type and several patient and visit characteristics, and mean payments were estimated for private payers and Medicare FFS based on the regression model. The MEPS dataset is not large enough to be representative at the state level, so the authors do not address geographic variation, and report national averages only. The authors do not attempt to control for service intensity or patient-specific factors such as medical complexity.
Factors Influencing Reported Rates: MEPS data contains information on physician office visits, including visit type (PCP, specialist, etc.) and content, allowing the authors to control for factors such as practice setting and physician specialty in their regression model. Payments in the top 1% of visits ranked by charges were excluded for all payment types. Because private rates are calculated based on physician office billing data, payments outside of the claims process are included, as are payments for out-of-network claims, which may result in higher estimates of private insurance rates than studies that exclude these payments. Because the authors exclude procedures rendered in hospital outpatient departments (which are often reimbursed at higher rates than identical procedures rendered in physician offices under current Medicare policy), this analysis may produce lower estimates of average Medicare rates that studies that incorporate additional care settings. |
| Colorado Department of Health Care Policy and Financing 2019 | 2010-2017 | Hospital | Source data: Colorado Hospital Association’s “DATABANK” database for 2010-2017, which contains aggregated hospital utilization and payment data reported by 67 participating Colorado hospitals representing over 97% of licensed beds in the state.
Methods: The authors calculate aggregate payment-to-cost ratios (PTCRs) for each payer type (e.g. commercial insurance, Medicare) across all hospitals in the dataset. This review further calculates ratios of the PTCR for private payers to the Medicare PTCR, resulting in estimates of the private-to-Medicare payment ratio for each year. Methodology is consistent across years, so changes in the Medicare-private payment differential are likely to reflect true changes over time. The analysis does not control for hospital case mix or patient-specific factors such as medical complexity.
Factors Influencing Reported Rates: Data are specific to participating hospitals in Colorado, so are likely biased toward payment rates prevailing in Colorado hospital markets. White and Whaley (see table entry below) find that hospital prices in Colorado are relatively high compared to those in most of the 24 other states included in their 2019 study, suggesting that Colorado hospitals’ high degree of market power relative to insurers may result in higher estimates of private insurance hospital payment rates. Reported Medicare payments are based on the amounts that CMS actually paid, including payments for DSH status, IME, geographic adjustments, pass-through payments, etc., which may result in higher estimates of Medicare rates than studies that exclude these payment components. Separate PTCRs are reported for self-pay and privately insured patients, so estimates of private insurance rates are not affected by differences between self-pay and privately insured payments, in contrast to the AHA analyses. Out-of-network payments are included in the private insurance PTCR, which may result in higher estimates of private insurance rates than studies that exclude out-of-network claims. |
| Cooper et. al. 2018 | 2011 | Hospital | Source data: Health Care Cost Institute (HCCI) claims data for 2011, which includes claims for three large nationwide private insurers – UnitedHealthcare, Humana, and Aetna – representing hospital service claims for approximately 4 million individuals nationwide. Medicare claims data were obtained from the Medicare Provider Analysis and Review (MEDPAR) File for 2011, which includes individual hospital price data for all Medicare FFS enrollees.
Methods: The authors calculate mean hospital prices for privately reimbursed and Medicare-reimbursed stays based on approximately 2,400 general medical and surgical hospitals in the dataset for which inpatient stays across both payer types were available. The authors adjust for differences in medical complexity between the privately insured and Medicare populations by risk-adjusting price, for differences in each hospitals’ mix of admission types by adjusting for the relative volume of DRGs, and for differences in care quality by analyzing price variation within each hospital.
Factors Influencing Reported Rates: The specific insurers represented in this dataset may not reflect the national distribution of enrollees in private insurance plans, so the estimates of private insurance rates may not reflect rates negotiated by other insurers, particularly smaller local insurers with less negotiating power relative to providers that may have higher provider payments. Medicare payments are based on the amounts that CMS actually paid, including payments for DSH status, IME, geographic adjustments, pass-through payments, etc., which may result in higher estimates of Medicare rates than studies that exclude these payment components. The data do not contain information on provider payments made outside of the usual claims process, which may underestimate privately reimbursed or Medicare payments that have non-claim components. Out-of-network claims are included, which may result in higher estimates of private insurance rates than studies that exclude out-of-network claims. |
| Ge and Anderson 2018 | 2016 | Hospital | Source data: Florida Agency for Health Care Administration hospital financial information records for 2010-2016, which includes audited hospital-reported gross revenues, deductions, and net revenues by type of payer (e.g., commercial insurance, Medicare) for 153 private short-term hospitals in Florida.
Methods: The authors calculate net payment ratios (net revenue to gross revenue) for both Medicare and private HMO and PPO plans across all hospitals in the dataset, as well as the ratio of these net payment ratios, yielding an estimated private HMO/PPO-to-Medicare payment ratio, which the authors report for 2016. The authors do not control for hospital case mix or patient-specific factors such as medical complexity.
Factors Influencing Reported Rates: Data are specific to participating hospitals in Florida, so are likely biased toward payment rates prevailing in Florida hospital markets. The authors report that the proportion of for-profit hospitals is much higher in Florida than nationwide, which may result in higher estimates of private insurance payment rates. However, White and Whaley (see table entry below) find that hospital prices in Florida are roughly comparable to those in most of the 24 other states included in their 2019 study. Reported private insurance rates are based on payments from HMO and PPO plans only (excluding other plan types such as POS), which may bias reported payments toward HMO and PPO rates. Medicare payments are based on the amounts that CMS actually paid, including payments for DSH status, geographic adjustments, pass-through payments, etc., which may result in higher estimates of Medicare rates than studies that exclude these payment components. Out-of-network payments are included, which may result in higher estimates of private insurance rates than studies that exclude out-of-network claims. |
| Ginsburg 2010 | 2010 | Physician and Hospital | Source data: Physician and hospital payment rates directly provided by four large private insurers – Aetna, Anthem Blue Cross Blue Shield, Cigna, and UnitedHealth – for services reimbursed in 2010 in eight diverse health care markets throughout the U.S. (Cleveland, OH; Indianapolis, IN; Los Angeles, CA; Miami, FL; Milwaukee, WI; Richmond, VA; San Francisco, CA; and rural Wisconsin). Medicare payment rates are also provided by the same insurers, based on simulated Medicare equivalent payments for the provided private claims.
Methods: The authors used insurer-provided average private insurance and Medicare payment rates to calculate average private insurance-to-Medicare payment ratios for all inpatient hospital services, all outpatient hospital services, and for physician services across several medical specialties, respectively. Exact calculation methods may have varied for each insurer, though additional information is not available due to the authors’ data-sharing agreement with the participating insurers. Because information on the relative volume of claims in each market is not provided, this brief further calculates unweighted average ratios across all markets.
Factors Influencing Reported Rates: Although only eight markets are represented, the authors specifically chose these markets due to their geographic spread and expected variation in payment rates, which may moderate the effects of nationwide variation in the private-to-Medicare payment ratio. The specific insurers represented in this dataset may not reflect the national distribution of enrollees in private insurance plans, so the estimates of private insurance rates may not reflect rates negotiated by other insurers, particularly smaller local insurers with less negotiating power relative to providers that may have higher provider payments. The insurer-reported “standard” private insurance rates for physician services are derived from a sample in which typically “hospital-based” specialties such as anesthesiologists and radiologists are underrepresented, which may bias private insurance rates downward relative to Medicare levels. The data do not contain information on provider payments made outside of the usual claims process, which may underestimate privately reimbursed or Medicare payments that have non-claim components. The authors requested that participating insurers exclude out-of-network claims from their reported data, which may result in lower estimates of private insurance payments than among studies that include out-of-network claims. |
| Kronick and Neyaz 2019 | 2015-2016 data consolidated | Hospital | Source data: California hospitals’ Annual Financial Disclosure Reports filed with the California Office of Statewide Health Planning and Development (OSHPD) for 2015-2016, which includes payment and cost data by type of payer (e.g., commercial insurance, Medicare) for all California hospitals.
Methods: The authors calculate aggregate payment-to-cost ratios (PTCRs) for each payer type (e.g., commercial insurance, Medicare) across all hospitals in the dataset, as well as ratios of the PTCRs for each payer type, yielding an estimated private-to-Medicare charge ratio. Inpatient and outpatient services are aggregated together. The authors limit their analysis to acute care general hospitals, excluding psychiatric, rehabilitation, substance abuse, long-term care, and children’s’ hospitals. The authors do not control for hospital case mix or patient-specific factors such as medical complexity.
Factors Influencing Reported Rates: Data are specific to participating hospitals in California, so are likely biased toward payment rates prevailing in California hospital markets. OSHPD reports only include cost data at the level of hospital units rather than for specific procedures or services, though the authors adapt formulas used by OSHPD to account for indirect hospital payments not associated with specific hospital units, preventing the potential underestimations of private insurance and Medicare rates that might have otherwise been caused by excluding these payments. Specifically, Medicare payments are based on the amounts that CMS actually paid, including payments for DSH status, geographic adjustments, pass-through payments, etc., which may result in higher estimates of Medicare rates than studies that exclude these payment components. Out-of-network payments are included in the private insurance PTCR, which may result in higher estimates of private insurance rates than studies that exclude out-of-network claims. |
| Maeda and Nelson, CBO 2017 | 2013 | Hospital | Source data: Health Care Cost Institute (HCCI) claims data for 2013, which includes claims for three large nationwide private insurers – UnitedHealthcare, Humana, and Aetna – representing hospital service claims for approximately 4 million individuals.
Methods: The authors aggregate inpatient claims to the level of hospital stays (of which they identify over 620,000 in the dataset), then calculate average overall allowed payment amounts per stay by payer type (e.g., private insurance, Medicare). The authors limit their analysis to stays in acute care hospitals in MSAs only, and exclude stays associated with services that uncommon among Medicare patients such as labor and delivery. The authors simulate Medicare payments based on the same claims used in the calculation of private insurance payments, and include simulated payments for Medicare-allowed cost-sharing, DSH status, geographic adjustments, etc., but not pass-through or IME payments.
Factors Influencing Reported Rates: The specific insurers represented in this dataset may not reflect the national distribution of enrollees in private insurance plans, so the estimates of private insurance rates may not reflect rates negotiated by other insurers, particularly smaller local insurers with less negotiating power relative to providers that may have higher provider payments. Medicare rates are simulated by the authors, including hospital-specific payment adjustments such as those for DSH status, and geographic adjustments, though not IME and pass-through payments; this may result in higher estimates of Medicare rates compared to studies that do not include any of these payments, but relative underestimates of Medicare rates compared to studies that use the amounts that CMS actually paid. The authors focus on hospitals in Metropolitan Statistical Areas (MSAs) only, which may skew the reported rates toward those prevailing in large urban areas. The data do not contain information on provider payments made outside of the usual claims process, which may underestimate privately reimbursed or Medicare payments that have non-claim components. Out-of-network payments are included, which may result in higher estimates of private insurance rates than studies that exclude out-of-network claims. |
| MedPAC 2012-2019 | 2010-2017 | Physician | Source data: Claims data provided by an undisclosed private insurer that covers a wide geographic area across the U.S., including all paid claims for services covered by the insurer’s PPO plans in 2010-2017, reflecting both the insurer’s allowed amount and patient cost-sharing amounts. Due to MedPAC’s data-sharing agreement with the private insurer, additional information is not available. Medicare beneficiary-level claims data provided directly by CMS for 100% of Medicare beneficiaries in 2010-2017, including Medicare allowed amounts and Medicare’s allowed patient cost-sharing amounts.
Methods: The authors do not report detailed methods for their comparison of private insurance (PPO) payment rates and Medicare payment rates. However, the authors state that the methodology has been consistent across years, so changes in the Medicare-private payment differential are likely to reflect true changes over time.
Factors Influencing Reported Rates: Although the data represent a wide geographic distribution of claims, the fact that only one private insurer’s PPO plans are represented limits the generalizability of the findings, and may skew estimates toward the generally lower payment rates that large insurers are able to negotiate with providers due to their greater bargaining power. Medicare payments are based on the amounts that CMS actually paid, including Medicare-allowed cost-sharing, payments for DSH status, IME, geographic adjustments, pass-through payments, etc., which may result in higher estimates of Medicare rates than studies that exclude these payment components. The data do not contain information on provider payments made outside of the usual claims process, which may result in lower estimates of private insurance rates than studies that include these payment components. The authors do not report whether out-of-network claims are included in the estimation of private insurance payment rates. |
| Pelech 2018 | 2014 | Physician | Source data: Health Care Cost Institute (HCCI) claims data for 2014, which includes physician service claims for three large nationwide private insurers – UnitedHealthcare, Humana, and Aetna – for approximately 39 million individuals.
Methods: The authors aggregate claims for physician services (of which they identify over 230 million in the dataset, representing services provided to over 19 million patients by over 600,000 physicians), then calculate average overall allowed payment amounts across several services by payer type (e.g., private insurance, Medicare). The authors limit their analysis to 12 physician services that are comparably common among both privately insured and Medicare beneficiaries and delivered in MSAs. The authors simulate Medicare payments based on the same claims used in the calculation of private insurance payments, and include simulated payments for cost-sharing and procedure- and provider-specific adjustments.
Factors Influencing Reported Rates: The majority of physician services included in the analysis are procedural or imaging studies, which may result in higher estimates of private insurance rates than studies focusing on physician services for specialties such as primary care that have relatively low market power compared to procedural specialists and radiologists. The specific insurers represented in this dataset may not reflect the national distribution of enrollees in private insurance plans, so the estimates of private insurance rates may not reflect rates negotiated by other insurers, particularly smaller local insurers with less negotiating power relative to providers that may have higher provider payments. Medicare rates are simulated by the authors, including Medicare-allowed adjustments for bilateral services, performing multiple same-day procedures , etc.; this may result in higher estimates of Medicare rates compared to studies that do not include any of these adjustments. The analysis is limited to MSAs, which may skew the reported rates toward physician prices prevailing in large urban areas. The data do not contain information on provider payments made outside of the usual claims process, which may underestimate privately reimbursed or Medicare payments that have non-claim components. Out-of-network payments are included in varying proportions by service, which may result in higher estimates of private insurance rates than studies that exclude out-of-network claims. |
| Selden et. al. 2015 | 2010-2012 | Hospital | Source data: Medical Expenditures Panel Survey (MEPS) Household and Medical Provider components for 1996-2012, which include payment data for approximately 39,500 non-maternity hospital stays nationwide, across private insurers, Medicare, and other payers.
Methods: The authors analyze payment-to-charge ratios associated with inpatient hospital stays in the dataset for adults aged 19 and older. Hospital stays were regressed on coverage type and several patient and visit characteristics, and mean payments were estimated for private payers and Medicare based on the regression model. Based on these results, the authors calculated mean private-to-Medicare payment ratios for each year for which data was available. The authors do not address geographic variation, and merely report national averages. Methodology is consistent across years, so changes in the Medicare-private payment differential are more likely to reflect true changes over time. The authors do not control for hospital case mix or patient-specific factors such as medical complexity.
Factors Influencing Reported Rates: The authors compare average inpatient hospital payment rates based on the “full established charge” for entire hospital stays (weighted by volume) rather than charges for specific procedures, which may be influenced more heavily by differences in patient-specific factors such as medical complexity. Some payments made by supplemental managed care plans (Medicare Advantage) are included in the calculation of Medicare rates, though given that Medicare Advantage payments are generally similar to Medicare rates for inpatient hospital services (see e.g., Trish et. al.), the effect of including these payments is likely minimal. Reported Medicare rates include payments for DSH status, IME, and outlier payments, but exclude payments not linked to specific events such as pass-through payments; this may result in higher estimates of Medicare rates compared to studies that do not include any of these payments, but relative underestimates of Medicare rates compared to studies that include all Medicare payment components. The authors exclude hospital stays with payments exceeding three times charges, which may disproportionately exclude exceptionally high private insurance payments and result in lower estimates of the private-to-Medicare payment ratio. Because private rates are calculated based on payment data for hospital stays, payments outside of the claims process are included, as are payments for out-of-network claims, which may result in higher estimates of private insurance rates than studies that do not include these payments. |
| Selden 2020 | 2013-2016 | Hospital | Source data: Medical Expenditures Panel Survey (MEPS) Household and Medical Provider components for 2013-2016, which include payment data for approximately 48,000 non-maternity inpatient hospital stays and 236,500 non-emergency outpatient visits nationwide across private insurers and Medicare.
Methods: This analysis updates the findings of Selden et. al. 2015 (see table entry above), preserving the same methodology for inpatient services, as well as an additional analysis for outpatient services over the period from 1996-2016. Prices for inpatient stays and outpatient service events were regressed on coverage type and several patient and visit or service characteristics, and mean payments were estimated for private payers and Medicare based on the regression model. Based on these results, the authors calculated mean private-to-Medicare payment ratios for each year. The authors do not address geographic variation, and merely report national averages. Methodology is consistent across years, so changes in the Medicare-private payment differential are more likely to reflect true changes over time. The authors do not control for hospital case mix or patient-specific factors such as medical complexity.
Factors Influencing Reported Rates: The authors compare average inpatient hospital payment rates based on the “full established charge” for entire hospital stays (weighted by volume) rather than charges for specific procedures, which may be influenced more heavily by differences in patient-specific factors such as medical complexity. Average outpatient hospital payment rates are calculated based on event-level data (weighted by volume), which may result in lower estimates of private insurance payments for outpatient services than studies that focus on selections of services that disproportionally represent less common but more highly reimbursed services. Some payments made by supplemental managed care plans (Medicare Advantage) are included in the calculation of Medicare rates, though given that Medicare Advantage payments are generally similar to Medicare rates for inpatient hospital services (see e.g. Trish et. al.), the effect of including these payments is likely minimal. Reported Medicare rates include payments for DSH status, IME, and outlier payments, but exclude payments not linked to specific events such as pass-through payments; this may result in higher estimates of Medicare rates compared to studies that do not include any of these payments, but relative underestimates of Medicare rates compared to studies that include all Medicare payment components. The authors exclude hospital stays with payments exceeding three times charges, which may disproportionately exclude exceptionally high private insurance payments and result in lower estimates of the private-to-Medicare payment ratio. Because private rates are calculated based on payment data for hospital stays, payments outside of the claims process are included, as are payments for out-of-network claims, which may result in higher estimates of private insurance rates than studies that do not include these payments. |
| Song 2019 | 2016 | Physician | Source data: Truven Health Analytics MarketScan Commercial Claims and Encounters database 2016 claims data, which contains non-facility physician payment information for approximately 350 private payers throughout the U.S.
Methods: The author reports unweighted mean private insurance prices for a selection of 12 physician services for all private insurance plan types other than capitated plans and POS plans with capitation. Medicare prices are simulated based on average non-facility professional fees derived from the 2016 Medicare Physician Fee Schedule for the same set of services, without accounting for geographic adjustments or other payment modifications.
Factors Influencing Reported Rates: The MarketScan dataset includes a diverse mix of private insurers, which may result in lower estimates of private insurers’ physician payment rates than studies that examine payments for only a few large nationwide private insurers that likely have stronger negotiating power relative to providers. The simulated Medicare rates do not include payments for DSH status, IME, and outlier payments, etc., which may result in lower estimates of Medicare rates compared to studies that do account for these payments. The data do not contain information on provider payments made outside of the usual claims process, which may underestimate privately reimbursed or Medicare payments that have non-claim components. The author distinguishes between payments for in-network and out-of-network services; for the purposes of this brief, the author’s average reported in-network rates are used in the calculation of the overall cross-study average, which may result in a lower private-to-Medicare payment ratio than studies that include out-of-network payments. |
| Trish et. al. 2017 | 2007-2012 data consolidated | Physician | Source data: Claims data provided directly by an undisclosed private insurer that covers a wide geographic area across the U.S., including over 8.5 million claims for private insurance enrollees from 2007-2012. Due to the authors’ data-sharing agreement with the private insurer, additional information is not available. Medicare claims from a 20% random sample of Medicare beneficiaries for 2007-2012 were provided directly by CMS.
Methods: The authors calculate the mean prices for each type of service by plan type (e.g. private insurance, Medicare), care setting (e.g. physician office, hospital outpatient department, etc.), CBSA, and year, then average these relative mean prices across CBSAs for each year, weighting by the private insurer’s enrollment in each CBSA. Finally, the authors calculate mean private-to-Medicare payment ratios using these averages. The authors do not control for patient-specific factors such as medical complexity.
Factors Influencing Reported Rates: Although the data represent a wide geographic distribution of claims, the fact that only one private insurer is represented limits the generalizability of the findings, and may skew estimates toward the generally lower payment rates that large insurers are able to negotiate with providers due to their greater bargaining power. The authors incorporate a broad variety of physician specialties, which may result in estimates of the private-to-Medicare physician ratio that fall between those reported by studies in which more procedurally-oriented or more cognitively-oriented specialties are disproportionately represented. Medicare payments are based on the amounts that CMS actually paid, including provider-specific and service-specific payment adjustments, which may result in higher estimates of Medicare rates than studies that exclude these payment components. Claims associated with prices more than four standard deviations above or below the mean for each payer were excluded, reducing the effect of extreme payments relative to studies that do not exclude outliers. The data do not contain information on provider payments made outside of the usual claims process, which may underestimate privately reimbursed or Medicare payments that have non-claim components. Out-of-network payments are included, which may result in higher estimates of private insurance rates than studies that exclude out-of-network claims. |
| Wallace and Song 2016 | 2007-2013 data consolidated | Physician and Hospital | Source data: Truven Health Analytics Medicare and Commercial Claims and Encounters database for 2007-2013, which contains physician service claims for approximately 350 private payers nationwide, as well as for a convenience sample of Medicare patients, together representing approximately 1.4 million individuals that transitioned from private insurance to Medicare between 2007 and 2013.
Methods: The authors longitudinally follow a cohort of approximately 200,000 individuals in the dataset who retired from employment and transitioned from private insurance to Medicare at age 65. Mean prices by payer type are estimated by aggregating claims from before and after their transition into separate claims samples for private insurance and Medicare, and using a regression discontinuity model to identify the causal effect of entry into Medicare, controlling for a number of individual-specific and time-specific factors. The authors exclude services that do not have cost-sharing requirements for Medicare beneficiaries such as certain primary care and preventive care office visits, instead focusing on a subset of procedural and imaging services that consistently have patient cost-sharing requirements.
Factors Influencing Reported Rates: The authors longitudinally observe a consistent cohort from the year before and after their transition from private to Medicare coverage at age 65, which largely controls for medical complexity and other patient-specific features, and allows the authors to account for possible changes in utilization that would otherwise impact reported rates. The authors focus on a subset of mainly procedural and imaging services, which may result in relatively lower estimates of the private-to-Medicare payment ratio than studies that focus on routine evaluation and management services in the hospital setting, or higher estimates than studies focusing on physician services for specialties such as primary care that have relatively low market power compared to procedural specialists and radiologists. The reported private and Medicare rates are based on author-determined “changes attributable to Medicare entry”, which causes estimates of the private-to-Medicare ratio to be lower than if estimates had been based on only the raw reduction in price. The MarketScan dataset includes a diverse mix of private insurers, which may result in lower estimates of private insurers’ physician payment rates than studies that examine payments for only a few large nationwide private insurers that likely have stronger negotiating power relative to providers. Only private payments made by indemnity plans, PPOs, and POS plans were included, which may bias estimates of private insurance payments toward rates paid by these plan types (as opposed to others such as HMOs). The data do not contain information on provider payments made outside of the usual claims process, which may underestimate privately reimbursed or Medicare payments that have non-claim components. Out-of-network payments are included, which may result in higher estimates of private insurance rates than studies that exclude out-of-network claims. |
| White et. al. 2013 | 2011 | Physician and Hospital | Source data: Claims data provided by General Motors, Chrysler, Ford, and the United Auto Workers Retiree Medical Benefits Trust across 5 major metropolitan physician and hospital markets in Michigan, for 2011. Provided claims information included amounts paid to the physicians and hospitals, as well as amounts paid by the insurer and enrollee, for approximately 590,000 active and retired non-elderly autoworkers and their dependents under age 65.
Methods: The authors aggregated private insurance claims to the level of DRG codes (for inpatient hospital services) or HCPCS codes (for outpatient hospital services and physician services), and calculated mean provider-level prices for each code. Medicare prices were simulated based on the Medicare IPPS, OPPS, or MPFS, including geographic adjustments, provider-specific adjustments such as IME and DSH payments, and MPFS adjustments. Using these payment estimates, the authors calculated provider-level private-to-Medicare price indices for each hospital (including inpatient and outpatient price indices) and physician practice (for primary care services, medical specialist services, and surgical specialist services). Providers were assigned to markets based on their location, and mean price ratios are reported for each market and overall.
Factors Influencing Reported Rates: Although the data represent a wide geographic distribution of claims, all markets were in Michigan, which the authors note may result in relatively low estimates of private insurance payment rates due to the exceptionally strong statewide market power of Blue Cross Blue Shield Michigan relative to providers. Simulated Medicare rates include payments for DSH status, geographic adjustments, IME, and outlier payments, but exclude payments not linked to specific events such as pass-through payments; this may result in higher estimates of Medicare rates compared to studies that do not simulate any of these payments, but relative underestimates of Medicare rates compared to studies that use the amounts that CMS actually paid. Private claims associated with prices outside the range of 20-1000% of the corresponding Medicare payment were excluded, reducing the effect of extreme payments relative to studies that do not exclude outliers. The data do not contain information on provider payments made outside of the usual claims process, which may underestimate privately reimbursed or Medicare payments that have non-claim components. Out-of-network payments are included, which may result in higher estimates of private insurance rates than studies that exclude out-of-network claims. |
| White 2017 | 2013-2016 data consolidated | Hospital | Source data: Claims data provided by the Employers’ Forum of Indiana for 2013-2016 for over a dozen participating employers in Indiana that cover employee health benefits, including prices paid for hospital services for approximately 225,000 covered employees and their dependents under age 65.
Methods: The authors aggregated private insurance claims to the level of DRG codes (for inpatient hospital services) or APC codes (for outpatient hospital services), and calculated mean provider-level prices for each code. Medicare prices were simulated based on the Medicare IPPS or OPPS, including geographic adjustments, and hospital-specific adjustments such as IME and DSH payments. Using these payment estimates, the authors calculated provider-level private-to-Medicare relative prices for each hospital (for both inpatient and outpatient services) and overall.
Factors Influencing Reported Rates: The data are specific to a relatively small population in Indiana, so likely skews estimates of the private-to-Medicare payment ratio to those prevailing in the state; the author notes that the hospital market in Indiana is dominated by 6 large hospital systems, and so may reflect a greater degree of hospital market power relative to insures than in other states. Simulated Medicare rates include payments for DSH status, geographic adjustments, IME, and outlier payments, but exclude payments not linked to specific events such as pass-through payments; this may result in higher estimates of Medicare rates compared to studies that do not simulate any of these payments, but relative underestimates of Medicare rates compared to studies that use the amounts that CMS actually paid. The data do not contain information on provider payments made outside of the usual claims process, which may underestimate privately reimbursed or Medicare payments that have non-claim components. Out-of-network payments are included, which may result in higher estimates of private insurance rates than studies that exclude out-of-network claims. |
| White and Whaley 2019 | 2015-2017 | Hospital | Source data: Claims data provided by approximately 50 self-insured employers for covered non-elderly employees and their dependents, private claims from statewide all-payer claims databases for New Hampshire and Colorado, and claims from additional undisclosed private health plans. Together, these sources include payment data for about 1,600 hospitals and 4 million patients in 25 states in 2015-2017.
Methods: The authors aggregated private insurance claims to the level of DRG codes (for inpatient hospital services) or APC codes (for outpatient hospital services), and calculated mean provider-level prices for each code. Medicare prices were simulated based on the Medicare IPPS or OPPS, including geographic adjustments, and hospital-specific adjustments such as IME and DSH payments, but excluding pass-through payments. Using these payment estimates, the authors calculated provider-level private-to-Medicare relative prices for each hospital, including relative prices for inpatient and outpatient services. Providers were assigned to states based on their location, and mean price ratios are reported for each state and overall. Methodology is consistent across years, so changes in the Medicare-private payment differential are more likely to reflect true changes over time.
Factors Influencing Reported Rates: The variety of data sources included in the analysis capture a broad range of private insurers, health care markets, and health insurance markets across 25 states, allowing for estimates of the overall private-to-Medicare payment ratio that are more likely to be nationally representative than studies that examine markets in only one state, or only a handful of private insurers, etc. Simulated Medicare rates include payments for DSH status, geographic adjustments, IME, and outlier payments, but exclude payments not linked to specific events such as pass-through payments; this may result in higher estimates of Medicare rates compared to studies that do not simulate any of these payments, but relative underestimates of Medicare rates compared to studies that use the amounts that CMS actually paid. The authors also exclude some Medicare hospital payments for uncompensated care, but substitute their own formula to partially account for them, which may result in lower estimates of Medicare payment rates for hospitals that provide high volumes of uncompensated care. The data do not contain information on provider payments made outside of the usual claims process, which may underestimate privately reimbursed or Medicare payments that have non-claim components. The data do not contain enough information to differentiate between in-network and out-of-network claims, so the latter likely represented substantially in the calculation of private insurance rates, which may result in higher estimates of private insurance rates than studies that exclude out-of-network claims. |
| NOTES: Abbreviations: AHA – American Hospital Association. CAH – critical access hospital. CBSA – core-based statistical area. CMS – Centers for Medicare and Medicaid Services. DGME – direct graduate medical education. DRG – diagnosis-related group. DSH – disproportionate share hospital. ESRD – end-stage renal disease. FFS – fee-for-service. GAF – Medicare geographic adjustment factor. HCCI – Health Care Cost Institute. HCPCS – healthcare common procedure coding system. HMO – health maintenance organization. HRR – hospital referral region. ICU – intensive care unit. IME – indirect medical education. IPPS – Medicare Inpatient Prospective Payment System. MedPAC – Medicare Payment Advisory Commission. MedPAR – Medicare Provider Analysis and Review. MEPS – Medical Expenditures Panel Survey. MPFS – Medicare Physician Fee Schedule. MSA – metropolitan statistical area. MS-DRG – Medicare-severity diagnosis-related group. OPPS – Medicare Outpatient Prospective Payment System. OSHPD – California Office of Statewide Health Planning and Development. PCP – primary care physician. POS – point-of-service. PPO – preferred provider organization. PPS – Medicare Prospective Payment System. PTCR – payment-to-cost ratio. | |||
Endnotes
- Centers for Medicare and Medicaid Services. 2019. National Health Expenditures 2018 Highlights. Washington, D.C.: Centers for Medicare and Medicaid Services. https://www.cms.gov/files/document/highlights.pdf ↩︎
- Tolbert, Jennifer, et. al. 2019. Key Facts about the Uninsured Population. Washington, D.C.: Kaiser Family Foundation. http://files.kff.org/attachment/Issue-Brief-Key-Facts-about-the-Uninsured-Population ↩︎
- Neuman, Tricia, et. al. 2019. Where Do the Democratic Candidates Stand on Health Reform? Washington, D.C.: Kaiser Family Foundation. https://modern.kff.org/slideshow/where-do-the-democratic-candidates-stand-on-health-reform/ ↩︎
- Kaiser Family Foundation. 2018. Medicare-for-All and Public Plan Buy-In Proposals: Overview and Key Issues. Washington, D.C.: Kaiser Family Foundation. https://modern.kff.org/report-section/medicare-for-all-and-public-plan-buy-in-proposals-overview-and-key-issues-issue-brief/ ↩︎
- “Medicare for All Act of 2019”. H.R. 1384, 116th Congress. 2019. https://www.congress.gov/bill/116th-congress/house-bill/1384 ↩︎
- “Medicare for All Act of 2019”. S. 1129, 116th Congress. 2019. https://www.congress.gov/bill/116th-congress/senate-bill/1129/text ↩︎
- Song, Zirui 2019. “The Pricing of Care Under Medicare for All: Implications and Policy Choices”. JAMA. 322(5): 395-396. https://jamanetwork.com/journals/jama/fullarticle/2737591 ↩︎
- Sanders, Bernard. 2017. “An Agenda to Fight Inequality”. The Lancet. 389(10077): P1376-1377. https://www.thelancet.com/journals/lancet/article/PIIS0140-6736(17)30882-6/fulltext ↩︎
- Koller, Christopher and Khullar, Dhruv. 2019. “The Commercial Differential for Hospital Prices: Responses from States and Employers”. JAMA. Published online July 22, 2019. E1-E2. https://jamanetwork.com/journals/jama/article-abstract/2739290 ↩︎
- Crowley, Ryan et. al.; Health and Public Policy Committee of the American College of Physicians. 2020. “Envisioning a Better U.S. Health Care System for All: Coverage and Cost of Care”. Annals of Internal Medicine. 172(2 Suppl.): S7-S32. https://annals.org/aim/fullarticle/2759529/envisioning-better-u-s-health-care-system-all-coverage-cost ↩︎
- “Increasing the Availability of Quality, Affordable Health Coverage in the Individual Market”. S.B. 5526, 66th Washington State Legislature, 2019. https://app.leg.wa.gov/billsummary?BillNumber=5526&Year=2019&Initiative=false ↩︎
- “Coronavirus Aid, Relief, and Economic Security Act”. S. 3548, 116th Congress. 2020. https://www.congress.gov/bill/116th-congress/senate-bill/3548/text ↩︎
- Strata Decision Technology. 2020. Hospitals Face Massive Losses on COVID-19 Cases Even With Proposed Increase in Federal Reimbursement. Chicago, IL: Strata Decision Technology. https://www.stratadecision.com/blog/report-hospitals-face-massive-losses-on-covid-19-cases-even-with-proposed-increase-in-federal-reimbursement/ ↩︎
- Centers for Medicare and Medicaid Services. 2019. National Health Expenditures 2018 Highlights. Washington, D.C.: Centers for Medicare and Medicaid Services. https://www.cms.gov/files/document/highlights.pdf ↩︎
- Medicare Payment Advisory Commission. 2019. Hospital Acute Inpatient Services Payment System. Washington, D.C.: Medicare Payment Advisory Commission. http://medpac.gov/docs/default-source/payment-basics/medpac_payment_basics_19_hospital_final_v2_sec.pdf?sfvrsn=0 ↩︎
- Centers for Medicare and Medicaid Services Office of the Actuary. 2019. Simulations of Affordable Care Act Medicare Payment Update Provisions on Part A Provider Financial Margins. Baltimore, MD: Centers for Medicare and Medicaid Services Office of the Actuary. https://www.cms.gov/Research-Statistics-Data-and-Systems/Statistics-Trends-and-Reports/ReportsTrustFunds/Downloads/ACAmarginsimulations2019.pdf ↩︎
- Holahan, John and McMorrow, Stacey. 2019. Slow Growth in Medicare and Medicaid Spending per Enrollee Has Implications for Policy Debates. Washington, D.C.: Urban Institute. https://www.urban.org/research/publication/slow-growth-medicare-and-medicaid-spending-enrollee-has-implications-policy-debates ↩︎
- Cubanski, Juliette et. al. 2019. The Facts on Medicare Spending and Financing. Washington, D.C.: Kaiser Family Foundation. https://modern.kff.org/medicare/issue-brief/the-facts-on-medicare-spending-and-financing/ ↩︎
- “Increasing the Availability of Quality, Affordable Health Coverage in the Individual Market”. S.B. 5526, 66th Washington State Legislature, 2019. https://app.leg.wa.gov/billsummary?BillNumber=5526&Year=2019&Initiative=false ↩︎
- Colorado Department of Regulatory Agencies Division of Insurance, Colorado Department of Health Care Policy and Financing. 2019. Draft Report for Colorado’s State Coverage Option. Denver, Colorado: Department of Regulatory Agencies and Department of Health Care Policy and Financing. https://www.colorado.gov/pacific/dora/proposal-state-option-health-care-coverage ↩︎
- Crowley, Ryan et. al.; Health and Public Policy Committee of the American College of Physicians. 2020. “Envisioning a Better U.S. Health Care System for All: Coverage and Cost of Care”. Annals of Internal Medicine. 172(2 Suppl.): S7-S32. https://annals.org/aim/fullarticle/2759529/envisioning-better-u-s-health-care-system-all-coverage-cost ↩︎
- The Boards of Trustees of the Federal Hospital Insurance and Federal Supplementary Medical Insurance Trust Funds. 2011. 2011 Annual Report of the Boards of Trustees of the Federal Hospital Insurance and Federal Supplementary Medical Insurance Trust Funds. Washington, D.C.: Centers for Medicare and Medicaid Services. https://www.cms.gov/Research-Statistics-Data-and-Systems/Statistics-Trends-and-Reports/ReportsTrustFunds/downloads/tr2011.pdf ↩︎
- Dobson, Allen, et. al. 2016. Estimating the Impact of Repealing the Affordable Care Act on Hospitals. Vienna, Virginia: Dobson DaVanzo & Associates, LLC. https://www.dobsondavanzo.com/clientuploads/Publications/Health_Care_Reform/FAH_&_AHA_ Impact_of_Repealing_the_ACA_on_Hospitals_Report_Attachment_11_30_16.pdf ↩︎
- Clemens, Jeffrey and Veuger, Stan. 2015. “Repeal of the Medicare Sustainable Growth Rate: Direct and Indirect Consequences”. AMA J. Ethics. 17(11): 1053-1058. https://journalofethics.ama-assn.org/article/repeal-medicare-sustainable-growth-rate-direct-and-indirect-consequences/2015-11 ↩︎
- Goldsmith, Jeff et. al. 2019. “Medicare Expansion: A Preliminary Analysis of Hospital Financial Impacts”. Navigant Consulting, Inc. https://www.navigant.com/-/media/www/site/insights/healthcare/2019/medicare-expansion-analysis.pdf ↩︎
- Reed, Abelson. 2019. “Hospitals Stand to Lose Billions Under ‘Medicare for All’”. The New York Times. April 21, 2019. https://www.nytimes.com/2019/04/21/health/medicare-for-all-hospitals.html ↩︎
- Cooper, Zack et. al. 2018. “The Price Ain’t Right? Hospital Prices and Health Spending on the Privately Insured”. National Bureau of Economic Research, Working Paper 21815. Cambridge, MA: National Bureau of Economic Research. https://www.nber.org/papers/w21815 ↩︎
- Kronick, Richard and Neyaz, Sarah. 2019. Private Insurance Payments to California Hospitals Average More Than Double Medicare Payments. Washington, D.C.: West Health Policy Center. https://assets-global.website-files.com/5c65bc6ef2c54007f2d69d05/5ce21ad67e30fb151b1f4caa_West%20Health%20Policy%20Center %20Hospital%20Pricing%20Analysis%20May%202019.pdf ↩︎
- Ginsburg, Paul. 2010. “Wide Variation in Hospital and Physician Payment Rates Evidence of Provider Market Power”. Center for Studying Health Systems Change, Research Brief No. 16. http://www.hschange.org/CONTENT/1162/#ib2 ↩︎
- White et. al. 2014. “Understanding Differences Between High- and Low-Price Hospitals: Implications for Efforts to Rein in Costs”. Health Affairs. 33(2): 324-331. https://www.healthaffairs.org/doi/10.1377/hlthaff.2013.0747 ↩︎
- Ge, Bai and Anderson, Gerard. 2018. “Market Power: Price Variation Among Commercial Insurers for Hospital Services”. Health Affairs. 37(10): 1615-1622. https://www.healthaffairs.org/doi/full/10.1377/hlthaff.2018.0567 ↩︎
- White, Chapin 2017. “Hospital Prices in Indiana: Findings from an Employer-Led Transparency Initiative”. Santa Monica, CA: RAND Corporation. https://www.rand.org/pubs/research_reports/RR2106.html ↩︎
- White, Chapin and Whaley, Christopher. 2019. “Prices Paid to Hospitals by Private Health Plans Are High Relative to Medicare and Vary Widely”. Santa Monica, CA: RAND Corporation. https://www.rand.org/pubs/research_reports/RR3033.html ↩︎
- White, Chapin 2017. “Hospital Prices in Indiana: Findings from an Employer-Led Transparency Initiative”. Santa Monica, CA: RAND Corporation. https://www.rand.org/pubs/research_reports/RR2106.html ↩︎
- Ginsburg, Paul. 2010. “Wide Variation in Hospital and Physician Payment Rates Evidence of Provider Market Power”. Center for Studying Health Systems Change, Research Brief No. 16. http://www.hschange.org/CONTENT/1162/#ib2 ↩︎
- White, Chapin et. al. 2013. “High and Varying Prices for Privately Insured Patients Underscore Hospital Market Power”. Center for Studying Health Systems Change, Research Brief No. 27. http://www.hschange.org/CONTENT/1375/1375.pdf ↩︎
- White, Chapin and Whaley, Christopher. 2019. “Prices Paid to Hospitals by Private Health Plans Are High Relative to Medicare and Vary Widely”. Santa Monica, CA: RAND Corporation. https://www.rand.org/pubs/research_reports/RR3033.html ↩︎
- Ge, Bai and Anderson, Gerard. 2018. “Market Power: Price Variation Among Commercial Insurers for Hospital Services”. Health Affairs. 37(10): 1615-1622. https://www.healthaffairs.org/doi/full/10.1377/hlthaff.2018.0567 ↩︎
- American Hospital Association. 2018. Trendwatch Chartbook 2018: Trends Affecting Hospitals and Health Systems. https://www.aha.org/guidesreports/2018-05-22-trendwatch-chartbook-2018 ↩︎
- Maeda, Jared and Nelson, Lyle. 2017. “An Analysis of Private Sector Prices for Hospital Admissions”. Washington, D.C.: Congressional Budget Office, Working Paper 2017-02. https://www.cbo.gov/system/files/115th-congress-2017-2018/workingpaper/52567-hospitalprices.pdf ↩︎
- Baker, Laurence et. al. 2016. “Medicare Advantage Plans Pay Less Than Traditional Medicare Pays”. Health Affairs. 35(8): 1444-1451. https://www.healthaffairs.org/doi/full/10.1377/hlthaff.2015.1553 ↩︎
- Cooper, Zack et. al. 2018. “The Price Ain’t Right? Hospital Prices and Health Spending on the Privately Insured”. National Bureau of Economic Research, Working Paper 21815. Cambridge, MA: National Bureau of Economic Research. https://www.nber.org/papers/w21815 ↩︎
- Wallace, Jacob and Song, Zirui 2016. “Traditional Medical Versus Private Insurance: How Spending, Volume, and Price Change at Age Sixty-Five”. Health Affairs. 35(5): 864-872. https://www.healthaffairs.org/doi/full/10.1377/hlthaff.2015.1195 ↩︎
- Wallace, Jacob and Song, Zirui 2016. “Traditional Medical Versus Private Insurance: How Spending, Volume, and Price Change at Age Sixty-Five”. Health Affairs. 35(5): 864-872. https://www.healthaffairs.org/doi/full/10.1377/hlthaff.2015.1195 ↩︎
- Medicare Payment Advisory Commission. March 2019. Report to the Congress: Medicare Payment Policy. Washington, D.C.: Medicare Payment Advisory Commission. http://www.medpac.gov/-documents-/reports ↩︎
- Medicare Payment Advisory Commission. 2019. Hospital Acute Inpatient Services Payment System. Washington, D.C.: Medicare Payment Advisory Commission. http://medpac.gov/docs/default-source/payment-basics/medpac_payment_basics_19_hospital_final_v2_sec.pdf?sfvrsn=0 ↩︎
- Medicare Payment Advisory Commission. 2019. Outpatient Hospital Services Payment System. Washington, D.C.: Medicare Payment Advisory Commission. http://medpac.gov/docs/default-source/payment-basics/medpac_payment_basics_19_opd_final_sec.pdf?sfvrsn=0 ↩︎
- Baker, Laurence et. al. 2016. “Medicare Advantage Plans Pay Less Than Traditional Medicare Pays”. Health Affairs. 35(8): 1444-1451. https://www.healthaffairs.org/doi/full/10.1377/hlthaff.2015.1553 ↩︎
- Kronick, Richard and Neyaz, Sarah. 2019. Private Insurance Payments to California Hospitals Average More Than Double Medicare Payments. Washington, D.C.: West Health Policy Center. https://assets-global.website-files.com/5c65bc6ef2c54007f2d69d05/5ce21ad67e30fb151b1f4caa_West%20Health%20Policy%20Center %20Hospital%20Pricing%20Analysis%20May%202019.pdf ↩︎
- Maeda, Jared and Nelson, Lyle. 2017. “An Analysis of Private Sector Prices for Hospital Admissions”. Washington, D.C.: Congressional Budget Office, Working Paper 2017-02. https://www.cbo.gov/system/files/115th-congress-2017-2018/workingpaper/52567-hospitalprices.pdf ↩︎
- White, Chapin et. al. 2013. “High and Varying Prices for Privately Insured Patients Underscore Hospital Market Power”. Center for Studying Health Systems Change, Research Brief No. 27. http://www.hschange.org/CONTENT/1375/1375.pdf ↩︎
- White, Chapin 2017. “Hospital Prices in Indiana: Findings from an Employer-Led Transparency Initiative”. Santa Monica, CA: RAND Corporation. https://www.rand.org/pubs/research_reports/RR2106.html ↩︎
- White, Chapin and Whaley, Christopher. 2019. “Prices Paid to Hospitals by Private Health Plans Are High Relative to Medicare and Vary Widely”. Santa Monica, CA: RAND Corporation. https://www.rand.org/pubs/research_reports/RR3033.html ↩︎
- American Hospital Association. 2018. Trendwatch Chartbook 2018: Trends Affecting Hospitals and Health Systems. https://www.aha.org/guidesreports/2018-05-22-trendwatch-chartbook-2018 ↩︎
- Selden, Thomas, et. al. 2015. “The Growing Difference Between Public and Private Payments for Inpatient Hospital Care”. Health Affairs. 34(12): 2147-2150. https://www.healthaffairs.org/doi/full/10.1377/hlthaff.2015.0706 ↩︎
- Selden, Thomas, et. al. 2015. “The Growing Difference Between Public and Private Payments for Inpatient Hospital Care”. Health Affairs. 34(12): 2147-2150. https://www.healthaffairs.org/doi/full/10.1377/hlthaff.2015.0706 ↩︎
- Selden, Thomas. 2020. “Differences Between Public And Private Hospital Payment Rates Narrowed, 2012–16”. Health Affairs. 39(1): 94-99. https://www.healthaffairs.org/doi/full/10.1377/hlthaff.2019.00415 ↩︎
- Trish, Erin et. al. 2017. “Physician Reimbursement in Medicare Advantage Compared with Traditional Medicare and Commercial Health Insurance”. JAMA Internal Medicine. 177(9): 1287-1295. https://jamanetwork.com/journals/jamainternalmedicine/fullarticle/2643349 ↩︎
- Pelech, Daria. 2018. “An Analysis of Private Sector Prices for Physicians’ Services”. Washington, D.C.: Congressional Budget Office, Working Paper 2018-01. https://www.cbo.gov/system/files/115th-congress-2017-2018/workingpaper/53441-workingpaper.pdf ↩︎
- Song, Zirui 2019. “The Pricing of Care Under Medicare for All: Implications and Policy Choices”. JAMA. 322(5): 395-396. https://jamanetwork.com/journals/jama/fullarticle/2737591 ↩︎
- White, Chapin and Whaley, Christopher. 2019. “Prices Paid to Hospitals by Private Health Plans Are High Relative to Medicare and Vary Widely”. Santa Monica, CA: RAND Corporation. https://www.rand.org/pubs/research_reports/RR3033.html ↩︎
- Ginsburg, Paul. 2010. “Wide Variation in Hospital and Physician Payment Rates Evidence of Provider Market Power”. Center for Studying Health Systems Change, Research Brief No. 16. http://www.hschange.org/CONTENT/1162/#ib2 ↩︎
- Pelech, Daria. 2018. “An Analysis of Private Sector Prices for Physicians’ Services”. Washington, D.C.: Congressional Budget Office, Working Paper 2018-01. https://www.cbo.gov/system/files/115th-congress-2017-2018/workingpaper/53441-workingpaper.pdf ↩︎
- Pelech, Daria. 2018. “An Analysis of Private Sector Prices for Physicians’ Services”. Washington, D.C.: Congressional Budget Office, Working Paper 2018-01. https://www.cbo.gov/system/files/115th-congress-2017-2018/workingpaper/53441-workingpaper.pdf ↩︎
- Biener, Adam and Selden, Thomas. 2017. “Public and Private Payments for Physician Office Visits”. Health Affairs. 36(12): 2160-2164. https://www.healthaffairs.org/doi/full/10.1377/hlthaff.2017.0749 ↩︎
- Trish, Erin et. al. 2017. “Physician Reimbursement in Medicare Advantage Compared with Traditional Medicare and Commercial Health Insurance”. JAMA Internal Medicine. 177(9): 1287-1295. https://jamanetwork.com/journals/jamainternalmedicine/fullarticle/2643349 ↩︎
- Medicare Payment Advisory Commission. March 2018. Report to the Congress: Medicare Payment Policy. Washington, D.C.: Medicare Payment Advisory Commission. http://www.medpac.gov/-documents-/reports ↩︎
- Biener, Adam and Selden, Thomas. 2017. “Public and Private Payments for Physician Office Visits”. Health Affairs. 36(12): 2160-2164. https://www.healthaffairs.org/doi/full/10.1377/hlthaff.2017.0749 ↩︎
- Medicare Payment Advisory Commission. March 2019. Report to the Congress: Medicare Payment Policy. Washington, D.C.: Medicare Payment Advisory Commission. http://www.medpac.gov/-documents-/reports ↩︎
- Song, Zirui 2019. “The Pricing of Care Under Medicare for All: Implications and Policy Choices”. JAMA. 322(5): 395-396. https://jamanetwork.com/journals/jama/fullarticle/2737591 ↩︎
- Medicare Payment Advisory Commission. 2019. Physician and Other Health Professional Payment System. Washington, D.C.: Medicare Payment Advisory Commission. http://medpac.gov/docs/default-source/payment-basics/medpac_payment_basics_19_physician_final_sec.pdf?sfvrsn=0 ↩︎
- Trish, Erin et. al. 2017. “Physician Reimbursement in Medicare Advantage Compared with Traditional Medicare and Commercial Health Insurance”. JAMA Internal Medicine. 177(9): 1287-1295. https://jamanetwork.com/journals/jamainternalmedicine/fullarticle/2643349 ↩︎
- Medicare Payment Advisory Commission. March 2019. Report to the Congress: Medicare Payment Policy. Washington, D.C.: Medicare Payment Advisory Commission. http://www.medpac.gov/-documents-/reports ↩︎
- Pelech, Daria. 2018. “An Analysis of Private Sector Prices for Physicians’ Services”. Washington, D.C.: Congressional Budget Office, Working Paper 2018-01. https://www.cbo.gov/system/files/115th-congress-2017-2018/workingpaper/53441-workingpaper.pdf ↩︎
- White, Chapin et. al. 2013. “High and Varying Prices for Privately Insured Patients Underscore Hospital Market Power”. Center for Studying Health Systems Change, Research Brief No. 27. http://www.hschange.org/CONTENT/1375/1375.pdf ↩︎
- Wallace, Jacob and Song, Zirui 2016. “Traditional Medical Versus Private Insurance: How Spending, Volume, and Price Change at Age Sixty-Five”. Health Affairs. 35(5): 864-872. https://www.healthaffairs.org/doi/full/10.1377/hlthaff.2015.1195 ↩︎
- Pelech, Daria. 2018. “An Analysis of Private Sector Prices for Physicians’ Services”. Washington, D.C.: Congressional Budget Office, Working Paper 2018-01. https://www.cbo.gov/system/files/115th-congress-2017-2018/workingpaper/53441-workingpaper.pdf ↩︎
- Ginsburg, Paul. 2010. “Wide Variation in Hospital and Physician Payment Rates Evidence of Provider Market Power”. Center for Studying Health Systems Change, Research Brief No. 16. http://www.hschange.org/CONTENT/1162/#ib2 ↩︎
- Song, Zirui 2019. “The Pricing of Care Under Medicare for All: Implications and Policy Choices”. JAMA. 322(5): 395-396. https://jamanetwork.com/journals/jama/fullarticle/2737591 ↩︎
- Medicare Payment Advisory Commission. March 2019. Report to the Congress: Medicare Payment Policy. Washington, D.C.: Medicare Payment Advisory Commission. http://www.medpac.gov/-documents-/reports ↩︎
- Trish, Erin et. al. 2017. “Physician Reimbursement in Medicare Advantage Compared with Traditional Medicare and Commercial Health Insurance”. JAMA Internal Medicine. 177(9): 1287-1295. https://jamanetwork.com/journals/jamainternalmedicine/fullarticle/2643349 ↩︎
- Wallace, Jacob and Song, Zirui 2016. “Traditional Medical Versus Private Insurance: How Spending, Volume, and Price Change at Age Sixty-Five”. Health Affairs. 35(5): 864-872. https://www.healthaffairs.org/doi/full/10.1377/hlthaff.2015.1195 ↩︎
- White, Chapin et. al. 2013. “High and Varying Prices for Privately Insured Patients Underscore Hospital Market Power”. Center for Studying Health Systems Change, Research Brief No. 27. http://www.hschange.org/CONTENT/1375/1375.pdf ↩︎
- Biener, Adam and Selden, Thomas. 2017. “Public and Private Payments for Physician Office Visits”. Health Affairs. 36(12): 2160-2164. https://www.healthaffairs.org/doi/full/10.1377/hlthaff.2017.0749 ↩︎
- Pelech, Daria. 2018. “An Analysis of Private Sector Prices for Physicians’ Services”. Washington, D.C.: Congressional Budget Office, Working Paper 2018-01. https://www.cbo.gov/system/files/115th-congress-2017-2018/workingpaper/53441-workingpaper.pdf ↩︎
- Ginsburg, Paul. 2010. “Wide Variation in Hospital and Physician Payment Rates Evidence of Provider Market Power”. Center for Studying Health Systems Change, Research Brief No. 16. http://www.hschange.org/CONTENT/1162/#ib2 ↩︎
- Medicare Payment Advisory Commission. March 2019. Report to the Congress: Medicare Payment Policy. Washington, D.C.: Medicare Payment Advisory Commission. http://www.medpac.gov/-documents-/reports ↩︎
- Medicare Payment Advisory Commission. March 2019. Report to the Congress: Medicare Payment Policy. Washington, D.C.: Medicare Payment Advisory Commission. http://www.medpac.gov/-documents-/reports ↩︎
- American Hospital Association. 2018. Trendwatch Chartbook 2018: Trends Affecting Hospitals and Health Systems. https://www.aha.org/guidesreports/2018-05-22-trendwatch-chartbook-2018 ↩︎
- American Hospital Association. 2020. Fact Sheet: Underpayment by Medicare and Medicaid. Chicago, IL: American Hospital Association. https://www.aha.org/fact-sheets/2020-01-07-fact-sheet-underpayment-medicare-and-medicaid ↩︎
- Dranove, David and Lindrooth, Richard. 2003. “Hospital Consolidation and Costs: Another Look at the Evidence.” Journal of Health Economics. 22: 983-997. https://www.ncbi.nlm.nih.gov/pubmed/14604556 ↩︎
- Dranove, David et. al. 2002. “Is Managed Care Leading to Consolidation in Health-Care Markets?” Health Services Research. 37(3): 573-594. https://www.ncbi.nlm.nih.gov/pmc/articles/PMC1434652/ ↩︎
- Gaynor, Martin and Vogt, William. 2003. “Competition Among Hospitals,” The RAND Journal of Economics. 34:764-785. https://www.nber.org/papers/w9471 ↩︎
- Gaynor, Martin et. al. 2015. “The Industrial Organization of Health-Care Markets.” Journal of Economic Literature. 53(2): 235-84. https://www.aeaweb.org/articles?id=10.1257/jel.53.2.235 ↩︎
- Feng, Yan et. al. 2015. “Association Between Market Concentration of Hospitals and Patient Health Gain Following Hip Replacement Surgery”. Journal of Health Services Research and Policy. 20(1): 11-17. https://www.ncbi.nlm.nih.gov/pmc/articles/PMC4268175/ ↩︎
- Neprash, Hannah, et. al. 2015. “Association of Financial Integration Between Physicians and Hospitals with Commercial Health Care Prices”. JAMA Internal Medicine. 175(12):1932-1939. https://jamanetwork.com/journals/jamainternalmedicine/fullarticle/2463591 ↩︎
- Anderson, Gerard et. al. 2003. “It’s the Prices, Stupid: Why the United States Is So Different From Other Countries”. Health Affairs. 22(3): 89-105. https://www.healthaffairs.org/doi/full/10.1377/hlthaff.22.3.89 ↩︎
- Anderson, Gerard et. al. 2019. “It’s Still the Prices, Stupid: Why the U.S. Spends So Much on Health Care, and a Tribute to Uwe Reinhardt”. Health Affairs. 38(1): 87-95. https://www.healthaffairs.org/doi/10.1377/hlthaff.2018.05144 ↩︎
- Cooper, Zack et. al. 2018. “The Price Ain’t Right? Hospital Prices and Health Spending on the Privately Insured”. National Bureau of Economic Research, Working Paper 21815. Cambridge, MA: National Bureau of Economic Research. https://www.nber.org/papers/w21815 ↩︎
- Burke, Leah and Ryan, Andrew. 2014. “The Complex Relationship Between Cost and Quality in U.S. Health Care”. AMA J. Ethics. 16(2): 124-130. https://journalofethics.ama-assn.org/article/complex-relationship-between-cost-and-quality-us-health-care/2014-02 ↩︎
- Fulton, Brent. 2017. “Health Care Market Concentration Trends in the United States: Evidence and Policy Responses”. Health Affairs. 36(9): 1530-1538. https://www.healthaffairs.org/doi/full/10.1377/hlthaff.2017.0556 ↩︎
- Roberts, Eric et. al. 2017. “Market Share Matters: Evidence of Insurer and Provider Bargaining Over Prices”. Health Affairs. 36(1): 141-148. https://www.healthaffairs.org/doi/full/10.1377/hlthaff.2016.0479 ↩︎
- Medicare Payment Advisory Commission. March 2019. Report to the Congress: Medicare Payment Policy. Washington, D.C.: Medicare Payment Advisory Commission. http://www.medpac.gov/-documents-/reports ↩︎
- Colorado Department of Health Care Policy and Financing. 2019. Cost Shift Analysis Report January 2019. Colorado Healthcare Affordability & Sustainability Enterprise. https://www.colorado.gov/pacific/sites/default/files/2019%20January%20HCPF%20Cost%20Shift %20Analysis%20Report%20Draft.pdf ↩︎
- Pelech, Daria. 2018. “An Analysis of Private Sector Prices for Physicians’ Services”. Washington, D.C.: Congressional Budget Office, Working Paper 2018-01. https://www.cbo.gov/system/files/115th-congress-2017-2018/workingpaper/53441-workingpaper.pdf ↩︎
- Ginsburg, Paul. 2010. “Wide Variation in Hospital and Physician Payment Rates Evidence of Provider Market Power”. Center for Studying Health Systems Change, Research Brief No. 16. http://www.hschange.org/CONTENT/1162/#ib2 ↩︎
- Medicare Payment Advisory Commission. March 2019. Report to the Congress: Medicare Payment Policy. Washington, D.C.: Medicare Payment Advisory Commission. http://www.medpac.gov/-documents-/reports ↩︎
- Stensland, Jeffrey; Gaumer, Zachary; Miller, Mark. 2010. “Private-Payer Profits Can Induce Negative Medicare Margins”. Health Affairs. 29(5): 1041-1051. https://www.healthaffairs.org/doi/full/10.1377/hlthaff.2009.0599 ↩︎
- Schulman, Kevin and Milstein, Arnold. 2019. “The Implications of ‘Medicare for All’ for U.S. Hospitals”. JAMA. 321(17): 1661-1662. https://jamanetwork.com/journals/jama/fullarticle/2730485 ↩︎
- Baker, Laurence et. al. 2014. “Physician Practice Competition and Prices Paid by Private Insurers for Office Visits”. JAMA. 312(16): 1653-1662. https://jamanetwork.com/journals/jama/fullarticle/1917436 ↩︎
- Clemens, Jeffrey and Gottlieb, Joshua. 2017. “In the Shadow of a Giant: Medicare’s Influence on Private Physician Payments”. Journal of Political Economy. 125(1): 1-39. https://www.nber.org/papers/w19503 ↩︎
- Dunn, Abe and Shapiro, Adam. 2014. “Do Physicians Possess Market Power?” Journal of Law and Economics. 57(1): 159-193. https://www.journals.uchicago.edu/doi/10.1086/674407?mobileUi=0& ↩︎
- Ginsburg, Paul. 2010. “Wide Variation in Hospital and Physician Payment Rates Evidence of Provider Market Power”. Center for Studying Health Systems Change, Research Brief No. 16. http://www.hschange.org/CONTENT/1162/#ib2 ↩︎
- Kleiner, Samuel et. al. 2015. “Market Power and Provider Consolidation in Physician Markets”. International Journal of Health Economics and Management. 15(1): 99-126. https://link.springer.com/article/10.1007/s10754-014-9160-y?shared-article-renderer ↩︎
- Medicare Payment Advisory Commission. March 2019. Report to the Congress: Medicare Payment Policy. Washington, D.C.: Medicare Payment Advisory Commission. http://www.medpac.gov/-documents-/reports ↩︎
- American Medical Association Council on Medical Service. 2010. Report 1 of the Council on Medical Service (I-11): Practice Expense Data and the Medicare Economic Index. Chicago, IL: American Medical Association. https://www.ama-assn.org/sites/ama-assn.org/files/corp/media-browser/public/about-ama/councils/Council%20Reports/council-on-medical-service/i11-cms-practice-expense-data-medicare-economic-index.pdf ↩︎
- Voytal, Drew and Gelburd, Mollie. 2019. “Medicare Reimbursement Falls Short of Care Delivery Costs”. Medical Group Management Association. https://www.mgma.com/data/data-stories/2019-medicare-reimbursement-rates ↩︎
- Medicare Economic Index Technical Advisory Panel. 2012. Report to the HHS Secretary: Review of the Medicare Economic Index. Cambridge, MA: Massachusetts Institute of Technology Sloan School of Management. https://www.cms.gov/Regulations-and-Guidance/Guidance/FACA/Downloads/MEI-Review-Report-to-HHS.pdf ↩︎
- Medicare Payment Advisory Commission. March 2019. Report to the Congress: Medicare Payment Policy. Washington, D.C.: Medicare Payment Advisory Commission. http://www.medpac.gov/-documents-/reports ↩︎
- Government Accountability Office. 2007. Geographic Areas Used to Adjust Physician Payments for Variation in Practice Costs Should Be Revised. Washington, D.C.: United States Government Accountability Office. https://www.gao.gov/new.items/d07466.pdf ↩︎
- Berenson, Robert and Goodson, John. 2016. “Finding Value in Unexpected Places – Fixing the Medicare Physician Fee Schedule”. New England Journal of Medicine. 374: 1306-1309. https://www.nejm.org/doi/full/10.1056/NEJMp1600999 ↩︎
- Gottlieb, Daniel et. al. 2010. “Prices Don’t Drive Regional Medicare Spending Variations”. Health Affairs. 29(3): 537-543. https://www.healthaffairs.org/doi/10.1377/hlthaff.2009.0609 ↩︎
- American Medical Association Council on Medical Service. 2010. Report 1 of the Council on Medical Service (I-11): Practice Expense Data and the Medicare Economic Index. Chicago, IL: American Medical Association. https://www.ama-assn.org/sites/ama-assn.org/files/corp/media-browser/public/about-ama/councils/Council%20Reports/council-on-medical-service/i11-cms-practice-expense-data-medicare-economic-index.pdf ↩︎
- Medicare Economic Index Technical Advisory Panel. 2012. Report to the HHS Secretary: Review of the Medicare Economic Index. Cambridge, MA: Massachusetts Institute of Technology Sloan School of Management. https://www.cms.gov/Regulations-and-Guidance/Guidance/FACA/Downloads/MEI-Review-Report-to-HHS.pdf ↩︎
- Burgette, Lane et. al. 2018. Practice Expense Methodology and Data Collection Research and Analysis. Santa Monica, CA: RAND Corporation. https://www.rand.org/pubs/research_reports/RR2166.html ↩︎
- Burgette, Lane et. al. 2018. Practice Expense Methodology and Data Collection Research and Analysis. Santa Monica, CA: RAND Corporation. https://www.rand.org/pubs/research_reports/RR2166.html ↩︎
- American Medical Association Council on Medical Service. 2010. Report 1 of the Council on Medical Service (I-11): Practice Expense Data and the Medicare Economic Index. Chicago, IL: American Medical Association. https://www.ama-assn.org/sites/ama-assn.org/files/corp/media-browser/public/about-ama/councils/Council%20Reports/council-on-medical-service/i11-cms-practice-expense-data-medicare-economic-index.pdf ↩︎
- Medicare Payment Advisory Commission. March 2019. Report to the Congress: Medicare Payment Policy. Washington, D.C.: Medicare Payment Advisory Commission. http://www.medpac.gov/-documents-/reports ↩︎
- Medicare Payment Advisory Commission. March 2015. Report to the Congress: Medicare Payment Policy. Washington, D.C.: Medicare Payment Advisory Commission. http://www.medpac.gov/-documents-/reports ↩︎
- Medicare Payment Advisory Commission. March 2018. Report to the Congress: Medicare Payment Policy. Washington, D.C.: Medicare Payment Advisory Commission. http://www.medpac.gov/-documents-/reports ↩︎
- Medicare Payment Advisory Commission. March 2019. Report to the Congress: Medicare Payment Policy. Washington, D.C.: Medicare Payment Advisory Commission. http://www.medpac.gov/-documents-/reports ↩︎