How Much Do Medicare Beneficiaries Spend Out of Pocket on Health Care?
Issue Brief
Many policymakers and presidential candidates are discussing proposals to build on Medicare in order to expand insurance coverage and reduce health care costs, and improve financial protections and lower out-of-pocket costs for people currently covered by Medicare. More than 60 million people ages 65 and older and younger people with long-term disabilities currently rely on Medicare to help cover their costs for health care services, including hospitalizations, physician visits, prescription drugs, and post-acute care. However, Medicare beneficiaries face out-of-pocket costs for their insurance premiums, cost sharing for Medicare-covered services, and costs for services that are not covered by Medicare, such as dental care and long-term services and supports.
In 2016, the average person with Medicare coverage spent $5,460 out of their own pocket for health care (Figure 1). This average includes spending by community residents and beneficiaries residing in long-term care facilities (5% of all beneficiaries in traditional Medicare). Among community residents alone, average out-of-pocket spending on premiums and health care services was $4,519 in 2016. But some groups of beneficiaries spent substantially more than others. Current Medicare-for-all proposals in Congress and from presidential candidates would largely eliminate out-of-pocket costs for premiums and patient cost sharing, including for people now covered under Medicare.
This analysis presents the most current data on out-of-pocket health care spending by Medicare beneficiaries, both overall and among different groups of beneficiaries. The analysis addresses three main questions:
- How much do Medicare beneficiaries spend out of pocket in total on health care premiums and health-related services, on average?
- How much do Medicare beneficiaries spend out of pocket on different types of health-related services?
- What share of income do Medicare beneficiaries spend on out-of-pocket health care costs?
The analysis is based on the most current year of out-of-pocket spending data available (2016) from the Medicare Current Beneficiary Survey (MCBS), a nationally representative survey of Medicare beneficiaries. The analysis includes beneficiaries living in the community and long-term care facility residents, and excludes beneficiaries enrolled in Medicare Advantage due to unverified reporting of events and spending for these beneficiaries in the MCBS. (See Methodology for details). All results presented in the text are statistically significant (see Appendix to access a downloadable table of results).
How much do Medicare beneficiaries spend out of pocket in total on premiums and services?
The graphic below shows how much the average person with traditional Medicare spent out of pocket for health care in 2016. Total out-of-pocket spending includes spending on medical and long-term care facility services and insurance premiums, with comparisons across different groups of beneficiaries.
Average Out-of-Pocket Health Care Spending by Traditional Medicare Beneficiaries in 2016
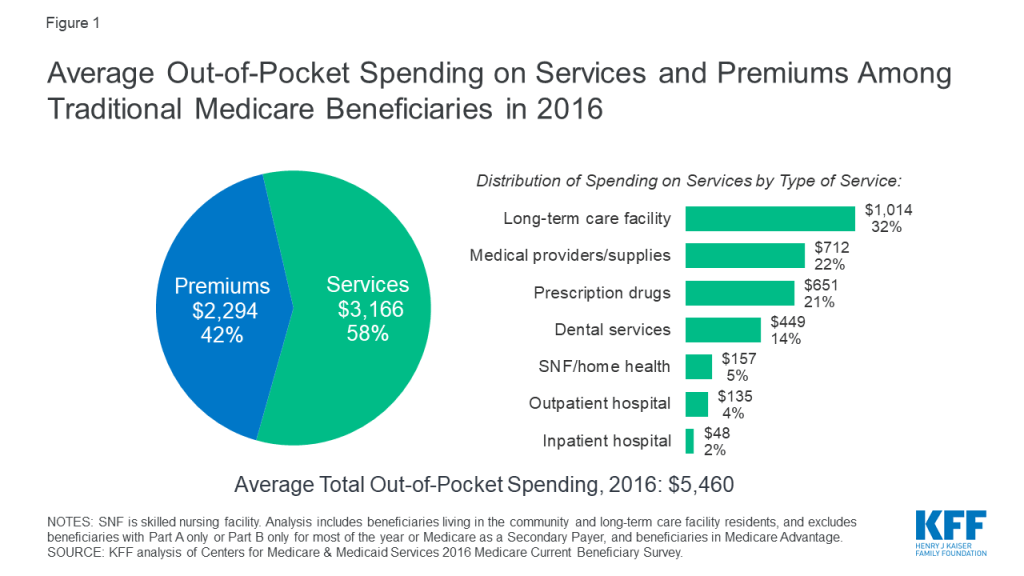
Our analysis shows that Medicare beneficiaries spent $5,460 out of their own pockets for health care in 2016, on average, with more than half (58%) spent on medical and long-term care services ($3,166), and the remainder (42%) spent on premiums for Medicare and other types of supplemental insurance ($2,294). This average includes spending by community residents and beneficiaries residing in long-term care facilities (5% of all beneficiaries in traditional Medicare). Among community residents alone, average out-of-pocket spending on premiums and health care services was $4,519 in 2016.
Average total out-of-pocket spending varies considerably across different groups of beneficiaries.
- The oldest beneficiaries in traditional Medicare, people ages 85 and older, spent more than twice as much out of pocket as beneficiaries between the ages of 65 and 74 ($10,307 versus $5,021). This difference was primarily due to significantly higher spending on long-term care facility services among beneficiaries in the oldest age group.
- Out-of-pocket spending by women in traditional Medicare was higher than out-of-pocket spending by men ($5,748 versus $5,104).
- Beneficiaries in poorer self-reported health, those with multiple chronic conditions, and those with any inpatient hospital utilization faced higher out-of-pocket costs than the average traditional Medicare beneficiary. For instance, beneficiaries with at least one inpatient stay in 2016 spent $7,613 out of pocket, on average, compared to $5,044 among those without an inpatient stay.
- Beneficiaries with no supplemental insurance spent more out of pocket than beneficiaries with some type of supplemental coverage. In 2016, nearly one in five (6.1 million) Medicare beneficiaries did not have any source of supplemental coverage, which placed them at greater risk of incurring high medical expenses. People without any source of supplemental coverage were also more likely to have modest incomes and be ages 85 or older. Out-of-pocket spending averaged $7,473 among beneficiaries with no supplemental coverage in 2016, compared to $5,202 among beneficiaries with employer-sponsored coverage, who also tend to have higher incomes, higher education levels, and are disproportionately white. Beneficiaries with Medicaid, however, incurred the lowest average out-of-pocket costs in 2016 ($2,665) compared to those with other coverage types or none whatsoever. Higher out-of-pocket spending among those with no supplemental coverage is due to higher spending on health-related services, because supplemental coverage helps Medicare beneficiaries pay their out-of-pocket costs for Medicare-covered services. For example, beneficiaries with employer-sponsored coverage spent $2,476 on health-related services in 2016, on average, while those with no supplemental coverage spent $5,776.
How much do Medicare beneficiaries spend out of pocket on different types of health-related services?
The graphic below shows average out-of-pocket spending for specific health and long-term care services by traditional Medicare beneficiaries in 2016, with comparisons across different groups of beneficiaries.
Average Out-of-Pocket Health Care Spending by Traditional Medicare Beneficiaries in 2016, by Type of Service
Of the total average per capita spending on health and long-term care services in 2016 ($3,166), Medicare beneficiaries spent the most on long-term care (LTC) facility services, which are not covered by Medicare ($1,014, or 32% of average out-of-pocket spending on services), followed by medical providers and supplies ($712; 22%), prescription drugs ($651; 21%), and dental services ($449; 14%). These estimates are averaged across all traditional Medicare beneficiaries including users and non-users of each service; average spending among users would be higher than the averages presented here.
Average out-of-pocket spending by service varies across different groups of beneficiaries. For example:
- Not surprisingly, beneficiaries living in long-term care facilities (5% of traditional Medicare beneficiaries overall) spent significantly more on LTC services than the average beneficiary in traditional Medicare in 2016 ($19,632 versus $1,014). Out-of-pocket spending was much higher among LTC facility residents who did not have Medicaid ($41,782), which is the primary source of public support for long-term care. Out-of-pocket spending on long-term care facility services was also higher among beneficiaries with certain types of chronic conditions, in particular, Alzheimer’s disease or other dementia ($9,565 on average; $27,308 among LTC residents only) and Parkinson’s disease ($4,120 on average; $28,165 among LTC residents only)—as these beneficiaries are more likely to reside in a long-term care facility than those with other conditions. Notably, these estimates of out-of-pocket spending on long-term care facility services are lower than the median estimated annual cost of a private room in a long-term care facility, which was $92,000 in 2016. One reason for the discrepancy is that the average out-of-pocket spending estimates from the MCBS include beneficiaries who resided in a LTC facility for less than a full year.
- Average spending on prescription drugs was higher for beneficiaries with multiple chronic conditions and those in relatively poor self-reported health status. In 2016, traditional Medicare beneficiaries with five or more chronic conditions spent $1,065 on prescription drugs, on average, compared to $416 among those with one or two chronic conditions; those in poor self-reported health spent $1,018 on drugs compared to $410 among those in excellent self-reported health. In a separate analysis of the out-of-pocket cost burden for specialty drugs, we found that out-of-pocket drug costs for Part D enrollees taking medications for selected conditions, including cancer, hepatitis C, multiple sclerosis, and rheumatoid arthritis, can exceed thousands of dollars annually on a single medication.
- In 2016, traditional Medicare beneficiaries spent an average of $449 out of pocket on dental services, which are typically not covered by Medicare. Out-of-pocket spending on dental care increased with income, likely because higher-income beneficiaries are better able to afford dental services, while those with lower incomes are more likely to go without needed dental care due to costs.
What share of income do Medicare beneficiaries spend on out-of-pocket health care costs?
The graphic below shows out-of-pocket spending on health-related services as a share of total per capita income, at the median, with comparisons across different subgroups of beneficiaries.
Median Out-of-Pocket Spending as a Share of Income for Traditional Medicare Beneficiaries in 2016
Our analysis shows that half of all beneficiaries in traditional Medicare spent at least 12% of their income on out-of-pocket health care costs in 2016. One quarter of all beneficiaries spent at least 23% of their incomes on health-related services in 2016, while 10% spent nearly half of their income (data not shown).
The median out-of-pocket health care spending burden varies by beneficiary subgroups. For example:
- The financial burden of health care as a share of income falls disproportionately on lower-income Medicare beneficiaries. Half of traditional Medicare beneficiaries with incomes below $10,000 spent at least 18% of their total per capita income on health care costs in 2016, compared to 7% for those with incomes of $40,000 or more. Having Medicaid coverage, however, significantly reduces the out-of-pocket spending burden among low-income beneficiaries. Beneficiaries with Medicaid spent just 5% of their total income on out-of-pocket health care costs in 2016.
- Medicare beneficiaries in older age groups face a higher out-of-pocket spending burden than younger beneficiaries. Half of traditional Medicare beneficiaries ages 85 and older spent at least 16% of their total income on out-of-pocket health care costs in 2016, compared to 12% among those ages 65 to 74.
- People with multiple chronic conditions or in poorer health spend more on health care out-of-pocket than those in better health. For example, beneficiaries with five or more chronic conditions spent 14% of their income on out-of-pocket health care costs in 2016, compared to 8% among those with zero conditions. Those with any inpatient hospital stay in 2016 spent 17% of their income on out-of-pocket health care costs, compared to 11% among those without a hospital stay that year.
Discussion
In 2016, people with traditional Medicare spent an average of $5,460 out of pocket for health care expenses, including premiums, cost sharing, and costs for services not covered by Medicare. Half of all traditional Medicare beneficiaries spent at least 12% of their total per capita income on health care. Although Medicare has helped make health care more affordable for people with Medicare, many beneficiaries face high out-of-pocket costs for care they receive, including costs for services that are not covered by Medicare—in particular, long-term care services. Some groups of beneficiaries face substantially higher out-of-pocket costs than others, including women, those ages 85 and over, those who are in poorer self-reported health and who have multiple chronic conditions, and those with no supplemental coverage.
The fact that traditional Medicare does not have an annual out-of-pocket limit and does not cover certain services that older adults are more likely to need may undermine the financial security that Medicare provides, especially for people with significant needs and limited incomes. Addressing these gaps would help to alleviate the financial burden of health care for people with Medicare, although doing so would also increase federal spending and taxes.
Juliette Cubanski, Wyatt Koma, and Tricia Neuman are with KFF.Anthony Damico is an independent consultant.
Methodology
Data Overview
This interactive analysis is based on data from the Centers for Medicare & Medicaid Services (CMS) Medicare Current Beneficiary Survey (MCBS) Cost Supplement for 2016, the most recent year available. The MCBS is a survey of a nationally-representative sample of the Medicare population, including both aged and disabled enrollees who are living in the community as well as facility residents. The dataset integrates survey information reported directly by beneficiaries with Medicare administrative data. Survey-reported data includes the demographics of respondents, such as sex, age, race, living arrangements, income, health status, and physical functioning, the use and costs of health care services, and supplementary health insurance arrangements.
The survey also collects information on inpatient and outpatient hospital care, physician and other medical provider services, home health services, durable medical equipment, long-term and skilled nursing facility services, hospice services, dental services, and prescription drugs. Survey-reported information is matched to and supplemented by administrative records and billing and claims-level data when possible. Extensive efforts are made to verify the accuracy of survey reports and to reconcile discrepancies using administrative bill data to produce a more complete and reliable dataset.
Beneficiary Population
Our analysis includes beneficiaries in traditional Medicare for most of their enrollment in 2016, and excludes beneficiaries enrolled in Part A or Part B only, those with Medicare as a Secondary Payer, and those enrolled in Medicare Advantage plans for most of their enrollment in 2016. For Medicare Advantage enrollees, it is not possible to verify survey-reported events in the MCBS with administrative claims data, as is done for beneficiaries in traditional Medicare. This has the effect of biasing downward survey-reported out-of-pocket spending amounts for Medicare Advantage enrollees compared to beneficiaries with traditional Medicare. It is not possible to determine whether observed differences are real or due to underlying differences in the data collection, verification, and imputation process for out-of-pocket spending by beneficiaries in traditional Medicare and Medicare Advantage. Therefore, we exclude Medicare Advantage enrollees (unweighted n=2,726) to avoid introducing bias associated with underreporting of events and spending for this population.
We also excluded beneficiaries who were enrolled in only Part A or Part B (unweighted n=298) and those with Medicare as a Secondary Payer (unweighted n=231) for most of their Medicare enrollment in 2016 Because Medicare is typically not the primary payer for those who are enrolled in only Part A or Part B but not both programs, beneficiaries with only Part A or Part B also have significantly lower average total out-of-pocket spending relative to those enrolled in both Part A and B, which is the rationale for excluding them from the analysis of out-of-pocket spending.
After excluding these groups of enrollees, our sample for the analysis of spending as a share of total income included 5,369 respondents in traditional Medicare (32.7 million weighted) in 2016. We analyze out-of-pocket spending among all traditional Medicare beneficiaries and by specific beneficiary subgroups, including age (under 65, 65-74, 75-84, 85 and over), gender (female, male), age by gender, race (white non-Hispanic, black non-Hispanic, Hispanic), race by gender, race by age, marital status (married, divorced/separated, widowed, single (never married)), education level (less than high school, high school graduate, some college, college graduate), per capita income categories (increments of $10,000), self-reported health status (excellent, very good, good, fair, poor), number of chronic conditions (none, 1-2, 3-4, 5 or more), Census region (Northeast, Midwest, South, West), metropolitan area (metropolitan, rural micropolitan, rural adjacent or nonadjacent), type of residence (community, facility), supplemental coverage (employer-sponsored insurance (ESI), Medicaid, Medigap, none), hospital use (no inpatient stay, any inpatient stay, one inpatient stay, two or more inpatient stays), and specific chronic conditions.
Out-of-Pocket Health Care Spending
Out-of-pocket spending for medical and long-term care services reported in the MCBS is not the same as beneficiary liability or the Medicare cost-sharing amount for services used. Instead, out-of-pocket spending amounts are net of payments by any third-party payers, such as payments by Medicaid, Medigap, or employer-sponsored insurance. Survey-reported out-of-pocket payments are those payments made by the beneficiary or their family, including direct cash payments or in the form of Social Security or Supplemental Security Income (SSI) checks to a nursing home.
Out-of-pocket spending on premiums is derived from administrative data on Medicare Part A, Part B, and Part D premiums for each sample person along with survey-reported estimates of premium spending for other types of health insurance beneficiaries may have (including Medigap, employer-sponsored insurance, and other public and private sources). Part B premium amounts reported in the MCBS include income-related premiums paid by beneficiaries with higher incomes (more than $85,000 per individual/$170,000 per married couple). The administrative data reflect liability, not the actual payments made by beneficiaries for their premiums, which overstates actual premiums paid for certain groups of beneficiaries who are not responsible for paying their Medicare premiums. People who are dually-eligible for Medicaid are generally not liable for their Part A, Part B, or Part D premiums; those who receive the Part D low-income subsidy are eligible for full or partial coverage of their Part D premium. For these groups of beneficiaries, we adjusted the premium estimates reported in the MCBS to reflect the premium subsidies they receive. For beneficiaries reported as receiving the Part D low-income subsidy but who were not enrolled in benchmark plans (based on Part D contract IDs in the MCBS), we assigned premiums based on plan-specific data from the 2016 Part D landscape file.
The medical and long-term care services included in this analysis are:
- Dental services: Includes cleaning, x-rays, repair, purchase or repair of dentures, and orthodontic procedures. The basic unit measuring use of these services is a single visit to the dentist, where a variety of services might be rendered.
- Inpatient hospital services: Includes inpatient hospital stays, including emergency room visits which result in an inpatient admission. The basic unit measuring use of inpatient hospital services is a single admission.
- Long-term care facility services: Includes individual long-term care facility events; a long-term care facility is defined as having three or more beds and providing long-term care services throughout the facility or in a separately identifiable unit. The basic unit measuring use of long-term care facility services is a “stay” in a nursing home or other long-term care facility. Stays are measured in terms of days of residence in that facility.
- Medical providers/supplies: Includes medical doctor and practitioner visits; diagnostic laboratory and radiology; medical and surgical services; and durable medical equipment and non-durable supplies, such as eyeglasses or contact lenses and hearing aids, orthopedic items such as canes, walkers, wheelchairs and corrective shoes, diabetic supplies, oxygen supplies and equipment. The basic unit measuring use of these services is a separate visit, procedure, service, or a supplied item for a survey reported event.
- Outpatient hospital services: Includes outpatient visits to the outpatient department or outpatient clinic of a hospital, as well as emergency room visits that do not result in a hospital admission. The basic unit measuring use of outpatient services is a separate visit to any part of the outpatient department for a survey-reported event.
- Prescription drugs: Includes individual outpatient prescribed medicine events, including drugs provided to enrollees in Medicare Part D drug plans; excludes prescription medicines provided by the doctor or practitioner as samples and those provided in an inpatient setting. A small number of Part B drugs (physician-administered) are collected as survey-reported data in the MCBS prescription medicines data file. However, the data added from claims is only from Part D. There are no survey-reported drugs administered by a physician matched from the Part B administrative claims data. The basic unit measuring use of prescription drugs is a single purchase of a single drug in a single container.
- Skilled nursing facility services: Includes short-term institutional stays, such as skilled nursing home stays or rehabilitation hospital stays; excludes inpatient hospital admissions and long-term care facility stays. The basic unit measuring use of these services is an admission.
Income
The MCBS includes a measure of total income for individual respondents and their spouses, if applicable. However, the MCBS does not report all sources of income that some beneficiaries may have. As in many other surveys, income is self-reported, with beneficiaries asked to report total annual income for themselves and their spouses (where applicable) from all sources, including earnings, Social Security, pensions, and asset income. However, beneficiaries are not asked to report specific income amounts by source, and some types of income may go unreported or may be underestimated. Therefore, this measure results in an overall underreporting of income, particularly for those with relatively high incomes. This conclusion is based on a comparison of MCBS income estimates to income estimates from DYNASIM3, in which we measured the divergence of MCBS and DYNASIM income estimates at each percentile of per capita income.
We used the results of this comparison to derive adjustment factors for each percentile with which to rescale each MCBS respondent’s income. In general, this produced estimates of MCBS respondents’ income that are higher than self-reported values and that we believe are a more accurate representation of income among people on Medicare. We then combined this adjusted income estimate with per capita out-of-pocket spending estimates in the MCBS to derive a more reliable estimate of Medicare beneficiaries’ per capita out-of-pocket health care spending as a share of total income than one based on MCBS self-reported income data alone.
Overview of Methods
To estimate total out-of-pocket spending per beneficiary in traditional Medicare, we calculate for each sample person aggregate estimates of out-of-pocket spending on both insurance premiums for Medicare Parts A, B, and D and supplemental insurance coverage, and medical and long-term care services reported in the MCBS. These amounts are averaged across the entire sample of traditional Medicare beneficiaries and weighted to be representative of the traditional Medicare beneficiary population or specific subgroups of beneficiaries. Analysis of spending by type of service includes beneficiaries who did and did not use each type of service. References to “total out-of-pocket spending” in this analysis always include both premiums and service spending. We also often refer to the separate components of total spending (either out-of-pocket spending on services or premiums) in presenting results. For some beneficiary subgroups, estimates of out-of-pocket spending by service type may not add up to the total for all services due to missing data related to small sample size.
To measure per capita out-of-pocket health care spending as a share of per capita total income, we computed for each individual a ratio of out-of-pocket spending to total per capita income, arrayed the individual ratios of annual out-of-pocket spending to annual income from low to high and computed the median for the entire group of traditional Medicare beneficiaries, and by beneficiary subgroups.
Due to missing data related to small sample size, we are unable to show the median out-of-pocket spending as a share of income for beneficiaries who had Medicaid for part of the year and lived in the community. Similarly, we are unable to show the median out-of-pocket spending as a share of income for Medicare beneficiaries who are black and under the age of 65.