Nursing Facilities, Staffing, Residents and Facility Deficiencies, 2009 Through 2016
Executive Summary
Nursing facilities are one part of the long-term care delivery system that also includes home and community based services, but their relatively high cost has led them to be the focus of much attention from policymakers. Medicaid plays a major role in financing nursing facility care in the United States, and policy proposals to limit federal financing for Medicaid may lead to cuts in eligibility or scope of coverage for long-term care services. In addition, regulations effective November 2016 aimed to address longstanding challenges in quality and safety in nursing facilities. As the demand for long term care continues to increase and policy proposals and regulations unfold, the characteristics, capacity, and care quality of facilities remain subjects of concern among consumers and policy makers.
This report provides information on recent trends in nursing facilities in the United States, drawing on data from the federal On-line Survey, Certification, and Reporting system (OSCAR) and Certification and Survey Provider Enhanced Reports (CASPER), to provide information on nursing facility characteristics, resident characteristics, facility staffing, and deficiencies by state from 2009 through 2016. Additional detail on the survey and methods underlying the data in this report are provided in the Appendix at the end of the report. This information enables policymakers and the public to monitor and understand recent changes in nursing facility care in the United States and helps highlight areas of ongoing interest for policymaking.
#Medicaid is the primary payer source for most certified nursing facility residents, with more than six in ten (62%) residents—about 832,000 people—having Medicaid as their primary payer in 2016.
Findings
Facility Characteristics
Facility characteristics provide a picture of who provides nursing facility care in the United States, including the number and capacity of facilities, certification and ownership, and revenue sources. Nationwide, the number of nursing facility beds has been fairly consistent since 2009, reaching 1.6 million certified beds in 2016 (with an average of 109 beds per facility). However, nursing facility occupancy rates declined slightly from 2009 to 2016, from 84 percent in 2009 to 81 percent in 2016. States vary in their average facility size and occupancy rates, with states in the East generally having larger facilities and higher occupancy rates.
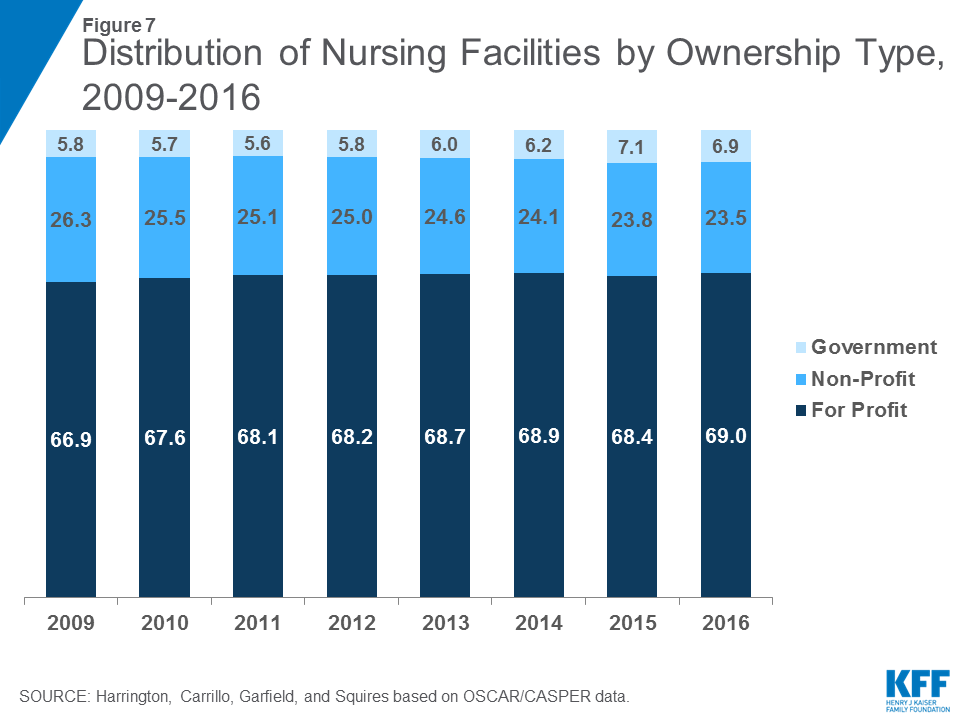
Over the 2009 to 2016 period, share of nursing facilities that were for-profit increased slightly, from 67% in 2009 to 69% in 2016, while the share that were non-profit declined slightly from 26% in 2009 to 24% in 2016 (the remainder, about 7% over time, were government-owned). Ownership patterns vary widely across states, with states in the South and West having higher shares of facilities that are for-profit. In addition, more than half of facilities over this period were owned or leased by multi-facility organizations (chains that have two or more facilities), though the share of nursing facilities that are chain-owned varies by state.
Medicaid is the primary payer source for most certified nursing facility residents, with more than six in ten (62%) residents—about 832,000 people—having Medicaid as their primary payer in 2016. States in the East, particularly the Southeast, have higher shares of residents with Medicaid as their primary payer than other states (Figure ES-1).

Resident Characteristics
Resident characteristics affect the environment of the facility and also require different levels and types of staff resources. While nearly all residents in a nursing facility require some level of assistance, some facilities may have residents with a greater level of need. On average, in 2016, residents’ level of need for assistance with activities of daily living scored 5.8 on a scale from 3 to 9, and levels of need have been fairly stable since 2009. Residents commonly have mobility impairments, which range from difficulty walking to inability to get oneself out of bed. While relatively few (4%) residents were bed-bound in 2016, over six in ten (65%) of residents depend on a wheelchair for mobility or are unable to walk without extensive or constant support from others. Another common health care need of nursing facility residents is treatments related to bladder or bowel incontinence. However, there is still a notable discrepancy between the high percentage of residents with incontinence problems and the low percentage of residents in training programs to address these problems.
Cognitive and behavioral health is of particular concern for nursing facility residents. Nearly half (45%) of residents had a dementia diagnosis in 2016, and 32% had other psychiatric conditions such as schizophrenia, mood disorders, or other diagnoses. In addition, nearly two-thirds (63%) of residents received psychoactive medications, including anti-depressants, anti-anxiety drugs, sedatives and hypnotics, and anti-psychotics, in 2016. Over-use of anti-psychotic medications has been the focus of recent policy attention, particularly their use among residents with dementia, and is the subject of regulations for nursing facility care. Use of physical restraints is another area of concern for residents with cognitive problems. Federal law and ongoing education about the negative effects of restraints have led to a decline in their use over time, and the share of residents with physical restraints was under one percent in 2016.
Staffing Levels
Over the past 25 years, numerous research studies have documented a significant relationship between higher nurse staffing levels, particularly RN staffing, and the better outcomes of care. Though several recommendations for minimum staffing levels have been put forth, there are not federal requirements for specific nurse staffing levels (though some states do have their own minimum staffing requirements). In 2016, total nursing hours (including RNs, LPN/LVNs, and NAs) averaged 4.1 hours per resident day, an increase from 3.9 in 2009, but there was wide state variation in average nursing hours per resident day. Nationwide, many of these hours are accounted for by non-licensed nursing care (i.e., nursing assistants).
Facility Deficiencies
Nursing facilities provide care to prevent problems and to address the needs of residents, but sometimes care does not meet established standards. State surveyors assess both the process and the outcomes of nursing facility care for 175 individual requirements across eight major areas. Where a facility fails to meet a requirement, a deficiency or citation is given to the facility for that individual requirement. Between 2009 and 2013, the average number of deficiencies per facility declined from 9.33 to 7.28, though there was a slight increase between 2013 and 2016, with 8.76 deficiencies on average in 2016. The share of facilities with no deficiencies increased slightly from 2011 (6.88%) to 2013 (8.07%) then dropped to 6.5% in 2016. In 2016, the most common deficiencies were given for failures in infection control, accident environment, food sanitation, quality of care, and pharmacy consultation. Of particular concern are deficiencies that cause harm or immediate jeopardy to residents. In 2016, more than one in five facilities received a deficiency for actual harm or jeopardy. As with other outcomes, there was wide variation across states in these outcomes; however, some states had high rates across all top ten deficiencies.
Discussion
Recent trends in facility characteristics can help policymakers spot potential areas of concern and plan for future system needs. For example, while nursing facility capacity has remained fairly flat from 2009 to 2016, occupancy rates have declined, perhaps reflecting a shift from institutional to community-based long-term care. Still, overall demand for long-term care services may increase in coming years as the “baby boom” generation ages, and states and policy makers can use this information to determine sufficient capacity to accommodate long-term care user choice in both institutional and community-based settings. In addition, continuing a trend that started before 2009, the share of nursing facilities that are for-profit or chain-owned continued to grow slightly from 2009 to 2016. These facility characteristics are important to policymakers and consumers because of their link to poorer quality of care, and continued monitoring of facility ownership by states can help to ensure that a high quality of care is provided at these facilities. With Medicaid as the primary payer for most nursing facility residents, policy and payment for nursing facility care is a priority policy area for state and federal governments that finance it. Changes to federal Medicaid financing could have repercussions for states’ ability to maintain Medicaid spending for long-term services and supports.
Notable shares of nursing facility residents have extensive behavioral or physical health needs, and facilities’ ability to meet these needs is the subject of ongoing policy attention. Nursing assistants who provide most of the care to these individuals often have limited training in working with this population. Some may interpret residents’ behavior as aggressive or have difficulty managing these residents’ needs. Despite regulations to limit the use of psychoactive medication, relatively high shares of residents still receive these medications, indicating an ongoing problem with chemical restraints. This pattern may be indicative of nursing facilities lacking systematic plans to address the needs of residents with dementia or other cognitive impairments. Regulations could implement ACA requirements to improve the quality of care for residents with cognitive impairments and further restrict the use of psychotropic agents.
Last, the data show that nursing facility deficiencies have declined between 2009 and 2016, though there is still much state variation in rates of deficiencies. While voluntary guidelines for compliance programs have been in place for many years, the ACA authorized new, mandatory compliance programs to improve quality of care. Regulations effective November 2016 implement these requirements, building on existing requirements for quality assessment and assurance programs to address quality deficiencies. Moving forward, it will be important to continue to monitor deficiency reports to understand whether and how new requirements are affecting care and outcomes and to identify additional areas of concern for future policy changes.
Report: Introduction
Nursing facilities are a major provider of long-term care services in the United States. These facilities provide medical, skilled nursing, and rehabilitative services on an inpatient basis to individuals who need assistance performing activities of daily living, such as bathing and dressing. Nursing facilities are one part of the long-term care delivery system that also includes home and community based services, but their relatively high cost has led them to be the focus of much attention from policymakers. Medicaid plays a major role in financing nursing facility care in the United States, and policy proposals to limit federal financing for Medicaid may lead to cuts in eligibility or scope of coverage for long-term care services. In addition, regulations effective November 2016 aimed to address longstanding challenges in quality and safety in nursing facilities. As the demand for long term care continues to increase and policy proposals and regulations unfold, the characteristics, capacity, and care quality of facilities remain subjects of concern among consumers and policy makers.
This report provides information on recent trends in nursing facilities in the United States, drawing on data from the federal On-line Survey, Certification, and Reporting system (OSCAR) and more recent Certification and Survey Provider Enhanced Reports (CASPER). We use these databases to provide information on nursing facility characteristics, resident characteristics, facility staffing, and deficiencies by state from 2009 through 2016. This information enables policymakers and the public to monitor and understand recent changes in nursing facility care in the United States and help highlight areas of ongoing interest for current and future policymaking.
Background
Long-term care includes medical and personal care assistance that people may need – for weeks, months, or years – when they experience difficulty completing self-care tasks as a result of aging, chronic illness, or disability. While many people’s long-term care service needs can be met in the community, some may choose or require care in facilities. Nursing facility care is costly: a year of care typically costs over $82,000,1 and national spending on nursing facilities across all payers totaled $162.7 billion in 2016.2 Much of the cost of nursing facility care is publicly-financed through Medicaid, making it a high priority for state and federal policymakers.
In addition, a particular concern to consumers, professionals, and policy-makers is the quality of care provided in nursing facilities. In response to a request from Congress, the Institute of Medicine (IOM) completed a Study on Nursing Home Regulation in 19863 that reported widespread quality of care and oversight problems and recommended the strengthening of federal regulations for nursing homes.4 The IOM Committee recommendations and the active efforts of many consumer advocates resulted in Congress passing Nursing Home Reform Legislation as part of the Omnibus Budget Reconciliation Act (OBRA) in 1987.5
OBRA 1987, implemented by federal regulations in 1990 and in 1995, mandated a number of changes. The regulations eliminated the priority hierarchy of conditions, standards, and elements that were in the prior regulations. The merger of Medicare and Medicaid standards and processes raised standards for Medicaid-participating facilities. The Act also mandated more rigorous inspection procedures and the use of intermediate sanctions for regulatory violations and required surveyors to focus on quality outcomes.6 The federal law also required comprehensive assessments of all nursing facility residents to determine their care needs and to use this information in the care planning process.7 The law specifically required nursing facilities to provide sufficient nursing, medical, and psychosocial services to attain and maintain the highest possible mental and physical functional status of residents. The law focused on outcomes of care (such as incontinence, immobility, and pressure ulcers) as well as the protection of residents’ rights and the establishment of quality of life requirements. The provisions of the law were implemented by the Centers for Medicare & Medicaid Services (CMS) over a ten-year period.
The 2010 Affordable Care Act (ACA) further expanded quality of care requirements for nursing facilities that participate in Medicare and Medicaid.8 The ACA incorporates the Nursing Home Transparency and Improvement Act of 2009, introduced because complex ownership, management, and financing structures were inhibiting regulators’ ability to hold providers accountable for compliance with federal requirements. The ACA also incorporates the Elder Justice Act and the Patient Safety and Abuse Prevention Act, which include provisions to protect nursing facility residents from abuse and other crimes. Under these laws, nursing facilities face standards regarding disclosing financial relationships and costs; reporting requirements for nurse staffing; and improvements to compliance and ethics programs. There are also rules regarding monetary penalties for lack of compliance with federal regulations; notification requirements when a facility closes; additional staff training on dementia care; and provisions for background checks and reporting criminal activity. While implementation of many nursing facility provisions in the ACA was delayed, comprehensive regulations effective November 2016 implement these and other changes to both improve patient care and safety and reduce reporting and procedural burden on facilities.9
Since 1998, CMS has published limited information on nursing facilities through its Nursing Home Compare website. In 2008, CMS added the Nursing Home Five-Star Quality Rating System, which provides individual and composite ratings for nursing facilities based on health inspections, nurse staffing hours, and selected quality measures. ACA requirements led CMS to update and improve the Nursing Home Compare website, and over time, CMS has added new indicators and information about complaints and modified its star rating system to make it more difficult to achieve a better star rating.10 ,11
This report provides information on nursing facility characteristics, resident characteristics, facility staffing, and deficiencies by state from 2009 through 2016. The deficiency data include all deficiencies from the annual survey and any complaint surveys during each calendar year. The data source, originally the federal On-line Survey, Certification, and Reporting system (OSCAR), was converted to the Certification and Survey Provider Enhanced Reports (CASPER) in 2012.12 Because OSCAR/CASPER data changes frequently throughout the year as facilities add new data (and older ones are deleted), our analysis may have slightly different exact figures than those reported elsewhere. Additional details on the survey and methods underlying the data in this report are provided in the Appendix at the end of the report.
Report: Facility Characteristics
Facility characteristics provide a picture of who provides nursing facility care in the United States, including the number and capacity of facilities, certification and ownership, and revenue sources.
Capacity and Occupancy
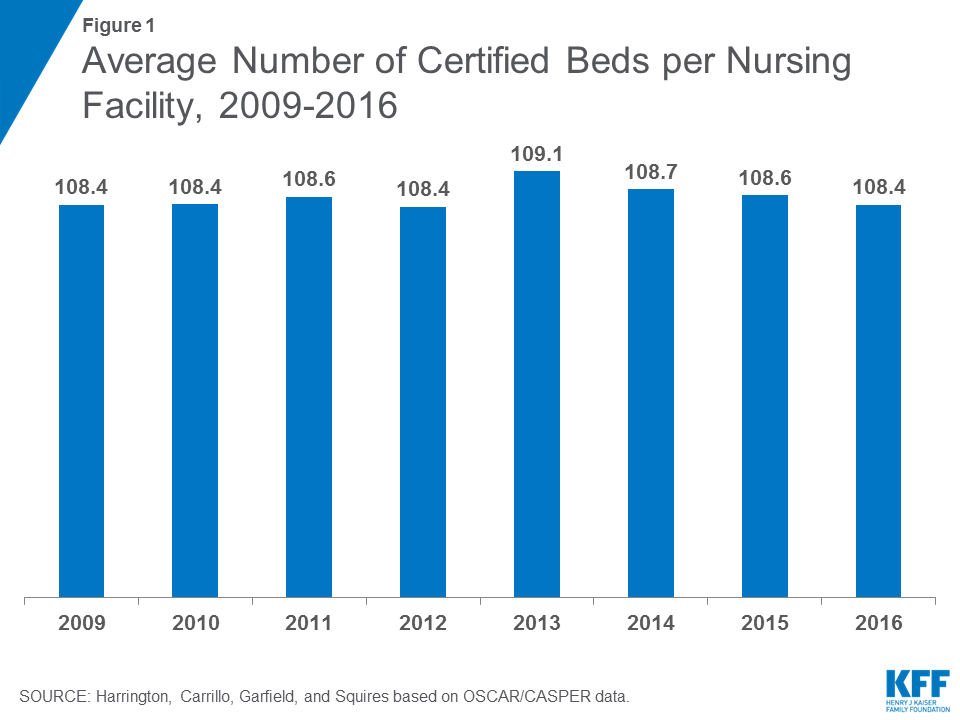
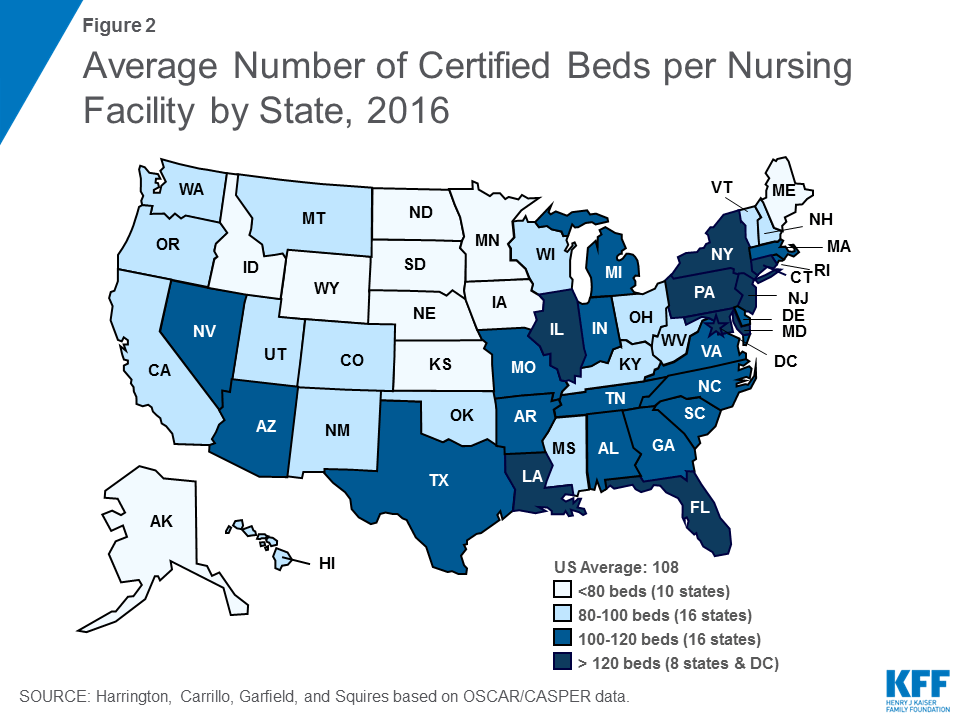
The number of beds that are certified for Medicare and Medicaid residents are an indication of nursing facility capacity in a state. There were 15,452 certified nursing facilities surveyed in 2016, out of approximately 15,640 certified facilities in the U.S.13 Not all facilities are surveyed by state agencies during a calendar year. In terms of number of beds, there were 1.644 million certified beds in nursing facilities that were surveyed in 2016 (uncertified beds are excluded), compared to 1.664 million in 2009 (state-by-state and trend data on number of facilities and number of beds is available in the Supplemental Tables). The number of certified nursing beds per facility is calculated by dividing the total number of certified beds in a state by the total number of certified facilities in the state. In 2016, the overall average facility size was 108.37 beds, almost the same as 2009 (108.42) (Figure 1 & Table 1). However, states vary in their average facility size, with states in the East generally having larger facilities and states in the Mid-West having the smallest facilities (Figure 2).
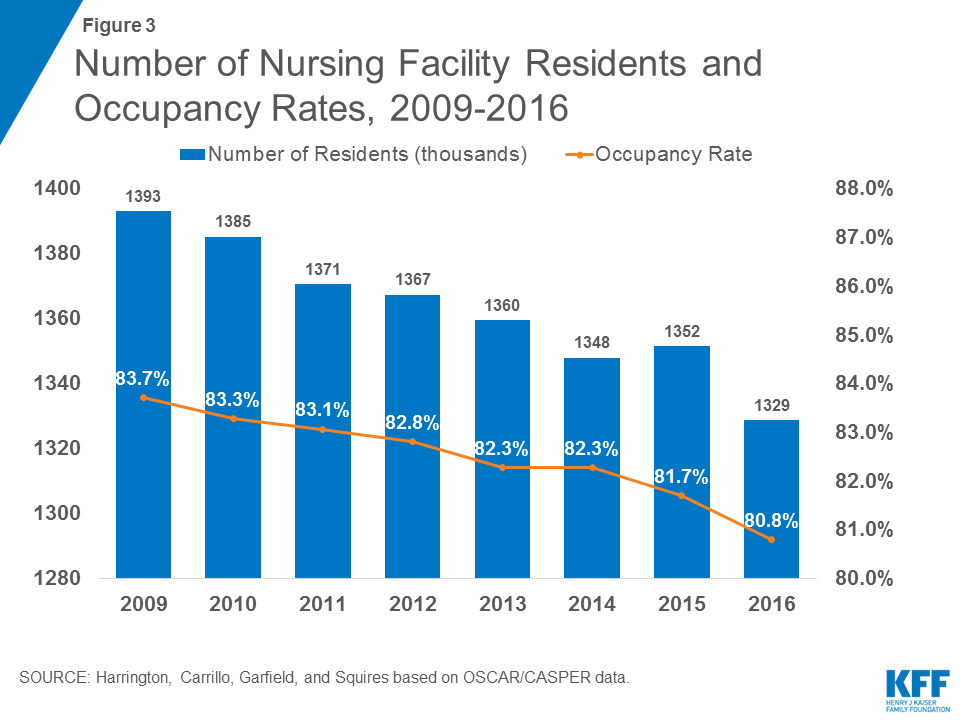
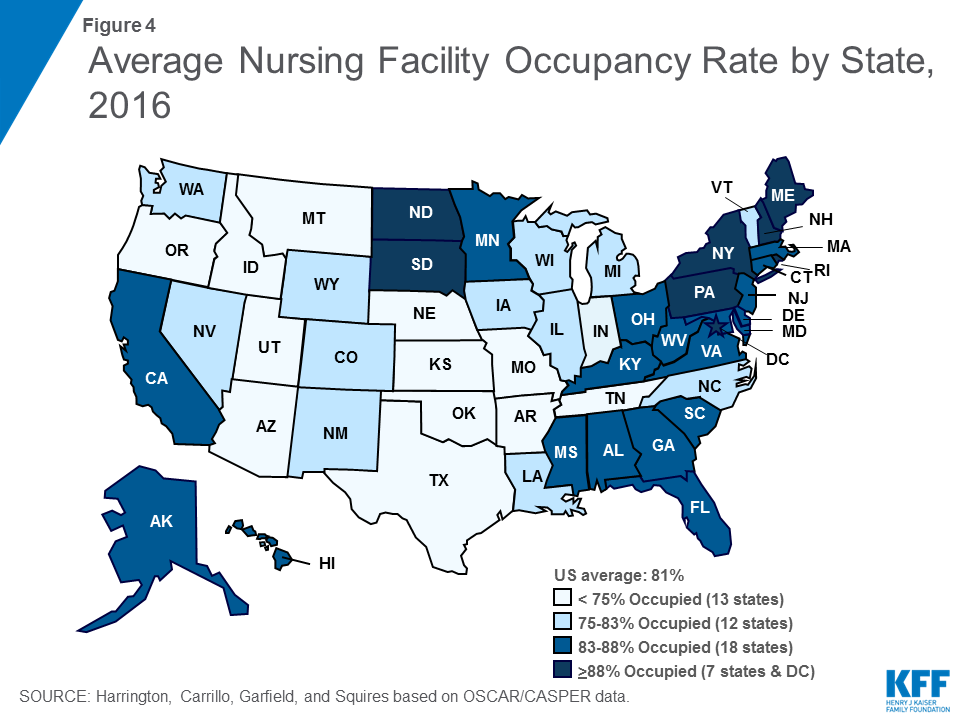
Occupancy rates also are important in showing the potential availability of beds; further, occupancy rates may influence the quality and financial status of the facility.14 Facility occupancy rates are calculated by dividing the number of nursing residents in a certified facility by the total number of certified beds (excluding all uncertified residents and beds). The total number of nursing facility residents in certified nursing facilities has been declining somewhat over time, from 1.393 million in 2009 to 1.329 million in 2016 (excluding residents in uncertified beds) (Figure 3 and Table 2). Correspondingly, the average certified nursing facility occupancy rate declined slightly from 2009 to 2016, from 83.7 percent in 2009 to 80.8 percent in 2016. States in the East generally have higher occupancy rates than other states (Figure 4). Occupancy rates have been declining over time even before this period, providing some evidence of an excess supply of nursing home beds in many areas.15
Certification Category and Payer Source
Licensed nursing facilities may apply to be certified for participation in the Medicare and/or Medicaid program on a voluntary basis. Facilities may apply to participate in: (1) only the Medicaid (Title XIX) program, (2) only the Medicare (Title XVIII) program, or (3) the Medicare/Medicaid dually certified (Titles XVIII and XIX) program. Since 1991, the Medicare program classified facilities as skilled nursing facilities (SNFs), while Medicaid-certified facilities are designated as “nursing facilities” (NFs). Certification requirements are detailed in federal regulations at 42 CFR Part 483. Federal Medicare rules allow for all or part of a facility to be certified.
The percentage of Medicare and Medicaid patients in a facility is an important factor in not only revenue sources but also other aspects of a facility. Nursing facilities have historically considered Medicaid reimbursement rates to be low and prefer Medicare and private pay patients.16 Higher Medicaid reimbursement rates have been associated with higher staffing and higher care quality.17 ,18 ,19
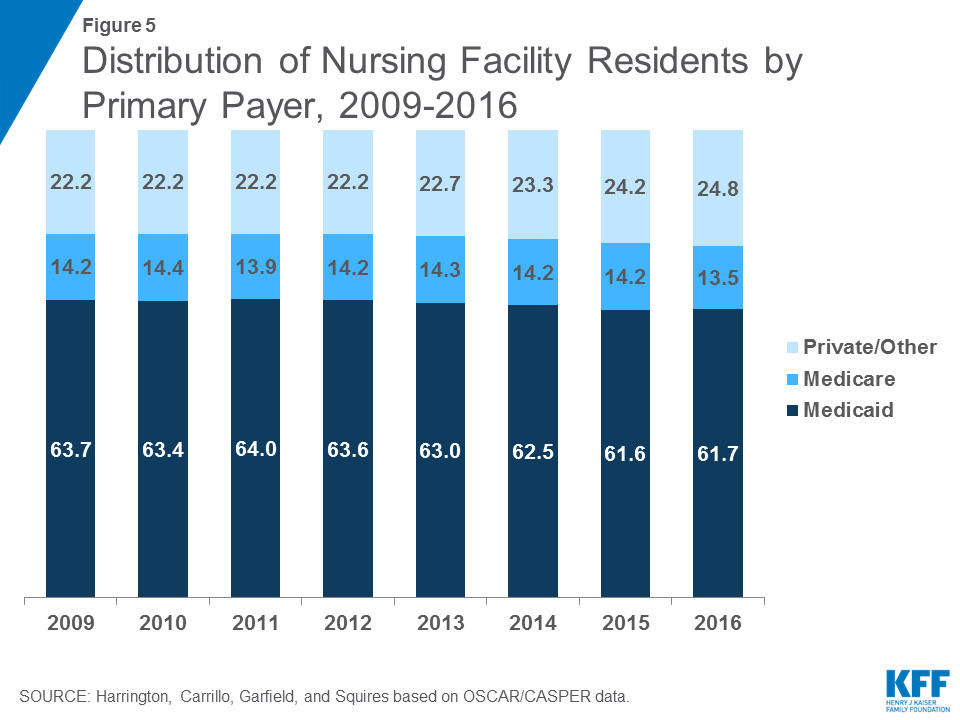
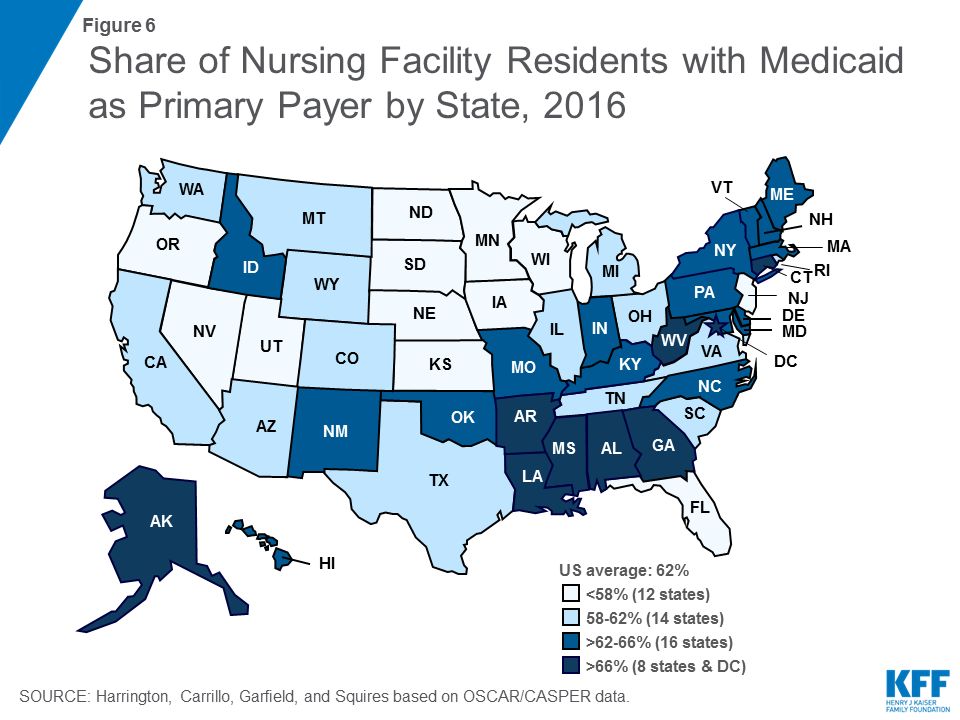
The vast majority (96.2%) of beds were dually certified by both Medicare and Medicaid in 2016, with very few certified for only Medicare (2.3%) or only Medicaid (1.6%) (See Supplemental Tables for additional detail). While most beds are dually certified, Medicaid is the primary payer source for most certified nursing facility residents (Figure 5 and Table 3). Medicaid may become the primary payer of nursing facility services once residents have exhausted or spent down personal assets paying for care. In 2016, 61.7 percent of total residents had Medicaid as their primary payer (down slightly from 63.7 in 2009), which equates to more than 832,000 people nationwide at any given time (Table 4). States in the East, particularly the Southeast, have higher shares of residents with Medicaid as their primary payer than other states (Figure 6). Medicare, which covers only short stays in nursing facilities, was primary payer for 13.5 percent of the total residents in 2016, compared to 14.2% in 2009. Private payers (primarily out-of-pocket payments from residents) and other sources are the primary payer for the remainder of residents (24.8% in 2016).
Ownership and Affiliation
One of the major debates in research circles is whether the proprietary nature of the nursing facility industry affects process and outcomes in terms of quality of care. Research studies of ownership and quality show that for-profit facilities generally have lower overall quality of care.20 ,21 There are higher rates of deficiencies in for-profit facilities and chains than non-profit and government facilities.22 Thus, proprietary ownership and chains may be associated with lower staffing levels and poorer process and outcome measures.
Nursing facility ownership patterns show that the large majority of nursing facilities were proprietary in the 2009-2016 period. In 2016, 69.0 percent of surveyed facilities were for-profit facilities, while 23.5 were non-profit facilities and 6.9 were government owned (Figure 7 and Table 5). The share of nursing facilities that are for-profit has increased slightly over time, while the share that is non-profit has declined slightly over time.
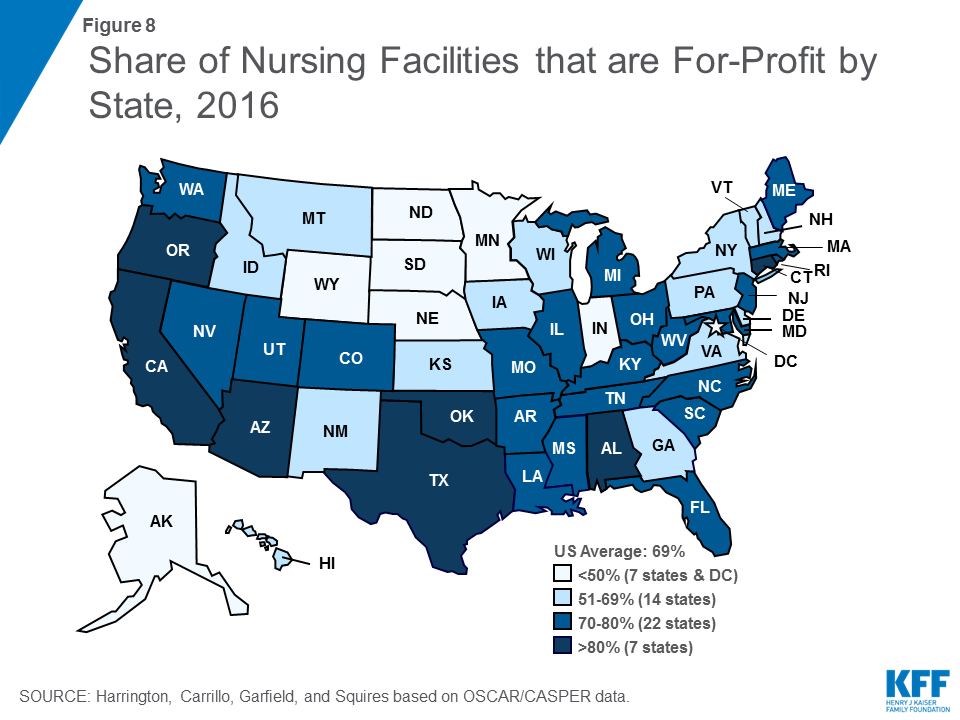
Ownership patterns vary widely across states (Figure 8). Alaska, Indiana, and Wyoming had relatively high shares (>33%) of facilities that were government owned in 2016. More than half of facilities in Alaska, the District of Columbia, Minnesota, North Dakota, and South Dakota were non-profit facilities in 2016. In Alabama, Arizona, California, Connecticut, Oklahoma, Oregon, and Texas, more than 80 percent of facilities were for-profit in 2016.
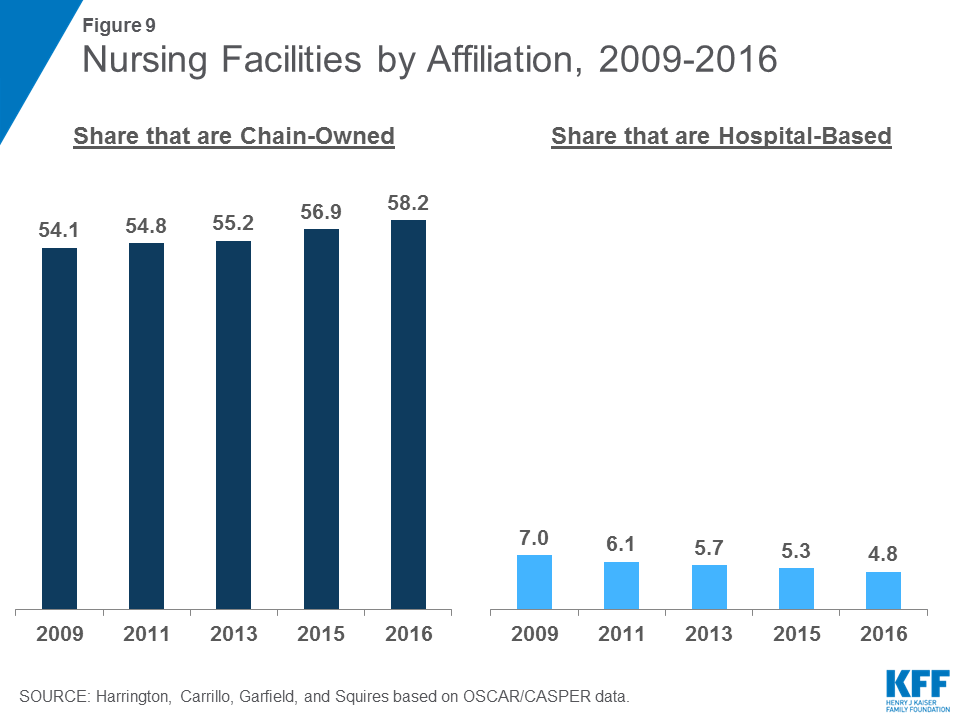
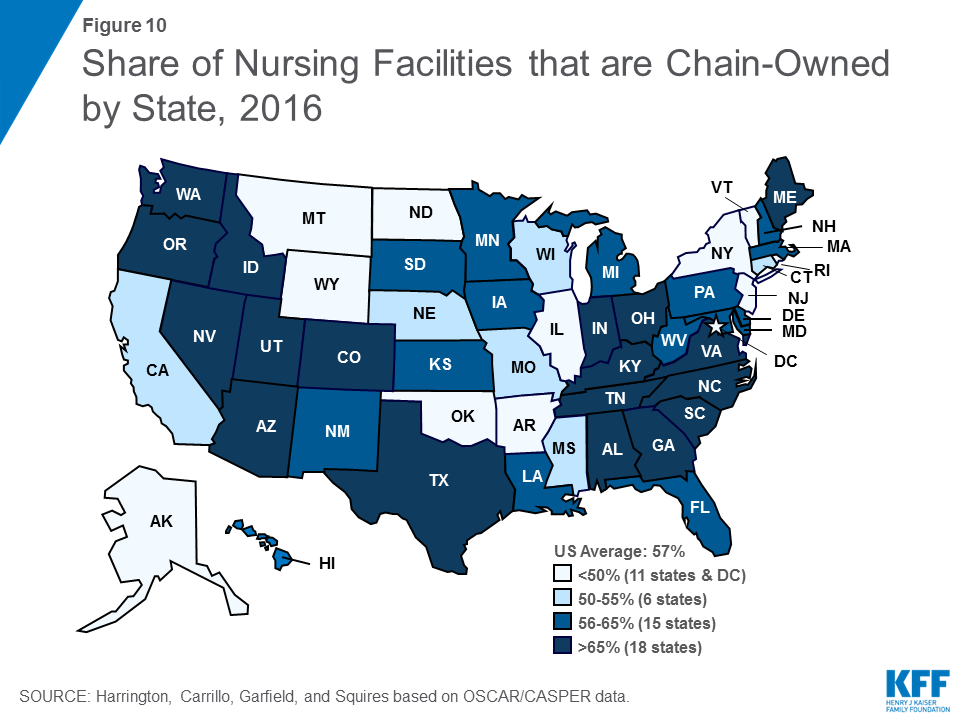
Hospital-based nursing facilities may have higher quality of care because they have more Medicare patients (with associated higher reimbursement rates) and higher staffing levels. The share of facilities that are certified as hospital-based has decreased slightly over time, from 7.0 percent in 2009 to 4.8 percent of all facilities in 2016 (Figure 9). This decline continues an earlier pattern that occurred after the introduction of the Medicare prospective payment system for nursing facilities in 1998. More than half (58.2 percent) of facilities in 2016 were owned or leased by multi-facility organizations (chains that have two or more facilities), a slight increase since 2009 (54.1%). The share of nursing facilities that are chain-owned varies by state (Figure 10).
It is important to note that other facility characteristics are also associated with quality. Having accreditation may be positively associated with higher staffing levels and with higher quality of care. The existence of dedicated special care units, such as those for persons with Alzheimer’s disease, may also be associated with higher quality of care because of higher staffing levels. Large size facilities have been associated with lower quality, although findings are mixed.23 Larger facilities tend to have lower staffing and perhaps have more difficulty in managing the quality of care.
Resident Groups/ Family Groups
Under federal regulations, nursing facility residents have the right to form organized resident groups, which meet regularly to discuss and offer suggestions about policies and procedures affecting residents’ care, treatment, and quality of life; to support each other; to plan resident and family activities; to participate in educational activities or for any other purposes. Facilities also may have organized groups of family members who meet regularly to discuss issues about residents’ care, treatment, and quality of life. In 2016, most facilities (96%) had resident groups (See Supplemental Tables for more detail), though a smaller share (22.6%) report having family groups. The share of facilities with family groups has declined over time. Those facilities with organized residents groups or organized family groups may have higher quality of care.24
Report: Resident Characteristics
Nursing facilities vary in the type of residents they serve. Resident characteristics affect the environment of the facility. Moreover, the special characteristics of nursing facility residents require different levels and types of staff resources and affect the facility’s success in providing high quality care. A number of nursing facility resident classification systems have been developed and are often referred to as “case mix” indicators (see Appendix for more detail on data sources on resident characteristics). Below, we summarize characteristics of residents using data available in the OSCAR/CASPER database.
Level of Need for Assistance with Activities of Daily Living
While nearly all residents in a nursing facility require some level of assistance, some facilities may have residents with a greater level of need. Table 6 shows the average score for residents needing assistance with eating, toileting, and transferring from surfaces, such as to and from a bed, chair, or wheelchair, or to and from a standing position, in facilities by state. Each state has an average score from 1 to 3 in terms of residents’ need for assistance, where 1 indicates the lowest need and 3 the greatest need. The U.S. average resident need was 1.67 for eating assistance, 2.08 for toileting assistance, and 2.04 for transferring assistance in 2016. Each of these scores has been fairly consistent since 2009. Table 6 also shows the average summary scores for these three activities of daily living for all facilities in each state. The average resident need score for eating, toileting, and transferring for all facilities surveyed in the U.S. was 5.80 in 2016.
Mobility Impairments
Mobility impairments range from difficulty walking to inability to get oneself out of bed and are another indication of the level of need among residents. As shown in Table A, on average 3.7 percent of residents were bed-bound in 2016, meaning they were in a bed or recliner for 22 or more hours per day in the week before the survey. The share of residents who are bed-bound declined slightly between 2009 and 2012 but has increased slightly since then. A larger share (65.3%) of residents are chairbound, meaning they depend on a wheelchair for mobility or are unable to walk without extensive or constant support from others. Contractures, which are restrictions in full range of motion of any joint due to deformity, disuse and pain, are common problems of nursing facility residents. In 2016, more than one in five (22.0%) residents was reported as having contractures.
Lack of mobility can lead to health problems for nursing facility residents. Pressure ulcers (or bedsores) are areas of the skin and underlying tissues that erode as a result of pressure or friction and/or lack of blood supply. The severity of the ulcer ranges from persistent skin redness (without a break in the skin) to large open lesions that can expose skin tissue and bone. The acquiring of pressure sores in a facility is considered an indicator of poor quality of care, as it reflects patients spending extended time in one position or location. Sometimes, residents receive special skin care, which is non-routine care according to a resident care plan or physician’s order, usually designed to prevent or reduce pressure ulcers of the skin. In 2016, more than three quarters (76.4%) of nursing facility residents received special skin care, while 6.2 percent of residents had pressure sores (Table A).
| Table A: Nursing Facility Resident Characteristics Related to Mobility Impairment and Physical Restraint, 2009-2016 | ||||||||
| Share of Residents | 2009 | 2010 | 2011 | 2012 | 2013 | 2014 | 2015 | 2016 |
| Bedfast | 3.9 | 3.6 | 3.6 | 3.5 | 3.6 | 3.7 | 3.7 | 3.7 |
| Chairbound | 56.8 | 56.6 | 50.6 | 48.1 | 61.4 | 64.3 | 64.8 | 65.3 |
| Contractures | 28.6 | 26.3 | 24.3 | 24.4 | 23.8 | 23.3 | 22.7 | 22.0 |
| Pressure Sores | 6.5 | 6.5 | 6.3 | 6.2 | 6.1 | 6.1 | 6.2 | 6.1 |
| Special Skin Care | 77.9 | 76.2 | 74.7 | 75.2 | 75.6 | 76.0 | 76.5 | 76.4 |
Physical Health and Special Care Needs
Some nursing facility residents need advanced care (beyond assistance with activities of daily living) for physical health problems. Rates of receipt of this type of care are an indication not only of the health needs of residents but also of the scope of services provided by facilities.
Among the most common special health care needs of nursing facility residents are treatments related to bladder or bowel incontinence (Table B). In 2016, more than six in ten (63.5%) nursing facility residents had bladder incontinence, and more than four in ten (44.8%) had bowel incontinence. Some residents receive services through bladder (23.5%) or bowel (14.9%) training programs, which are designed to assist residents to gain and maintain bladder control (such as by pelvic exercises or frequent toileting) or bowel control (through the use of diet, fluids, and regular schedules). Participation in both types of programs has increased substantially since 2009. However, there is still a notable discrepancy between the high percentage of residents with incontinence problems and the low percentage of training programs. Sometimes, indwelling catheters, tubes used to drain urine from the bladder, are used, although the use of catheters is considered an indicator of poor quality of care. In 2016, about 6 percent of facility residents were reported to be using catheters, a rate that has been fairly stable since 2009. Last, a small share of residents (less than 3 percent) receives ostomy care, which includes special care for a skin opening to the intestinal and/or urinary tract such as a colostomy (opening to the colon).
Rehabilitation services are provided under the direction of a rehabilitation professional (physical therapist, occupational therapist, etc.) to improve functional ability. In 2016, nearly 32 percent of residents in nursing facilities received such services, up slightly from 26 percent in 2009. Rates of rehabilitation services have been increasing over time, perhaps related to changes in the Medicare prospective payment system for nursing facilities.25
| Table B: Nursing Facility Resident Characteristics Related to Physical Health and Special Care Needs, 2009-2016 | ||||||||
| Share of Residents | 2009 | 2010 | 2011 | 2012 | 2013 | 2014 | 2015 | 2016 |
| Bladder Incontinence | 55.4 | 55.7 | 58.0 | 59.9 | 61.3 | 61.8 | 62.7 | 63.5 |
| Bowel Incontinence | 43.5 | 43.7 | 45.1 | 47.8 | 43.6 | 43.4 | 44.2 | 44.8 |
| Bladder Training | 6.5 | 7.4 | 9.1 | 10.9 | 23.7 | 24.2 | 23.9 | 23.5 |
| Bowel Training | 3.5 | 3.7 | 4.3 | 5.7 | 14.6 | 15.1 | 15.0 | 14.9 |
| Indwelling Catheter | 6.1 | 6.0 | 6.0 | 5.9 | 5.8 | 5.7 | 5.9 | 5.7 |
| Ostomy Care | 4.7 | 4.4 | 3.6 | 3.1 | 2.8 | 2.6 | 2.5 | 2.5 |
| Rehabilitation | 25.7 | 26.2 | 26.6 | 26.8 | 28.8 | 30.7 | 31.8 | 32.2 |
| Injections | 21.3 | 21.2 | 21.3 | 21.5 | 21.8 | 21.6 | 21.5 | 21.3 |
| Intravenous Therapy | 2.4 | 2.2 | 2.0 | 2.0 | 1.6 | 1.5 | 1.6 | 1.6 |
| Respiratory Treatment | 14.7 | 15.1 | 15.6 | 16.0 | 15.7 | 15.5 | 15.8 | 15.8 |
| Tube Feeding | 5.5 | 5.3 | 5.3 | 5.1 | 5.0 | 4.8 | 4.7 | 4.5 |
Other less common special health care services include injections to deliver medication and intravenous therapy and/or blood transfusions to provide fluid, medications, nutritional substances, and blood products for residents. In 2016, 21.3 percent of residents received injections and less than two percent received IV therapy. Respiratory treatment is provided through respirators/ventilators, oxygen, inhalation therapy, and other treatment, and in 2016, more than 15 percent of facility residents received respiratory therapy. Last, nearly 5 percent of residents required tube feedings to provide nutritional substances directly into the gastrointestinal system.
Cognitive and Behavioral Health
Cognitive and behavioral health is of particular concern for nursing facility residents. Federal regulations from OBRA 1987 require screening of all new residents to ensure that those who have intellectual, developmental, or cognitive disabilities are placed in appropriate facilities where they receive services designed to meet their needs. State officials are required to certify that those individuals with intellectual or developmental disabilities who are placed in nursing facilities are receiving appropriate services. In 2016, approximately 2 percent of nursing facility residents were reported to have a developmental disability (including mild to profound mental retardation), a slight decrease since 2009 (Table C). Other cognitive problems, often associated with aging, are more common among nursing facility residents. Nearly half (45.3 percent) of residents were reported by facilities and states as having a dementia diagnosis in 2016.
With respect to behavioral health problems, the percent of residents with other psychiatric conditions, such as schizophrenia, mood disorders, and other diagnoses, was 32% in 2016. Psychoactive medications, including anti-depressants, anti-anxiety drugs, sedatives and hypnotics, and anti-psychotics, are often used to treat behavioral health problems. In 2016, nearly two-thirds (63.1%) of residents in facilities in the U.S. were reported to be receiving such medications. Federal regulations prohibit the use of anti-psychotics and other psychoactive drugs unless such drugs are shown to be necessary for particular resident conditions. However, because depression is frequently under-diagnosed and anti-depressants may sometimes be under-prescribed, educational efforts are focused on the appropriate use of anti-depressants.26 As detailed in the discussion section of this report, over-use of anti-psychotic medications has been the focus of recent policy attention, particularly their use among residents with dementia. CMS is now reporting the use of anti-psychotic medications as a poor quality measure on the Nursing Home Compare website.27
Physical restraints include physical or mechanical devices, material or equipment that cannot be easily removed by residents to restrict freedom of movement or normal access to one’s own body. Physical restraints are used to prevent falls or other injury among residents, but research has found that there can be significant negative physical and psychosocial effects to use of restraints.28 Since 1987, federal law has limited the use of physical restraints to prohibit their use for discipline or staff convenience, and the use of restraints has declined significantly.29 However, research has also shown that restraints are more likely to be used for residents with cognitive impairment or mental illness.30 The share of residents with physical restraints has declined over time, reaching 0.9 percent in 2016. The reduction may have been related to regulations and ongoing training about the negative effects of restraints on residents.
| Table C: Nursing Facility Resident Characteristics Related to Cognitive and Behavioral Health, 2009-2016 | ||||||||
| Share of Residents: | 2009 | 2010 | 2011 | 2012 | 2013 | 2014 | 2015 | 2016 |
| Developmental Disability | 2.9 | 2.7 | 2.3 | 2.2 | 2.2 | 2.2 | 2.2 | 2.2 |
| Dementia | 46.2 | 46.4 | 47.2 | 47.6 | 47.4 | 46.4 | 45.7 | 45.3 |
| Other Psychological Diagnosis | 23.5 | 24.1 | 26.3 | 28.0 | 30.0 | 31.1 | 31.5 | 32.1 |
| Receive Psychoactive Medications | 65.4 | 65.3 | 65.7 | 64.0 | 64.4 | 64.2 | 63.5 | 63.1 |
| Physical Restraints | 3.5 | 3.0 | 2.9 | 2.6 | 2.2 | 1.7 | 1.4 | 0.9 |
Report: Staffing Levels
Over the past 25 years, numerous research studies have documented a significant relationship between nurse staffing levels, particularly RN staffing, and the outcomes of care.31 The benefits of higher staffing levels, especially RNs, include lower mortality rates; improved physical functioning; less antibiotic use; fewer pressure ulcers, catheterized residents, and urinary tract infections; lower hospitalization rates; and less weight loss and dehydration.32 ,33 ,34 ,35 ,36 ,37 Moreover, in states that have introduced higher minimum staffing standards for nursing facilities, nurse staffing levels and quality outcomes have improved.38 ,39 ,40 ,41 The evidence from research studies led the Institute of Medicine to conclude that the preponderance of evidence from a number of studies with different types of quality measures shows a positive relationship between nursing staffing and quality of nursing facility care.42 ,43 ,44
Several recommendations for minimum staffing levels have been put forth. A CMS study in 2001 established the importance of having 1.3 hours per resident day (hprd) of licensed nursing care (including 0.75 registered nurse (RN) hprd) and 2.8 certified nursing assistant (CNA) hprd, for a total of 4.1 nursing hprd to prevent harm or jeopardy to residents. An expert panel recommended minimum staffing levels of 4.55 hours per resident day,45 including all RNs, LVNs, and nursing assistants. However, in spite of calls for mandatory minimum staffing standards, CMS and Congress have not implemented specific nurse staffing levels (IOM, 2003).46 ,47 ,48 The Nursing Home Reform Act of 1987 required nursing facilities to have sufficient nursing staff to provide nursing and related services to attain or maintain the highest practicable physical, mental, and psychosocial well-being of residents. Facilities must also have a registered nurse as a Director of Nursing for at least eight consecutive hours a day, seven days a week and licensed nurses on-site twenty-four hours a day. Some states also have their own minimum staffing requirements, although these are generally lower than the levels recommended by experts.49
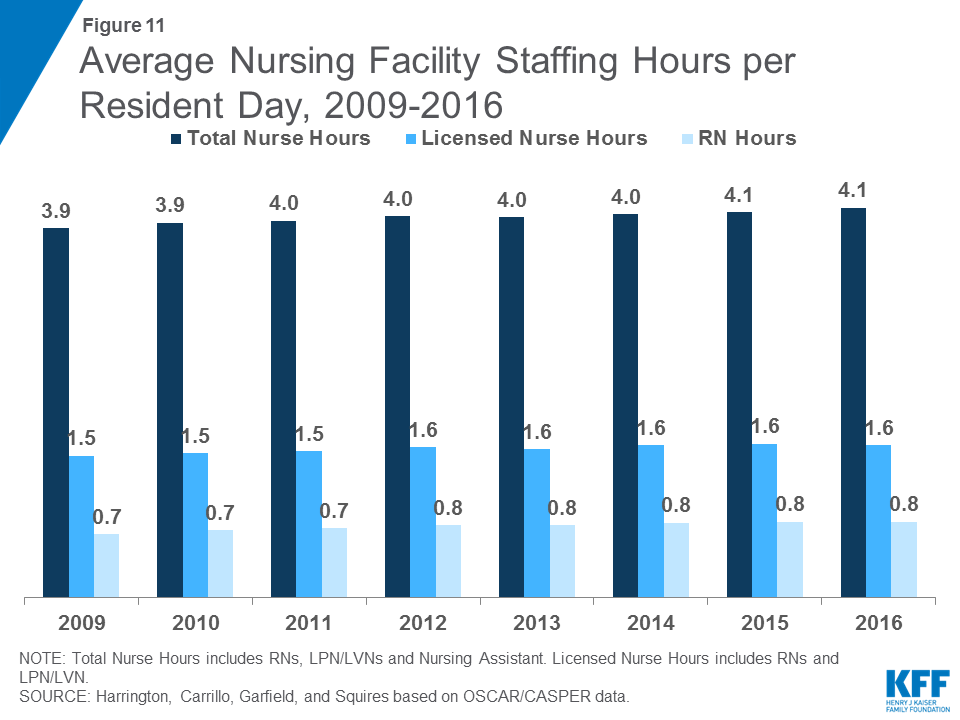

In 2016, total nursing hours (including RNs, LPN/LVNs, and NAs) averaged 4.1 hours per resident day, a small increase from 3.9 in 2009 (Figure 11 and Table 7). There was wide state variation in average nursing hours per resident day, ranging from 3.7 in South Dakota to 5.8 in Alaska. Nationwide, many of these hours are accounted for by non-licensed nursing care (i.e., nursing assistants): the average licensed nursing hours (only RNs and LPN/LVNs) per resident day was 1.6, up from 1.5 in 2009 (Figure 11). Within licensed nursing hours, about half on average are RN hours, which have increased slightly over time, from 0.7 in 2009 to 0.8 in 2016. Both LPN/LVN and NA hours were fairly flat over the period, reaching 0.8 and 2.4 hours per resident day in 2016, respectively (Table 8). Note that because not all facilities have usable staffing data, a small number of facilities are excluded from these estimates. Detail on the staffing measures included and underlying methods are provided in the Appendix at the end of the report.
Report: Facility Deficiencies
Nursing facilities provide care to prevent problems and to address the needs of residents. However, sometimes care does not meet established standards. Policymakers and researchers have developed process indicators to measure the services or activities that a facility does or does not provide and outcome indicators to measure the impact of facility care on a resident. A number of process measures have been associated with poor patient outcomes. These include urethral catheterization, physical restraints, and tube feedings. Another common clinical problem in nursing homes is the improper use of psychotropic drugs.50 A number of outcome measures also have been linked to poor quality, such as: pressure ulcers, falls, weight loss, and infectious disease. Other negative outcomes are behavioral/emotional problems, cognitive problems, and deterioration in physical functioning.51
State surveyors assess both the process and the outcomes of nursing facility care in several major areas, each of which has specific requirements (see Appendix for more detail). In 2016, there were approximately 175 individual requirements. Where a facility fails to meet a requirement, a deficiency or citation is given to the facility for that individual requirement. The deficiencies are given for problems that can result in a negative impact on the health and safety of residents. Since 1995, surveyors also rate each deficiency based on scope and severity for purposes of enforcement. The deficiencies rated as causing actual harm or immediate jeopardy are the most serious.52
Overall Rates of Deficiencies
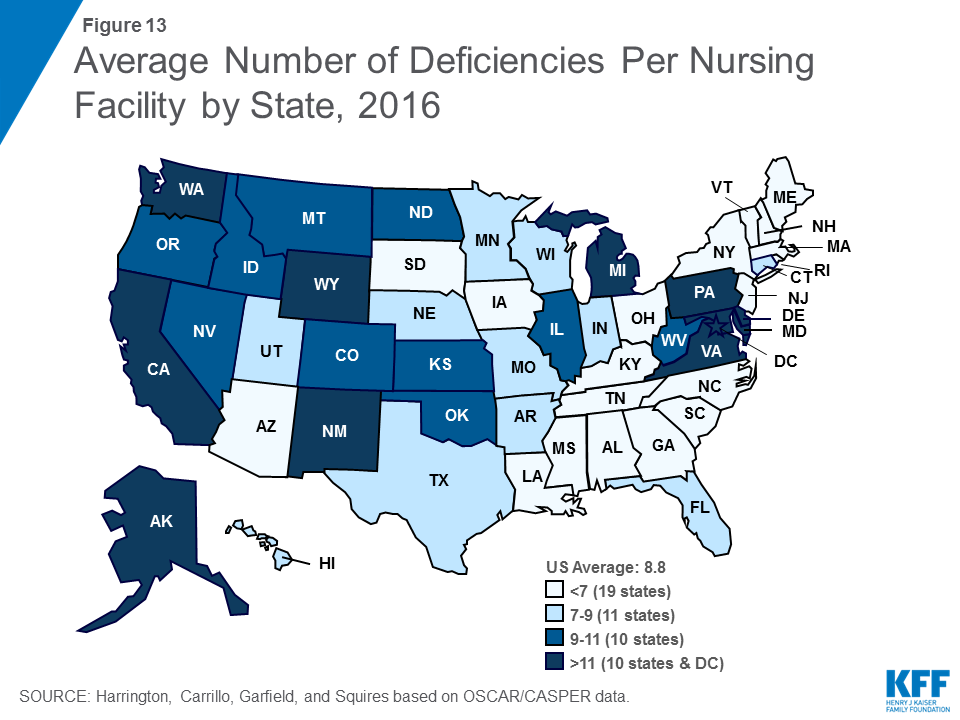
As shown in Table 9, the average number of deficiencies per facility decreased from 9.33 in 2009 to 7.28 in 2013, before rising again in 2016 to reach 8.76. Similarly, the share of facilities with no deficiencies increased from 6.11 in 2009 to 8.07 in 2013, then dropped to 6.50 in 2016. There was wide variation across states in the average number of deficiencies per facility, ranging from 2.56 in Rhode Island to 14.72 in Washington (Figure 13), as well as in the share of facilities with no deficiencies (ranging from 28.6 in Rhode Island to none in the District of Columbia, Delaware, Hawaii and Wyoming). Of particular concern are deficiencies that cause harm or immediate jeopardy to residents. In 2016, more than one in five (20.1%) facilities received a deficiency for actual harm or jeopardy. Again, this rate varied widely across states (Table 10).
Deficiencies by Type
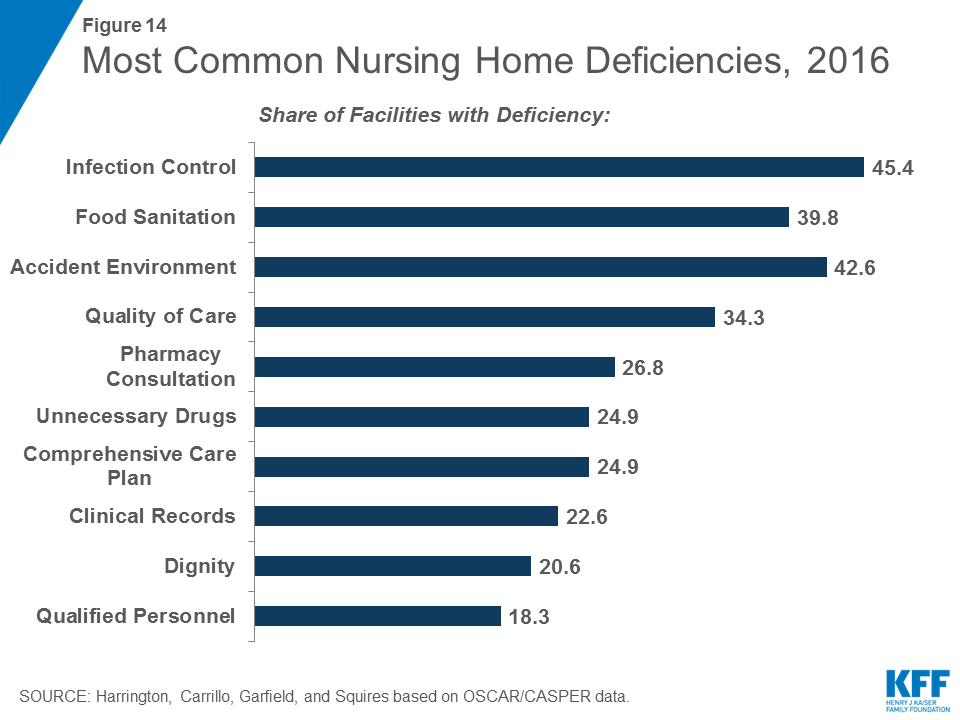
Some types of deficiency are more common than others. In 2016, the most common deficiencies were given for failures in infection control (45.4%); food sanitation (42.6%); accident environment (39.8%); quality of care (34.3%); and pharmacy consultation (26.8%) (Figure 14). (See Appendix for definitions of these types of deficiencies.) Again, there was variation across states in the share of facilities cited for different types of deficiencies (Table 11). However, some states had high rates across all top ten deficiencies, with the Alaska and Washington ranking in the top ten deficiency rate for eight deficiencies and California ranking in the top ten for seven. Additional detail on selected types of deficiencies by state over time is provided in the Supplemental Tables. In addition, the Supplemental Tables provide detailed data on all 175 deficiency types over time, grouped according to the eight categories established by CMS for the Medicare Nursing Home Compare 5-Star website Deficiency data: (1) quality of care; (2) mistreatment; (3) resident assessment; (4) resident rights; (5) environment; (6) nutrition; (7) pharmacy; and (8) administration.
Report: Discussion
The federal OSCAR/CASPER system provides comprehensive information about nursing facility characteristics, resident characteristics and services provided, staffing, and deficiencies, which enables policymakers and the public to monitor and understand changes in nursing facility care in the United States. These survey findings are particularly important as policies are implemented to encourage improvements in the quality of nursing facility care.
Over the eight years included in this analysis, 2009 through 2016, nursing facility capacity has remained fairly flat, but occupancy rates have declined. This trend may reflect a shift from institutional to community-based long-term care. Home and community-based services have increased over the past decade due to the desire of long-term care users to stay in the community as well as the availability of new and expanded options for states to deliver these services through Medicaid, and this trend may continue in the future. However, overall demand for long-term care services may increase in coming years as the “baby boom” generation ages. The next few decades will require states and policy makers to determine sufficient capacity to accommodate long-term care user choice in both institutional and community-based settings.
As in the past, Medicaid remains the primary payer for most nursing facility residents. Medicare, the primary source of health coverage for the elderly, only covers short-stay nursing facility care following hospitalization, and few people have the personal resources to afford extended nursing facility care (which typically costs over $82,000 per year53 ) on their own. As the only major payer that covers this care, Medicaid is the long-term care safety net for millions of people who need such assistance. Medicaid’s large role in financing nursing facility care has made this service a priority policy area for state and federal governments that finance it. It is also one of the mechanisms that enables the federal government to enforce quality standards and accountability in nursing homes. Proposals to limit federal financing for Medicaid could have repercussions for states’ ability to maintain Medicaid spending for long-term services and supports. Given that nursing facility care is one of the costliest services in Medicaid, it is likely that spending in this sector would be subject to cuts if states faced more limited federal financing. For example, proposals that limit federal per enrollee spending growth for seniors to inflation (or an amount indexed to inflation) could lead states to limit eligibility for nursing facility care in an effort to keep Medicaid costs within federal limits.54
Continuing a trend that started before 2009, the share of nursing facilities that are for-profit or chain-owned continued to grow slightly from 2009 to 2016. These facility characteristics are important to policy makers and consumers because of their link to poorer quality of care. States vary in the distribution of facilities by ownership, so continued monitoring of facility ownership by states can help to ensure that a high quality of care is provided at these facilities.
As expected, many nursing facility residents need assistance with basic activities of daily living; however, notable shares have more extensive behavioral or physical health needs. In particular, nearly half of residents have dementia, and nearly a third have a psychological diagnosis. This pattern likely reflects the high need for care among people with these illnesses. However, nursing assistants who provide most of the care to these individuals often have limited training in working with this population. Some may interpret residents’ behavior as aggressive or have difficulty managing these residents’ needs. Despite regulations to limit the use of psychoactive medication unless such drugs are shown to be necessary for particular resident problems, a higher share of residents receives these medications than has a psychological illness, confirming several studies finding that some use is among residents with other cognitive problems such as dementia. This pattern may be indicative of nursing facilities lacking systematic plans to address the needs of residents with dementia or other cognitive impairments. The November 2016 regulations implement an ACA requirement that dementia management and resident abuse prevention training be a part of 12 hours per year in-service training for nurse aides. In addition, the regulations expand requirements limiting the use of anti-psychotic drugs to also include other psychotropic agents (such as antidepressants or antianxiety medication).
Despite a large body of research demonstrating a link between staffing levels and quality and outcomes of care, overall staffing levels are below some recommendations55 and are primarily filled by non-licensed nurses. The data in this report also show substantial state variation in staffing levels. Several factors could explain this state variation. Variation could reflect different Medicaid reimbursement rates across states, since some research has shown that low Medicaid rates are related to low staffing levels.56 ,57 ,58 However, other research points to state variation in staffing regulations as a key factor. For example, Harrington and colleagues59 found that although higher Medicaid reimbursement rates were related to higher staffing levels, minimum state staffing standards were a stronger predictor of higher staffing levels than reimbursement rates.
Last, the data show that nursing facility deficiencies have declined between 2009 and 2016, though there is still much state variation in rates of deficiencies. While voluntary guidelines for compliance programs have been in place for many years, the ACA authorized new, mandatory compliance programs to improve quality of care. Under the Quality Assurance and Performance Improvement (QAPI) program, the federal government will establish standards for such programs and provide technical assistance to meet these standards. All facilities (including chains) must submit a plan for how they will meet these standards. The regulations outlined standards for QAPI programs, building on existing requirements for quality assessment and assurance programs to address quality deficiencies. They also establish new requirements for food services and residents’ rights in nursing facilities, in part to address common deficiencies in these areas.
Moving forward, it will be important to continue to monitor nursing facility characteristics, residents’ needs, and staffing and deficiency reports to understand whether and how new requirements are affecting care and outcomes and to identify additional areas of concern for future policy changes.
Charlene Harrington and Helen Carrillo are with The University of California San Francisco and Rachel Garfield, MaryBeth Musumeci, and Ellen Squires are with the Kaiser Family Foundation.
Report: Tables
Download Tables 1-11 (.pdf)
Table 1: Average Number Of Certified Beds Per Facility By State And Calendar Year
Table 2: Total Number Of Residents And Facility Occupancy Rates For Certified Nursing Facilities By State And Calendar Year
Table 3: Percent Of Certified Nursing Facility Residents By Primary Payer Source, By State And Calendar Year
Table 4: Number Of Certified Nursing Facility Residents With Medicaid As Primary Payer Source, By State And Calendar Year
Table 5: Percent Distribution Of Certified Nursing Facilities By Ownership Type, By State And Calendar Year
Table 6: Average Facility Scores* For Activities Of Daily Living In Certified Nursing Facilities By State And Calendar Year
Table 7: Average Licensed And Total Nurse Hours Per Resident Day In Certified Nursing Facilities By State And Calendar Year
Table 8: Average RN, LPN/LVN, & Assistant Hours Per Resident Day In Certified Nursing Facilities By State And Calendar Year
Table 9: Average Number Of Deficiencies Per Certified Nursing Facility And Percent Of Facilities With No Deficiencies By State And Calendar Year
Table 10: Percent Of Certified Nursing Facilities Receiving A Deficiency For Actual Harm Or Jeopardy Of Residents By State And Calendar Year
Table 11: Top Ten Deficiencies Nationwide For Certified Nursing Facilities By State In Calendar Year 2014
Appendix
Appendix: Technical Notes
Data Sources
OSCAR/CASPER is an on-line data system from the Centers for Medicare and Medicaid Services (CMS). The OSCAR data for this report are for 2009-2011, and these data were converted to CASPER data in 2012-2016 for all facilities. The OSCAR/CASPER systems include data for all certified nursing facilities in the U.S. The data are collected in separate sets of files: (1) provider information, staffing data and health information on residents; and the (2) survey deficiencies. To create this report, the OSCAR/CASPER data from the annual surveys were combined with data from complaint surveys.
All nursing facilities federally certified for Medicare (skilled nursing care) and Medicaid (nursing facilities) and surveyed during the calendar year were included (about 15,400 to 15,600 facilities) in these data. Intermediate care facilities for people with intellectual and developmental disabilities (ICF-I/DD) were excluded because they use different federal certification forms and have different standards of care. Facilities located in the U.S. territories and Puerto Rico were excluded.
OSCAR/CASPER is a set of administrative databases that allow users to add, change, and delete data almost continually. These databases store no more than four standard surveys per provider. The system automatically deletes older surveys as new ones are entered. For these reasons, analysis of the same data elements may yield slightly different results depending upon the date the data are retrieved. Although facilities are surveyed every 9-15 months, this report used data during the calendar year only from both annual surveys and complaint surveys.60 Because data are overwritten in the database, OSCAR/CASPER data were retrieved twice a year and then merged to create the most complete file for each facility for each calendar year. This report uses deficiency data that were obtained from the annual surveys and all complaint surveys. This approach gives a complete picture of all deficiencies throughout the year rather than at the time of the annual survey. This report does not include the life safety code violations. Therefore, this report varies from the CMS Nursing Home Compendium, which only uses data from the annual surveys.61
Outcomes Included
This report presents calendar year data on nursing facilities, staffing, resident characteristics, and surveyor reports of quality deficiencies by state.
- Information on facility characteristics includes type of certification, bed size, occupancy, ownership, hospital-based and chain affiliations and other facility characteristics.
- Resident characteristics are as reported by the nursing facilities. These include limitations in activities of daily living (ADLs), restraints, incontinence, psychological problems, and other special care needs of residents.
- Nurse staffing (RNs, LPN/LVNs, and NAs) hours per resident day are presented for nursing facilities. These data are reported by facilities for a two-week period prior to when the state survey was conducted. These data currently are the only major source of information for all facilities on staffing levels.
- Finally, data are presented on facility deficiencies based on state surveyor evaluations of the process and outcomes of care in the facilities. Deficiencies are reported in 8 categories established by CMS for the Medicare Nursing Home Compare 5-Star website Deficiency data: (1) quality of care; (2) mistreatment; (3) resident assessment; (4) resident rights; (5) environment; (6) nutrition; (7) pharmacy; and (8) administration. The information compiled shows differences in the frequency of the deficiencies by type and category.62
Background on the Survey System and Data Collection
Every facility must have an initial survey to verify compliance with all federal regulatory requirements in order to be certified. Certified facilities are resurveyed no less often than every 15 months. Follow-up surveys may be conducted to ensure that facilities correct identified deficiencies. In addition, surveys are required when there are substantial changes in a facility’s organization and management. Finally, surveys may be conducted to investigate complaints about violations and poor care.
Nursing facility data are collected in two different ways. First, the facility characteristics, resident characteristics, and staffing levels are completed on standardized forms by individual nursing homes at the beginning of each survey and are certified by the facility as being accurate. State staff enters the data into a computerized OSCAR/CASPER system data.
Second, state surveyors make decisions regarding whether the facility has met or not met each standard after the facility survey has been completed. If a facility is judged to not meet a standard, the facility is given a deficiency indicating that the regulation was not met. Surveyors are also required to determine the scope and severity of each deficiency, and these are recorded as part of the process.
The survey evaluations are based upon data from a combination of sources including, but not limited to, the assessment of a selected sample of individual residents; interviews with a sample of residents, family members and staff; a review of the resident records and facility documents; and other data. After these judgments are made, state surveyors record and enter the data for each item into OSCAR/CASPER. Thus, determinations of deficiencies are made by state surveyors independent of the facility, with standard forms, sampling and survey procedures to ensure accuracy. Team members and state supervisors subsequently review state surveyor deficiencies. Facilities have the option to challenge and appeal deficiency decisions through administrative review procedures.
Because of these checks in the system, the likelihood of false positive deficiencies is low, and errors tend to be in under-reporting of failures to meet standards.63 ,64 ,65 ,66 ,67 ,68 ,69 ,70 ,71 ,72 Thus, a note of caution is needed that under-reporting of deficiencies is more likely to be a problem than over-reporting.
CMS Procedures and State Survey Variation
The Centers for Medicare & Medicaid Services (CMS) uses “front-end” edit screens to ensure the accuracy of the OSCAR/CASPER data. State staff enter the data for each survey item into the OSCAR/CASPER data set within 45 days of each survey, leading to time delays in obtaining the data.
One concern about the OSCAR/CASPER data has been with survey reliability (both across and within states) in judging the quality of facilities.73 These issues have been addressed over time by CMS with its survey process. First, the procedures require some accuracy checks by surveyors.74 CMS provides federal training for new state surveyors. Recently, CMS has been testing ways to improve the efficiency and effectiveness of the process using a new Quality Indicator Survey (QIS) in comparison to the traditional procedures that are used.75 In addition, CMS uses federal survey teams from the regional offices to conduct periodic oversight surveys of state agencies. States that fall below the concurrence standards established by CMS are critiqued and monitored by CMS.
Even though CMS has made efforts to standardize the reporting of deficiencies by state survey staff, regional variations in issuing deficiencies continue and enforcement procedures have been inconsistent and ineffective.76 ,77 ,78 ,79 ,80 ,81 ,82 ,83 ,84 ,85 ,86 ,87 ,88 Problems have also been found with the complaint investigation process, 89 ,90 ,91 ,92 and quality of care problems continue to exist in nursing facilities.93 ,94 In spite of the improvements that have been made, there is a need to further improve both the state survey process and the enforcement system. Staff turnover and recruitment problems and fiscal problems at the state agency level may hamper survey and enforcement efforts.95 ,96 ,97
Data Cleaning and Duplicate Records
In preparing the data for this report, discussions were held with CMS officials as necessary to discuss data acquisition, formatting, and cleaning issues. Frequency distributions were developed for all the indicators on the data set and a series of cleaning activities undertaken.
The first step in cleaning was to eliminate any duplicate provider records. Duplicate records were considered generally to be the result of changes in certification for Medicare and Medicaid (Title VIII/XIX) facilities or Medicare only (Title XVIII) facilities. Since 1990, because of the OBRA 1987 legislation, Medicaid only (Title XIX) SNF and ICF facilities are certified together as nursing facilities (NFs). With this change, some problems with duplicate SNF and ICF reporting were essentially eliminated.
To correct the duplicate problems, we identified all those facilities showing identical values for the following areas: state, city, facility name, and facility address. Where duplicate records were identified, a decision-making procedure was invoked as follows:
(1) The most recent record within a calendar year was selected over earlier records; and
(2) A record reporting a category of either: (01) skilled nursing facility (SNF) — Medicare participation; (02) nursing facility (NF) — Medicaid participation; or (03) SNF/ICF — Medicare/Medicaid participation was selected over facilities reporting as (10) hospital based.
For those remaining facilities with the same name and/or address, data on telephone numbers and survey data were then examined. Where there appeared to be two facilities at one site with different data, neither facility was eliminated. This overall process resulted in dropping about 100 facilities annually prior to 2012. Fewer duplicates were found among the CASPER records each year since 2011.
Outcome Measurement, Data Errors and Corrections
The data were examined for missing values and gross errors. Means and standard deviations of the data were computed and examined. Logic checks confirming the reasonableness of data were conducted. Preliminary work identified some missing data and errors, primarily in reporting the beds, staffing and the number of residents. Each problem area and the cleaning procedures are discussed below.
Total Number of Beds
During the preliminary work, the total number of beds in each state reported on OSCAR/CASPER was compared to the total licensed bed supply for each state from an independent survey of states. The total number of beds reported by facilities was significantly higher than the total licensed beds in the U.S. An analysis of this discrepancy found that some hospital-based facilities had reported the total number of acute care beds rather than the total number of skilled nursing beds for their facility. To correct this error, the maximum number of beds for a hospital-based facility was set to equal the maximum number of certified skilled nursing beds in the facility. This process made the total certified nursing facility beds more comparable to the total state licensed nursing facility beds in each state.
Total Number of Residents
Several problems concerning resident data were detected. First, some facilities had missing data for their total number of residents. These facilities were left in the data set, but where resident data were not available, these facilities were not included in the tables reported.
Second, some facilities reported extremely low numbers of residents. In order to identify facilities with possible errors in reporting residents, occupancy rates were computed for all nursing facilities. Free-standing (non-hospital based) facilities reporting 50 or fewer residents than total beds were considered to have erroneous data and were eliminated from the staffing and resident characteristics’ analysis.
Third, some facilities reported more residents than beds, suggesting more than 100 percent occupancy. Hospital-based facilities may have had approval for swing beds, which would allow the hospital to use an acute care bed for a nursing facility resident. Therefore, hospital-based facilities with more residents than beds were left in the data set, but the maximum occupancy rate for such facilities was reported to be 100 percent. Finally, facilities with numbers of residents reported at greater than 100 percent of total beds, which were not hospital-based, were dropped from the analysis.
Resident Characteristics
Minimum Data Set (MDS) assessments are required for all residents in nursing facilities on a periodic basis and are used to describe resident characteristics. The first MDS assessments were developed and implemented and sent to CMS electronically.98 Over time the MDS was improved using the revised MDS 2.0.99 In 2011, CMS implemented an improved MDS 3.0 version.100 ,101 These data are used by nursing facilities for quality improvement and by CMS to create quality measures.
The MDS is also used by Medicare and many state Medicaid programs to take resident casemix into account in reimbursement rates.102 The Medicare developed resource utilization groups (RUGS) to measure case mix and to estimate the amount of staffing time needed to care for residents in each RUG category.103 ,104 ,105 The MDS and RUGs data are separate from the OSCAR/CASPER data and not shown in this report.
This OSCAR/CASPER report has summary data on residents at the facility level describing the residents’ need for assistance with activities of daily living (ADL). Two types of summary data are presented. First, a simple summary of three major activities of daily living (ADLs) was compiled. The facilities were asked to rate each resident’s ADLs on a scale of 1 to 3 from “needs little or no assistance” to “needs extensive assistance.” The three ADL scores were for those residents who needed assistance in: (1) eating, (2) toileting, and (3) transferring. A score of 1 was assigned to residents who were independent. A score of 2 was assigned to those that needed some supervision. A score of 3 was assigned to those who were dependent.
Each ADL score was multiplied by the number of residents in that category for each facility. An average composite score was developed by adding each of the three scores together and dividing by the total number of residents in the facility to compute each facility’s index score. Thus, a summary case mix score ranging from 3-9 was compiled for each facility based on resident ADL characteristics. Individual facility scores were then summarized for each state.
Finally, the report shows resident needs for more advanced care including the: percent of clients receiving special treatments (injections, ostomy care, IV feedings, tube feedings, or suctioning), and percentage with organic psychiatric or other psychiatric conditions. Other characteristics included are the percentage who receive psychotropic drugs and who have pressure ulcers, contractures, incontinence, or catheters.
Staffing Data
Nursing personnel in nursing facilities were of particular interest for this report. Nursing personnel included: registered nurses (RNs); licensed practical/ vocational nurses (LPN/LVNs), and nursing aides/orderlies/ assistants (NAs). Staffing hours (including full-time, part-time, and contract staff) are reported by facilities as total hours worked in a fourteen-day period. The staff time includes all administrative and direct care time. To compute the staffing ratios for this report, the total number of staffing payroll hours reported in a two-week period was divided by the total number of residents and by the 14 days in the reporting period. For this report, the total hours of staffing per resident day were examined for all dually certified facilities (Title XVIII/XIX), for Medicare-only facilities (Title XVIII), and for Medicaid-only facilities (Title XIX). It should be noted that the reported staffing ratios reflect reported hours per resident day and not the actual hours of care delivered directly to residents. In the future, CMS plans to require payroll data for reporting staffing in nursing facilities, which should increase the accuracy for staffing data.106
There were a number of problems identified with the facility staffing data. Some facilities reported extremely high staff hours per resident day while others reported no registered nurses or no nursing staff hours. Where a facility reported nurse staffing hours per resident day that did not fall within a reasonable range, the data for that item were considered invalid. The following uniform decision-making rules were created for eliminating facility staffing data which clearly appeared to be too high or too low:
First, facilities with average nursing hours per resident day that were greater than 24 hours of nursing per resident were considered erroneous and eliminated from the analysis. Distributions of the nursing hours per resident were then examined.
To correct further for staffing levels that were unreasonably high, facilities reporting staffing hours per resident day in the upper 2 percent by type of facility (separately for Medicaid only and for Medicare only/dually certified) and by type of staff (RN, LVN/LPN, and nursing assistants) were eliminated from the staffing analysis.
Facilities reporting extremely low staffing hours per resident day were identified. Since some Title XIX facilities and Title XVIII/XIX facilities were given federal waivers from the staffing requirements, these facilities may have few or no RN staff.
Since all facilities are required to have some licensed nurses, nursing facilities with no licensed staff (RNs and/or LVN/LPNs) and/or no nursing staff were eliminated from these analyses. In addition, facilities with computed staffing levels lower than 1 percent for licensed or combined nursing personnel for each type of facility (separately for Medicaid only and for Medicare only and/or dually certified) were removed from the staffing report because some of these may have been erroneous.
Other reporting errors in staffing data may occur. For example, facility errors in the reporting of time periods may have occurred or rounding errors may have occurred. These types of errors cannot be detected in the data set. Thus, because further accuracy checks could not be conducted, only the high and low outlier facilities were removed from the tables on staff.
RNs, LPN/LVNs, and Aides are presented separately. Total licensed nurses are also presented; these include RNs and LPN/LVNs added together. Total combined nursing personnel are included as combined RNs, LPN/LVNs, and nursing aide hours.
Deficiency Data
State surveyors assess both the process and the outcomes of nursing home care in 8 categories: administration, environment, mistreatment, nutrition, pharmacy, quality of care, resident assessment, and resident rights. Each of these categories has specific regulations that state surveyors review to determine whether or not facilities have met the standards. Each of the specific requirements that goes into a deficiency area has a measurement and an identifying number (F-tag). In July 1995, the federal government consolidated the 325 measures of quality to about 185 measures, and additional standards have been consolidated over time, so this report includes data for about 175 F-tags. Some of the definitions of requirements have changed over time. A detailed list of all the F-tags and longer descriptions are shown in the Supplemental Tables. Detailed definitions of deficiencies are given in the CMS State Operations Manual.107
Where a facility fails to meet a requirement, a deficiency or citation is given to the facility for that individual requirement. The deficiencies are given for problems that can result in a negative impact on the health and safety of residents. Since 1995, surveyors have rated each deficiency based on scope and severity for purposes of enforcement. The deficiencies rated as causing actual harm or immediate jeopardy are the most serious (rated at a G level or higher).108
The tables in this report and in the Supplemental Tables include information for the following deficiencies:
- Accident Environment (F323): Facilities must ensure that the environment is as free of accident hazards as possible. This is designed to prevent unexpected and unintended injury.
- Activities of Daily Living Services (F312): Residents who are unable to carry out activities of daily living (ADL) should be given the necessary services to maintain nutrition, grooming, and personal and oral hygiene.
- Activities Program (F248): Facilities must provide residents with ongoing activities that meet the interests and the physical, mental, and psychosocial well-being needs of each resident.
- Bladder Incontinence Care (F315): Residents who have bladder incontinence should receive appropriate treatment and services to prevent incontinence and to restore as much bladder functioning as possible.
- Clinical Records (F514): The facility must maintain clinical records on each resident in accordance with accepted professional standards and practices that are: (i) complete; (ii) accurately documented; (iii) readily accessible; and (iv) systematically organized.
- Comprehensive Care Plan (F279): The facility must develop a comprehensive care plan for each resident that includes measurable objectives and timetables to meet a resident’s medical, nursing, and mental and psychosocial needs that are identified in the comprehensive assessment.
- Dignity (F241): Facilities must promote care for residents in a manner and in an environment that maintains or enhances dignity and respect in full recognition of each resident’s individuality. This involves assisting residents to be well groomed and dressed appropriately; promoting independence in dining; allowing private space and property; speaking and listening respectfully; and facilitating resident communications.
- Food Sanitation (F371): Sanitary conditions must be ensured in storing, preparing, distributing, and serving food to prevent food borne illness.
- Housekeeping (F253): Housekeeping and maintenance services must be provided to maintain a sanitary, orderly, and comfortable environment.
- Infection Control (F441): The facility must establish and maintain an Infection Control Program designed to provide a safe, sanitary and comfortable environment and to help prevent the development and transmission of disease and infection.
- Limited Range of Motion Services (F318): Residents with limited range of motion must receive appropriate treatment and services to increase and/or to prevent declines in range of motion.
- Nutrition (F325): Facilities must ensure that residents receive acceptable nutrition to maintain body weight unless a resident’s condition makes this impossible.
- Pharmacy Consultation (F431): The facility must employ or obtain the services of a licensed pharmacist who establishes a system of records of receipt and disposition of all controlled drugs in sufficient detail to enable an accurate reconciliation; and determines that drug records are in order and that an account of all controlled drugs is maintained and periodically reconciled.
- Physical Restraints (F221): Residents have the right to be free of physical restraints imposed for purposes of discipline or convenience and not required to treat the resident’s medical symptoms. Restraints are defined as mechanical devices, materials, or equipment that restricts freedom of movement or normal access to one’s body.
- Pressure Sores (F314): Facilities must ensure that residents without pressure sores do not develop them if this is avoidable.
- Qualified Personnel (F282): Care must be provided by qualified persons in accordance with each resident’s written plan of care.
- Quality of Care (F309): Each resident must receive and the facility must provide the necessary care and services to attain or maintain the highest practicable physical, mental, and psychosocial well-being, in accordance with the comprehensive assessment and plan of care.
- Sufficient Nursing Staff (F353): Facilities must have sufficient nursing staff to provide nursing and related services to attain or maintain the highest practicable physical, mental, and psychosocial well-being of residents.
- Unnecessary Drugs (329): Each resident’s drug regimen must be free from unnecessary drugs including (i) in excessive dose (including duplicate therapy); or (ii) for excessive duration; or (iii) without adequate monitoring; or (iv) without adequate indications for its use; or (v) in the presence of adverse consequences which indicate the dose should be reduced or discontinued; or (vi) any combinations of these reasons.
Supplemental Tables
Nursing facilities are one part of the long-term care delivery system that also includes home and community based services, but their relatively high cost has led them to be the focus of much attention from policymakers. Medicaid plays a major role in financing nursing facility care in the United States, and policy proposals to limit federal financing for Medicaid may lead to cuts in eligibility or scope of coverage for long-term care services. In addition, regulations effective November 2016 aimed to address longstanding challenges in quality and safety in nursing facilities. As the demand for long term care continues to increase and policy proposals and regulations unfold, the characteristics, capacity, and care quality of facilities remain subjects of concern among consumers and policy makers.
These tables provide information on recent trends in nursing facilities in the United States, drawing on data from the federal On-line Survey, Certification, and Reporting system (OSCAR) and Certification and Survey Provider Enhanced Reports (CASPER), to provide information on nursing facility characteristics, resident characteristics, facility staffing, and deficiencies by state from 2009 through 2016. The accompanying report, Nursing Facilities, Staffing, Residents and Facility Deficiencies, 2009 Through 2016, analyzes recent trends and discusses findings in light of recent policy debates and developments. These tables provide additional detail on the information presented in the report. For more information on the surveys and methods underlying the data in this report, see the Appendix at the end of the main report.
Supplemental Tables (.pdf)
Table 1: Total Number of Certified Nursing Facilities by State and Calendar Year
Table 2: Total Number of Certified Nursing Facility Beds by State and Calendar Year
Table 3: Average Number of Certified Beds Per Facility by State and Calendar Year
Table 4: Total Number of Residents and Facility Occupancy Rates for Certified Nursing Facilities by State and Calendar Year
Table 5: Percent of Nursing Facility Beds by Certification Category, by State and Calendar Year
Table 6: Percent of Certified Nursing Facility Residents by Primary Payer Source, by State and Calendar Year
Table 7: Percent Distribution of Certified Nursing Facilities by Ownership Type, by State and Calendar Year
Table 8: Percent Distribution of Certified Nursing Facilities by Affiliation, by State and Calendar Year
Table 9: Percent of Certified Nursing Facilities with Resident Groups and Family Groups by State and Calendar Year
Resident Characteristics
Table 10: Average Facility Scores for Activities of Daily Living in Certified Nursing Facilities by State and Calendar Year
Table 11: Percent of Residents in Certified Nursing Facilities who are Bedfast or Chairbound by State and Calendar Year
Table 12: Percent of Residents in Certified Nursing Facilities with Contractures or Physical Restraints by State and Calendar Year
Table 13: Percent of Residents in Certified Nursing Facilities Receiving Psychoactive Medication or Having Mental Retardation by State and Calendar Year
Table 14: Percent of Residents in Certified Nursing Facilities with Dementia or Other Psychological Diagnoses by State and Calendar Year
Table 15: Percent of Residents in Certified Nursing Facilities with Pressure Sores or Receiving Special Skin Care by State and Calendar Year
Table 16: Percent of Residents in Certified Nursing Facilities Receiving Rehabilitation or Ostomy Care by State and Calendar Year
Table 17: Percent of Residents in Certified Nursing Facilities Receiving Injections or Intravenous Therapy by State and Calendar Year
Table 18: Percent of Residents in Certified Nursing Facilities Receiving Tube Feeding or Respiratory Treatment by State and Calendar Year
Table 19: Percent of Residents in Certified Nursing Facilities with Bladder Incontinence or in Bladder Training Program by State and Calendar Year
Table 20: Percent of Residents in Certified Nursing Facilities with Bowel Incontinence or in Bowel Training Program by State and Calendar Year
Table 21: Percent of Residents in Certified Nursing Facilities with Indwelling Catheters by State and Calendar Year
Facility Staffing
Table 22: Average RN, LPN/LVN, & Assistant Hours Per Resident Day in Certified Nursing Facilities by State and Calendar Year
Table 23: Average Licensed and Total Nurse Hours Per Resident Day in Certified Nursing Facilities by State and Calendar Year
Deficiencies
Table 24: Average Number of Deficiencies Per Certified Nursing Facility and Percent of Facilities with No Deficiencies by State and Calendar Year
Table 25: Percent of Certified Nursing Facilities Receiving a Deficiency for Actual Harm or Jeopardy of Residents by State and Calendar Year
Table 26: Top Ten Deficiencies Nationwide for Certified Nursing Facilities by State in Calendar Year 2014
Table 27: Deficiency Group Mistreatment: Physical Restraints (F221) by State and Calendar Year
Table 28: Deficiency Group Resident Rights: Dignity (F241) by State and Calendar Year
Table 29: Deficiency Group Quality of Care: Activities Program (F248) by State and Calendar Year
Table 30: Deficiency Group Environment: Housekeeping (F263) by State and Calendar Year
Table 31: Deficiency Group Quality of Care: Activities of Daily Living Services (F312) by State and Calendar Year
Table 32: Deficiency Group Quality of Care: Pressure Sores (F221) by State and Calendar Year
Table 33: Deficiency Group Quality of Care: Urinary/Incontinence Care (F315) by State and Calendar Year
Table 34: Deficiency Group Quality of Care: Limited Range of Motion Services (F318) by State and Calendar Year
Table 35: Deficiency Group Environment: Accident Environment (F323) by State and Calendar Year
Table 36: Deficiency Group Quality of Care: Nutrition (F325) by State and Calendar Year
Table 37: Deficiency Group Quality of Care: Sufficient Nursing Staff (F353) by State and Calendar Year
Table 38: Deficiency Group Nutrition: Food Sanitation (F371) by State and Calendar Year
Table 39: Percent of Certified Nursing Facilities in the U.S. with Deficiencies for Quality of Care by Calendar Year
Table 40: Percent of Certified Nursing Facilities in the U.S. with Deficiencies for Mistreatment and Resident Assessment by Calendar Year
Table 41: Percent of Certified Nursing Facilities in the U.S. with Deficiencies for Resident Rights by Calendar Year
Table 42: Percent of Certified Nursing Facilities in the U.S. with Deficiencies for Environment by Calendar Year
Table 43: Percent of Certified Nursing Facilities in the U.S. with Deficiencies for Nutrition and Pharmacy by Calendar Year
Table 44: Percent of Certified Nursing Facilities in the U.S. with Deficiencies for Administration by Calendar Year
Endnotes
- Genworth Financial. (2017). Annual Median Cost of Long Term Care in the Nation, 2016. Available at: https://www.genworth.com/corporate/about-genworth/industry-expertise/cost-of-care.html. ↩︎
- Centers for Medicare & Medicaid Services. National Health Expenditures Accounts, Historical Data. Available at: https://www.cms.gov/Research-Statistics-Data-and-Systems/Statistics-Trends-and-Reports/NationalHealthExpendData/NationalHealthAccountsHistorical.html. ↩︎
- Institute of Medicine (IOM), Committee on Nursing Home Regulation (1986). Improving the Quality of Care in Nursing Homes. Washington, DC: National Academy Press, 1-44. ↩︎
- U.S. General Accounting Office (US GAO, 1987). Report to the Chairman, Subcommittee on Health and Long-Term Care, Select Committee on Aging, House of Representatives. Medicare and Medicaid: Stronger Enforcement of Nursing Home Requirements Needed. Washington, DC: US GAO. ↩︎
- Omnibus Budget Reconciliation Act of 1987 (OBRA, 1987), Subtitle C: Nursing Home Reform, 42 U.S.C. § 1396r (2012). ↩︎
- Wiener, J.M., Freiman, M.P. and Brown, D. (2007). Nursing Home Quality: Twenty Years after the Omnibus Budget Reconciliation Act of 1987. Report prepared by RTI International. Washington, DC: Kaiser Family Foundation. ↩︎
- Morris, J., et al. (1990). Designing the National Resident Assessment Instrument for Nursing Homes. The Gerontologist. 30 (3):293-307. ↩︎
- Wells, J. and Harrington, C. (2013). Implementation of Affordable Care Act Provisions to Improve Nursing Home Transparency, Care Quality, and Abuse Prevention. Washington, DC: Kaiser Commission on Medicaid and the Uninsured. https://modern.kff.org/medicaid/report/implementation-of-affordable-care-act-provisions-to-improve-nursing-home-transparency-care-quality-and-abuse-prevention/ ↩︎
- 81 Fed. Reg. 68688-68872 (October 4, 2016), available at https://www.federalregister.gov/documents/2016/10/04/2016-23503/medicare-and-medicaid-programs-reform-of-requirements-for-long-term-care-facilities ↩︎
- Boccuti, C. Casillas, G., Neuman, T. (2015). Reading the Stars: Nursing Home Quality Star Ratings, Nationally and by State. (Washington, DC: Kaiser Family Foundation), Available at: https://modern.kff.org/report-section/reading-the-stars-nursing-home-quality-star-ratings-nationally-and-by-state-issue-brief/ ↩︎
- Abt Associates. Further Improvements to the Nursing Home Compare Five-Star Quality Rating System. March 3, 2016. Available at: https://www.cms.gov/Medicare/Provider-Enrollment-and-Certification/CertificationandComplianc/Downloads/Improvements-NHC-April-2016.pdf ↩︎
- U.S. Centers for Medicare and Medicaid Services. (2014). Nursing Home Data Compendium 2013. Baltimore, MD: CMS. http://www.cms.gov/Medicare/Provider-Enrollment-and-Certification/CertificationandComplianc/downloads/nursinghomedatacompendium_508.pdf ↩︎
- Centers for Medicare and Medicaid Services (CMS). (2016). Nursing home data compendium 2015 edition. Baltimore, MD: CMS. http://www.cms.gov/Research-Statistics-Data-and-Systems/Statistics-Trends-and-Reports/MedicareMedicaidStatSupp/index.html ↩︎
- Harrington, C., Mullan, J. and Carrillo, H. (2004). State Nursing Home Enforcement Systems. J. of Health Politics, Policy, and Law. 29 (1): 43-73. ↩︎
- Grabowski, D. and Angelelli, J.J. (2004). The Relationship of Medicaid Payment Rates, Bed Constraint Policies, and Risk-Adjusted Pressure Ulcers. Health Services Research. 39 (4):793-812. ↩︎
- Grabowski and Angelelli 2004. ↩︎
- Grabowski, D. (2001). Medicaid Reimbursement and the Quality of Nursing Home Care. Journal of Health Economics. 20:549-569. ↩︎
- Grabowski, D.C. and Castle, N.G. (2004). Nursing Homes with Persistent High and Low Quality. Medical Care Research and Review. 61 (1): 89-115. ↩︎
- Mor, V., J. Zinn, J. Angelelli, J.M. Teno, and S.C. Miller. (2004). Driven to Tiers: Socioeconomic Factors and Racial Disparities in the Quality of Nursing Home Care. Milbank Quarterly. 82(2): 227-56. ↩︎
- Comondore, V.R, Devereaux, P.J., Zhou, Q. et al. (2009). Quality of Care in For-Profit and Not-For Profit Nursing Homes: Systematic Review and Meta-analysis. British Medical Journal. Aug 4; 339. ↩︎
- Hillmer, M.P., W.P. Wodchis, S.S. Gill, G.M. Anderson, and P.A. Rochon, 2005. Nursing Home Profit Status and Quality of Care: Is There Any Evidence of an Association? Medical Care Research and Review. 62 (2):139-166. ↩︎
- Harrington, C., Olney, B, Carrillo, H., and Kang, T. 2012. Nurse Staffing and Deficiencies in the Largest for-Profit Chains and Chains Owned by Private Equity Companies. Health Services Research, 47 (1), Part I: 106-128. ↩︎
- Harrington, C., Mullan, J. and Carrillo, H. (2004). State Nursing Home Enforcement Systems. J. of Health Politics, Policy, and Law. 29 (1): 43-73. ↩︎
- Hamann, D.J. (2014) Does empowering resident families or nursing home employees in decision making improve service quality? J. of Applied Gerontology. 33:603-23. ↩︎
- Medicare Payment Advisory Commission (MedPac). (2014). Report to Congress: Medicare Payment Policy. Skilled Nursing Facility Services, Chapter 8. Washington, DC: MedPac, March, 185-208. ↩︎
- Borza T, Engedal K, Bergh S, Barca ML, Benth JŠ, Selbæk G. (2015). The course of depressive symptoms as measured by the Cornell scale for depression in dementia over 74 months in 1158 nursing home residents. J Affect Disord. 2015 Apr 1;175:209-16. ↩︎
- Chiu, Y., Bero, L., Hessol, N. Lexchin, J. and Harrington, C. (2015). A Review of Clinical Outcomes Associated with Antipsychotic Medication Use in Nursing Home Residents. Health Policy. In press. ↩︎
- Gastmans, C., Milisen, K. (2006). Use of physical restraint in nursing homes: clinical‐ethical considerations. J Medical Ethics, 32(3): 148–152. ↩︎
- Centers for Medicare & Medicaid Services, Center for Medicaid and State Operations/Survey and Certification Group. (2008). Memorandum: Release of Report: “Freedom from Unnecessary Physical Restraints: Two Decades of National Progress in Nursing Home Care.” Available at: https://www.cms.gov/Medicare/Provider-Enrollment-and-Certification/SurveyCertificationGenInfo/downloads/SCLetter09-11.pdf ↩︎
- Castle, N. (1998) Physical Restraints in Nursing Homes: A Review of the Literature Since the Nursing Home Reform Act of 1987. Medical Care Research and Review, 55(2): 139-70. ↩︎
- Institute of Medicine (IOM), Page, A., Eds. 2004. Keeping Patients Safe: Transforming the Work Environment of Nurses. Washington, DC: National Academy of Sciences, IOM. ↩︎
- Bostick, J.E., Rantz, M.J., Flesner, M.K. & Riggs, J.C. (2006). Systematic Review of Studies of Staffing and Quality in Nursing Homes. J. American Medical Directors Association. 7 (6):366-76. ↩︎
- Castle, N., (2008). Nursing home caregiver staffing levels and quality of care: A literature review. Journal of Applied Gerontology, 27: 375-405. ↩︎
- Dellefield, M.E., Castle, N.G., McGilton, K.S., and Spilsbury, K. (2015). The Relationship Between Registered Nurses and Nursing Home Quality: An Integrative Review (2008-2014). Nursing Economics$. 33 (2):95-116. ↩︎
- Schnelle, J.F., Simmons S.F., Harrington, C., Cadogan, M., Garcia, E., and Bates-Jensen, B. (2004). Relationship of Nursing Home Staffing to Quality of Care? Health Services Research. 39 (2):225-250. ↩︎
- Spilsbury, K., Hewitt, C., Stirk, L. & Bowman, C. (2011). The Relationship Between Nurse Staffing and Quality of Care in Nursing Homes: A Systematic Review. International Journal Nursing Studies, 48(6), 732–750. ↩︎
- U.S. Centers for Medicare and Medicaid Services, Prepared by Abt Associates. (2001). Appropriateness of Minimum Nurse Staffing Ratios in Nursing Homes. Report to Congress: Phase II Final. Volumes I-III., MD: CMS. ↩︎
- Bowblis, J.R. (2011). Staffing ratios and quality: An analysis of minimum direct care staffing requirements for nursing homes. Health Services Research, 46(5): 1495-516. ↩︎
- Harrington, C., Swan, J.H., and Carrillo, H. (2007). Nurse Staffing Levels and Medicaid Reimbursement Rates in Nursing Facilities. Health Services Research, 42: 1105-1129. ↩︎
- Mukamel, D.B., Weimer, D.L., Harrington, C., Spector, W.D., Ladd, H., and Li, Y. (2012). The Effect of State Rregulatory Stringency on Nursing Home Quality. Health Services Research, 47(5):1791-813. ↩︎
- Park, J., & Stearns, S.C. (2009). Effects of State Minimum Staffing Standards on Nursing Home Staffing and Quality of Care. Health Services Research, 44(1), 56–78. ↩︎
- Institute of Medicine (IOM), Committee on the Adequacy of Nurse Staffing in Hospitals and Nursing Homes. (1996). Nursing Staff in Hospitals and Nursing Homes: Is it Adequate? Washington, DC: National Academy Press. ↩︎
- Institute of Medicine (IOM), Wunderlich, G.S. and Kohler, P., Eds. 2001. Improving the Quality of Long-Term Care. Washington, DC: National Academy of Sciences, IOM. ↩︎
- Institute of Medicine (IOM), Page, A., Eds. 2004. Keeping Patients Safe: Transforming the Work Environment of Nurses. Washington, DC: National Academy of Sciences, IOM. ↩︎
- Harrington, C., Kovner, C., Mezey, M., Kayser-Jones, J., et al. (2000). Experts Recommend Minimum Nurse Staffing Standards for Nursing Facilities in the United States. The Gerontologist. 40 (1): 5-16. ↩︎
- U.S. Centers for Medicare and Medicaid Services, Prepared by Abt Associates. (2001). Appropriateness of Minimum Nurse Staffing Ratios in Nursing Homes. Report to Congress: Phase II Final. Volumes I-III., MD: CMS. ↩︎
- Edelman, T. (2014). Staffing Deficiencies in Nursing Facilities: Rarely Cited, Seldom Sanctioned. Washington, CD: Center for Medicare Advocacy. http://www.medicareadvocacy.org/staffing-deficiencies-in-nursing-facilities-rarely-cited-seldom-sanctioned/ ↩︎
- Schnelle, J.F., Simmons S.F., Harrington, C., Cadogan, M., Garcia, E., and Bates-Jensen, B. (2004). Relationship of Nursing Home Staffing to Quality of Care? Health Services Research. 39 (2):225-250. ↩︎
- Harrington, C. (2005). Nurse Staffing in Nursing Homes in the United States. Part II. J. of Gerontological Nursing. 31 (3): 9-15. ↩︎
- U.S. Centers for Medicare and Medicaid Services (CMS). (2015a). State operations manual. Appendix PP. Guidance for surveyors for long term care facilities. Revision 133, 02-06-15. Baltimore, MD. Accessed June 24, 2015. http://cms.hhs.gov/Regulations-and-Guidance/Guidance/Manuals/downloads/som107ap_pp_guidelines_ltcf.pdf. ↩︎
- U.S. Centers for Medicare and Medicaid Services (CMS). (2015a). State operations manual. Appendix PP. Guidance for surveyors for long term care facilities. Revision 133, 02-06-15. Baltimore, MD. Accessed June 24, 2015. http://cms.hhs.gov/Regulations-and-Guidance/Guidance/Manuals/downloads/som107ap_pp_guidelines_ltcf.pdf. ↩︎
- U.S. Centers for Medicare and Medicaid Services (CMS). (2015b). State operations manual. Chapter 7. Survey and Enforcement Process for Skilled Nursing Facilities and Nursing Facilities. Accessed June 24, 2015. http://www.cms.gov/Regulations-and-Guidance/Guidance/Manuals/Downloads/som107c07.pdf ↩︎
- Genworth Financial. (2017). Annual Median Cost of Long Term Care in the Nation, 2016. Available at: https://www.genworth.com/corporate/about-genworth/industry-expertise/cost-of-care.html. ↩︎
- Jacobson, G., T. Neuman, and M. Musumeci. (2017). What Could a Medicaid Per Capita Cap Mean for Low-Income People on Medicare? (Washington, DC: Kaiser Family Foundation). https://modern.kff.org/medicare/issue-brief/what-could-a-medicaid-per-capita-cap-mean-for-low-income-people-on-medicare/ ↩︎
- Harrington, C., Kovner, C., Mezey, M., Kayser-Jones, J., et al. (2000). Experts Recommend Minimum Nurse Staffing Standards for Nursing Facilities in the United States. The Gerontologist. 40 (1): 5-16. ↩︎
- Grabowski, D. (2001). Medicaid Reimbursement and the Quality of Nursing Home Care. Journal of Health Economics. 20:549-569. ↩︎
- Grabowski, D. and Angelelli, J.J. (2004). The Relationship of Medicaid Payment Rates, Bed Constraint Policies, and Risk-Adjusted Pressure Ulcers. Health Services Research. 39 (4):793-812. ↩︎
- Grabowski, D.C. and Castle, N.G. (2004). Nursing Homes with Persistent High and Low Quality. Medical Care Research and Review. 61 (1): 89-115. ↩︎
- Harrington, C., Swan, J.H., and Carrillo, H. (2007). Nurse Staffing Levels and Medicaid Reimbursement Rates in Nursing Facilities. Health Services Research, 42: 1105-1129. ↩︎
- U.S. Centers for Medicare and Medicaid Services (CMS). (2015a). State operations manual. Appendix PP. Guidance for surveyors for long term care facilities. Revision 133, 02-06-15. Baltimore, MD. Accessed June 24, 2015. http://cms.hhs.gov/Regulations-and-Guidance/Guidance/Manuals/downloads/som107ap_pp_guidelines_ltcf.pdf. ↩︎
- U.S. Centers for Medicare and Medicaid Services. (2014). Nursing Home Data Compendium 2013. Baltimore, MD: CMS. http://www.cms.gov/Medicare/Provider-Enrollment-and-Certification/CertificationandComplianc/downloads/nursinghomedatacompendium_508.pdf ↩︎
- Centers for Medicare and Medicaid Services. (2015). Medicare nursing home compare. http://www.medicare.gov/NursingHomeCompare/search.aspx?bhcp=1 See website data on www.Medicare.data.gov ↩︎
- U.S. General Accounting Office (US GAO) (1988). Report to the Chairman, Subcommittee on Health and Long-Term Care, Select Committee on Aging, House of Representatives. Medicare: Improved Patient Outcome Analysis Could Enhance Quality Assessment. Washington, DC: US GAO. ↩︎
- U.S. General Accounting Office (US GAO) (1999a). Report to the Special Committee on Aging, U.S. Senate. Nursing Homes: Additional Steps Needed to Strengthen Enforcement of Federal Quality Standards. Report No. US GAO/HEHS-99-46. Washington, DC: US GAO. ↩︎
- U.S. General Accounting Office. (1999). Nursing Homes: Complaint Investigation Processes Often Inadequate to Protect Residents. Report to the Special Committee on Aging, U.S. Senate. US GAO/HEHS-99-80. Washington, DC: U.S. General Accounting Office. ↩︎
- U.S. General Accounting Office. (1999). Nursing Home Care: Enhanced HCFA Oversight of State Programs Would Better Ensure Quality. Report to the Special Committee on Aging, U.S. Senate. US GAO/HEHS-00-6. Washington, DC: U.S. General Accounting Office. ↩︎
- U.S. General Accounting Office. (1999). Nursing Homes: Proposal to Enhance Oversight of Poorly Performing Homes Has Merit. Report to the Special Committee on Aging, U.S. Senate. GAO/HEHS-99-157. Washington, DC: U.S. General Accounting Office. ↩︎
- U.S. General Accounting Office. (US GAO) (2000). Nursing Homes: Sustained Efforts Are Essential to Realize Potential of the Quality Initiatives. Report to the Special Committee on Aging, U.S. Senate. US GAO/HEHS-00-197. Washington, DC: U.S. General Accounting Office. ↩︎
- U.S. General Accounting Office. (US GAO) (2004). Nursing Home Quality: Prevalence of Serious Problems, While Declining, Reinforces Importance of Enhanced Oversight. Report to Congressional Requesters, U.S.Senate. US GAO/HEHS-03-561. Washington, DC: U.S. General Accounting Office. ↩︎
- U.S. Government Accountability Office (GAO) (2007). Nursing Home Reform: Continued Attention is Needed to Improve Quality of Care in Small but Significant Share of Homes. GAO-07-794T, Washington, DC: GAO, May 2, 2007. ↩︎
- U.S. Government Accountability Office (GAO) (2009). Nursing homes: Federal monitoring surveys demonstrate continued understatement of serious care problems and CMS oversight weakness. GAO-08-517, Washington, DC: GAO, May 9, 2009. ↩︎
- U.S. Government Accountability Office (GAO) (2009). Medicare and Medicaid participating facilities: CMS needs to reexamine state oversight of health care facilities. GAO-09-64, Washington, DC: GAO, February 13, 2009. ↩︎
- U.S. General Accounting Office (US GAO) (1988). Report to the Chairman, Subcommittee on Health and Long-Term Care, Select Committee on Aging, House of Representatives. Medicare: Improved Patient Outcome Analysis Could Enhance Quality Assessment. Washington, DC: US GAO. ↩︎
- U.S. Centers for Medicare and Medicaid Services (CMS). (2015). State operations manual. Appendix PP. Guidance for surveyors for long term care facilities. Revision 133, 02-06-15. Baltimore, MD. Accessed June 24, 2015. http://cms.hhs.gov/Regulations-and-Guidance/Guidance/Manuals/downloads/som107ap_pp_guidelines_ltcf.pdf ↩︎
- U.S. Centers for Medicare and Medicaid Services (CMS). (2015). Review and Status of Nursing Home Survey: Summary of Traditional and Quality Indicator Survey (QIS) Findings and Issues. Accessed June 24, 2015. http://www.cms.gov/Medicare/Provider-Enrollment-and-Certification/SurveyCertificationGenInfo/Downloads/Survey-and-Cert-Letter-15-40.pdf ↩︎
- Harrington, C., Mullan, J. and Carrillo, H. (2004). State Nursing Home Enforcement Systems. J. of Health Politics, Policy, and Law. 29 (1): 43-73. ↩︎
- U.S. General Accounting Office (US GAO) (1999). Report to the Special Committee on Aging, U.S. Senate. Nursing Homes: Additional Steps Needed to Strengthen Enforcement of Federal Quality Standards. Report No. US GAO/HEHS-99-46. Washington, DC: US GAO. ↩︎
- U.S. General Accounting Office. (1999). Nursing Homes: Complaint Investigation Processes Often Inadequate to Protect Residents. Report to the Special Committee on Aging, U.S. Senate. US GAO/HEHS-99-80. Washington, DC: U.S. General Accounting Office. ↩︎
- U.S. General Accounting Office. (1999). Nursing Home Care: Enhanced HCFA Oversight of State Programs Would Better Ensure Quality. Report to the Special Committee on Aging, U.S. Senate. US GAO/HEHS-00-6. Washington, DC: U.S. General Accounting Office. ↩︎
- U.S. General Accounting Office. (1999). Nursing Homes: Proposal to Enhance Oversight of Poorly Performing Homes Has Merit. Report to the Special Committee on Aging, U.S. Senate. GAO/HEHS-99-157. Washington, DC: U.S. General Accounting Office. ↩︎
- U.S. General Accounting Office. (US GAO) (2000). Nursing Homes: Sustained Efforts Are Essential to Realize Potential of the Quality Initiatives. Report to the Special Committee on Aging, U.S. Senate. US GAO/HEHS-00-197. Washington, DC: U.S. General Accounting Office. ↩︎
- U.S. General Accounting Office. (US GAO) (2004). Nursing Home Quality: Prevalence of Serious Problems, While Declining, Reinforces Importance of Enhanced Oversight. Report to Congressional Requesters, U.S. Senate. US GAO/HEHS-03-561. Washington, DC: U.S. General Accounting Office. ↩︎
- U.S. Government Accountability Office (GAO) (2007). Nursing Home Reform: Continued Attention is Needed to Improve Quality of Care in Small but Significant Share of Homes. GAO-07-794T, Washington, DC: GAO, May 2, 2007. ↩︎
- U.S. Government Accountability Office (GAO) (2009). Nursing homes: Federal monitoring surveys demonstrate continued understatement of serious care problems and CMS oversight weakness. GAO-08-517, Washington, DC: GAO, May 9, 2009. ↩︎
- U.S. Government Accountability Office (GAO) (2009). Medicare and Medicaid participating facilities: CMS needs to reexamine state oversight of health care facilities. GAO-09-64, Washington, DC: GAO, February 13, 2009. ↩︎
- U.S. Office of the Inspector General, Department of Health and Human Services (USOIG). (2004). Nursing Home Deficiency Trends and Survey and Certification Process Consistency. OEI-02-01-00600. Washington, DC: Inspector General. ↩︎
- U.S. Office of the Inspector General (US OIG). (2013). Medicare nursing home resident hospitalization rates merit additional monitoring. OEI-06-11-00040. November. Washington, DC: OIG. ↩︎
- U.S. Office of the Inspector General, Department of Health and Human Services (USOIG). (2004). Nursing Home Deficiency Trends and Survey and Certification Process Consistency. OEI-02-01-00600. Washington, DC: Inspector General. ↩︎
- U.S. General Accounting Office. (1999b). Nursing Homes: Complaint Investigation Processes Often Inadequate to Protect Residents. Report to the Special Committee on Aging, U.S. Senate. US GAO/HEHS-99-80. Washington, DC: U.S. General Accounting Office. ↩︎
- U.S. Government Accountability Office (GAO) (2007). Nursing Home Reform: Continued Attention is Needed to Improve Quality of Care in Small but Significant Share of Homes. GAO-07-794T, Washington, DC: GAO, May 2, 2007. ↩︎
- U.S. Government Accountability Office (GAO) (2009). Nursing homes: Federal monitoring surveys demonstrate continued understatement of serious care problems and CMS oversight weakness. GAO-08-517, Washington, DC: GAO, May 9, 2009. ↩︎
- U.S. Government Accountability Office (GAO) (2009). Medicare and Medicaid participating facilities: CMS needs to reexamine state oversight of health care facilities. GAO-09-64, Washington, DC: GAO, February 13, 2009. ↩︎
- U.S. Office of the Inspector General (US OIG). (2013). Medicare nursing home resident hospitalization rates merit additional monitoring. OEI-06-11-00040. November. Washington, DC: OIG. ↩︎
- U.S. Office of the Inspector General (US OIG). (2014). Adverse Events in Skilled Nursing Facilities: National Incidence Among Medicare Beneficiaries. OEI-06-11-00370. February. Washington, DC: OIG. ↩︎
- Walshe, K. and Harrington, C. (2002). The Regulation of Nursing Facilities in the US: An Analysis of the Resources and Performance of State Survey Agencies. The Gerontologist. 42 (4):475-486. ↩︎
- U.S. General Accounting Office. (US GAO) (2000). Nursing Homes: Sustained Efforts Are Essential to Realize Potential of the Quality Initiatives. Report to the Special Committee on Aging, U.S. Senate. US GAO/HEHS-00-197. Washington, DC: U.S. General Accounting Office. ↩︎
- U.S. General Accounting Office. (US GAO) (2004). Nursing Home Quality: Prevalence of Serious Problems, While Declining, Reinforces Importance of Enhanced Oversight. Report to Congressional Requesters, U.S.Senate. US GAO/HEHS-03-561. Washington, DC: U.S. General Accounting Office. ↩︎
- Morris, J., et al. (1990). Designing the National Resident Assessment Instrument for Nursing Homes. The Gerontologist. 30 (3):293-307. ↩︎
- U.S. Centers for Medicare and Medicaid Services. (2014). MDS quality measures/indicator report. MDS 2.0. http://www.cms.gov/Research-Statistics-Data-and-Systems/Computer-Data-and-Systems/MDSPubQIandResRep/qmreport.html Accessed January 3, 2015. ↩︎
- Saliba, D., Jones, M., Streim, J., Ouslander, J., Berlowitz, D. and Buchanan, J. (2012). Overview of Significant Changes in the Minimum Data Set for Nursing Homes Version 3.0. J. American Medical Directors Association, 13 (7):595-601. ↩︎
- U.S. Centers for Medicare and Medicaid Services (CMS). (2012). Minimum data set 3.0 RAI manual. http://www.cms.gov/Medicare/Quality-Initiatives-Patient-Assessment-Instruments/NursingHomeQualityInits/MDS30RAIManual.html ↩︎
- Medicare Payment Advisory Commission (MedPac). (2014). Report to Congress: Medicare Payment Policy. Skilled Nursing Facility Services, Chapter 8. Washington, DC: MedPac, March, 185-208. ↩︎
- Fries, B.E. and Cooney, L. (1985). Resources Utilization Groups: A Patient Classification System for Long-term Care. Health Care Financing Review. 23 (2):110-122. ↩︎
- Fries, B.E., Schneider, D., Foley, W., and Dowling, M. (1989). Case-mix Classification of Medicare Residents in Skilled Nursing Facilities. Medical Care. 9:843-858. ↩︎
- Fries, B.E., Schneider, D., Foley, W., Gavazzi, M., Burke, R., and Cornelius, E. (1994). Refining a Case-mix Measure for Nursing Homes: Resources Utilization Groups (RUGS-III). Medical Care. 32 (7):666-685. ↩︎
- Centers for Medicare and Medicaid Services (CMS). (2014). CMS announces two Medicare quality improvement initiatives. October 6, 2014. http://www.cms.gov/Newsroom/MediaReleaseDatabase/Press-releases/2014-Press-releases-items/2014-10-06.html. ↩︎
- U.S. Centers for Medicare and Medicaid Services (CMS). (2015). State operations manual. Appendix PP. Guidance for surveyors for long term care facilities. Revision 133, 02-06-15. Baltimore, MD. Accessed June 24, 2015. http://cms.hhs.gov/Regulations-and-Guidance/Guidance/Manuals/downloads/som107ap_pp_guidelines_ltcf.pdf ↩︎
- U.S. Centers for Medicare and Medicaid Services (CMS). (2015). State operations manual. Chapter 7. Survey and Enforcement Process for Skilled Nursing Facilities and Nursing Facilities. Accessed June 24, 2015. http://www.cms.gov/Regulations-and-Guidance/Guidance/Manuals/Downloads/som107c07.pdf ↩︎