Medicaid Enrollment & Spending Growth: FY 2018 & 2019
Issue Brief
A stronger economy was a primary factor driving lower Medicaid enrollment growth and relatively steady spending growth as states finished state fiscal year (FY) 2018 and adopted budgets for FY 2019. This brief analyzes Medicaid enrollment and spending trends for FY 2018 and FY 2019 based on interviews and data provided by state Medicaid directors as part of the 18th annual survey of Medicaid directors in all 50 states and the District of Columbia. The methodology used to calculate enrollment and spending growth as well as additional information about Medicaid financing can be found at the end of the brief. Key findings are described below and in a companion report.
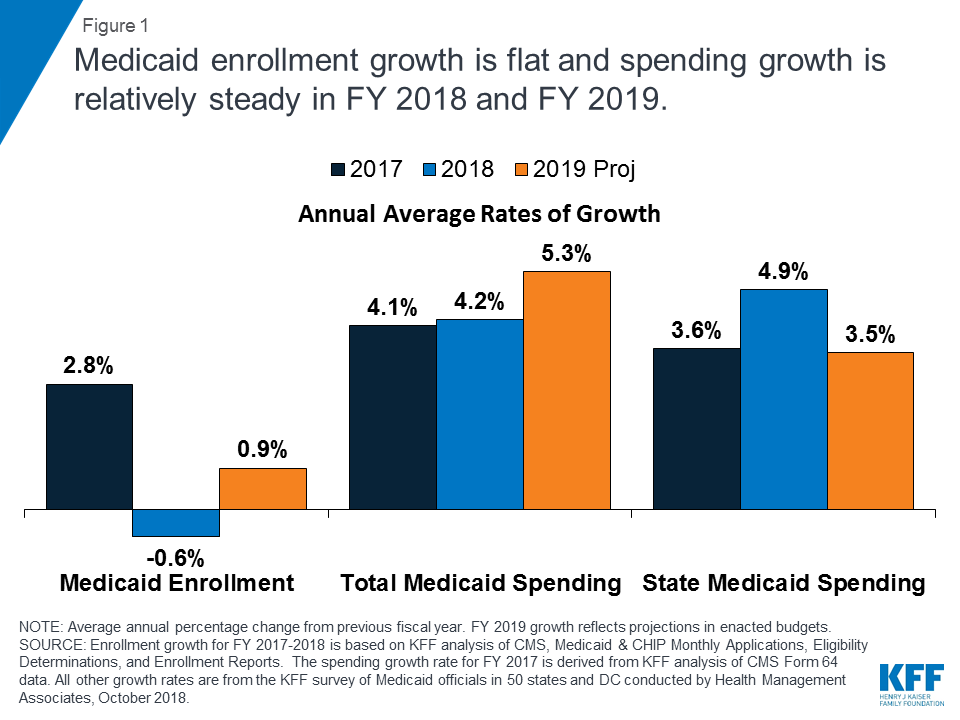
Enrollment: A stronger economy, elimination of redetermination delays in states that had previously implemented new or upgraded eligibility systems, and enhanced verifications and data matching in a number of states resulted in flat enrollment growth in FY 2018 (-0.6%) and projected for FY 2019 (0.9%) (Figure 1). Since peaking in FY 2015, enrollment growth has continued to slow due, in part, to the tapering of ACA enrollment growth.
50-state Medicaid survey finds average spending growth outpaces enrollment due to pressure from rising costs for prescription drugs and long-term services and supports
Spending: Compared to FY 2017, total spending growth was steady in FY 2018 (4.2%) but is projected to accelerate modestly in FY 2019 (5.3%). While slower caseload growth helped to mitigate spending growth in FYs 2018 and 2019, higher costs for prescription drugs, long-term services and supports and behavioral health services, and policy decisions to implement targeted provider rate increases were cited as factors putting upward pressures on total Medicaid spending.
ACA Expansion Financing: After receiving a 100% federal match rate for the expansion group for CYs 2014-2016, states began paying 5% of the costs of the Affordable Care Act (ACA) Medicaid expansion group starting in January 2017 and 6% beginning in January 2018. The declining federal match for the expansion group (which will continue to phase down to 90% by 2020) resulted in state Medicaid spending growth outpacing total spending growth (4.9% compared to 4.2%) in FY 2018, the first full state fiscal year that states were required to pay a share of expansion costs. States anticipate, however, that total spending growth will increase faster than state spending growth for FY 2019. While most states reported financing the state share of expansion costs with general fund dollars, a number of states listed other sources of financing including new or increased provider taxes / fees or savings that accrue from the expansion.
Looking ahead, economic conditions and the outcome of federal and state elections are likely to have implications for Medicaid policymaking as well as for spending and enrollment trends. Potential federal efforts to further change the ACA or cap Medicaid financing as well as state ballot initiatives and other state efforts to adopt the Medicaid expansion are key issues to watch.
Context
Medicaid provided coverage to about one in five Americans, or about 73 million people, as of June 2018.1 Total Medicaid spending was $557 billion in FY 2017 with 62% paid by the federal government and 38% financed by states.2 Medicaid accounts for one in six dollars spent in the health care system, but more than 50% of long-term care spending.3 Key factors affecting total Medicaid spending and enrollment trends over the last decade include the lingering effects of the Great Recession followed by the implementation of the Affordable Care Act (ACA). As of September 2018, 34 states including DC have adopted the ACA Medicaid expansion with Virginia implementation planned for January 1, 2019 and Maine implementation planned for sometime in FY 2019 (the exact date is to be determined).4
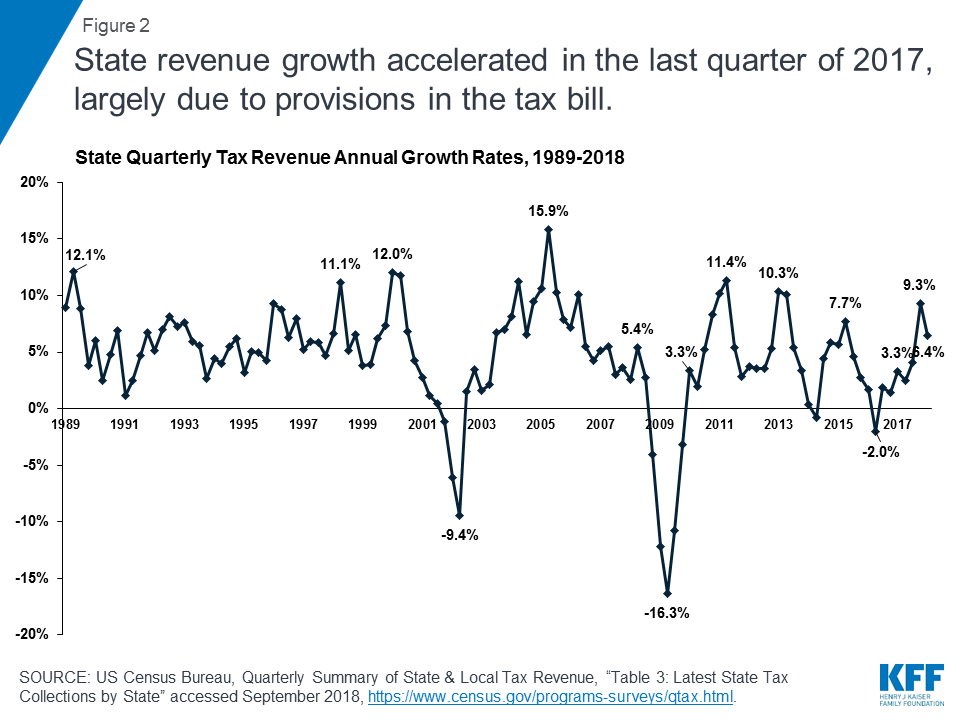
As states finished FY 2018, the economy was still improving compared to prior years. The unemployment rate continued to decline to 3.7% in September 2018, relieving pressure on Medicaid enrollment growth.5 Revenue collections were strong in the 4th quarter of 2017 (halfway through FY 2018), increasing by 9.3% over the same quarter in the prior year (Figure 2). This increase was largely due to accelerated state personal income tax and local property tax payments, as individuals sought to take advantage of state and local tax deductions that became subject to a cap beginning in January 2018 (due to the passage of the Tax Cuts and Jobs Act (TCJA) in December 2017).6 Data from the National Association of State Budget Officers (NASBO) show estimated state revenue growth of 4.9% for FY 2018 with collections at or above original budget projections in 39 states, and 5% or greater in 15 states.7
For most states, revenue growth in FY 2019 is expected to be more moderate than in FY 2018. Most enacted budgets reflect moderate growth in both state revenues and spending. While complete data is not available, governors’ proposed budgets for FY 2019, on average, proposed an increase in nominal general fund revenues of 2.1% and spending of 3.2%.8 New spending allocations in adopted budgets for FY 2019 were frequently directed toward elementary and secondary education (including teacher pay). Other key priorities across states included expanding postsecondary educational opportunities, controlling health care costs, addressing infrastructure demands, reforming corrections systems, and focusing on efforts to address the opioid crisis.9
The economy was still lagging in FY 2018 and FY 2019 in some states. Underneath national trends lies considerable state variation, with a number of states still dealing with economic and/or state budget challenges. For example, Alaska, DC, West Virginia, Louisiana, and Mississippi had the highest state unemployment rates in August 2018, exceeding the national rate by one percentage point or more.10 According to NASBO, seven states estimated zero or negative general fund revenue growth in FY 2018 and 10 states were projecting similar growth rates in FY 2019 at the time of the governor’s budget release; 11 states estimated zero or negative general fund expenditure growth in FY 2018 and eight states were projecting similar expenditure growth in FY 2019 at the time of the governor’s budget release.11
Key Findings
Trends in Enrollment Growth FY 2018 and FY 2019
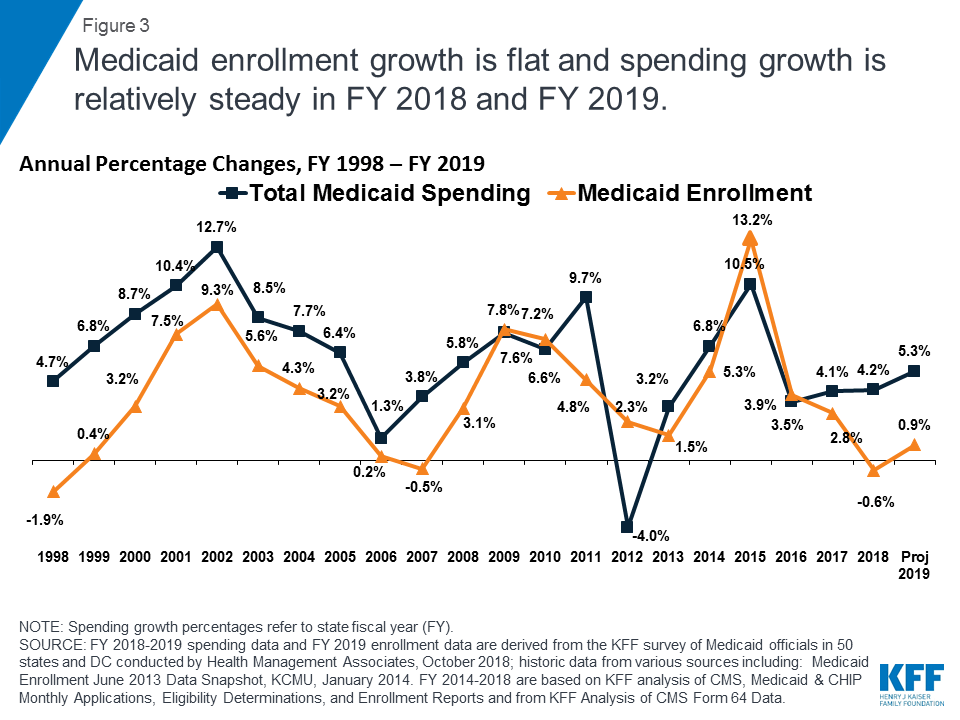
Medicaid enrollment growth was flat in in FY 2018 and FY 2019. Historically, Medicaid enrollment drives growth in Medicaid spending, and enrollment increases during economic downturns and in response to major policy changes. High growth in FY 2015 was largely due to the implementation of the ACA while trends in subsequent years reflect the tapering of ACA-related enrollment and an improving economy. In FY 2018, overall enrollment growth declined slightly (-0.6%). For FY 2019, states similarly project relatively flat enrollment growth of 0.9% (Figure 3).
In addition to the economy and similar to findings reported last year, a number of states that had previously implemented new or upgraded eligibility systems noted that they had eliminated redetermination delays and backlogs, which also contributed to slower, flat, or declining enrollment growth. In addition, some states noted that upgraded systems enabled enhanced verifications of enrollment data that resulted in further downward enrollment pressure. Some states reporting positive enrollment growth noted overall population growth as a factor contributing to upward enrollment growth. About half the states (27 states) reported enrollment declines for FY 2018 and 10 states reported declines for FY 2019.
Relative to other groups, expansion adults had the highest median growth rate in both FY 2018 and FY 2019, followed by the median growth rate for the aged and persons with disabilities. In contrast, many states reported slow or negative growth for children and non-expansion adults in FY 2018 and FY 2019. Lower enrollment growth for children and adults (lower-cost populations) relative to the aged and persons with disabilities (more costly groups) changes the case mix of the overall Medicaid population with implications for spending growth.
Trends in Spending Growth FY 2018 and FY 2019
Growth in total Medicaid spending was relatively steady in FY 2018 and 2019. High rates of enrollment growth, tied first to the Great Recession and later to the implementation of the ACA, were the primary drivers of total Medicaid spending growth over the last decade. Compared to FY 2017, total Medicaid spending growth held steady at 4.2% in FY 2018 but is projected to accelerate modestly to 5.3% in FY 2019. State Medicaid directors noted that slower enrollment growth driven by an improved economy and low unemployment as well as care management and other cost containment measures were helping to curb growth in Medicaid spending.
Medicaid officials identified increasing costs for prescription drugs (particularly for specialty drugs), long-term services and supports and behavioral health services, and policy decisions to increase payment rates to specific provider groups as factors putting upward pressure on total Medicaid spending. A few states mentioned enrollment growth overall or for particular groups as a spending driver, sometimes citing expansion adults or high cost populations. Other states noted that medical inflation, which trends higher than general inflation, pushes Medicaid spending growth higher than spending growth in other programs. When asked about trends in spending per enrollee, about one in four states reported that per enrollee costs for the aged and persons with disabilities was growing faster than for other groups, potentially amplifying underlying changes in the case mix of the overall Medicaid population.
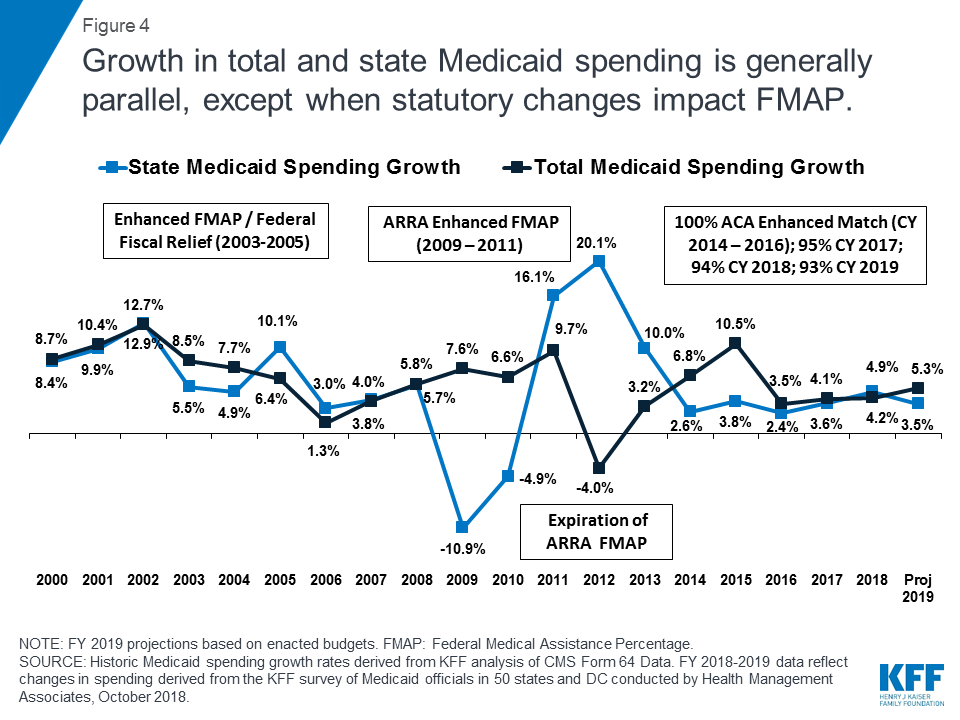
Total spending and the state share of Medicaid spending grow in tandem unless there is a change in the federal match rate. Following the implementation of the ACA, the enrollment of millions of expansion adults at a 100% federal match rate resulted in lower overall state spending growth compared to total spending growth. Mid-way through FY 2017, expansion states began paying 5% of the costs of the new group, and this amount increased to 6% in January 2018. FY 2018 was therefore the first full state fiscal year that states were responsible for paying for a share of the Medicaid expansion. As a result, state Medicaid spending growth slightly outpaced total Medicaid spending growth in FY 2018 (4.9% growth in state spending compared to 4.2% overall). While states will begin to pay 7% of the costs of the expansion group in January 2019, total Medicaid spending growth is nevertheless projected to outpace state Medicaid spending growth (5.3% growth in total spending compared to 3.5% state spending growth) (Figure 4).
State spending growth for Medicaid typically outpaces overall state general fund growth as medical costs have historically grown faster than inflation. During the first three years of ACA implementation (2014-2016), however, state spending for Medicaid grew at a slower pace compared to overall state general fund growth due to the enhanced federal match rate for expansion adults. In FY 2017 and FY 2018, the historic trend resumed with average general fund spending growth of 3.0% and 3.4%, respectively, slightly lower than state Medicaid spending growth of 3.6% and 4.9%, respectively.
While most states reported financing the state share of expansion costs with general fund dollars, a number of states listed other sources of financing including new or increased provider taxes / fees or savings accrued as a result of the expansion. Some states listed other funding including local government funds in Illinois, cigarette taxes in Indiana, increases in drug rebates in Kentucky, and “other revenue” in New Hampshire. Several expansion states reported multiple sources of financing (Exhibit 1).
| Exhibit 1: Medicaid Expansion Population Non-Federal Share Financing | ||
| # of States | States | |
| New Provider Tax/Fee | 5 | AZ, LA, OR, PA, VA |
| Increase of Existing Provider Tax/Fee | 7 | AR, CO, IL, IN, MI, OR, PA |
| Savings from Medicaid Expansion* | 7 | CA, DE, MI, MT, NH, NY, PA |
| State General Fund | 28 | AK, AR, CA, CT, DC, DE, HI, IA, IL, KY, LA, MA, MD, MI, MN, MT, ND, NJ, NM, NV, NY, OH, OR, PA, RI, VT, WA, WV |
| Other^ | 4 | IL, IN, KY, NH |
| *States reported financing the non-federal share with savings from the Medicaid expansion in a number of areas, including corrections, mental health, and transition of previously state-funded populations into the expansion group. ^ “Other” entries reflect local government funds in IL, cigarette taxes in IN, increases in drug rebates in KY, and “other revenue” in NH. | ||
Conclusion and Looking Ahead
States started FY 2019 bolstered by strong revenue growth in FY 2018 and projecting continued revenue and spending growth for FY 2019. A stronger economy contributed to flat enrollment growth, which in turn mitigated Medicaid spending growth. However, rising costs for prescription drugs and long-term services and supports as well as targeted provider rate increases and medical inflation were cited as factors contributing to upward spending growth. Looking ahead, federal and state elections in November 2018 are likely to have important implications for Medicaid. The outcome of federal elections could determine whether Congress takes up legislation to make further changes to the ACA or to reform and cap Medicaid financing. State-level gubernatorial and legislative elections could have implications for states considering Medicaid expansion or Section 1115 demonstration waivers. Thirty-six states have gubernatorial elections this year and three states (Idaho, Nebraska, and Utah) have ballot initiatives to newly adopt the ACA Medicaid expansion. FY 2019 will be a year to watch how Medicaid’s role evolves on the ground in the 50 states and DC.
Methods
Definition of Medicaid Spending. Total Medicaid spending includes all payments to Medicaid providers for Medicaid-covered services provided to enrolled Medicaid beneficiaries. Medicaid spending also includes special disproportionate share hospital (DSH) payments that subsidize uncompensated hospital care for persons who are uninsured and unreimbursed costs of care for persons on Medicaid. Not included in total Medicaid spending are Medicaid administrative costs and federally mandated state “Clawback” payments to Medicare (to help finance the Medicare Part D prescription drug benefit for Medicaid beneficiaries who are also enrolled in Medicare). States are also asked to exclude costs for the Children’s Health Insurance Program (CHIP), though a few states provided percentage changes for spending that reflected Medicaid and CHIP combined. Total Medicaid spending includes payments financed from all sources, including state funds, local contributions, and federal matching funds. Historical state Medicaid spending refers to all non-federal spending, which may include local funds and provider taxes and fees as well as state general fund dollars.
Methodology. The Kaiser Family Foundation (KFF) commissioned Health Management Associates (HMA) to survey Medicaid directors in all 50 states and DC to identify and track trends in Medicaid spending, enrollment, and policy making. Given differences in the financing structure of their programs, the U.S. territories were not included in this analysis. This is the eighteenth annual survey, conducted at the beginning of each state fiscal year from FY 2002 through FY 2018. The KFF/HMA Medicaid survey for this report was sent to each Medicaid director in June 2018. Medicaid directors and staff responded to the written survey and participated in follow-up telephone interviews from June through September 2018. The telephone discussions are an integral part of the survey to ensure complete and accurate responses and to record the complexities of state actions. Forty-nine states and DC completed surveys and participated in telephone discussions, while the survey responses for one state (North Dakota) reflect information gathered during a telephone interview in early September 2018 and related research.
For FY 2018 and FY 2019, annual rates of growth for Medicaid spending were calculated as weighted averages across all states. Weights for spending were derived from the most recent state Medicaid expenditure data for FY 2017, based on estimates prepared for KFF by the Urban Institute using CMS Form 64 reports, adjusted for state fiscal years. These data were also used for historic Medicaid spending. In FY 2013, however, wide, inexplicable variation across the states inflated the overall growth rate. To adjust for this anomaly, spending growth from FYs 2012, FY 2013, and FY 2014 was averaged to estimate growth in FY 2013. The resulting estimate is similar to trends reported by the National Association of State Budget Officers (NASBO).
Medicaid average annual growth rates for enrollment were calculated using weights based on Medicaid and CHIP monthly enrollment data for June 2018 published by CMS. Historical enrollment trend data for FY 1998 to FY 2013 reflects the annual percentage change from June to June of monthly enrollment data for Medicaid beneficiaries collected from states. Enrollment trend data for FY 2014 to FY 2018 reflects growth in average monthly enrollment based on Medicaid & CHIP Monthly Applications, Eligibility Determinations, and Enrollment Reports from CMS. The baseline for FY 2013 was the monthly average of July 2013 through September 2013 as of August 2015. FY 2014 was estimated by averaging the monthly average of July 2013 through September 2013 with the monthly average of January 2014 through June 2014. The data reported for FYs 2018 and FY 2019 for Medicaid spending and FY 2019 for Medicaid enrollment are weighted averages, and therefore, data reported for states with larger enrollment and spending have a greater effect on the national average. Additional information collected in the survey on policy actions taken during FY 2018 and FY 2019 can be found in the companion report.
Appendix
Background on Medicaid Financing
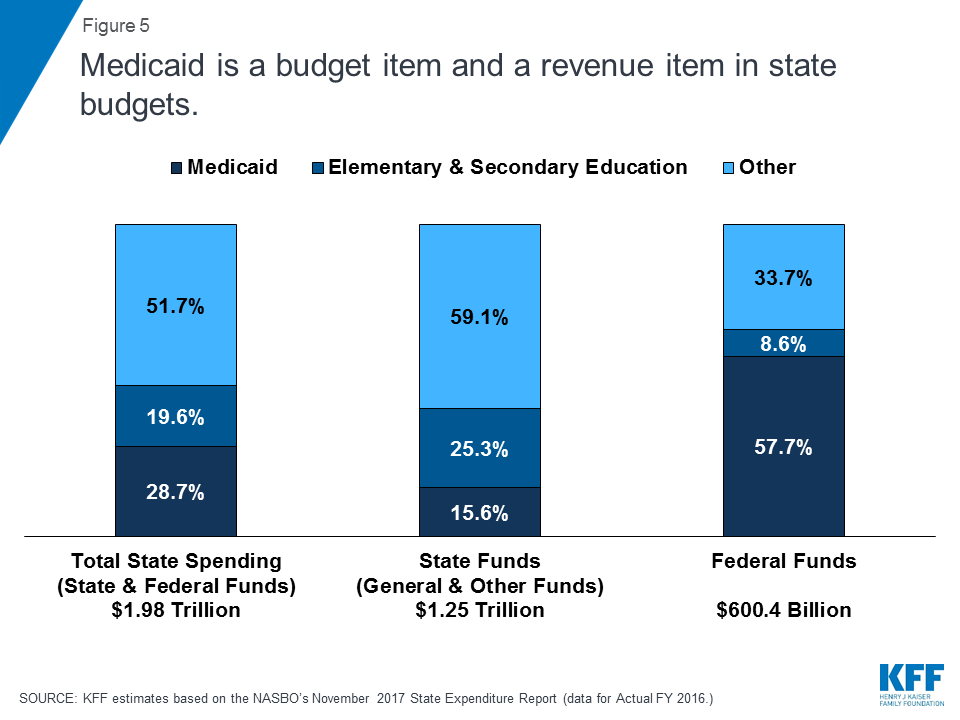
Medicaid Financing Structure. The federal government jointly funds the Medicaid program with states by matching qualifying state Medicaid expenditures. The federal match rate (known as the Federal Medical Assistance percentage, or FMAP) is calculated annually for each state using a statutory formula based on a state’s average personal income relative to the national average which results in higher FMAP rates for poorer states. The FMAP formula relies on three years of lagged personal income data, so data for FFYs 2014 to 2016 was used to calculate FFY 2019 FMAP rates which range from a floor of 50% (applicable to 14 states) to a high of 76.3% (for Mississippi).12 As a result of the federal matching structure, Medicaid is both a state budget expenditure item and a source of federal revenue for states. In FY 2016 (the latest year of actual data), Medicaid accounted for 28.7% of total state spending, but 15.6% of state funds (general fund plus other state funds), a far second to spending on K-12 education (25.3% of state funds). Medicaid is the largest single source of federal funds for states, accounting for half (57.7%) of all federal funds for states. (Figure 5).13
Medicaid and the Economy. Medicaid is a countercyclical program. During economic downturns, more people qualify and enroll in Medicaid, increasing program spending at the same time that state tax revenues may be stagnating or falling. To mitigate these budget pressures, Congress has twice passed temporary FMAP increases to help support states during economic downturns, most recently in 2009 as part of the American Recovery and Reinvestment Act (ARRA). The ARRA-enhanced FMAP rates were the primary vehicle for federal fiscal relief to states during the “Great Recession,” providing states over $100 billion in additional federal funds over 11 quarters, ending in June 2011.14
Medicaid and the ACA. Effective January 1, 2014, the ACA expanded Medicaid eligibility to millions of non-elderly adults with income at or below 138% of the federal poverty level (FPL) – about $16,753 per year for an individual in 2018. The law also provided 100% federal funding for expansion adults through 2016, phasing down to 90% in 2020 and future years. While the June 2012 Supreme Court ruling on the ACA effectively made the Medicaid expansion optional for states, as of September 2018, 34 states (including the District of Columbia) had adopted the expansion. The ACA also required all states to implement new streamlined and coordinated application, enrollment, and renewal processes, including transitioning to a new income standard (Modified Adjusted Gross Income or MAGI) and eliminating asset tests to determine Medicaid financial eligibility for non-elderly, non-disabled populations.
Endnotes
- The Kaiser Family Foundation State Health Facts. Total Monthly Medicaid and CHIP Enrollment July 2018 (accessed September 2018) https://modern.kff.org/health-reform/state-indicator/total-monthly-medicaid-and-chip-enrollment/?currentTimeframe=0&sortModel=%7B%22colId%22:%22Location%22,%22sort%22:%22asc%22%7D. ↩︎
- The Kaiser Family Foundation analysis of Centers for Medicare and Medicaid Services, Form CMS-64 Data, accessed October 2018. https://modern.kff.org/medicaid/state-indicator/federalstate-share-of-spending/?dataView=1¤tTimeframe=0&sortModel=%7B%22colId%22:%22Location%22,%22sort%22:%22asc%22%7D. ↩︎
- Kaiser Family Foundation estimates based on 2016 National Health Expenditure Accounts data from CMS, Office of the Actuary. ↩︎
- The Kaiser Family Foundation State Health Facts. Status of State Action on the Medicaid Expansion Decision (accessed September 2018). https://modern.kff.org/health-reform/state-indicator/state-activity-around-expanding-medicaid-under-the-affordable-care-act/?currentTimeframe=0&sortModel=%7B%22colId%22:%22Location%22,%22sort%22:%22asc%22%7D . ↩︎
- Labor Force Statistics from the Current Population Survey, Bureau of Labor Statistics. Data extracted on October 15, 2018, https://data.bls.gov/timeseries/LNS14000000. ↩︎
- Lucy Dadayan, Robust State and Local Revenue Growth in the Fourth Quarter of 2017; Federal Tax Cuts Cloud Horizon (Albany, NY: Nelson A. Rockefeller Institute of Government, May 2018), http://rockinst.org/issue-area/robust-state-and-local-revenue-growth-in-the-fourth-quarter-of-2017-federal-tax-cuts-cloud-horizon/. ↩︎
- Fiscal Survey of the States, Spring 2018. National Association of State Budget Officers, https://www.nasbo.org/reports-data/fiscal-survey-of-states. ↩︎
- Fiscal Survey of the States, Spring 2018. National Association of State Budget Officers, https://www.nasbo.org/reports-data/fiscal-survey-of-states. ↩︎
- Summaries of Fiscal Year 2019 Proposed & Enacted Budgets, August 31, 2018. National Association of State Budget Officers, https://higherlogicdownload.s3.amazonaws.com/NASBO/9d2d2db1-c943-4f1b-b750-0fca152d64c2/UploadedImages/Issue%20Briefs%20/Summaries_of_FY19_Proposed__Enacted_Budgets.pdf. ↩︎
- Bureau of Labor Statistics, Unemployment Rates for States, Seasonally Adjusted, August 2018. https://www.bls.gov/web/laus/laumstrk.htm. ↩︎
- Fiscal Survey of the States, Spring 2018. National Association of State Budget Officers, https://www.nasbo.org/reports-data/fiscal-survey-of-states. ↩︎
- The Kaiser Family Foundation State Health Facts. Data Source: Federal Register, November 21, 2017 (Vol 82, No. 223), pp 80078-80080. https://modern.kff.org/medicaid/state-indicator/federal-matching-rate-and-multiplier/?currentTimeframe=0&sortModel=%7B%22colId%22:%22FMAP%20%age%22,%22sort%22:%22desc%22%7D. ↩︎
- Kaiser Family Foundation estimates based on the data reported in: National Association of State Budget Officers, State Expenditure Report – Examining Fiscal 2015-2017 State Spending (Washington, DC: National Association of State Budget Officers, November 2017), https://higherlogicdownload.s3.amazonaws.com/NASBO/9d2d2db1-c943-4f1b-b750-0fca152d64c2/UploadedImages/SER%20Archive/State_Expenditure_Report__Fiscal_2015-2017_-S.pdf. ↩︎
- To be eligible for ARRA funds, states could not restrict eligibility or tighten enrollment procedures in Medicaid or CHIP. Vic Miller, Impact of the Medicaid Fiscal Relief Provisions in the American Recovery and Reinvestment Act (ARRA) (Washington, DC: Kaiser Commission on Medicaid and the Uninsured, October 2011), https://modern.kff.org/medicaid/issue-brief/impact-of-the-medicaid-fiscal-relief-provisions/. ↩︎