Key Questions About Medicaid Home and Community-Based Services Waiver Waiting Lists
Issue Brief
Unlike nearly all other Medicaid-covered services, states use optional waivers1 to provide most home and community-based services (HCBS). Seniors, people with disabilities, and those with chronic conditions rely on Medicaid HCBS to live independently outside of nursing homes and other institutions. HCBS waivers enable states to expand Medicaid financial eligibility and offer benefits targeted to a particular population; these waivers also allow states to choose – and limit – how many people are served. States’ ability to cap HCBS waiver enrollment can result in waiting lists when the number of people seeking services exceeds the number of waiver slots available.
Latest @KaiserFamFound survey of home- and community-based service waiver programs finds more than 700K people were on waiting lists nationally in 2017
This issue brief presents the latest data and answers key questions about HCBS waiver waiting lists from the Kaiser Family Foundation’s 17th annual survey of state Medicaid HCBS programs. Appendix Tables contain state-level data. Related briefs present state-level HCBS enrollment and spending data and highlight themes in state HCBS policies.
Key findings about Medicaid HCBS waiver waiting lists include:
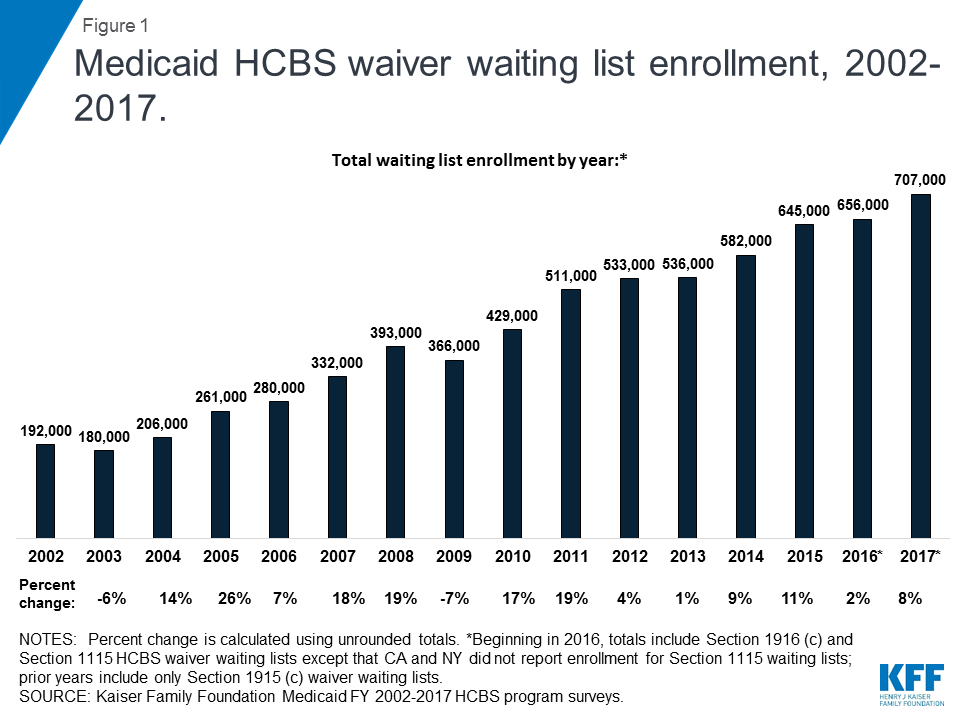
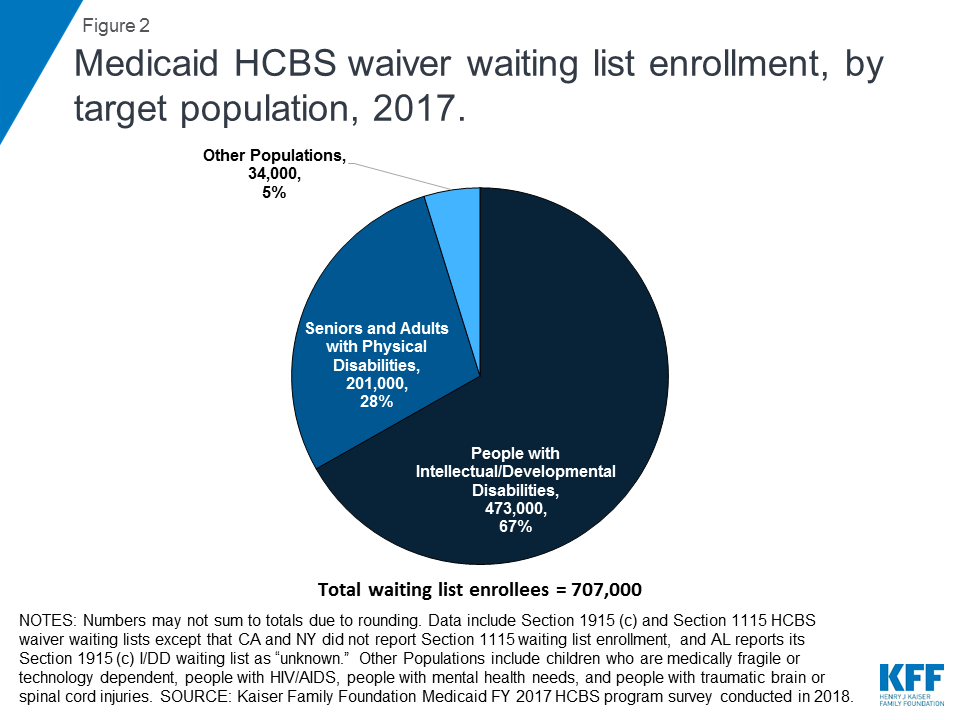
- Over 707,000 people are on HCBS waiver waiting lists in 40 states as of 2017, an increase of eight percent over 2016. People with intellectual and developmental disabilities (I/DD) comprise about two-thirds of total waiver waiting list enrollment, while over one-quarter are seniors and adults with physical disabilities.
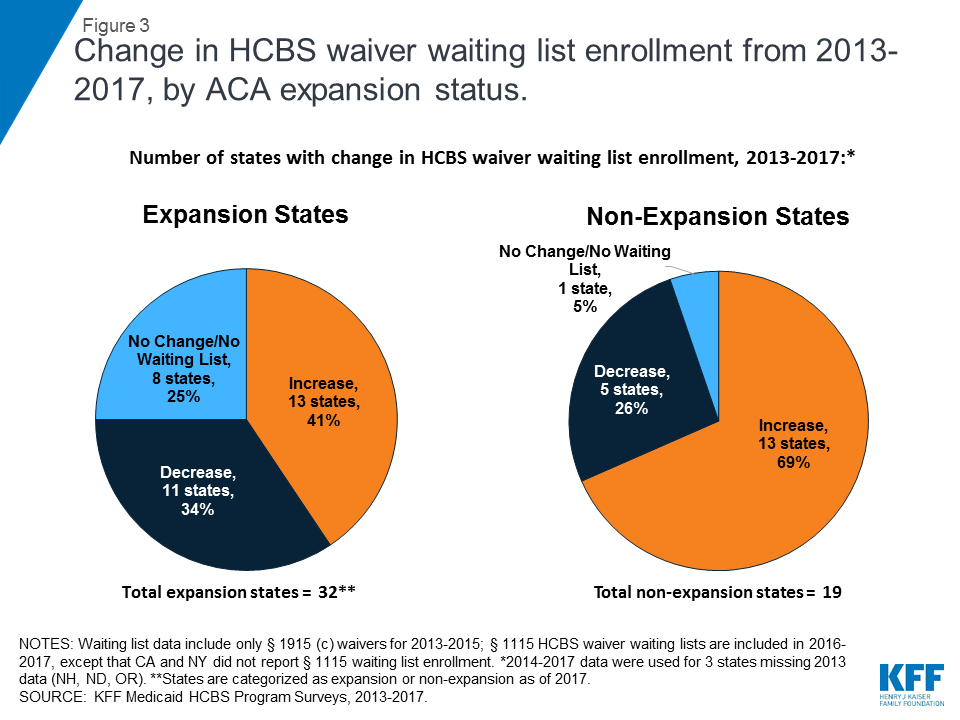
- The data do not support the conclusion that there is a relationship between a state’s ACA Medicaid expansion status and changes in its HCBS waiver waiting list. From 2013 to 2017, a higher share of non-expansion states (69%, 13 of 19) had an increase in waiver waiting list enrollment, compared to the share of expansion states (41%, 13 of 32).
- Waiting list data alone are an incomplete measure of state capacity and demand for HCBS and are not directly comparable across states. The populations served and how they are defined vary among states, and everyone on waiting lists may not be eligible for services.
Medicaid fills an important gap as the sole source of coverage for most HCBS. While waiver waiting lists suggest some degree of unmet need for HCBS, this reflects and is more accurately attributed to gaps in the U.S. health care system as a whole, not shortcomings of Medicaid alone.
1. Who are the people on HCBS waiver waiting lists?
Over 707,000 people are on HCBS waiver waiting lists nationally in 2017,2 an increase of eight percent over 2016 (Figure 1 and Appendix Table 1).3 This increase is consistent with the average annual percent change in waiver waiting list enrollment over the last 15 years, which was nine percent. Total national waiver waiting list enrollment has increased each year since 2010.
More than three-quarters of states (40 out of 51) report an HCBS waiver waiting list for at least one target population in 2017 (Appendix Table 1).4 Every state offers at least one HCBS waiver targeted to one or more populations.5 The total number of waivers varies by state, depending on the number of populations targeted and/or the waiver authority used.6 Nationally, there are a total of 287 HCBS waivers, including those under Section 1915 (c) and those under Section 1115, across all 50 states and DC, in 2017.7
Although some people joined waiver waiting lists between 2016 and 2017, others left a waiting list and began receiving waiver services during this period. For example, 67,000 people moved off waiting lists and began receiving services in 2017, in the 27 states that could report such data.8 Waiver waiting lists are dynamic, with some people joining a list to seek services, while others leave the list and begin receiving services. People may move off a waiting list and begin receiving services when a state increases waiver capacity by funding new slots or when an existing waiver enrollee stops receiving services due to a change in income, functional need, age, state residency, or another reason relevant to waiver eligibility.
People with I/DD comprise about two-thirds (67%, about 473,000 in 36 states)9 of total waiver waiting list enrollment (Figure 2 and Appendix Table 1). Seniors and adults with physical disabilities account for over one-quarter (28%, about 201,000 in 20 states)10 of total waiting list enrollment. The remaining five percent of waiver waiting list enrollment is spread among other populations, including children who are medically fragile or technology dependent (about 29,000 in six states),11 people with traumatic brain or spinal cord injuries (TBI/SCI, about 3,400 in eight states),12 ) people with mental illness (about 1,400 in three states),13 and people with HIV/AIDS (about 80 in 1 state.)14
The waiting period for waiver services averaged 30 months across all waivers with waiting lists in 2017, with substantial variation by target population (Appendix Table 2).15 The average waiting period by population ranged from four months for waivers targeting people with HIV/AIDS to 66 months for waivers targeting people with I/DD.
Almost all (39 of 40) states with waiting lists prioritize individuals with certain characteristics to receive services when slots become available.16 For example, 23 states offer waivers that give priority to individuals who meet specific crisis or emergency criteria, 22 states prioritize people who are moving from an institution to the community, and 19 states prioritize people who are at risk of entering an institution without waiver services (no data shown). Fewer states prioritize individuals based on assessed level of need (9) or age (6). Twenty-two states use more than one priority group.17
2. Is there a relationship between HCBS waiver waiting lists and state choices about the ACA Medicaid expansion?
The data do not support the conclusion that there is a relationship between a state’s ACA Medicaid expansion status and changes in its HCBS waiver waiting list. Over the period just prior to ACA expansion through the first four years of expansion coverage (2013 to 2017), a higher share of non-expansion states (69%, 13 of 19) had an increase in HCBS waiver waiting list enrollment, compared to the share of expansion states (41%, 13 of 32) (Figure 3 and Appendix Table 3).18
Medicaid HCBS waiver waiting lists pre-date the ACA’s Medicaid expansion, which became effective in most states in 2014. As explained above, waiver waiting lists result from the fact that federal Medicaid law allows states to limit and cap waiver enrollment. This program feature has existed since HCBS waiver authority was created in the early 1980s.19 States have reported waiver waiting lists in each year of our HCBS waiver policy survey, dating back to 2002. The increase in the number of people receiving Medicaid HCBS, and the number of people in need of those services, over the years is attributable to a number of factors, including the aging of the population; medical and technological advances that prolong the lifespan, provide previously unavailable treatments for certain conditions, and offer new options to support independent community living; changing individual and societal preferences for HCBS in lieu of institutional care; and state efforts to meet their community integration obligations under the Americans with Disabilities Act (ADA) and the Olmstead decision.20
The ACA Medicaid expansion includes – and provides a new coverage pathway for – some people with disabilities and chronic conditions who were previously ineligible. While people who receive Supplemental Security Income (SSI) benefits and those dually eligible for Medicare and Medicaid are excluded from the ACA Medicaid expansion group, many expansion adults nevertheless have disabilities and/or chronic health conditions.21 The ACA Medicaid expansion has enabled some people who were not previously eligible for coverage, and otherwise would be uninsured, to gain coverage.22 Some of these people have conditions that may not rise to the stringent level required to establish SSI eligibility, yet still have an ongoing need for health care services. Others may qualify for Social Security Disability Insurance (SSDI) benefits but, without the Medicaid expansion pathway, could be uninsured during the required 24-month waiting period before Medicare eligibility. Medicaid expansion coverage can include access to needed HCBS, such as home health or personal care state plan services; to the extent that those services meet the needs of expansion adults with disabilities or chronic conditions, these adults may choose not to pursue HCBS waiver coverage – and not join a waiver waiting list – because state plan coverage is available to them.23
3. Why is waiver waiting list data not directly comparable among states?
Waiting lists are a function of the populations a state chooses to serve and how the state defines those populations; both of these factors vary among states, making waiting lists an incomplete measure of state capacity and demand for HCBS and not directly comparable among states. While all states have waivers serving people with I/DD, seniors, and adults with physical disabilities, fewer states offer waiver services for other target populations. Consequently, there may be a particular population in need of services, but the state does not keep a waiting list because it does not offer a waiver for that population. In addition, all states do not define the eligibility criteria for their waiver target populations in the same way.24 Furthermore, all individuals on waiting lists ultimately may not be eligible for waiver services. For example, 31 states with waiting lists screen individuals for waiver eligibility before they are placed or while they are on a waiting list, while nine states do not. The nine states that do not screen for waiver eligibility comprise 57% (402,000) of the total waiting list population.25
All states with waiting lists provide non-waiver Medicaid services (i.e., state plan services) to people who are waiting for waiver services. Medicaid state plan services can include some HCBS, such as home health and personal care. Nearly all (93%) of people on waiver waiting lists currently live in the community.26
Looking Ahead
As the primary payer for long-term services and supports, and the only source of many HCBS that are vital to seniors and people with disabilities and chronic conditions, Medicaid fills an important gap in the spectrum of health care coverage options available today.27 Medicare covers only a limited amount of skilled post-acute care; private insurance typically does not cover HCBS, especially to the extent needed by people who rely on those services to meet daily needs over time; and out-of-pocket costs can be financially prohibitive. Medicaid also plays an essential role by offering federal financing to help states meet their ADA community integration obligations. Until other sources of long-term care coverage become more widely available and affordable, states, providers, and people who need HCBS will continue to rely on Medicaid to provide these necessary services. While waiver waiting lists suggest a degree of unmet need for HCBS, this reflects and is more accurately attributed to gaps in the U.S. health care system as a whole rather than shortcomings of the Medicaid program alone.
Appendix Tables
| Appendix Table 1: Medicaid HCBS Waiver Waiting List Enrollment, by Target Population and by State, 2017 | |||||||||
| State | Waiting List Enrollment by Target Population | Total Waiting List Enrollment: | |||||||
| I/DD | Seniors | Seniors & Adults with Physical Disabilities | Adults with Physical Disabilities | Med. Fragile/Tech Dep.Children | HIV/AIDS | Mental Health | TBI/SCI | ||
| Alabama | unknown | 4,175 | 19 | 0 | 4,194 | ||||
| Alaska | 629 | 0 | 0 | 629 | |||||
| Arizona | 0 | 0 | 0 | ||||||
| Arkansas | 2,834 | 0 | 2,834 | ||||||
| California | 0 | 1,650 | 3,352* | 2,600 | 0 | 81 | 7,683* | ||
| Colorado | 3,115 | 0 | 0 | 0 | 0 | 3,115 | |||
| Connecticut | 1,521 | 0 | 1,556 | 231 | 50 | 1,643 | 5,001 | ||
| Delaware | 0 | 0 | 0 | 0 | 0 | 0 | 0 | 0 | |
| DC | 0 | 0 | 0 | ||||||
| Florida | 21,017 | 49,798 | 0 | 0 | 201 | 71,016 | |||
| Georgia | 6,966 | 800 | 44 | NR | 7,810 | ||||
| Hawaii | 0 | 0 | 0 | 0 | 0 | 0 | 0 | ||
| Idaho | 0 | 0 | 0 | ||||||
| Illinois | 19,354 | 0 | 0 | 0 | 0 | 0 | 0 | 19,354 | |
| Indiana | 1,368 | 0 | 36 | 1,404 | |||||
| Iowa | 2,620 | 0 | 3,278 | 0 | 1,214 | 892 | 8,004 | ||
| Kansas | 3,677 | 0 | 807 | 0 | 0 | 0 | 4,484 | ||
| Kentucky | 5,878 | 0 | 0 | 213 | 6,091 | ||||
| Louisiana | 27,509 | 38,480 | 0 | 65,989 | |||||
| Maine | 1,515 | 0 | 0 | 1,515 | |||||
| Maryland | 11,023 | 24,000 | 120 | 0 | 35,143 | ||||
| Massachusetts | 0 | 0 | 0 | 0 | 0 | ||||
| Michigan | 0 | 3,223 | 0 | 3,223 | |||||
| Minnesota | 237 | 0 | 0 | 0 | 237 | ||||
| Mississippi | 1,652 | 8,642 | 2,867 | 304 | 13,465 | ||||
| Missouri | 0 | 0 | 0 | 0 | 0 | ||||
| Montana | 1,524 | 539 | 93 | 2,156 | |||||
| Nebraska | 3,142 | 0 | 0 | 3,142 | |||||
| Nevada | 809 | 198 | 166 | 1,173 | |||||
| New Hampshire | 105 | 0 | 0 | 105 | |||||
| New Jersey | NR | 0 | 0 | ||||||
| New Mexico | 4,364 | 13,498 | 17,862 | ||||||
| New York | 0 | NR | 0 | unknown | NR | unknown | |||
| North Carolina | 11,000 | 3,487 | 0 | 14,487 | |||||
| North Dakota | 8 | 0 | 0 | 3 | 11 | ||||
| Ohio | 68,644 | 0 | 0 | 68,644 | |||||
| Oklahoma | 7,659 | 0 | 42 | 7,701 | |||||
| Oregon | 11 | 0 | 99 | 110 | |||||
| Pennsylvania | 9,504 | 0 | 0 | 0 | 9,504 | ||||
| Rhode Island | 0 | 0 | 0 | 0 | 0 | 0 | 0 | 0 | 0 |
| South Carolina | 10,409 | 0 | 0 | 0 | 0 | 0 | 10,409 | ||
| South Dakota | 350 | 0 | 0 | 350 | |||||
| Tennessee | 7,428 | 0 | 7,428 | ||||||
| Texas | 217,786 | 35,179 | 28,416 | 0 | 281,381 | ||||
| Utah | 2,628 | 139 | 0 | 30 | 83 | 94 | 2,974 | ||
| Vermont | 0 | 0 | 0 | 0 | |||||
| Virginia | 12,266 | 0 | NR | 12,266 | |||||
| Washington | 0 | 0 | 0 | ||||||
| West Virginia | 1,317 | 763 | 12 | 2,092 | |||||
| Wisconsin | 2,934 | 1,264 | 0 | 4,198 | |||||
| Wyoming | 194 | 0 | 0 | 0 | 194 | ||||
| TOTAL: | 472,997 | 1,987 | 187,200 | 11,409 | 28,952 | 81 | 1,357 | 3,395 | 707,378 |
| NOTES: I/DD = intellectual and developmental disabilities. TBI = traumatic brain injury. SCI = spinal cord injury. Data include § 1915 (c) and § 1115 HCBS waivers. States may offer more than one § 1915 (c) waiver per target population category. NR indicates state did not respond to question. Blank cell indicates state does not have a waiver serving this population. *CA data include § 1915 (c) waivers only; CA did not report waiver waiting list enrollment for its § 1115 waiver for seniors and adults with physical disabilities.SOURCE: KFF Medicaid HCBS Waiver Program Survey, FY 2017. | |||||||||
| Appendix Table 2: Average Wait Time by Population for Medicaid HCBS Waivers with Waiting Lists, 2017* | |||||||||
| Target Population: | I/DD | Seniors | Seniors & Adults with Physical Disabilities | Adults with Physical Disabilities | Med. Fragile/Tech Dep.Children | HIV/AIDS | Mental Health | TBI/SCI | All Populations |
| Average Number of Months Waiting: | 66 | 64 | 25 | 13 | 33 | 4 | 11 | 27 | 30 |
| NOTES: I/DD = intellectual and developmental disabilities. TBI = traumatic brain injury. SCI = spinal cord injury. Data include § 1915 (c) and § 1115 waivers. *Of the 40 states reporting one or more waivers with a waiting list in 2017, 27 states reported average wait time for at least one waiver with a waiting list (AL, AK, AR, CA, CO, CT, FL, GA, IN, IA, KS, LA, MD, MI, MS, MT, NE, NV, NH, NM, NC, OK, OR, SD, TX, WV, and WY), and 13 states (IL, KY, ME, MN, ND, NY, OH, PA, SC, TN, UT, VA, and WI) did not report average wait time for any waivers with waiting lists.SOURCE: KFF Medicaid HCBS Waiver Program Survey, FY 2017. | |||||||||
| Appendix Table 3: Medicaid HCBS Waiver Waiting Lists by State and ACA Expansion Status, 2013-2017 | ||||||||
| State | Total HCBS Waiver Waiting List Enrollment** | Change in HCBS Waiver Waiting List Enrollment, 2013-2017^ | ||||||
| 2013 | 2014 | 2015 | 2016 | 2017 | Increase | Decrease | No Change | |
| Expansion States (32 states) | ||||||||
| Alaska* | 982 | 982 | 935 | 535 | 629 | X | ||
| Arkansas | 2,823 | 3,007 | 2,893 | 3,278 | 2,834 | X | ||
| Arizona** | NR | NR | 0 | 0 | 0 | X | ||
| California** | 5,352 | 3,660 | 3,592 | 4,088 | 7,683 | X | ||
| Colorado | 3,789 | 3,796 | 4,218 | 3,194 | 3,115 | X | ||
| Connecticut | 1,486 | 2,078 | 2,509 | 2,903 | 5,001 | X | ||
| DC | NR | 0 | 0 | 0 | 0 | X | ||
| Delaware** | NR | 0 | 0 | 0 | 0 | X | ||
| Hawaii** | NR | 0 | 0 | 0 | 0 | X | ||
| Illinois | 33,114 | 29,425 | 31,473 | 19,163 | 19,354 | X | ||
| Indiana* | 8,888 | 5,295 | 1,914 | 1,627 | 1,404 | X | ||
| Iowa | 7,219 | 8,775 | 8,505 | 8,928 | 8,004 | X | ||
| Kentucky | 453 | 6,278 | 6,296 | 8,190 | 6,091 | X | ||
| Louisiana* | 57,156 | 41,492 | 62,828 | 73,929 | 65,989 | X | ||
| Maryland | 26,673 | 27,129 | 45,844 | 36,156 | 35,143 | X | ||
| Massachusetts | NR | 0 | 0 | 0 | 0 | X | ||
| Michigan* | 14,040 | 14,040 | 0 | 3,311 | 3,223 | X | ||
| Minnesota | 4,820 | 4,820 | 4,914 | 128 | 237 | X | ||
| Montana* | 2,747 | 1,298 | 1,583 | 1,309 | 2,156 | X | ||
| Nevada | 1,185 | 1,271 | 1,315 | 1,372 | 1,173 | X | ||
| New Hampshire*^ | NR | 0 | 0 | 260 | 105 | X | ||
| New Jersey** | 50 | 50 | 59 | 0 | 0 | X | ||
| New Mexico** | 11,239 | 19,269 | 5,401 | 20,070 | 17,862 | X | ||
| New York** | NR | 0 | 0 | 0 | 0 | X | ||
| North Dakota^ | NR | 0 | 0 | 3 | 11 | X | ||
| Ohio | 37,385 | 59,708 | 62,118 | 62,546 | 68,644 | X | ||
| Oregon^ | NR | 0 | 0 | 134 | 110 | X | ||
| Pennsylvania* | 18,410 | 18,416 | 18,295 | 9,728 | 9,504 | X | ||
| Rhode Island** | NR | NR | 0 | 0 | 0 | X | ||
| Vermont** | NR | NR | 0 | 0 | 0 | X | ||
| Washington | 1,351 | 1,350 | 0 | 0 | 0 | X | ||
| West Virginia | 409 | 2,188 | 2,212 | 1,540 | 2,092 | X | ||
| TOTAL EXPANSION STATES: | 13 | 11 | 8 | |||||
| Non-Expansion States (19 states) | ||||||||
| Alabama | 2,610 | 2,610 | 2,783 | 5,284 | 4,194 | X | ||
| Florida | 51,379 | 76,750 | 83,365 | 67,479 | 71,016 | X | ||
| Georgia | 11,242 | 11,242 | 12,201 | 10,270 | 7,810 | X | ||
| Idaho* | NR | 0 | 0 | 0 | 0 | X | ||
| Kansas | 5,441 | 5,441 | 4,897 | 3,890 | 4,484 | X | ||
| Maine* | 1,082 | 2,356 | 0 | 1,000 | 1,515 | X | ||
| Missouri | 844 | 684 | 0 | 0 | 0 | X | ||
| Mississippi | 8,338 | 7,843 | 7,035 | 9,481 | 13,465 | X | ||
| North Carolina | 16,565 | 22,056 | 20,736 | 12,068 | 14,487 | X | ||
| Nebraska* | 1,401 | 1,299 | 1,368 | 2,062 | 3,142 | X | ||
| Oklahoma | 6,994 | 6,933 | 7,225 | 7,569 | 7,701 | X | ||
| South Carolina | 6,004 | 5,656 | 2,355 | 11,275 | 10,409 | X | ||
| South Dakota | 23 | 23 | 34 | 0 | 350 | X | ||
| Tennessee** | 7,165 | 7,165 | 7,564 | 5,813 | 7,428 | X | ||
| Texas** | 163,146 | 163,146 | 204,550 | 232,068 | 281,381 | X | ||
| Utah* | 2,172 | 2,172 | 2,241 | 2,543 | 2,974 | X | ||
| Virginia* | 7,779 | 7,779 | 16,583 | 16,583 | 12,266 | X | ||
| Wisconsin | 3,963 | 3,963 | 4,333 | 4,216 | 4,198 | X | ||
| Wyoming | 745 | 621 | 385 | 202 | 194 | X | ||
| TOTAL NON-EXPANSION STATES: | 13 | 5 | 1 | |||||
| NOTES: NR indicates state did not report data. *State expansion status is as of 2017. All states expanded 1/2014, except AK (9/2015), IN (2/2015), LA (7/2016), ME (1/2019), MI (4/2014), MT (1/2016), NH (8/2014), PA (1/2015), and VA (1/2019). ID, NE, and UT have adopted but not yet implemented expansion. **Data include § 1915 (c) and § 1115 HCBS waivers beginning in 2016, except that CA and NY did not report § 1115 waiver waiting list enrollment; prior years include § 1915 (c) waivers only. ^Change includes 2014-2017 for NH, ND, and OR, as 2013 data are unavailable.SOURCE: KFF Medicaid HCBS Program Surveys, 2013-2017. | ||||||||
Endnotes
- Medicaid HCBS waiver authorities include Section 1915 (c) and Section 1115. For additional background on these authorities, see Kaiser Family Foundation, Streamlining Medicaid Home and Community-Based Services: Key Policy Questions (March 2016), https://modern.kff.org/medicaid/issue-brief/streamlining-medicaid-home-and-community-based-services-key-policy-questions/. ↩︎
- This total reflects individuals on waiting lists in 39 of 40 states reporting waiting lists for Section 1915 (c) and/or Section 1115 HCBS waivers. It omits New York, which reports a waiting list for people with mental health disabilities but was unable to report the number of individuals on that list. It includes partial data for Alabama, which reported waiting list enrollment for seniors and adults with physical disabilities but reported enrollment on its waiting list for people with I/DD as unknown. It also includes partial data for California, which reported waiting list enrollment for its Section 1915 (c) waivers serving seniors and/or adults with physical disabilities and people with HIV/AIDS, but did not report enrollment on its Section 1115 waiting list for seniors and adults with physical disabilities. In addition, the following states did not respond to the question about whether there is a waiting list for the following target populations: Georgia for people with mental health disabilities, New Jersey for people with I/DD, New York for seniors and adults with physical disabilities and people with TBI/SCI, and Virginia for adults with physical disabilities. ↩︎
- Beginning in 2016, totals include Section 1915 (c) and Section 1115 HCBS waiver waiting lists; prior years include only Section 1915 (c) waiver waiting lists. Forty-eight states offer at least one Section 1915 (c) HCBS waiver; the remaining three (AZ, RI, and VT) serve all HCBS populations through Section 1115 waivers. Eight states (CA, DE, HI, NJ, NM, NY, TN, and TX) serve some HCBS populations through Section 1915 (c) waivers and others through Section 1115 waivers. For a timeline of when states began moving populations from Section 1915 (c) to Section 1115 waivers, see Kaiser Family Foundation, Medicaid Home and Community-Based Services Enrollment and Spending (April 2019), https://modern.kff.org/medicaid/issue-brief/medicaid-home-and-community-based-services-enrollment-and-spending. ↩︎
- See supra., n.2. ↩︎
- See supra., n.3. ↩︎
- Each Section 1915 (c) waiver generally is targeted to a particular population, while a single Section 1115 waiver can include multiple populations, each of whom otherwise would have to be served under separate Section 1915 (c) waivers. ↩︎
- Kaiser Family Foundation, Medicaid Home and Community-Based Services Enrollment and Spending (April 2019), https://modern.kff.org/medicaid/issue-brief/medicaid-home-and-community-based-services-enrollment-and-spending. ↩︎
- Total includes data reported by 27 of 40 states with waiver waiting lists. The other 13 states with waiver waiting lists were unable to report this data (AR, IL, KY, ME, MN, NV, NY, OH, OR, PA, TN, VA, and WI). ↩︎
- Thirty-seven of 51 states with waivers serving people with I/DD report waiting lists. Waiting list enrollment includes 36 states. The other state, Alabama, reports unknown enrollment on its waiting list for people with I/DD. In addition, New Jersey did not report whether it has a waiting list for people with I/DD. ↩︎
- Twenty of 51 states with waivers serving seniors and/or adults with physical disabilities report waiting lists. Waiting list enrollment reflects partial data for California, which reported waiting list enrollment for its Section 1915 (c) waivers serving seniors and/or adults with physical disabilities but was unable to report waiting list enrollment for its Section 1115 waiver serving these populations. In addition, New York did not report whether it has a waiting list for its Section 1115 waiver serving seniors and adults with physical disabilities. Virginia reported no waiting list for its waiver that serves both seniors and adults with physical disabilities but did not report whether it has a waiting list for another waiver for adults with physical disabilities. ↩︎
- Six of 18 states with waivers serving children who are medically fragile or technology dependent report a waiting list. ↩︎
- Eight of 25 states with waivers serving people with TBI/SCI report a waiting list. In addition, New York was unable to report whether its TBI/SCI waiver has a waiting list. ↩︎
- Four of 14 states with waivers serving people with mental health disabilities report a waiting list. Waiting list enrollment includes three states. The other state, New York, reports unknown enrollment on its waiting list for people with mental health disabilities. In addition, Georgia was unable to report whether its mental health waiver has a waiting list. ↩︎
- One of 10 states with waivers serving people with HIV/AIDS reports a waiting list. ↩︎
- Of the 40 states reporting one or more waivers with a waiting list in 2017, 27 reported average wait time for at least one waiver with a waiting list (AL, AK, AR, CA, CO, CT, FL, GA, IN, IA, KS, LA, MD, MI, MS, MT, NE, NV, NH, NM, NC, OK, OR, SD, TX, WV, and WY), and 13 (IL, KY, ME, MN, ND, NY, OH, PA, SC, TN, UT, VA, and WI) did not report average wait time for any waivers with waiting lists. ↩︎
- The exception is West Virginia. ↩︎
- Within a state, some waivers prioritize only one group, while other waivers may give priority to more than one group. ↩︎
- States implemented the ACA Medicaid expansion in January 2014, except for AK (9/2015), IN (2/2015), LA (7/2016), ME (1/2019), MI (4/2014), MT (1/2016), NH (8/2014), PA (1/2015), and VA (1/2019). ME and VA are counted as non-expansion states for the time period analyzed in this brief (2013-2017), as are ID, NE, and UT, which have adopted but not yet implemented expansion as of 2019. See generally Kaiser Family Foundation, Status of State Action on the Medicaid Expansion Decision (Feb. 13, 2019). ↩︎
- For additional background, see Kaiser Family Foundation, Streamlining Medicaid Home and Community-Based Services: Key Policy Questions (March 2016), https://modern.kff.org/medicaid/issue-brief/streamlining-medicaid-home-and-community-based-services-key-policy-questions/. ↩︎
- In Olmstead, the Supreme Court held that the unjustified institutionalization of people with disabilities violates the Americans with Disabilities Act. Kaiser Family Foundation, Olmstead’s Role in Community Integration for People with Disabilities Under Medicaid: 15 Years After the Supreme Court’s Olmstead Decision (June 2014), https://modern.kff.org/medicaid/issue-brief/olmsteads-role-in-community-integration-for-people-with-disabilities-under-medicaid-15-years-after-the-supreme-courts-olmstead-decision/; Kaiser Family Foundation, Medicaid Beneficiaries Who Need Home and Community-Based Services: Supporting Independent Living and Community Integration (March 2014), https://modern.kff.org/medicaid/report/medicaid-beneficiaries-who-need-home-and-community-based-services-supporting-independent-living-and-community-integration/. ↩︎
- Previous analysis shows that nearly six in 10 (57%) nonelderly Medicaid adults have a disability but do not receive SSI benefits, meaning that they are eligible for Medicaid through another pathway, such as the Medicaid expansion in states that have adopted that pathway. Kaiser Family Foundation, How Might Medicaid Adults with Disabilities Be Affected by Work Requirements in Section 1115 Waiver Programs? (January 2018), https://modern.kff.org/medicaid/issue-brief/how-might-medicaid-adults-with-disabilities-be-affected-by-work-requirements-in-section-1115-waiver-programs/. ↩︎
- Kaiser Family Foundation, The Affordable Care Act’s Impact on Medicaid Eligibility, Enrollment, and Benefits for People with Disabilities (April 2014), https://modern.kff.org/health-reform/issue-brief/the-affordable-care-acts-impact-on-medicaid-eligibility-enrollment-and-benefits-for-people-with-disabilities/. ↩︎
- Most ACA expansion states opt to align their expansion adult benefit package with their traditional state plan benefit package, by offering all state plan services to expansion adults if medically necessary. ↩︎
- Kaiser Family Foundation, Key State Policy Choices About Medicaid Home and Community-Based Services (April 2019), https://modern.kff.org/medicaid/issue-brief/key-state-policy-choices-about-medicaid-home-and-community-based-services. ↩︎
- These states include AK, IA, IL, KY, NE, OH, OK, TN, and TX. ↩︎
- Includes data reported by 28 of 40 states with waiver waiting lists. The 12 other states with waiver waiting lists were unable to report this data (GA, IL, KY, ME, MN, NM, OH, PA, TN, TX, VA and WY). ↩︎
- Medicaid finances 52% of long-term services and supports nationally in 2017. KFF estimates based on 2017 National Health Expenditure Accounts data from CMS, Office of the Actuary. ↩︎