Opioid Use Disorder among Medicaid Enrollees: Snapshot of the Epidemic and State Responses
Executive Summary
As the largest payer of substance use disorder services in the United States, Medicaid plays a central role in state efforts to address the opioid epidemic. In addition to increasing access to addiction treatment services through the expansion of Medicaid under the Affordable Care Act (ACA), states are expanding Medicaid addiction treatment services, increasing provider reimbursements, restricting opioid prescribing, and implementing delivery system reforms to improve the quality of treatment services. While many states have been tracking progress and challenges in these efforts, uniqueness of state systems can make it difficult to compare or benchmark across states. This brief draws on analyses provided by the Medicaid Outcomes Distributed Research Network (MODRN), a collaborative effort to analyze data across multiple states to facilitate learning among Medicaid agencies. It profiles the opioid epidemic among the Medicaid population in six states participating in MODRN that also have been hard hit by the opioid epidemic: Kentucky, Maryland, Ohio, Pennsylvania, Virginia, and West Virginia. The brief also draws on interviews with officials from the state Medicaid and other health agencies. Key findings include following:
- The prevalence of opioid use disorder (OUD) among Medicaid enrollees in the study states (5% in 2016) is higher than the national average, reflecting regional concentration of the opioid epidemic within the country. In states that expanded Medicaid under the ACA, more than half of Medicaid enrollees with opioid use disorder (56%) qualified through the expansion. However, prevalence of OUD among the expansion population (6.9%) is similar to other Medicaid eligibility groups.
- State officials indicated that the ACA Medicaid expansion allowed previously uninsured people with undiagnosed or untreated substance use disorders to receive treatment. To prevent opioid addiction among Medicaid enrollees, states are reducing opioid prescribing to Medicaid enrollees through greater monitoring, use of prior authorization, and other limits on opioid prescribing. In addition, all six states have taken steps to cover the full continuum of treatment services, and five of the six states have received Section 1115 IMD waivers to help provide the full continuum of treatment services.
- All six states cover evidence-based medication-assisted treatment (MAT). Despite these efforts, less than half of Medicaid enrollees with opioid use disorder in the six states receive any MAT. Among those receiving pharmacotherapy, 52% received at least six months of treatment.
The six states are taking other actions to improve access to and quality of addiction treatment services, such as recruiting and training more providers to prescribe buprenorphine, eliminating prior authorization requirements for buprenorphine, improving transitions between hospital settings and community-based care, and adopting new models of care delivery that emphasize greater coordination of MAT with other physical and behavioral health services. Most are also leveraging new federal funding through SAMHSA to work in concert with Medicaid reforms.
Issue Brief
Introduction
In the United States, Medicaid covers 38 percent of non-elderly adults with an opioid use disorder.1 As the largest payer of substance use disorder services in the United States, Medicaid plays a central role in state efforts to address the opioid epidemic, largely driving policy on improving delivery of treatment services.2 States may adopt several policy options to increase access to opioid use disorder treatment, improve quality of care and reduce overdose deaths among Medicaid enrollees, including expanding benefits to include a broader range of addiction treatments, increasing provider reimbursements, restricting opioid prescribing, and implementing delivery system reforms. While many states have been tracking progress and challenges in these efforts, uniqueness of state systems can make it difficult to compare or benchmark across states, and there is limited data to measure quality or outcomes of opioid treatment efforts. In addition, the expansion of Medicaid under the ACA extended eligibility to many people with substance use disorder who previously lacked access to affordable insurance coverage, but there is limited data on how expansion increased coverage and access to treatment services for opioid use disorder (OUD).
This brief draws on analyses provided by the Medicaid Outcomes Distributed Research Network (MODRN),3 a collaborative effort to analyze data across multiple states to facilitate learning among Medicaid agencies, to profile the opioid epidemic among the Medicaid population in six states – Kentucky, Maryland, Ohio, Pennsylvania, Virginia, and West Virginia. All of these states participate in MODRN and include parts of Appalachia, a region hard hit by the opioid epidemic. MODRN data provides a snapshot of the opioid epidemic along several measures not available in public data. The brief focuses on adolescent and non-elderly adult Medicaid enrollees (ages 12-64) who are not dually eligible for Medicare. As of the time of data collection, Virginia was the only state that had not expanded Medicaid under the ACA, though it has since done so. The brief also draws on interviews with officials from the state Medicaid and other health agencies and describes the major strategies and initiatives these six states are using to address the opioid epidemic among their Medicaid populations.
Which Medicaid enrollees have opioid use disorder?
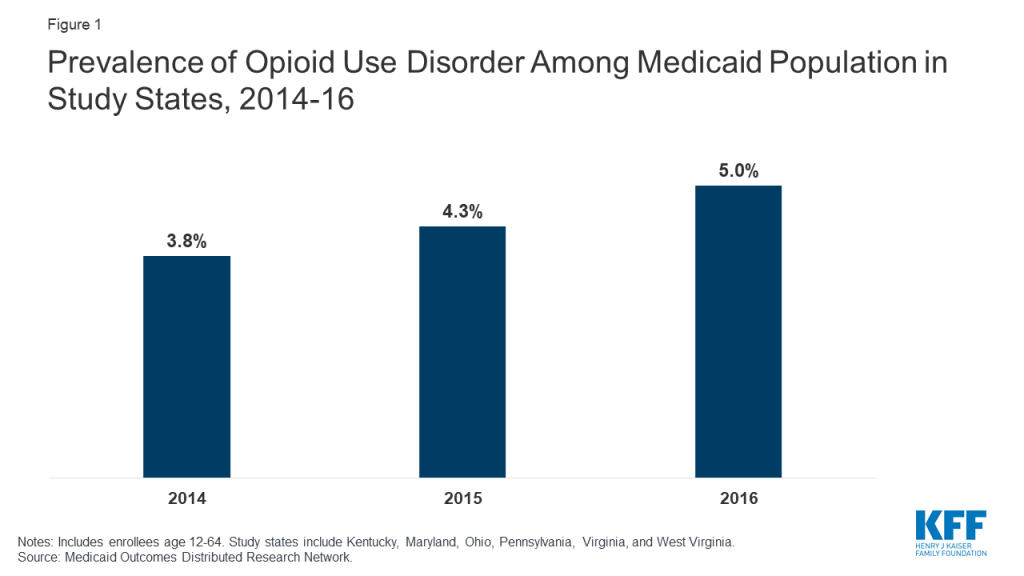
The prevalence of OUD among Medicaid enrollees in the study states is higher than the national average, reflecting regional concentration of the opioid epidemic within the United States. Among Medicaid enrollees ages 12-64 who are not dual Medicare/Medicaid eligible, the percent with a diagnosis of opioid use disorder increased from 3.8 percent in 2014 to 5.0 percent in 2016 in the six study states (Figure 1). This trend could reflect a true increase in prevalence, increased screening and diagnosis, or both. This prevalence compares to an estimated national average of <1% for people age 12-64 overall and 2% for Medicaid enrollees age 12-644 and reflects the fact that the study states include areas hardest hit by the opioid epidemic. States also noted that Medicaid covers a disproportionately large share of people with OUD in their states.
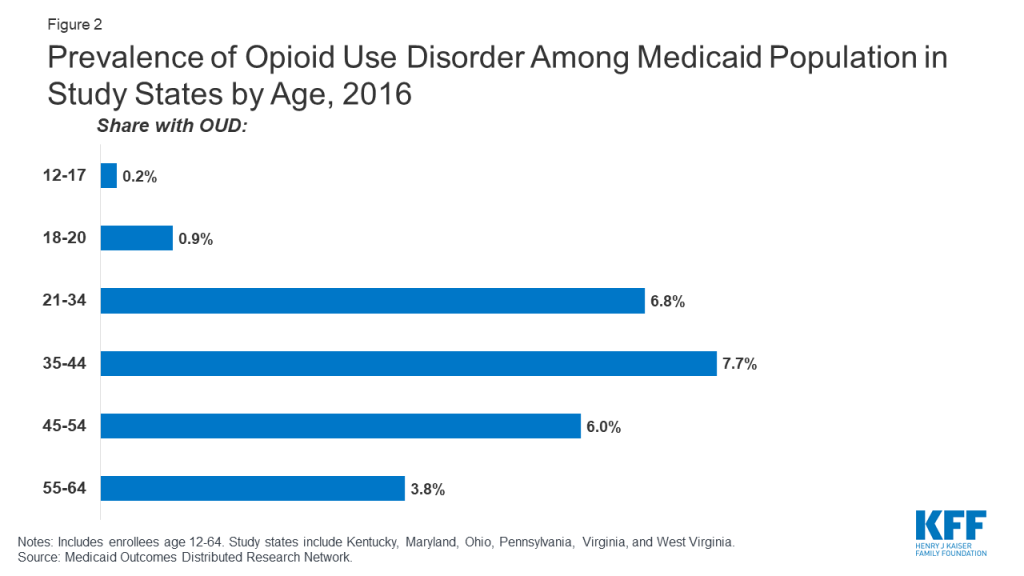
Across the study states, OUD prevalence is higher among working-age adults, males, and whites compared to other demographic groups. Among different age groups, enrollees aged 35-44 have the highest OUD prevalence at 7.7 percent, with children ages 12-17 having the lowest prevalence at less than 1 percent (Figure 2). Prevalence of OUD is higher among males compared to females (5.7 percent compared to 4.4 percent) and among Whites compared to African-Americans and Hispanics (6.6 percent compared to 2.7 percent and 2.4 percent) (Figure 3).
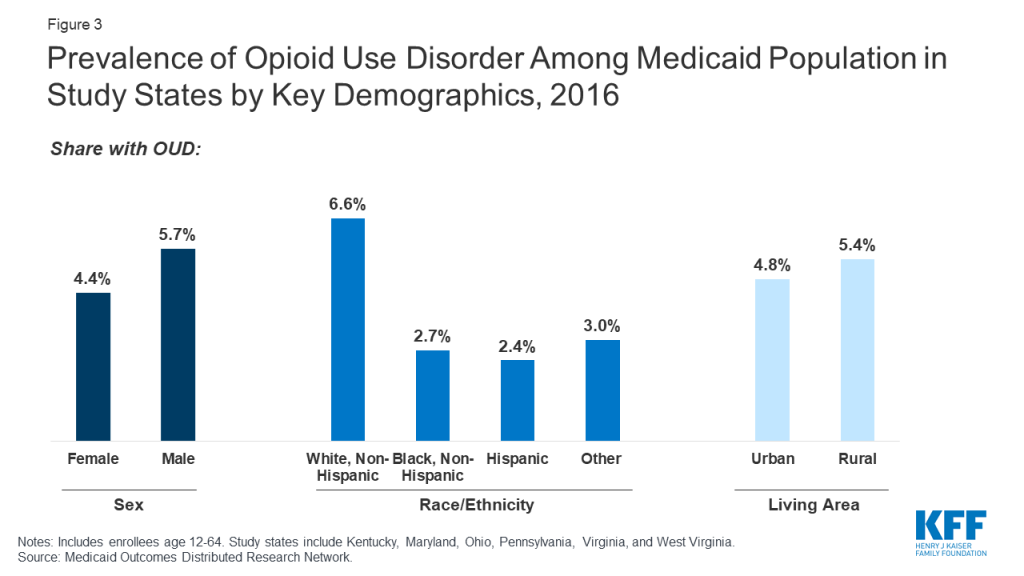
Though OUD prevalence is higher among Medicaid enrollees in rural areas, states report a growing problem in urban areas. A greater share of enrollees in rural areas have OUD compared to urban areas (5.4 percent compared to 4.8 percent, Figure 3). State respondents noted the social and economic distress in many rural communities and small towns in their state as one of the key drivers of the opioid epidemic, which may explain in part the higher prevalence among white, working age adults noted above. National data also show higher prevalence of OUD among low income, unemployed adults suffering from other psychosocial distress.5 However, respondents also stressed that OUD is also a growing problem for their urban populations. In fact, despite the higher prevalence in rural areas, in 2016, 74 percent of Medicaid enrollees with OUD lived in urban areas across the six states (findings not shown). Respondents in one state also noted differences in the nature of the opioid epidemic between urban and rural areas, with urban areas experiencing more of a problem with addiction to heroin, fentanyl, and other synthetic opioids, while prescription opioids were a greater contributor to the problem in rural areas.
Medicaid Expansion and OUD
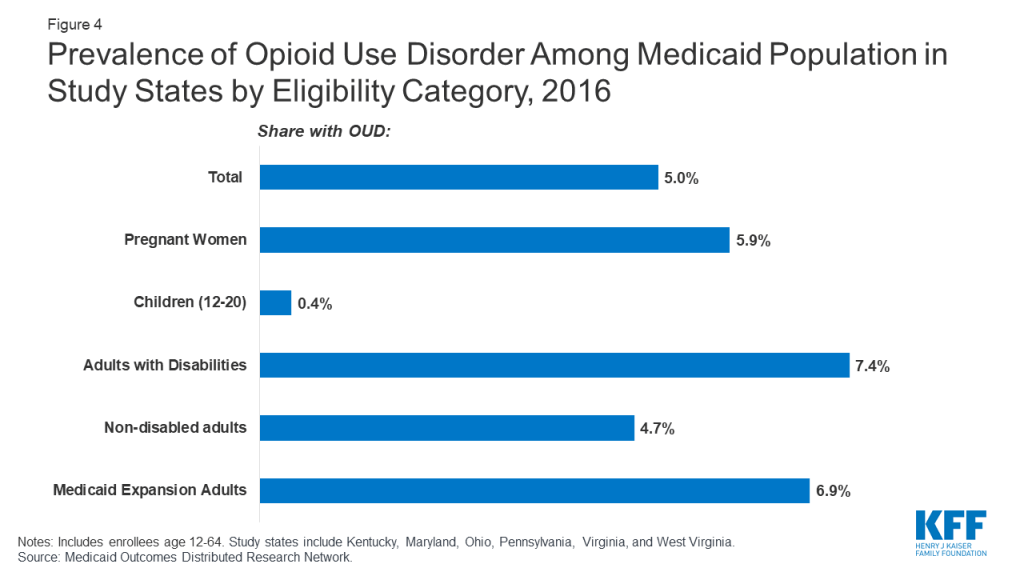
Though many Medicaid enrollees with OUD qualify through the ACA Medicaid expansion, prevalence of OUD among the Medicaid expansion population is similar to that for other eligibility groups. For the five out of six states that had expanded Medicaid prior to January 1, 2019, 6.9 percent of enrollees who qualified through Medicaid expansion had an OUD (Figure 4),6 and among all Medicaid enrollees with an OUD, 56 percent qualified through Medicaid expansion in 2016 (findings not shown). OUD prevalence among the Medicaid expansion population in the study states is slightly higher than other adults without disabilities (4.7%) and pregnant women (5.9%) and lower than prevalence among adults with disabilities (7.4%).
Reflecting eligibility criteria, the characteristics of enrollees with OUD who qualify through the ACA expansion differ from those who qualify for Medicaid through traditional eligibility pathways. Compared to enrollees with OUD who are eligible through pre-expansion criteria in the states that expanded Medicaid, the expansion population with OUD is disproportionately likely to be age 21-34 and male (Table 1), likely reflecting characteristics of adults who were ineligible for Medicaid under traditional pathways but gained eligibility under the ACA. State Medicaid officials also cite being a military veteran and having a history of employment in high-risk occupations (e.g. manufacturing, mining) as additional risk factors for OUD among the expansion population.7
| Table 1: Characteristics of Medicaid Enrollees with OUD in Study States by Eligibility Pathway, 2016 | ||
| Enrollees with OUD eligible through ACA expansion | Enrollees with OUD eligible through non-ACA pathway | |
| Age | ||
| % 12-17 | N/A | 1.5 |
| % 18-20 | 0 | 4.0 |
| % 21-34 | 51.1 | 43.8 |
| % 35-44 | 28.4 | 25.2 |
| % 45-54 | 15.3 | 14.9 |
| % 55-64 | 5.2 | 10.6 |
| – | ||
| Gender | ||
| % Female | 37.7 | 65.9 |
| % Male | 62.3 | 34.1 |
| — | ||
| Race/ethnicity | ||
| % White | 81.3 | 79.3 |
| % African-American | 6.9 | 10.7 |
| % Hispanic | 3.1 | 3.3 |
| % Other | 8.7 | 6.7 |
| – | ||
| Living area | ||
| % Urban | 70.9 | 69.7 |
| % Rural | 28.6 | 30.0 |
| Living area missing/unknown | 0.5 | 0.3 |
| NOTES: Includes enrollees age 12-64. Estimates are pooled across four study states that had implemented ACA Medicaid expansion as of 2016 (KY, OH, PA, WV).SOURCE: Medicaid Outcomes Distributed Research Network | ||
State policymakers view Medicaid expansion as an important tool for expanding access to OUD treatment by increasing coverage among populations with a high prevalence of OUD. Respondents in some states acknowledged concerns raised by some stakeholders about whether Medicaid expansion may have exacerbated the opioid addiction crisis by increasing access to opioid prescriptions, although it did not appear to be a major concern in any of the six states. Consistent with recent research, state officials maintain that not only have they not seen any evidence that Medicaid expansion exacerbated opioid addiction, but that in fact Medicaid was providing addiction treatment services for enrollees who previously had undiagnosed or unmet needs for these services or who were on high-dose opioids before they enrolled in Medicaid.8 States also reported that Medicaid expansion enabled them to expand the scope of services available to people with OUD, as Medicaid-covered benefits are broader than those available through state-funded programs for uninsured people.
Initiatives to Focus on OUD among Special Populations
In addition to increasing access to treatment through Medicaid expansion, most state Medicaid programs have also focused special attention on certain populations who are vulnerable to the effects of opioid addiction, such as pregnant women and newborns. For example, West Virginia established the first center in the United States to provide support services to newborns with Neonatal Abstinence Syndrome and their families. West Virginia’s Medicaid agency has established special rates to accommodate the specialized services provided by the center. Creating new data systems that can match a mother to her child within the Medicaid system has also been a priority as states frequently report lack of data as a barrier to measuring quality of care for pregnant women and infants.
All study states also report efforts to connect people in the criminal justice system to care. As studies show that more than half of the incarcerated population meet the criteria for drug dependence or abuse, state Medicaid agencies have also focused special attention on individuals released back to the community.9 All six states report taking measures to identify incarcerated individuals likely to be eligible for Medicaid and to get them started on treatment before or shortly after their release. For instance, Ohio’s pre-release program uses peer educators to enroll likely eligible prisoners into Medicaid prior to release.10 The program is intended to reduce the amount of time between release and accessing treatment, thereby reducing accidental overdoses.
What are states doing to limit access to opioids?
Reflecting nationwide trends, all study states have efforts underway to limit access to prescribed opioids. In 2019, all states report using pharmacy benefit management strategies to prevent opioid-related harms.11 Similarly, all six states have taken steps to limit the quantity and dose of opioids prescribed to Medicaid enrollees, as well as requiring prior authorization for opioid prescribing for Medicaid patients.12 These steps include such actions as limiting days supplied and dosages (KY, PA, WV) and reducing the number of refills (OH). Ohio, Virginia and Pennsylvania have implemented the CDC guidelines for opioid prescribing in their Medicaid programs, which require prior authorizations to provide oversight of high dosage prescriptions and limit the number of days supplied. All states also report actions to more aggressively use Prescription Drug Monitoring Programs (PDMPs), which track all prescriptions for opioids and other controlled substances in the state. Ohio and West Virginia are using PDMPs to identify clinics and other providers with excessive prescribing practices. States report that such measures have decreased opioid prescribing among Medicaid enrollees. In Virginia, for example, average days supplied for opioid prescriptions decreased 45 percent between 2016 and 2018, while the number of Medicaid enrollees receiving opioid prescriptions dropped by almost 30 percent.13
What are states doing to facilitate access to treatment for OUD?
All six states now cover the full continuum of treatment services, based on the American Society of Addiction Medicine (ASAM) guidelines.14 Historically, coverage of addiction treatment services by Medicaid has varied considerably across the study states. Ohio and Pennsylvania provided the full continuum of outpatient, intensive outpatient, and residential treatment services based on ASAM guidelines since before 2016. Similarly, Maryland has covered most ASAM services, with exclusions for some Medicaid populations. While Kentucky, West Virginia, and Virginia have not been as comprehensive in their benefits historically, they have been closing the gap through recent expansions in services. In 2017, Virginia implemented the Addiction and Recovery Treatment Services (ARTS) program, which greatly expanded access to the full continuum of addiction treatment services, increased reimbursement rates for some existing services, and “carved” behavioral health services back into managed care plans in order to increase coordination with physical health services, and established a preferred provider model for OUD treatment. Kentucky and West Virginia have added coverage for methadone treatment and other services, such as Screening, Brief Intervention and Referral to Treatment (SBIRT), peer recovery services (WV), short-term residential services, and withdrawal management.
To facilitate expansion of residential treatment and inpatient detoxification services, five of the six states have received Section 1115 waivers and report that these waivers are crucial in allowing them to provide the full continuum of treatment services. As of October 2019, 26 states have Section 1115 waivers to use federal Medicaid funds for residential facilities of 16 beds or greater, otherwise prohibited through Medicaid’s Institutions for Mental Diseases (IMD) exclusion.15 Waivers have enabled states to provide treatment services based on ASAM treatment guidelines, specifically for short-term residential treatment services (ASAM Level 3) and medically managed intensive inpatient services (ASAM Level 4). However, there is some concern that reversing the IMD exclusion through waivers could lead to greater reliance on more costly institutional care for the treatment of substance use disorders and possibly prolonged institutional stays for people who could be adequately served in the community. Further, some note that the focus on institutional care without commensurate focus on community-based care may interfere with states’ ability to meet community integration requirements under the Americans with Disabilities Act. For states that had implemented waivers at the time of the study, it was too soon to assess impact. However, analysis of the first year of Virginia’s ARTS program showed that most treatment was provided in outpatient settings. Of the 9,700 Medicaid members who used any ASAM service, only about 200 used residential treatment services (ASAM level 3), while more than 500 used medically managed intensive inpatient services (ASAM 4). By contrast, almost 7,000 members with OUD used outpatient services (ASAM Level 1).16
Medication-Assisted Treatment
Reflecting nationwide trends, all six study states cover medication-assisted treatment (MAT) for OUD, which is considered the “gold standard” for opioid use disorder treatment.17 MAT includes pharmacotherapy along with psychotherapy and social support. The most common medications used in MAT are methadone and buprenorphine, which is sold either alone or in combination with naloxone (as Suboxone).18 Extended-release injectable naltrexone is also approved by the FDA for treatment of opioid use disorder. Nationally, 44 states cover MAT.19 All six study states have elected to cover buprenorphine, as well as naltrexone and methadone treatment (Kentucky will add methadone coverage when its Section 1115 waiver is implemented).
Less than half of Medicaid enrollees with OUD receive any MAT. All six states have implemented measures to support use of MAT within the Medicaid program and have experienced increased rates of MAT use since 2014. However, use of MAT among individuals diagnosed with an OUD remains low at only 48 percent across the six states in this study (Table 2). Even these estimates of treatment among those diagnosed with OUD may overstate treatment rates, since many individuals with OUD go undiagnosed. For example, based on national survey data among those with prescription opioid use disorder, only 17.5 percent report receiving any treatment for it.20
Treatment rates vary by demographic and eligibility group. Among those with diagnosed OUD in the six states in 2016, MAT rates are highest among those in the 21-44 age group, among women, among whites, and slightly higher among those living in urban compared to rural areas (Table 2). Comparing enrollees based on eligibility pathway, MAT rates are highest for traditionally eligible, non-disabled adults (56.2 percent) and pregnant women with OUD (53.6 percent), lower for Medicaid expansion adults (48.1 percent) and people qualifying based on a disability (40.0 percent) and significantly lower for people qualifying as children (including adolescents or young adults) (19.2 percent).
| Table 2: Medication-assisted treatment (in 2016) and continuity of pharmacotherapy for OUD (in 2015-2016) by demographic group | ||
| Percent with OUD who receive Medication-Assisted Treatment | Percent who had continuity of pharmacotherapy treatment | |
| Overall | 48.2% | 52.4% |
| Age | ||
| 12-171 | 2.9 | N/A |
| 18-20 | 26.1 | 31.1 |
| 21-34 | 51.5 | 48.4 |
| 35-44 | 52.1 | 54.4 |
| 45-54 | 43.4 | 61.4 |
| 55-64 | 34.9 | 66.7 |
| – | ||
| Gender | ||
| Female | 49.7 | 55.0 |
| Male | 46.7 | 49.6 |
| – | ||
| Race/ethnicity | ||
| White | 50.4 | 51.4 |
| African-American | 40.7 | 62.2 |
| Hispanic | 39.3 | 54.8 |
| Other | 42.1 | 46.8 |
| – | ||
| Living area | ||
| Urban | 48.5 | 54.0 |
| Rural | 47.2 | 47.8 |
| Eligibility status | ||
| Pregnant women | 53.6 | 52.9 |
| Adolescents/young adults1 | 19.2 | 26.8 |
| Adults with disabilities | 40.0 | 60.3 |
| Adults without disabilities | 56.2 | 57.2 |
| Medicaid expansion adults | 48.1 | 47.5 |
| NOTES: Includes enrollees age 12-64. Estimates pooled across six study states.1 Percent with medication-assisted treatment measure includes adolescents and young adults aged 12-20 in 2016. The percent who had continuity of pharmacotherapy only includes young adults aged 18-20 per the NQF specifications and the time period is 2015-2016.SOURCE: Medicaid Outcomes Distributed Research Network | ||
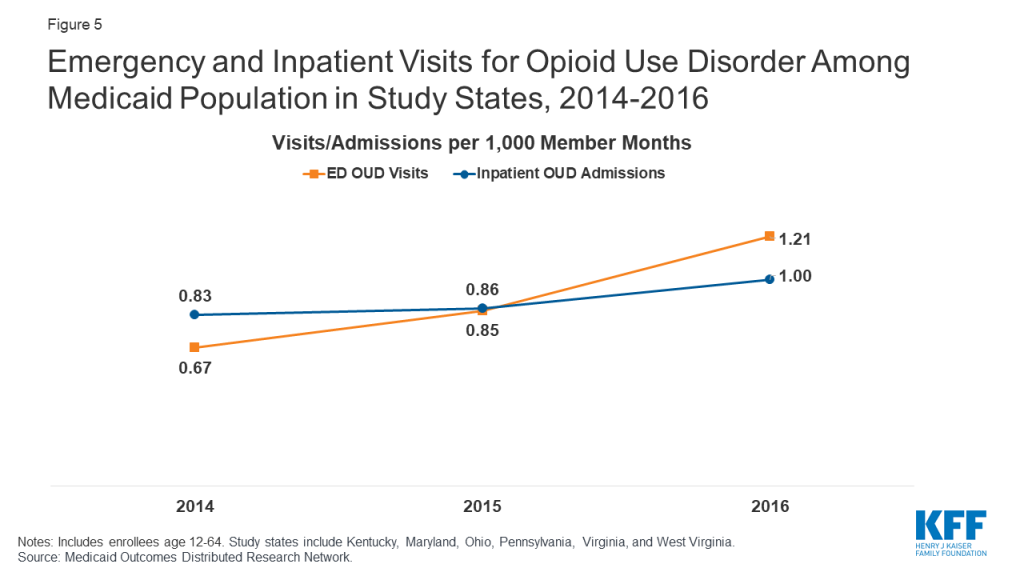
In addition, many enrollees receiving MAT are not retained in continuous treatment. The duration of MAT is associated with health outcomes including recovery. Although the amount of time on MAT needed for recovery varies from patient to patient, in general, longer treatment periods result in better outcomes and reduce the risk of relapse. Among Medicaid enrollees in the six states receiving pharmacotherapy for OUD, 52% received at least six months of treatment (Figure 5). Among those receiving pharmacotherapy, enrollees in the 55-64 age group were more likely to have continuous treatment for six months compared to younger age groups (Table 2). Females, African-Americans, and those living in urban areas also had greater continuity of treatment compared to other subpopulations. Continuity was highest among people qualifying based on a disability (61 percent) and lowest among the child/young adult population (18-20 years) (26 percent) (Table 2).
Most (five of six) states report an under-supply of prescribers as a major barrier to increasing MAT for Medicaid enrollees. Historically, pharmacotherapy for treatment of OUD was restricted to methadone delivered by opioid treatment programs (OTPs) accredited by SAMHSA or other approved accrediting bodies. To increase access to MAT, the Drug Addiction Treatment Act of 2000 (DATA 2000) allowed qualified physicians to dispense or prescribe buprenorphine if they completed eight hours of training and applied for and received a waiver from SAMHSA. The Comprehensive Addiction and Recovery Act of 2016 allows nurse practitioners and physician assistants to also receive waivers and prescribe buprenorphine, which Maryland officials cited as significantly increasing the supply of prescribers in that state. While the number of buprenorphine waivered prescribers has increased nationally and across the six states, all states except West Virginia reported provider supply issues. As with other health services, some states reported challenges in enlisting prescribers to accept Medicaid patients. Rates of buprenorphine prescriber participation in Medicaid are likely to be comparable to Medicaid provider participation more broadly, in which acceptance of new Medicaid patients is much higher among primary care physicians (70 percent) compared to psychiatrists (36 percent).21
Recruiting and training more providers to become buprenorphine prescribers and to increase their patient capacity is a high priority in most of the states. For example, Ohio has taken advantage of grant funding through the 21st Century Cures Act to train physicians, nurse practitioners, and physician assistants to apply for waivers and provide MAT. While much of the focus is on recruiting primary care providers to become prescribers, some states are also focusing on recruiting more OB/GYNs to become prescribers to increase treatment for pregnant women. Most of the states have also implemented or are planning to increase use of telemedicine in MAT, such as through Project ECHO programs that link primary care practices to specialists in academic settings who provide mentoring and feedback in order to increase access in rural or other underserved areas.22
Other barriers to MAT access and continuity cited by state officials include challenges in transitioning patients from one level of care to another and stigma or resistance to MAT. States are focusing on transitioning patients into treatment after acute care hospital stays and emergency departments. Both Kentucky and Pennsylvania have initiatives to encourage health systems to initiate treatment in the hospital setting and connect patients to community providers for ongoing treatment and support. In addition, policymakers noted stigma or resistance not only among patients, but also among some providers, policymakers, law enforcement, and others in the recovery community who object to using opioid-based medications to treat OUD, and prefer abstinence-only and counseling approaches to treatment that have been shown to be less effective than MAT.
States are developing policies to balance increased access to MAT and prevention of misuse. Because MAT treatments are opioid-based, they can be diverted, misused, and sold illegally. Respondents in all six states report current or past problems with “cash clinics,” in which patients pay physicians out-of-pocket for the cost of the visit to receive buprenorphine prescriptions, with little assurance that appropriate care guidelines are followed or that individuals are prevented from diverting prescriptions into the community. At the same time, most state respondents noted that overly restrictive policies on buprenorphine prescribing – such as stringent prior authorization requirements – can inhibit access to these effective medications for patients. Ohio, Pennsylvania, and Virginia have recently loosened prior authorization programs to encourage providers to deliver buprenorphine and reduce provider supply-related barriers to treatment access. For example, Virginia has eliminated prior authorizations for certain “preferred” providers, and Pennsylvania has required its managed care organizations to make at least one OUD medication be available on a preferred drug list without prior authorization. In contrast, West Virginia continues to carefully regulate providers authorized to prescribe buprenorphine, such as requiring additional documentation of past disciplinary actions and monitoring of compliance with requirements for urine drug screens and counseling.
What are states doing to improve care quality and treatment outcomes for OUD?
Most study states are adopting new models of care delivery for OUD. Realizing that navigating the continuum of addiction treatment services is complex, and merely covering MAT treatment will not necessarily lead to improved outcomes, most of the states are adopting new models of care delivery that emphasize evidence-based MAT treatment, coordination with the different levels of treatment, and integration with other physical and behavioral health services. For example, Pennsylvania established a Centers of Excellence program based on a “hub and spoke” model of treatment in 2016, in which the centers serve as the “hub” that provide the most intensive treatment services, while connecting patients with other services necessary for maintaining and managing their treatment over the longer term. State officials attribute a substantial increase in treatment rates to the Centers of Excellence. West Virginia is in the process of establishing a similar model, the Comprehensive Opioid Addiction Treatment (COAT) clinic. A second model is the preferred provider, as seen in Virginia’s Preferred Opioid-Based Opioid Treatment (OBOT) program. These providers, credentialed by the Medicaid program, have co-located buprenorphine-certified providers and behavioral health specialists. As preferred providers, they receive increased reimbursement to conduct care coordination activities and comprehensive services. A third model, used by Maryland and Ohio, is the medical home. While not OUD-specific, these medical homes are intended to provide or coordinate all physical health and behavioral health needs.
Most states have not yet adopted alternative payment models for OUD treatment services. While some of these new care delivery models include incentivizing providers to achieve better outcomes, use of alternative payment approaches for addiction treatment is still in the discussion phase for most states. Pennsylvania may be furthest along the path, having used bundled payment arrangements for methadone treatment for many years.
All six states are working to build the long-term infrastructure for collecting data and developing measures of quality to monitor outcomes. In some states, these include data linkages between Medicaid, Department of Corrections, Emergency Medical Services, prescription drug monitoring programs, mortality, and birth records to provide more timely and comprehensive monitoring of the opioid epidemic.
Most states were still seeing indications of a growing opioid epidemic through 2016. States use a variety of methods to measure treatment outcomes and the effects of treatment and state policies designed to increase access to and quality of treatment. While a widely-cited measure is overdose fatalities, this outcome represents only a small fraction of those afflicted with opioid use disorders. Other measures, such as opioid-related emergency department visits and acute inpatient stays, may reflect broader prevalence and access trends. As shown in Figure 5, the rate of ED visits for OUD nearly doubled between 2014 and 2016 among enrollees in the six states from 0.67 to 1.21 per 1,000 member months. The rate of inpatient admissions for OUD increased less sharply from 0.83 to 1.00 between 2014 and 2016. Among Medicaid enrollees, rates of ED and acute inpatient use for OUD tend to be higher among adults ages 21-44, males, whites, and residents of urban areas compared to other subpopulations (Table 3). Among Medicaid eligibility categories, OUD-related ED and inpatient use is highest among Medicaid expansion enrollees, pregnant women, and adults with disabilities and lowest among adolescents and young adults and traditionally eligible, non-disabled adults.
| Table 3: Rates of OUD-related ED visits and inpatient stays among Medicaid enrollees, by demographic characteristics, 2016 | ||
| OUD-related ED visits per 1,000 member months | OUD-related inpatient admissions per 1,000 member months | |
| Total | 1.2 | 1.0 |
| Age | ||
| 12-17 | 0.1 | <0.05 |
| 18-20 | 0.3 | 0.2 |
| 21-34 | 2.0 | 1.4 |
| 35-44 | 1.8 | 1.4 |
| 45-54 | 1.1 | 1.2 |
| 55-64 | 0.7 | 0.9 |
| – | ||
| Gender | ||
| Female | 1.0 | 0.9 |
| Male | 1.5 | 1.1 |
| – | ||
| Race/ethnicity | ||
| White | 1.6 | 1.3 |
| African-American | 0.5 | 0.6 |
| Hispanic | 0.7 | 0.7 |
| Other | 1.0 | 0.7 |
| – | ||
| Eligibility group | ||
| Pregnant women | 1.5 | 2.7 |
| Adolescents and young adults (12-20) | 0.1 | 0.1 |
| Adults with disabilities | 1.5 | 2.0 |
| Adults without disabilities | 1.1 | 0.6 |
| Medicaid expansion adults | 1.8 | 1.2 |
| – | ||
| Living area | ||
| Urban | 1.3 | 1.1 |
| Rural | 0.9 | 0.8 |
| SOURCE: Medicaid Outcomes Distributed Research Network | ||
Looking Ahead
Medicaid programs are central to state efforts to address the opioid epidemic, in part due to the high prevalence of OUD among low-income populations eligible for Medicaid. Leaders in Medicaid agencies in all six study states viewed Medicaid expansion as important in expanding coverage to individuals with OUD to reduce financial barriers to treatment. State Medicaid programs also have a number of tools that can be used to leverage state and federal resources, such as by expanding coverage for the full range of treatment options, increasing reimbursement to attract more providers, developing new care delivery models, and seeking Section 1115 Demonstration Waivers that allow federal Medicaid payments for residential treatment. In addition, the federal SUPPORT Act allows for or mandates Medicaid services to treat OUD, puts in place protections for some eligibility groups to maintain Medicaid coverage, requires prescription drug oversight and quality reporting related to Medicaid and OUD, and authorizes new demonstrations to address provider capacity constraints and transitions from the criminal justice system, among other provisions.23 This new federal law will likely expand Medicaid’s role in addressing OUD as states take up new options, implement demonstrations, or comply with federal requirements.
State Medicaid reforms are also integral to coordinated state strategies to address the opioid addiction crisis, especially in terms of aligning Medicaid restrictions on opioid prescribing with more general state and restrictions. Because effectively addressing opioid addiction overlaps with medical, public health, criminal justice, and social welfare sectors, state agencies are actively working with other state agencies on a coordinated response to the epidemic. The Kentucky Opioid Response Effort (KORE) is an example of a multi-agency effort to provide a comprehensive response to the opioid epidemic in the state, and provide grants to expand services. Other states have set up inter-agency task forces – a few of which are led by the state’s Medicaid agency — that meet on a regular basis to coordinate strategies and address issues related to treatment, housing, employment, and other social needs.
Many of these states have also leveraged new funding through SAMHSA, such as State Targeted Response (STR) and the newer State Opioid Response (SOR) grants to work in concert with Medicaid reforms to increase supply and availability of treatment providers, encourage and train more providers to become MAT prescribers, build crisis stabilization centers as an alternative to ERs and jails, conducting patient outreach and education to encourage them to begin and stay in treatment, and to reduce the stigma associated with MAT. State Medicaid agencies pointed to the need for long-term, coordinated strategies to improve systems of care to address not only the opioid crisis but other behavioral health needs among low-income, vulnerable populations.
Julie Donohue is Professor, Health Policy and Management, University of Pittsburgh Graduate School of Public Health. Peter Cunningham is Professor, Department of Health Behavior and Policy, Virginia Commonwealth University. Lauryn Walker was a Research Assistant at the Department of Health Behavior and Policy, Virginia Commonwealth University at the time of this project. Rachel Garfield is a Vice President at KFF and Co-Director of its Program on Medicaid and the Uninsured.
Appendix
Methods
Data Source
Data in this brief is from the Medicaid Outcomes Distributed Research Network (MODRN), an initiative of AcademyHealth.24 MODRN is a collaborative effort to analyze data across multiple states to facilitate learning among Medicaid agencies. Participants from AcademyHealth’s State-University Partnership Learning Network (SUPLN) and the Medicaid Medical Director Network (MMDN) developed MODRN to allow states to participate in multi-state data analyses while retaining their own data and analytic capacity.
MODRN is composed of multiple organizations using a common data model to support centralized development, but local execution, of analytic programs. Under MODRN, each state-university partnership adopts the Medicaid Common Data Model, contributes to a common analytic plan, and conducts analyses locally on their own Medicaid data using standardized code developed by the data coordinating center. Finally, the state-university partners provide aggregate results, not data, to the data coordinating center, which synthesizes the aggregate findings from multiple states for reporting. The Medicaid Common Data Model will be continually updated and expanded for future Medicaid research projects.
Eleven university-state partnerships now participate in an effort to provide a comprehensive assessment of opioid use disorder treatment quality in Medicaid. The findings presented in this report resulted from that project that at the time of this writing had been implemented by six university participants include the University of Kentucky, University of Maryland Baltimore County, The Ohio State University, University of Pittsburgh, Virginia Commonwealth University, and West Virginia University.
Analytic Methods
Below we detail the construction of the variables used in the data analysis across the six study states.
Years Included
The data analysis covered years 2014 through 2016. Some measures pool data across two-year period per National Quality Forum Specifications.
Population Included
This analysis includes non-dual, full-benefit Medicaid enrollees age 12-6425 with at least one month of Medicaid eligibility in the calendar year.
For analysis by eligibility category, we group enrollees into categories using the following hierarchy:
- Pregnant women, which includes any adolescents or women who are pregnant at any time in the calendar year. We identify women as pregnant during the year either by measuring the gestational period prior a claim for giving birth or by identifying a claim for prenatal care.
- Children, which includes those under the age of 21. In states using Medicaid as the basis of their Children’s Health Insurance Program, this group also includes children qualifying for Medicaid through Title XXI
- Adults age 21-64 qualifying due to receipt of Supplemental Security Income (SSI)
- Adults not qualifying on the basis of disability through a traditional (non-ACA expansion) category
- Adults qualifying through the ACA expansion category
Prevalence of Opioid Use Disorder (OUD)
We identify people with OUD based on diagnosis codes in claims. Specifically, we identify those who had at least one encounter with any diagnosis (counting all diagnosis fields) of OUD in inpatient, outpatient, or professional claims at any time during the measurement period. We used National Quality Forum code sets to identify diagnosis codes for measuring OUD.26
Rates of Medication-Assisted Treatment (MAT) among Enrollees with OUD
After identifying the population with OUD as detailed above, we calculate utilization rates for MAT by identifying individuals with OUD who have at least one claim for medication-assisted treatment for OUD. Specifically, we include those who have at least one claim with a National Drug Code (NDC) or a HCPCS code for any of the following OUD medications during the measurement period:
- Buprenorphine
- Naltrexone (oral or injectable)
- Buprenorphine/Naloxone
- Methadone administration
We excluded claims for oral medications with negative, missing, or zero days’ supply.
Continuity of Pharmacotherapy for OUD
This measure is calculated for three rolling two-year periods from 2014 to 2016: 2014-2015, and 2015-2016, to allow for 180-day measurement of pharmacotherapy for enrollees whose treatment episodes span calendar years. For each two-year period, we limit the analysis to individuals who (1) had a diagnosis of OUD, as described above27 (2) had at least one claim for an OUD medication, as described above, and (3) who are 18-63 years of age28 for the duration of the first year during which they appear in the period. We only include individuals who received oral OUD medications during the two-year period with a date at least 180 days before the end of the final calendar year of the measurement period. Further, we only include individuals who were continuously enrolled in Medicaid for at least 6 months after the month with the first OUD medication claim in the measurement period, with no gap in enrollment. Individuals who are not enrolled for 6 months, including those who die during the period, are not eligible and are not included in this part of the analysis.
Within this group, we measure continuity of treatment by identifying individuals who have at least 180 days of continuous pharmacotherapy with a medication prescribed for OUD without a gap of more than seven days. We developed a set of decision rules for counting surplus for overlaps among prescription claims and for counting length of days for medications with different administration (e.g., prescription OUD medications, Naltrexone injections, and for licensed treatment center-dispensed methadone and office-dispensed buprenorphine/naloxone).29
Emergency department use and inpatient hospitalizations for OUD
We measure emergency department (ED) visits for OUD as distinct ED visits with OUD diagnosis in any diagnosis field. For each enrollee, we consider a distinct combination of billing provider ID and date of service as a distinct ED visit. Similarly, we measure distinct inpatient hospitalization episodes with OUD diagnosis in any diagnosis field. We exclude detoxification and partial hospitalization and count direct transfers from one facility to another (discharge from one inpatient setting and admission to a second inpatient setting within one calendar day or less) as a single hospitalization.
To facilitate comparison of ED visit and inpatient hospitalization rates, we calculate visits/admissions per 1,000 member-months in the time period.
Endnotes
- Kendal Orgera and Jennifer Tolbert. The Opioid Epidemic and Medicaid’s Role in Facilitating Access to Treatment. (Washington, DC: KFF), 2019. https://modern.kff.org/medicaid/issue-brief/the-opioid-epidemic-and-medicaids-role-in-facilitating-access-to-treatment/ ↩︎
- Medicaid and CHIP Payment and Access Commission (MACPAC). Report to Congress on Medicaid and CHIP June 2017: Chapter 2- Medicaid and the Opioid Epidemic.; 2017. https://www.macpac.gov/wp-content/uploads/2017/06/Medicaid-and-the-Opioid-Epidemic.pdf. ↩︎
- The brief includes the first findings from MODRN, a new initiative involving partnerships between state Medicaid agencies and universities conducting research and evaluation on the opioid epidemic and other public health issues facing their state’s Medicaid population (see Appendix for more detailed description of MODRN). To facilitate cross-state comparisons, MODRN employs a common data model to standardize estimates of OUD prevalence, treatment, and quality of care derived from state Medicaid claims and enrollment data. ↩︎
- KFF analysis of 2017 National Survey of Drug Use and Health. ↩︎
- Beth Han, Wilson M. Compton, Carlos Blanco, et al. “Prescription Opioid Use, Misuse, and Use Disorders in U.S. Adults: 2015 National Survey on Drug Use and Health.” Annals of Internal Medicine. 2017;167(5):293-301. https://annals.org/aim/article-abstract/2646632/prescription-opioid-use-misuse-use-disorders-u-s-adults-2015?doi=10.7326%2fM17-0865 ↩︎
- Virginia expanded Medicaid on January 1, 2019. ↩︎
- Samantha Artiga, Barbara Dipietro, and Petry Ubri. The Role of Medicaid and Impact of the Medicaid Expansion for Veterans Experiencing Homelessness. (Washington, DC: KFF), 2017. http://files.kff.org/attachment/Issue-Brief-The-Role-of-Medicaid-and-Impact-of-the-Medicaid-Expansion-for-Veterans-Experiencing-Homelessness ↩︎
- Brendan Saloner, Jonathan Levin, Hsien-Yen Change et al. “Changes in buprenorphine, naloxone, and opioid pain reliever prescriptions after the Affordable Care Act Medicaid Expansion.” JAMA Network Open 2018; 1(4). ↩︎
- Michael Linden, Sam Marullo, Curtis Bone et al. “Prisoners as Patients: The Opioid Epidemic, Medication-Assisted Treatment, and the Eighth Amendment.” J Law, Med Ethics. 2018;46:252-267. ↩︎
- Jesse Jannetta, Jane B, Wishner, and Rebecca Peters. Medicaid Areas of Flexibility to Provide Coverage and Care to Justice-Involved Populations. (Washington, DC: The Urban Institute): 2017. https://www.urban.org/sites/default/files/publication/88051/ohio_medicaid_1.pdf ↩︎
- Kathleen Gifford, Eileen Ellis, Aimee Lashbrook, et al. A View from the States: Key Medicaid Policy Changes: Results from a 50-State Medicaid Budget Survey for State Fiscal Years 2019 and 2020. (Washington, DC: KFF), October 2019. https://modern.kff.org/medicaid/report/a-view-from-the-states-key-medicaid-policy-changes-results-from-a-50-state-medicaid-budget-survey-for-state-fiscal-years-2019-and-2020/ ↩︎
- ibid. ↩︎
- Yaou Sheng, Peter Cunningham, Augustus White, et al. Opioid Prescribing for Medicaid Members Drops Sharply After 2016. VCU Health Behavior and Policy ARTS Evaluation, January 2019. https://hbp.vcu.edu/media/hbp/policybriefs/pdfs/HBP_ARTSIssue03_012919.pdf ↩︎
- These services range from outpatient treatment and counseling (ASAM 1.0), intensive outpatient treatment (ASAM 2.0), short-term residential treatment (ASAM 3.0) and inpatient detoxification (ASAM 4.0). American Society of Addiction Medicine. https://www.asam.org/resources/guidelines-and-consensus-documents/npg/complete-guideline. ↩︎
- MaryBeth Musumeci, Priya Chidambaram, and Kendal Orgera. State Options for Medicaid Coverage of Inpatient Behavioral Health Services. (Washington, DC: KFF), November 2019. https://modern.kff.org/report-section/state-options-for-medicaid-coverage-of-inpatient-behavioral-health-services-report/ ↩︎
- Peter Cunningham, Andrew Barnes, Yaou Sheng, et. al. Addiction and Recovery Treatment Services Access and Utilization during the First Year (April 2017 – March 2018). VCU Health Behavior and Policy ARTS Evaluation, August 2018. https://hbp.vcu.edu/media/hbp/policybriefs/pdfs/ARTSone-yearreport_8.9.18_Final.pdf ↩︎
- Substance Abuse and Mental Health Services Administration. Medication-Assisted Treatment (MAT) September, 2019. https://www.samhsa.gov/medication-assisted-treatment ↩︎
- National Institute on Drug Abuse, Medications to Treat Opioid Use Disorder. June 2018. https://www.drugabuse.gov/publications/research-reports/medications-to-treat-opioid-addiction/efficacy-medications-opioid-use-disorder ↩︎
- Gifford, Ellis, Lashbrook, et al, op. cit. ↩︎
- Substance Abuse Center for Behavioral Health Statistics and Quality. Results from the 2016 National Survey on Drug Use and Health: Detailed Tables. SAMHSA. https://www.samhsa.gov/data/sites/default/files/NSDUH-DetTabs-2016/NSDUH-DetTabs-2016.htm. Published September 7, 2017. ↩︎
- Kayla Holgash and Martha Heberlein. “Physician Acceptance of New Medicaid Patients: What Matters and What Doesn’t.” Health Affairs Blog. April 10, 2019. https://www.healthaffairs.org/do/10.1377/hblog20190401.678690/full/ ↩︎
- For more information on ECHO, see: https://echo.unm.edu/ ↩︎
- MaryBeth Musumeci and Jennifer Tolbert. Federal Legislation to Address the Opioid Crisis: Medicaid Provisions in the SUPPORT Act. (Washington, DC: KFF), October 2018. https://modern.kff.org/medicaid/issue-brief/federal-legislation-to-address-the-opioid-crisis-medicaid-provisions-in-the-support-act/ ↩︎
- For more information on MODRN, see: https://www.academyhealth.org/MODRN ↩︎
- Enrollees who age in (i.e., turn 12 at some point during the year) or age out (i.e., turn 65 at some point in the calendar year) of the age range included in the analysis are not included in the analysis for that year. ↩︎
- These codes included: ICD-9: 304.0x, 305.5x and ICD-10: F11.xxx. ↩︎
- Instead of identifying and limiting to outpatient setting, acute inpatient setting, or emergency department setting as in NQF’s specification, we use all inpatient, outpatient, and professional files in MCDM to identify beneficiaries with an OUD diagnosis. ↩︎
- NQF’s age criteria is 18-64 years of age for the duration of the first year during which they appear in the period. We modified the age criteria to ≥18 years of age in the beginning of the first year, and <64 at the end of the first year. In other words, we would only include beneficiaries who would be <65 years of age by the end of the second year. ↩︎
- Decision rules and details are available upon request. ↩︎