CHIP Enrollment: June 2013 Data Snapshot
Issue Brief
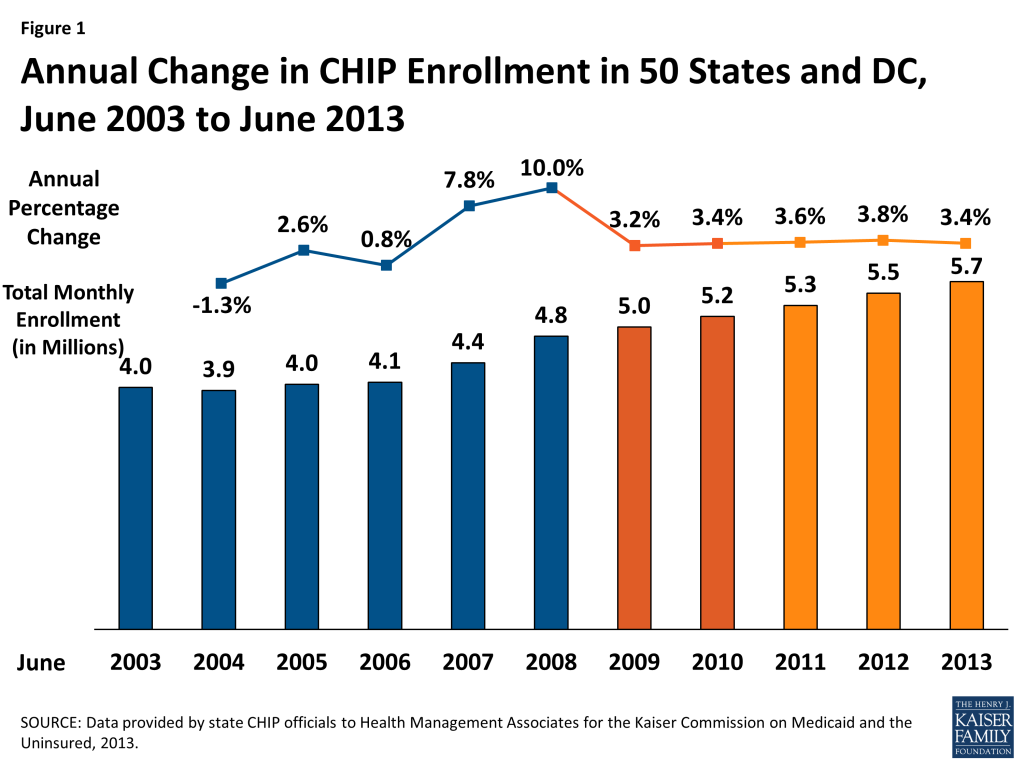
In June 2013, over 5.7 million children were enrolled in the Children’s Health Insurance Program (CHIP.) Enrollment in June 2013 increased by 190,453 or by 3.4 percent, compared to one year earlier. Since 2009, annual rates of growth have remained fairly steady, ranging between 3.2 percent and 3.8 percent. In contrast, during the height of the Great Recession, enrollment increased annually by 7.8 to 10 percent. (Figure 1)
CHIP, combined with Medicaid, provide a crucial safety net of coverage for low-income children. Both programs, aided by maintenance of eligibility (MOE) provisions maintained under the Affordable Care Act (ACA) helped to stave off increases in the number of uninsured children. Between 2007 and 2012, the uninsured rate for children dropped from 10.9% to 9.2%, despite a decline in the share of children with employer-sponsored coverage.1 CHIP offers coverage to low-income children in families without access to affordable coverage but with incomes above Medicaid levels. Economic conditions provide upward and downward pressure on CHIP enrollment. During the economic downturn, many Americans lost jobs and incomes declined, making children in such families eligible for CHIP. However, as family incomes continued to fall, children moved from CHIP to Medicaid.
Policy actions at the federal level have also affected CHIP enrollment. In addition to reauthorizing CHIP through 2015, the Children’s Health Insurance Program Reauthorization Act (CHIPRA) provided performance bonuses through FFY 2013 for states that increased enrollment of children who are eligible for Medicaid coverage but not enrolled and adopt enrollment simplifications. The last performance bonuses were awarded December 30, 2013 for FFY 2013. Over $307 million in such bonuses were awarded to twenty-three states, all of which had also been awarded bonuses in the prior year. Additionally, 15 states received a tier 2 bonus, indicating they exceeded their enrollment targets by more than ten percent.2
In addition to the MOE provisions mentioned above, which require states to maintain eligibility levels until 2019 for children, CHIP programs also face the same ACA requirements in terms of enrollment simplifications, coordination with Medicaid and the new Marketplaces, as well as the use of Modified Adjust Gross Income beginning in 2014. The ACA requires that Medicaid cover children with incomes up to 133 percent of the federal poverty level (FPL) as of January 2014. Before this change, states were required to cover children under the age of six in families with income of at least 133 percent FPL and school-age children and teens with incomes up to 100 percent FPL in Medicaid. Many states already covered children with incomes up to 133 percent FPL in Medicaid, but due to the change in law, 21 states needed to transition some children from their CHIP state plans to their Medicaid state plans.
A few of these 21 states decided to move these children before the requirement was in place. New York and Colorado implemented an early transition of children from CHIP to Medicaid but are maintaining separate CHIP programs. Meanwhile, New Hampshire and California moved or are in the process of transitioning all CHIP kids to Medicaid, not just these older children with incomes under 133 percent FPL. The remaining 17 states will transition an estimated 13 percent to 48 percent of their CHIP coverage to Medicaid.3 These children remain eligible for the Title XXI Federal CHIP match rate.
This CHIP enrollment report series has always included Title XXI-funded enrollees only (children enrolled in both Medicaid expansion CHIP programs and stand-alone CHIP programs) while its companion Medicaid enrollment report has included Title XIX-funded enrollees only; this has ensured an unduplicated count between Medicaid and CHIP children. Because of difficulties in identifying which of these children are in fact being transitioned and to continue to ensure unduplicated counts with the companion report for Medicaid, these older children are still included as CHIP enrollees in this report. Therefore, the early transitions described above are accounted for within CHIP in this report.
Cross State Trends. Over the year from June 2012 to June 2013, monthly CHIP enrollment increased in 29 states. Over 70 percent of the increased CHIP enrollment occurred in two states (Arizona and California.)
California’s CHIP enrollment represents over one-fifth of all CHIP enrollment across the country; enrollment growth in this program therefore has a significant effect on total CHIP enrollment. CHIP enrollment increased in California by 8.8 percent as 101,163 additional children were enrolled in June 2013 compared to one year earlier. The transition of children previously enrolled in the Title XXI Healthy Families to Medi-Cal (Medicaid) would not affect CHIP enrollment numbers reflected in this report because these children are still included in the CHIP counts. The increase in the number of children enrolled in CHIP may be related to outreach and enrollment efforts tied to expanded Medicaid and CHIP coverage programs in California, and also to the improving economy with children moving up the income scale between Medicaid and CHIP.
Arizona’s CHIP program, KidsCare, has been closed to new enrollment since December 2009 due to state budget shortfalls. CHIP enrollment steadily declined for several reporting periods, reaching its lowest level in over a decade in June 2012. However, the state opened a new, temporary program, KidsCare II, in May 2012 for approximately 20,000 children with incomes between 100 and 175 percent FPL.4 Between June 2012 and June 2013, CHIP enrollment in Arizona more than doubled as 30,973 more children had enrolled in coverage. The program was scheduled to end in January 2014. However, the state recently received approval to extend coverage for children with incomes above 133 percent FPL through January 31, 2014 to provide additional time to transition to coverage through the Federally Facilitated Marketplace.5
In contrast, CHIP enrollment declined in 22 states between June 2012 and June 2013. (Figure 2) A number of these declines were relatively small, A number of these states also saw growth among children eligible for Medicaid during this period as well, including Indiana, Maine, and Nevada, which had the largest percentage declines during this period.6
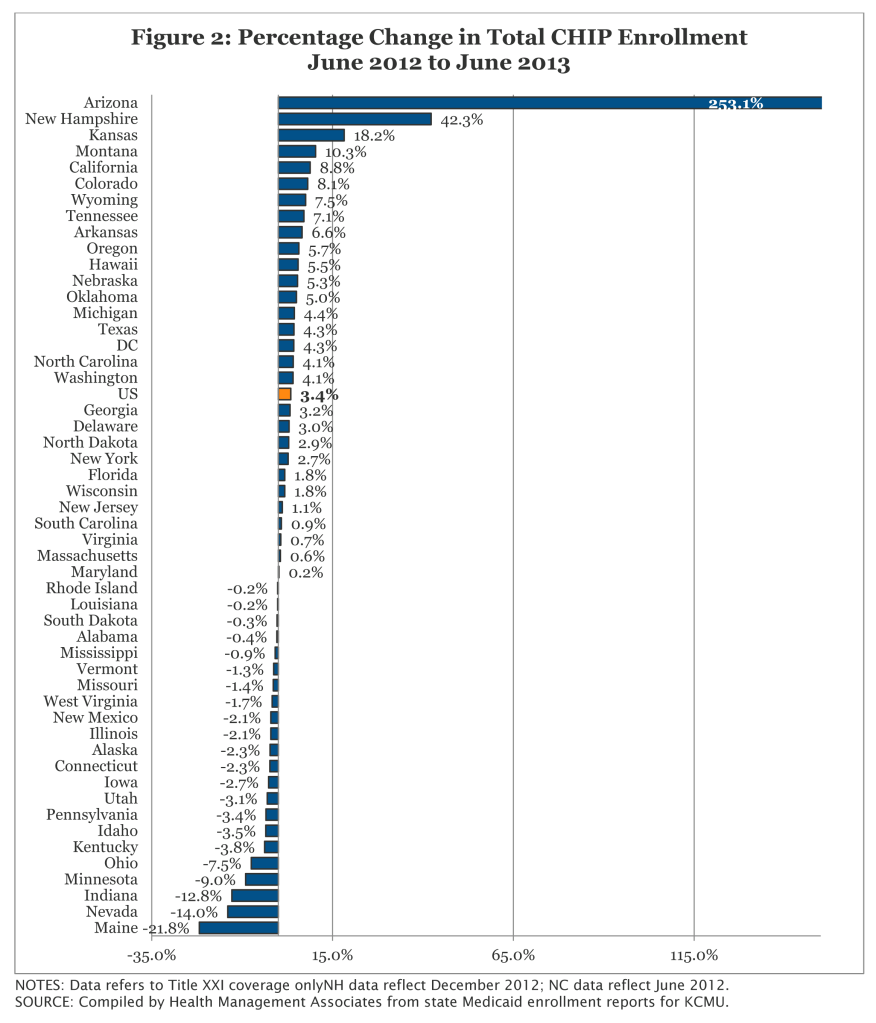
In terms of percentage change from one year to the next, enrollment in 2013 grew at a slower pace than in the prior annual period in 32 states. The only four states that experienced double digit growth were Arizona, Kansas, Montana, and New Hampshire.
CONCLUSION. Overall, CHIP enrollment continued to increase, but growth slow to the lowest rates since the start of the Recession as the economic conditions continued to improve. CHIP programs, along with state Medicaid programs continue to play a critical role in assuring health coverage for uninsured children.
This Data Snapshot was prepared by Vernon K. Smith of Health Management Associates along with Laura Snyder and Robin Rudowitz of the Kaiser Family Foundation.
Methodology
Methodology. The data in this report reflect the number of children, including individuals covered under the unborn child option, enrolled in CHIP programs in each state. State CHIP officials provided data specifically for the months of December 2012 and June 2013States also were asked to review data in previous reports in this series and to update data as might be appropriate for previous periods. The data for this report were requested in November 2013; responses were returned by December 2013Data for specific states in reports issued by CMS may differ from data in this report. Beyond the “point-in-time” versus “ever-enrolled” counts described below, differences occur when states provide data for this report for a point-in-time other than the final day of a quarter, when states update enrollment counts, e.g., for retroactive eligibility of a Medicaid-expansion CHIP program.
The data in this report are “point-in-time,” meaning the number of individuals enrolled in a specific month, such as June 2013. A “point-in-time” count is distinct from the “ever-enrolled” count, which is provided in reports issued by CMS. The annual count of children ever-enrolled will always exceed the number enrolled at any point- in-time, as long as new enrollments and departures occur during the year. For example, the CMS CHIP annual report for the year ending in September 2011, shows a total of 7,970,879 children enrolled at any point in time and for any length of time during that FFY 2011. In contrast, the number of children enrolled in the month of September 2011 per data provided for this report (not reported here) was 5,419,887 or 68.0 percent remained enrolled in September. Recent experience shows that one-third of CHIP enrollees enrolled at any time during the year were not enrolled at the end of the year.
Net Change. The data collected for this report are net changes in enrollment across the program and within select eligibility groups, taking into account the net impact of children enrolling and disenrolling from the CHIP program. Because this data are not individual level data and states do not make a distinction between enrollment among current beneficiaries and new beneficiaries, it is not possible to determine from this data the number of children that left the program and the number that newly enrolled in a given time period, i.e., the churn within the program. For example, this data set cannot be used to determine how many of the 5.7 million beneficiaries enrolled in June 2013 had been enrolled in June 2012.
Appendices
| Appendix 1: Total CHIP Enrollment by State , June 2006 – 2013 | ||||||||
| State | 2006 | 2007 | 2008 | 2009 | 2010 | 2011 | 2012 | 2013 |
| Alabama | 65,875 | 67,715 | 71,251 | 69,252 | 75,112 | 81,136 | 85,615 | 85,284 |
| Alaska | 9,582 | 7,793 | 8,743 | 8,721 | 10,148 | 10,917 | 11,040 | 10,788 |
| Arizona | 59,250 | 64,453 | 65,837 | 53,408 | 32,221 | 18,469 | 12,238 | 43,211 |
| Arkansas | 67,170 | 69,349 | 67,832 | 64,213 | 68,017 | 70,372 | 71,621 | 76,327 |
| California | 860,888 | 986,311 | 1,062,303 | 1,127,673 | 1,062,126 | 1,127,027 | 1,152,476 | 1,253,639 |
| Colorado | 53,894 | 51,939 | 60,166 | 64,598 | 69,369 | 63,956 | 82,856 | 89,595 |
| Connecticut | 14,251 | 17,200 | 15,432 | 14,136 | 14,212 | 13,657 | 12,872 | 12,575 |
| DC | 4,844 | 5,069 | 5,484 | 6,090 | 6,342 | 6,244 | 6,401 | 6,676 |
| Delaware | 4,750 | 5,146 | 6,720 | 6,307 | 5,871 | 6,337 | 6,514 | 6,708 |
| Florida | 193,639 | 224,575 | 231,226 | 225,028 | 254,217 | 252,447 | 258,414 | 262,980 |
| Georgia | 257,212 | 276,551 | 225,497 | 198,951 | 205,990 | 207,653 | 220,778 | 227,873 |
| Hawaii | 15,569 | 17,226 | 18,787 | 20,763 | 24,359 | 25,257 | 27,392 | 28,890 |
| Idaho | 14,287 | 19,352 | 26,811 | 29,652 | 24,622 | 24,837 | 25,222 | 24,340 |
| Illinois | 151,253 | 175,145 | 186,107 | 218,161 | 232,370 | 243,571 | 249,361 | 244,138 |
| Indiana | 69,787 | 68,394 | 71,253 | 70,496 | 79,757 | 83,494 | 94,476 | 82,355 |
| Iowa | 36,286 | 33,412 | 34,580 | 43,830 | 44,870 | 57,023 | 65,280 | 63,524 |
| Kansas | 37,631 | 35,374 | 38,047 | 38,731 | 40,065 | 45,694 | 47,078 | 55,663 |
| Kentucky | 50,225 | 52,536 | 53,555 | 53,991 | 59,962 | 67,023 | 67,631 | 65,070 |
| Louisiana | 107,777 | 107,828 | 124,310 | 126,657 | 124,373 | 124,018 | 121,696 | 121,442 |
| Maine | 14,705 | 13,346 | 13,839 | 14,955 | 15,479 | 15,945 | 15,838 | 12,381 |
| Maryland | 101,552 | 104,870 | 110,877 | 99,582 | 96,470 | 97,418 | 97,063 | 97,249 |
| Massachusetts | 75,019 | 87,492 | 105,094 | 103,605 | 113,760 | 116,043 | 119,014 | 119,702 |
| Michigan | 47,710 | 43,375 | 43,354 | 46,308 | 38,525 | 44,043 | 45,072 | 47,071 |
| Minnesota | 2,229 | 2,458 | 2,368 | 2,226 | 2,156 | 2,148 | 2,080 | 1,892 |
| Mississippi | 60,457 | 60,122 | 64,978 | 67,097 | 66,953 | 69,669 | 70,550 | 69,941 |
| Missouri | 61,097 | 61,936 | 58,923 | 65,133 | 71,663 | 70,853 | 70,828 | 69,854 |
| Montana | 13,165 | 13,289 | 16,576 | 18,639 | 20,761 | 24,739 | 28,844 | 31,819 |
| Nebraska | 23,194 | 24,491 | 25,397 | 23,744 | 27,421 | 29,396 | 30,516 | 32,132 |
| Nevada | 27,848 | 29,899 | 26,832 | 22,444 | 21,255 | 21,139 | 24,717 | 21,266 |
| New Hampshire | 7,688 | 7,415 | 8,009 | 7,905 | 8,527 | 8,938 | 8,868 | 12,615 |
| New Jersey | 127,525 | 125,494 | 121,581 | 133,878 | 155,512 | 166,218 | 168,337 | 170,176 |
| New Mexico | 10,598 | 8,072 | 9,706 | 8,647 | 8,615 | 8,165 | 7,926 | 7,762 |
| New York | 388,689 | 394,164 | 365,311 | 382,803 | 394,692 | 409,252 | 452,462 | 464,637 |
| North Carolina | 109,466 | 113,667 | 122,379 | 129,973 | 171,730 | 192,855 | 190,766 | 198,643 |
| North Dakota | 4,454 | 4,553 | 5,785 | 4,644 | 4,666 | 4,706 | 4,818 | 4,956 |
| Ohio | 142,374 | 140,547 | 145,049 | 153,335 | 158,194 | 162,041 | 163,473 | 151,252 |
| Oklahoma | 58,731 | 66,570 | 62,955 | 65,679 | 69,968 | 60,374 | 70,017 | 73,517 |
| Oregon | 29,430 | 39,586 | 50,736 | 47,575 | 56,930 | 68,102 | 72,557 | 76,687 |
| Pennsylvania | 143,501 | 161,166 | 172,662 | 191,497 | 194,721 | 191,508 | 190,279 | 183,773 |
| Rhode Island | 12,412 | 12,612 | 12,348 | 12,454 | 14,361 | 15,032 | 15,209 | 15,179 |
| South Carolina | 40,161 | 36,001 | 45,332 | 54,406 | 56,618 | 61,940 | 66,809 | 67,385 |
| South Dakota | 11,323 | 11,136 | 11,531 | 11,900 | 12,334 | 12,917 | 13,158 | 13,114 |
| Tennessee | – | 31,619 | 53,064 | 67,980 | 73,741 | 78,883 | 77,407 | 82,877 |
| Texas | 293,342 | 326,635 | 554,642 | 544,815 | 574,902 | 576,025 | 615,017 | 641,636 |
| Utah | 35,724 | 25,095 | 35,248 | 41,468 | 41,608 | 37,696 | 36,605 | 35,482 |
| Vermont | 3,012 | 2,820 | 3,215 | 3,330 | 3,478 | 3,721 | 3,936 | 3,886 |
| Virginia | 78,745 | 82,731 | 90,907 | 96,163 | 99,433 | 108,553 | 113,333 | 114,121 |
| Washington | 18,790 | 18,975 | 20,953 | 23,875 | 29,537 | 31,660 | 30,873 | 32,126 |
| West Virginia | 24,835 | 24,939 | 24,418 | 24,555 | 24,824 | 24,069 | 25,114 | 24,679 |
| Wisconsin | 30,954 | 31,368 | 71,590 | 72,153 | 91,737 | 94,470 | 90,468 | 92,060 |
| Wyoming | 5,263 | 5,684 | 6,039 | 5,532 | 5,430 | 5,597 | 5,566 | 5,986 |
| Total | 4,078,163 | 4,397,495 | 4,835,639 | 4,988,958 | 5,160,004 | 5,343,247 | 5,546,481 | 5,736,934 |
| Appendix 2: Total CHIP Enrollment by State (Percentage Change), June 2005 – 2013 | ||||||||
| State | 05-06 | 06-07 | 07-08 | 08-09 | 09-10 | 10-11 | 11-12 | 12-13 |
| Alabama | 2.4% | 2.8% | 5.2% | -2.8% | 8.5% | 8.0% | 5.5% | -0.4% |
| Alaska | -15.7% | -18.7% | 12.2% | -0.3% | 16.4% | 7.6% | 1.1% | -2.3% |
| Arizona | 17.0% | 8.8% | 2.1% | -18.9% | -39.7% | -42.7% | -33.7% | 253.1% |
| Arkansas | 8.1% | 3.2% | -2.2% | -5.3% | 5.9% | 3.5% | 1.8% | 6.6% |
| California | 5.1% | 14.6% | 7.7% | 6.2% | -5.8% | 6.1% | 2.3% | 8.8% |
| Colorado | 32.4% | -3.6% | 15.8% | 7.4% | 7.4% | -7.8% | 29.6% | 8.1% |
| Connecticut | -9.2% | 20.7% | -10.3% | -8.4% | 0.5% | -3.9% | -5.7% | -2.3% |
| DC | 11.1% | 4.6% | 8.2% | 11.1% | 4.1% | -1.5% | 2.5% | 4.3% |
| Delaware | 3.9% | 8.3% | 30.6% | -6.1% | -6.9% | 7.9% | 2.8% | 3.0% |
| Florida | -5.1% | 16.0% | 3.0% | -2.7% | 13.0% | -0.7% | 2.4% | 1.8% |
| Georgia | 12.4% | 7.5% | -18.5% | -11.8% | 3.5% | 0.8% | 6.3% | 3.2% |
| Hawaii | 10.4% | 10.6% | 9.1% | 10.5% | 17.3% | 3.7% | 8.5% | 5.5% |
| Idaho | 3.6% | 35.5% | 38.5% | 10.6% | -17.0% | 0.9% | 1.6% | -3.5% |
| Illinois | 11.2% | 15.8% | 6.3% | 4.9% | 4.7% | 3.0% | 4.2% | 11.4% |
| Indiana | 1.2% | -2.0% | 4.2% | -1.1% | 13.1% | 4.7% | 13.2% | -12.8% |
| Iowa | 3.9% | -7.9% | 3.5% | 26.7% | 2.4% | 27.1% | 14.5% | -2.7% |
| Kansas | 8.7% | -6.0% | 7.6% | 1.8% | 3.4% | 14.0% | 3.0% | 18.2% |
| Kentucky | 1.7% | 4.6% | 1.9% | 0.8% | 11.1% | 11.8% | 0.9% | -3.8% |
| Louisiana | -0.1% | 0.0% | 15.3% | 1.9% | -1.8% | -0.3% | -1.9% | -0.2% |
| Maine | 5.1% | -9.2% | 3.7% | 8.1% | 3.5% | 3.0% | -0.7% | -21.8% |
| Maryland | 6.9% | 3.3% | 5.7% | -10.2% | -3.1% | 1.0% | -0.4% | 0.2% |
| Massachusetts | 6.9% | 16.6% | 20.1% | -1.4% | 9.8% | 2.0% | 2.6% | 0.6% |
| Michigan | -15.1% | -9.1% | 0.0% | 6.8% | -16.8% | 14.3% | 2.3% | 4.4% |
| Minnesota | 5.0% | 10.3% | -3.7% | -6.0% | -3.1% | -0.4% | -3.2% | -9.0% |
| Mississippi | -11.2% | -0.6% | 8.1% | 3.3% | -0.2% | 4.1% | 1.3% | -0.9% |
| Missouri | -34.8% | 1.4% | -4.9% | 10.5% | 10.0% | -1.1% | 0.0% | -1.4% |
| Montana | 20.7% | 0.9% | 24.7% | 12.4% | 11.4% | 19.2% | 16.6% | 10.3% |
| Nebraska | 0.3% | 5.6% | 3.7% | -6.5% | 15.5% | 7.2% | 3.8% | 5.3% |
| Nevada | -3.4% | 7.4% | -10.3% | -16.4% | -5.3% | -0.5% | 16.9% | -14.0% |
| New Hampshire | 9.5% | -3.6% | 8.0% | -1.3% | 7.9% | 4.8% | -0.8% | 42.3% |
| New Jersey | 10.7% | -1.6% | -3.1% | 10.1% | 16.2% | 6.9% | 1.3% | 1.1% |
| New Mexico | -0.5% | -23.8% | 20.2% | -10.9% | -0.4% | -5.2% | -2.9% | -2.1% |
| New York | -8.9% | 1.4% | -7.3% | 4.8% | 3.1% | 3.7% | 10.6% | 2.7% |
| North Carolina | -16.1% | 3.8% | 7.7% | 6.2% | 32.1% | 12.3% | -1.1% | 4.1% |
| North Dakota | 7.7% | 2.2% | 27.1% | -19.7% | 0.5% | 0.9% | 2.4% | 2.9% |
| Ohio | 15.9% | -1.3% | 3.2% | 5.7% | 3.2% | 2.4% | 0.9% | -7.5% |
| Oklahoma | 7.9% | 13.3% | -5.4% | 4.3% | 6.5% | -13.7% | 16.0% | 5.0% |
| Oregon | 17.7% | 34.5% | 28.2% | -6.2% | 19.7% | 19.6% | 6.5% | 5.7% |
| Pennsylvania | 5.1% | 12.3% | 7.1% | 10.9% | 1.7% | -1.7% | -0.6% | -3.4% |
| Rhode Island | 5.6% | 1.6% | -2.1% | 0.9% | 15.3% | 4.7% | 1.2% | -0.2% |
| South Carolina | -23.6% | -10.4% | 25.9% | 20.0% | 4.1% | 9.4% | 7.9% | 0.9% |
| South Dakota | 6.7% | -1.7% | 3.5% | 3.2% | 3.6% | 4.7% | 1.9% | -0.3% |
| Tennessee | – | – | 67.8% | 28.1% | 8.5% | 7.0% | -1.9% | 7.1% |
| Texas | -10.1% | 11.3% | 69.8% | -1.8% | 5.5% | 0.2% | 6.8% | 4.3% |
| Utah | 26.4% | -29.8% | 40.5% | 17.6% | 0.3% | -9.4% | -2.9% | -3.1% |
| Vermont | 0.7% | -6.4% | 14.0% | 3.6% | 4.4% | 7.0% | 5.8% | -1.3% |
| Virginia | 7.6% | 5.1% | 9.9% | 5.8% | 3.4% | 9.2% | 4.4% | 0.7% |
| Washington | -11.1% | 1.0% | 10.4% | 13.9% | 23.7% | 7.2% | -2.5% | 4.1% |
| West Virginia | 1.3% | 0.4% | -2.1% | 0.6% | 1.1% | -3.0% | 4.3% | -1.7% |
| Wisconsin | 10.5% | 1.3% | 128.2% | 0.8% | 27.1% | 3.0% | -4.2% | 1.8% |
| Wyoming | 27.7% | 8.0% | 6.2% | -8.4% | -1.8% | 3.1% | -0.6% | 7.5% |
| Total | 0.8% | 7.8% | 10.0% | 2.7% | 3.3% | 3.5% | 3.9% | 4.0% |
Endnotes
- Kaiser Commission on Medicaid and the Uninsured, The Uninsured: A Primer – Key Facts about Health Insurance on the Eve of Coverage Expansions, Kaiser Commission on Medicaid and the Uninsured, October 2013http://modern.kff.org/report-section/the-uninsured-a-primer-2013-3-how-and-why-has-the-number-of-uninsured-people-changed/. ↩︎
- CHIPRA Performance BonusesInsureKidsNow.gov, Centers for Medicare and Medicaid Services (CMS), Accessed January 13, 2013http://www.insurekidsnow.gov/professionals/eligibility/performance_bonuses.html ↩︎
- Wesley Prater and Joan Alker, Georgetown University Center for Children and Families, Aligning Eligibility for Children: Moving the Stairstep Kids to Medicaid, (Washington, DC: Kaiser Commission on Medicaid and the Uninsured, August 2013,) http://modern.kff.org/medicaid/issue-brief/aligning-eligibility-for-children-moving-the-stairstep-kids-to-medicaid/. ↩︎
- In May 2013, the state expanded eligibility up to 200% FPL. “KidsCare II – Arizona’s Temporary Children’s Health Insurance Program (CHIP),” Arizona Health Care Cost Containment System (AHCCCS), accessed January 15, 2014. http://www.azahcccs.gov/applicants/KidsCareII.aspx. ↩︎
- “KidsCare II – Arizona’s Temporary Children’s Health Insurance Program (CHIP),” Arizona Health Care Cost Containment System (AHCCCS), accessed January 15, 2014. http://www.azahcccs.gov/applicants/KidsCareII.aspx. ↩︎
- Kaiser Commission on Medicaid and the Uninsured, Medicaid Enrollment: June 2013 Data Snapshot, (Washington, DC: Kaiser Commission on Medicaid and the Uninsured, January 2014,) modern.kff.org/medicaid/issue-brief/medicaid-enrollment-june-2013-data-snapshot. ↩︎