A Look at Variation in Medicaid Spending Per Enrollee by Group and Across States
Editorial Note
Originally published in August 2024, this data note was updated on October 6, 2025 with data from 2023, the most current Medicaid data available at the time of this analysis.
Medicaid is the primary program providing comprehensive health and long-term care coverage to approximately one in five low-income Americans. States administer Medicaid programs within broad federal rules, but have flexibility in designing programs, which creates variation in spending and enrollment as well as spending per enrollee across eligibility groups and states.
Over the coming years, state Medicaid programs may see significant reductions to their Medicaid enrollment and spending, resulting in changes to their spending per enrollee, across eligibility groups due to the recently enacted budget reconciliation package once called the “One Big, Beautiful Bill,” signed by President Trump on July 4th. The new law is estimated by the Congressional Budget Office (CBO) to cut federal Medicaid spending by $911 billion – or 14% of federal Medicaid spending – over the next ten years and increase the uninsured rate by 10 million, with some of the increase attributed to individuals losing Medicaid coverage. Provisions in the new law will have different effects on Medicaid spending and enrollment across the states. For example, over half of the reductions in federal spending (associated with most of the projected enrollment declines) stem from policies that only would affect states that have expanded Medicaid under the Affordable Care Act (ACA). How states respond to reductions in federal funding will impact the amount of spending reductions and the distribution of enrollment losses, which will affect Medicaid’s spending per enrollee.
This data note provides an overview of total Medicaid (state and federal shares) spending per enrollee for full-benefit Medicaid enrollees by eligibility group and state in 2023. Data from 2023 are the most current Medicaid data available at the time of this analysis. Full-benefit Medicaid enrollees are those that qualify for a full range of Medicaid services such as doctor’s visits, hospitalizations, prescription drugs, and home health services. A small number of total enrollees (8% of all enrollees in 2023) qualify for only a limited set of Medicaid benefits such as family planning or treatment of an emergency medical condition and are not included in this analysis. References to Medicaid enrollees in this data note refer to full-benefit enrollees. See methods for more details. Detailed state-level data are also available on State Health Facts.
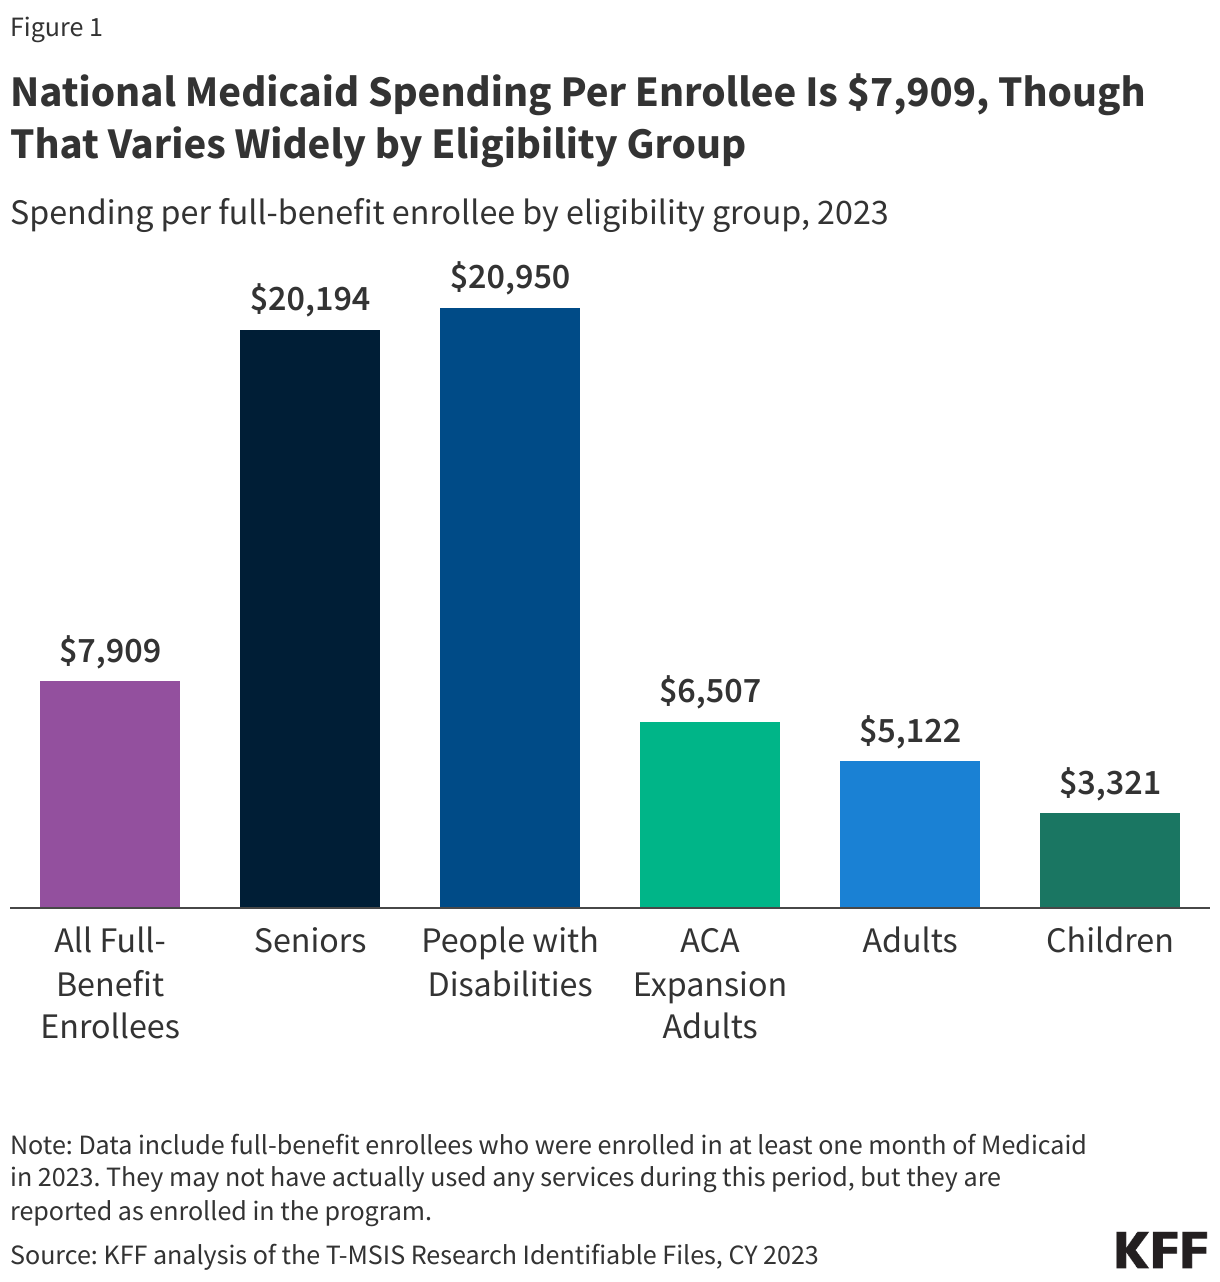
National Medicaid spending per enrollee is $7,909, though that varies widely by eligibility group (Figure 1).
Overall, children account for 35% of full-benefit enrollment, but 15% of the spending, while adults ages 65 and older and people eligible because of a disability account for 19% of enrollment but 51% of the spending (data not shown). The disproportionate spending on certain eligibility groups stems from variation in spending per enrollee across the eligibility groups. Spending per enrollee is highest for people with disabilities ($20,950), and older adults ($20,194) (Figure 1). Those groups have per-enrollee spending approximately six times higher than child enrollees ($3,321), which have the lowest spending of any eligibility group (Figure 1). Differences in spending per enrollee reflect differences in health care needs and utilization. For example, older adults and people eligible on the basis of disability tend to have higher rates of chronic conditions, more complex health care needs and are more likely to utilize long-term care (LTC) than other enrollees. Most older adults and people with disabilities enrolled in Medicaid are also dually eligible for Medicare. For dual-eligible individuals, Medicare is the primary payer for acute care services while Medicaid pays for services that Medicare does not, including vision, dental, and most LTC. Medicaid spending per enrollee accounts for less than half of all spending for full-benefit dual-eligible individuals that are 65 and older.
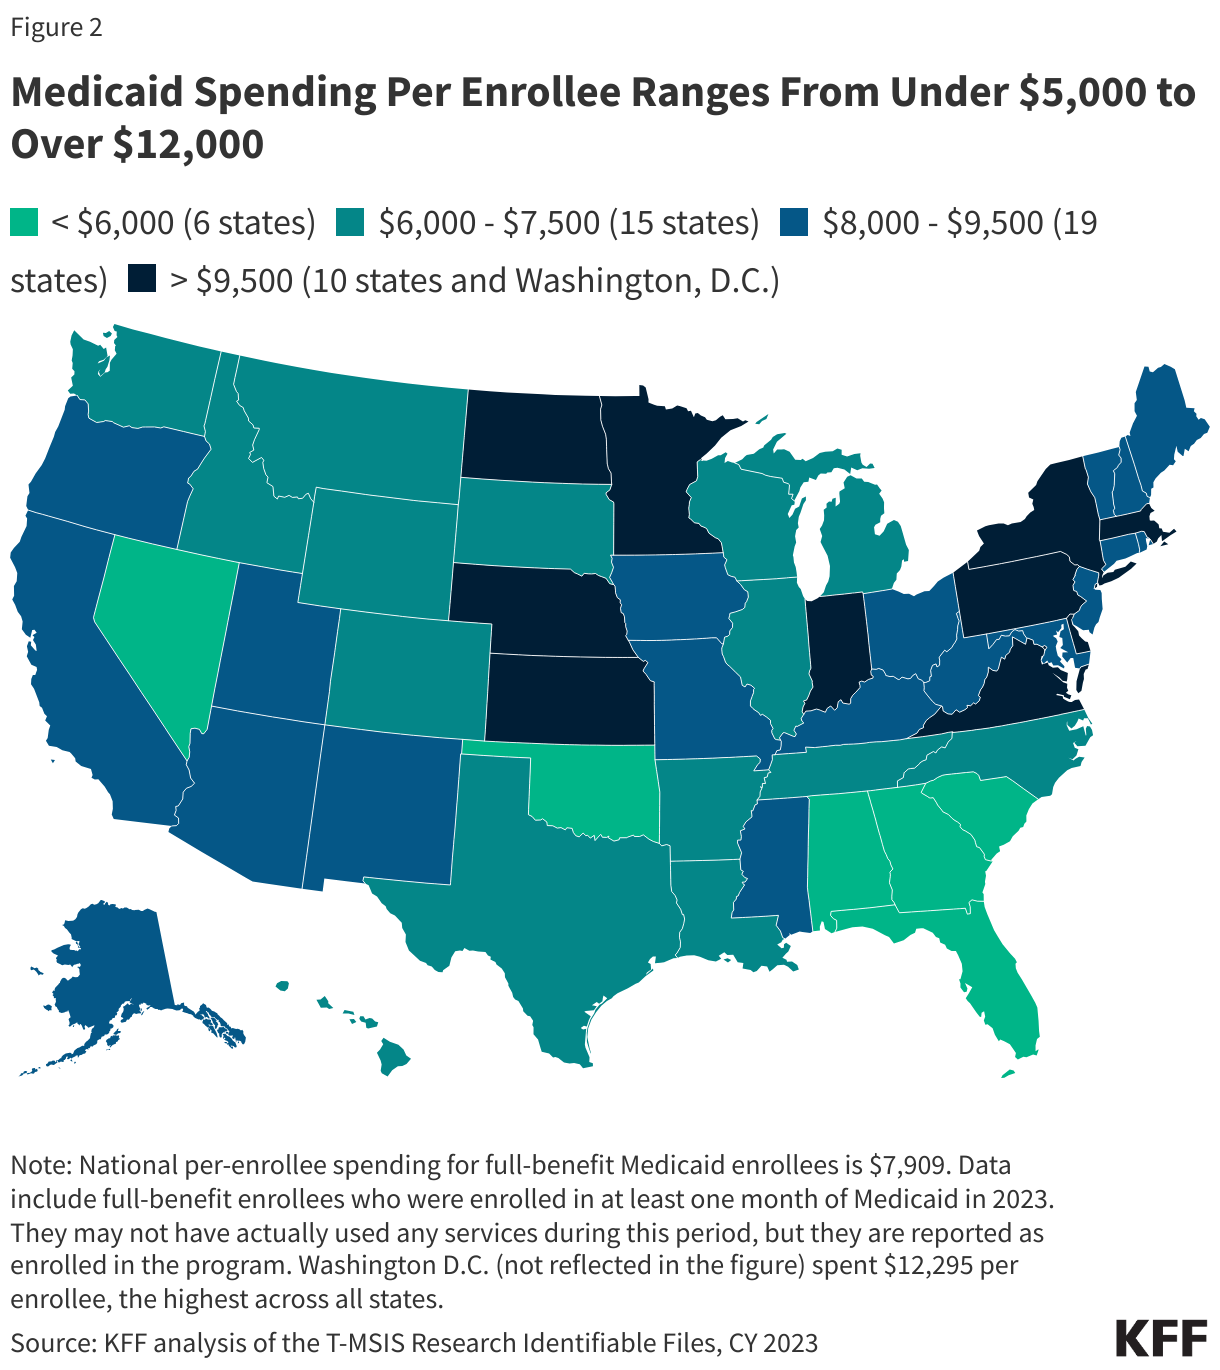
Flexibility for states to determine eligibility levels, benefits, and provider payments in the Medicaid program leads to wide variation in per-enrollee spending across states (Figure 2).
Other factors contributing to variation in per-enrollee spending include variation in state populations and demographics, ability and effort to raise revenue, and variation in health care costs and markets. Across states, Medicaid spending per enrollee ranges from $4,780 to $12,295, with a median spending of $7,909 (Figure 2). Alabama, Florida, Georgia, and Nevada report some of the lowest spending per enrollee, while Washington, D.C., Minnesota, Pennsylvania, and North Dakota report the highest spending per enrollee. Approximately one in seven states have spending greater than $10,000 per enrollee (Figure 2).
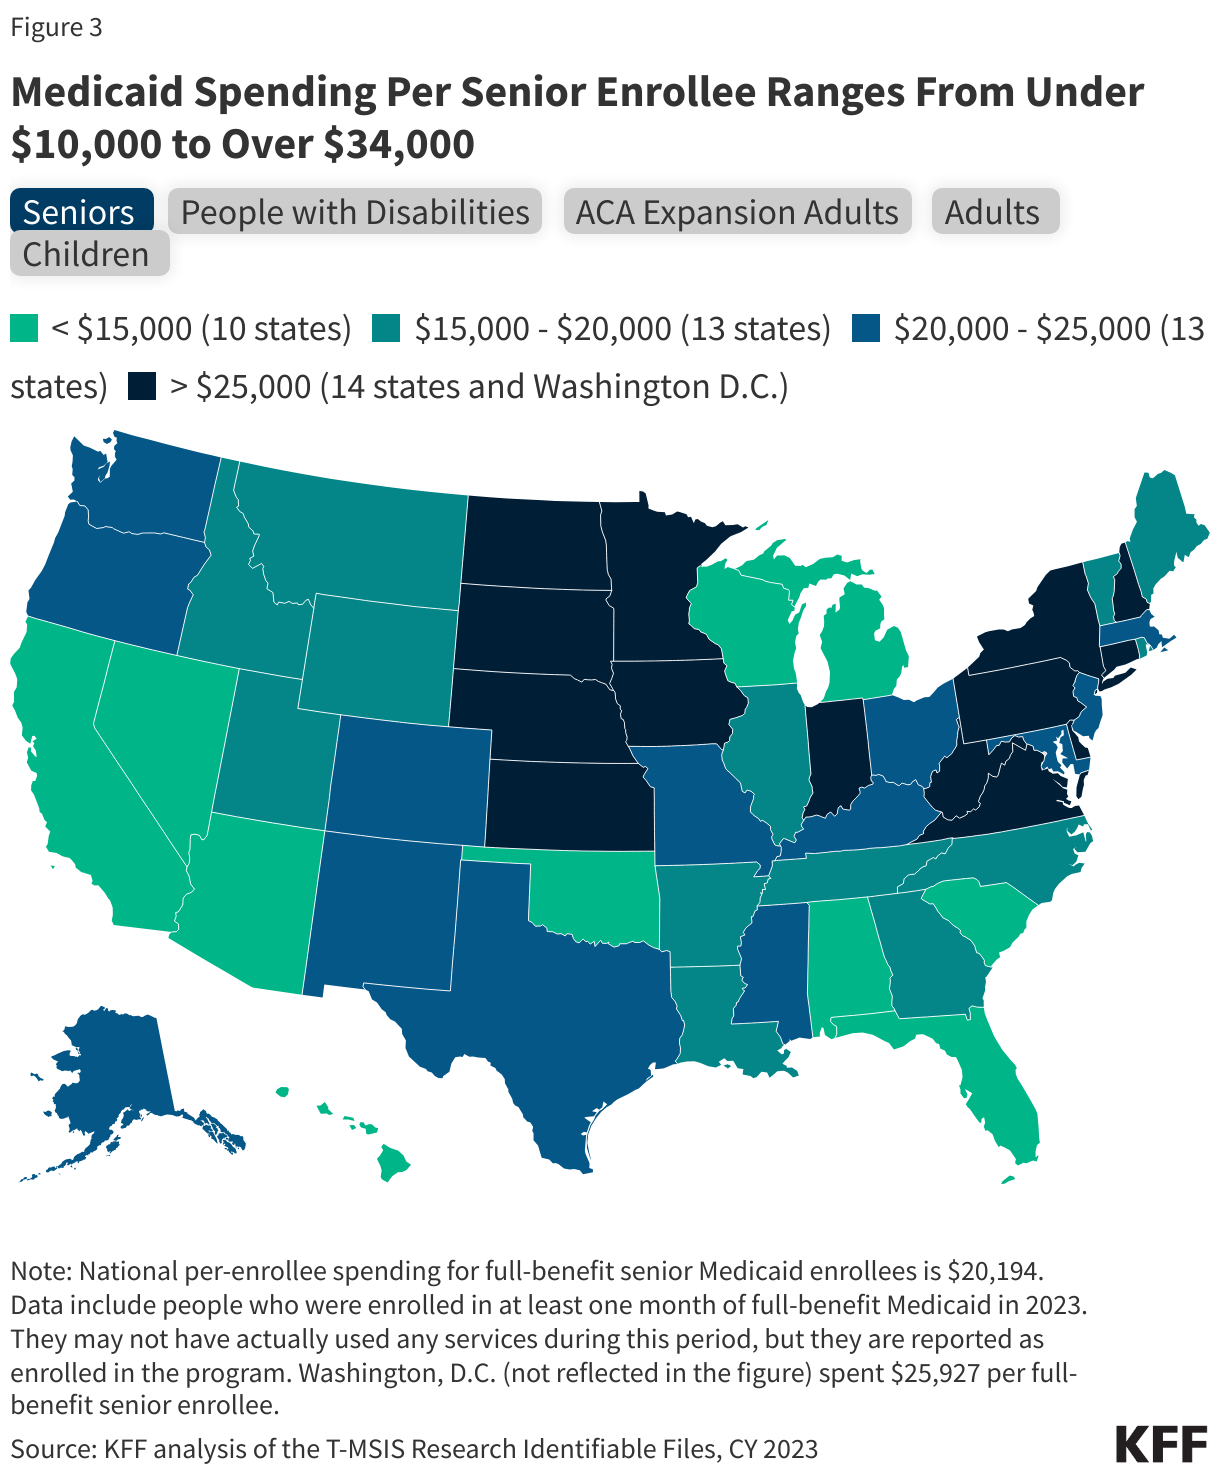
Within each eligibility group, there is also considerable variation in spending per enrollee across states (Figure 3).
People with disabilities have the widest variation across states for per-enrollee spending, ranging from $5,040 in Florida to $57,900 in Minnesota (Figure 3). States have considerable flexibility to decide the populations and services covered for long-term care (LTC), which drives large variation in per-enrollee spending for older adults and people with disabilities, who are more likely to use LTC. In contrast, per-enrollee spending for children ranges from $2,227 in Alabama to $5,457 in Alaska (Figure 3). All states must provide comprehensive coverage for children through the Early Periodic Screening Diagnosis and Treatment (EPSDT), which contributes to somewhat less variation in per-enrollee spending for children.
Many—but not all—states that have relatively high or low overall per-enrollee spending tend to see those same patterns across eligibility groups in the state (Figure 3). Some states with the lowest overall per-enrollee spending (e.g. Alabama, Oklahoma) fall among the states with the lowest per-enrollee spending for most eligibility groups (Figure 3). Others, such as Florida and Nevada are more mixed across eligibility groups. For example, Florida, has low per-enrollee spending across all eligibility groups except for children, where it has one of the highest per-enrollee spending. Similarly, some states with the highest overall per-enrollee spending (e.g. Washington, D.C., Delaware) fall among the states with the highest per-enrollee spending for all eligibility groups. However, states like Pennsylvania and Massachusetts are less consistently high across all eligibility groups (Figure 3).
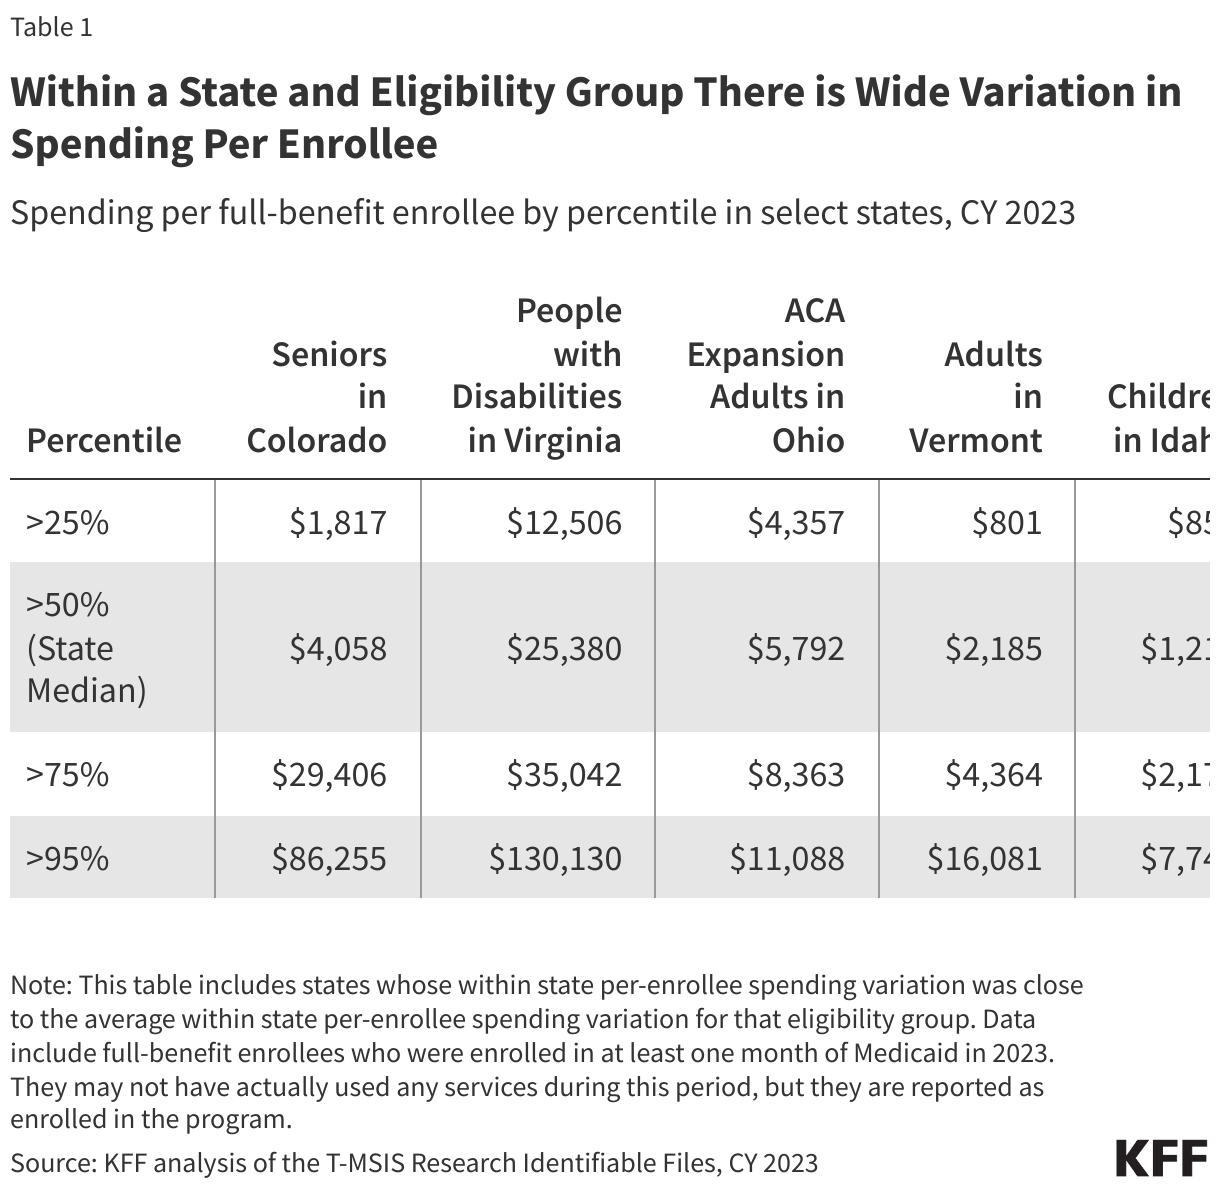
Even within a given state and eligibility group, there is wide variation in spending (Table 1). For example, among people with disabilities in Virginia, 25% have spending less than $12,506 and 5% have spending more than $130,130 – ten times higher (Table 1). Additionally, 25% of seniors in Colorado have spending less than $1,817, and 25% have spending sixteen times greater ($29,406) (Table 1). Despite the generally lower costs for non-disabled adult and child enrollees, the variation in spending for these eligibility groups is wide in Ohio, Vermont, and Idaho as well.
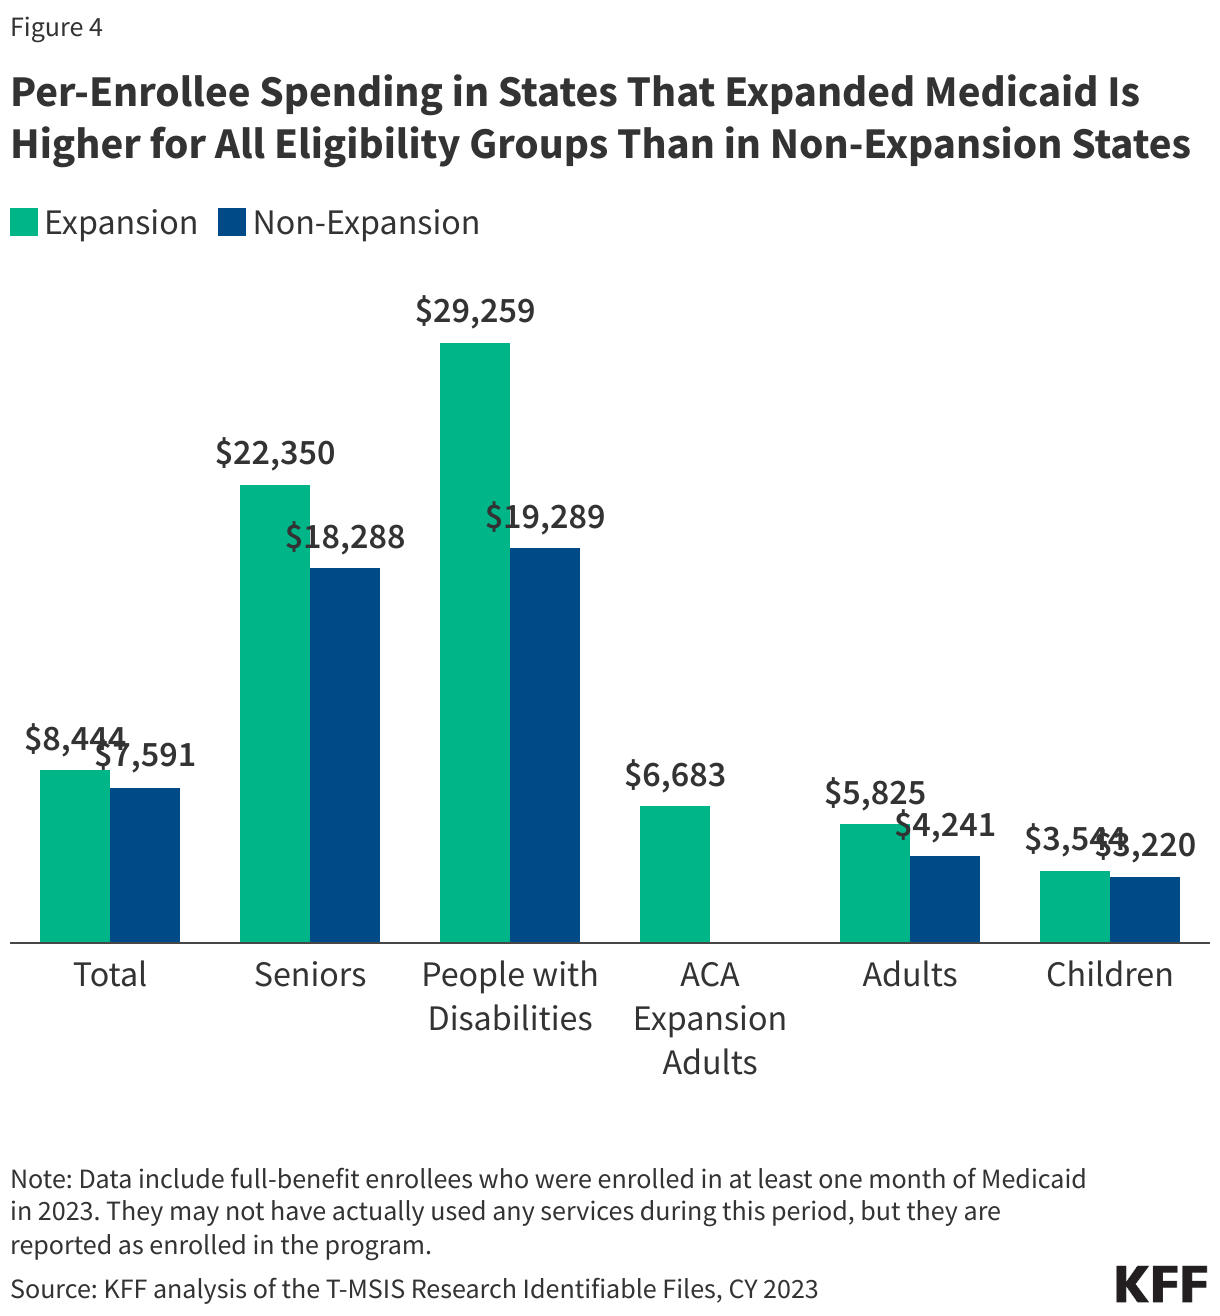
Per-enrollee spending in states that expanded Medicaid is higher for all eligibility groups than in non-expansion states (Figure 4).
Expansion states spend on average $8,444 per enrollee – nearly $1,000 more per enrollee when compared to non-expansion states, which spend $7,591 per enrollee (Figure 4). During debate over the reconciliation bill, some argued that the 90% match rate for expansion adults encourages expansion states to prioritize services for expansion adults of those of other populations—children, parents, people with disabilities, and older adults. However, across all non-expansion eligibility groups, average per-enrollee spending is higher in expansion states than in non-expansion states. For instance, expansion states have an average spending of $29,259 per enrollee eligible based on disability, while non-expansion states spend on average $19,289 per enrollee in the same eligibility group. Similarly, expansion states spend $22,350 per older adult enrollee compared to $18,288 for non-expansion states (Figure 4). These differences in spending may reflect state policy choices about benefits and eligibility, in addition to payment rates, regional variation in health care costs, and state demographics.
Methods
Data: The KFF State Health Facts on spending per full-benefit enrollee use the T-MSIS Research Identifiable Demographic-Eligibility and Claims Files (T-MSIS data). This data note is based on State Health Facts data from CY 2023.
Overview of methods: KFF defined full-benefit enrollees as those who are enrolled in Medicaid for at least 1 month with full-benefits or those who received at least one month of benefits through an alternative package of benchmark equivalent coverage. They may have not actually used any services during this period, but they are reported as enrolled in the program and are eligible to receive services. References to dual-eligible enrollees do not include Medicare Savings Program (MSP) enrollees due to the restriction of data to full-benefit enrollees only.
Spending: Spending was calculated by summing the total spending of all claims per full-benefit enrollee in the T-MSIS claims files.