Why Does the Medicaid Debate Matter? National Data and Voices of People with Medicaid Highlight Medicaid’s Role
President Trump and other GOP leaders have called for far-reaching changes to Medicaid, including caps and reductions in federal funding for the program. In 2017, Congress has been debating legislation, the American Health Care Act (AHCA), that would end the enhanced federal matching funds for the Affordable Care Act (ACA) Medicaid expansion and end the guarantee of federal financing to states for all populations covered by the program. In response to substantially reduced federal funding, states may have to make reductions to their programs, including restrictions in eligibility, benefits, and/or provider payment rates if they cannot replace lost federal funding from other sources.
Today, Medicaid is a state and federal partnership with financing shared by the states and the federal government with no caps. Total federal and state Medicaid spending was about $532 billion in FY 2015. Medicaid is the second largest item in state budgets, accounting for 18.7% of state general revenue spending. Medicaid spending increased to 10.5% in 2015 with the ACA coverage expansion, but it dropped to 5.9% in 2016 and is projected to grow by 4.5% this year, and Medicaid per enrollee costs are projected to grow more slowly than costs for private insurance.
This snapshot provides data on the role Medicaid plays for different population groups as well as perspectives from individuals with coverage through the program. Medicaid, the nation’s public health insurance program for low-income children, adults, seniors, and people with disabilities, covers 1 in 5 Americans, including many with complex and costly needs for medical care and long-term services. Most people covered by Medicaid would be uninsured or underinsured without it. The AHCA would fundamentally change Medicaid in the most significant restructuring of the program since 1965.
- Medicaid is personally important to millions of Americans.
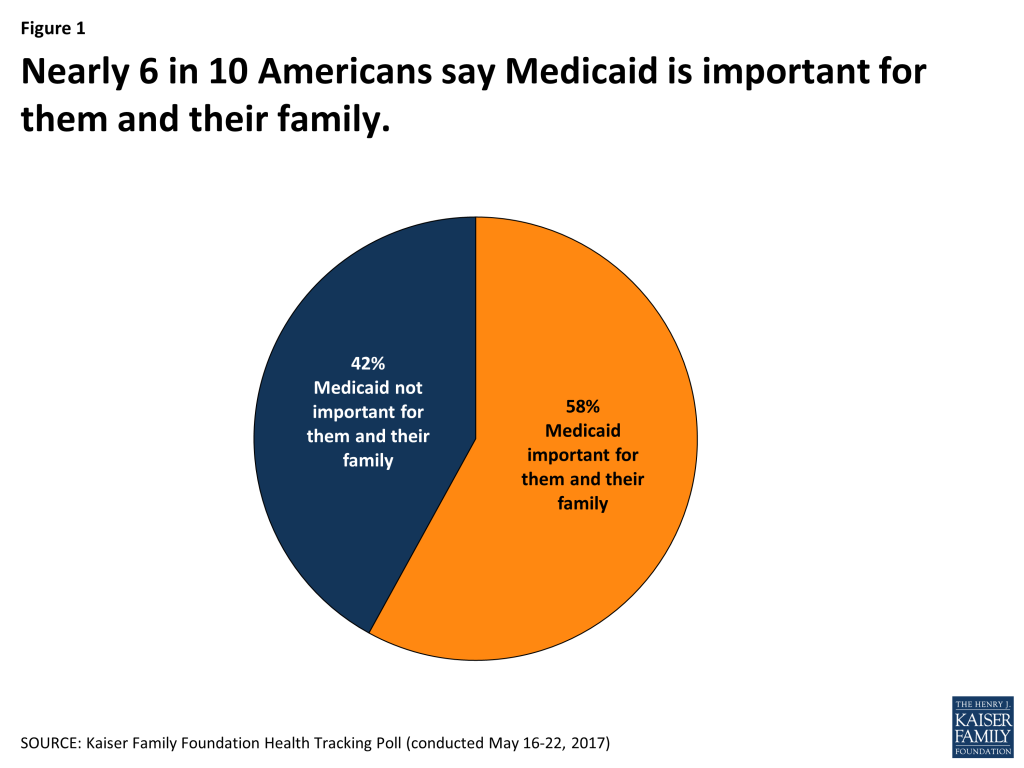
Figure 1: Nearly 6 in 10 Americans say Medicaid is important for them and their family. - Covering 1 in 5 Americans, Medicaid reaches many low-income children, adults, seniors, and people with disabilities.
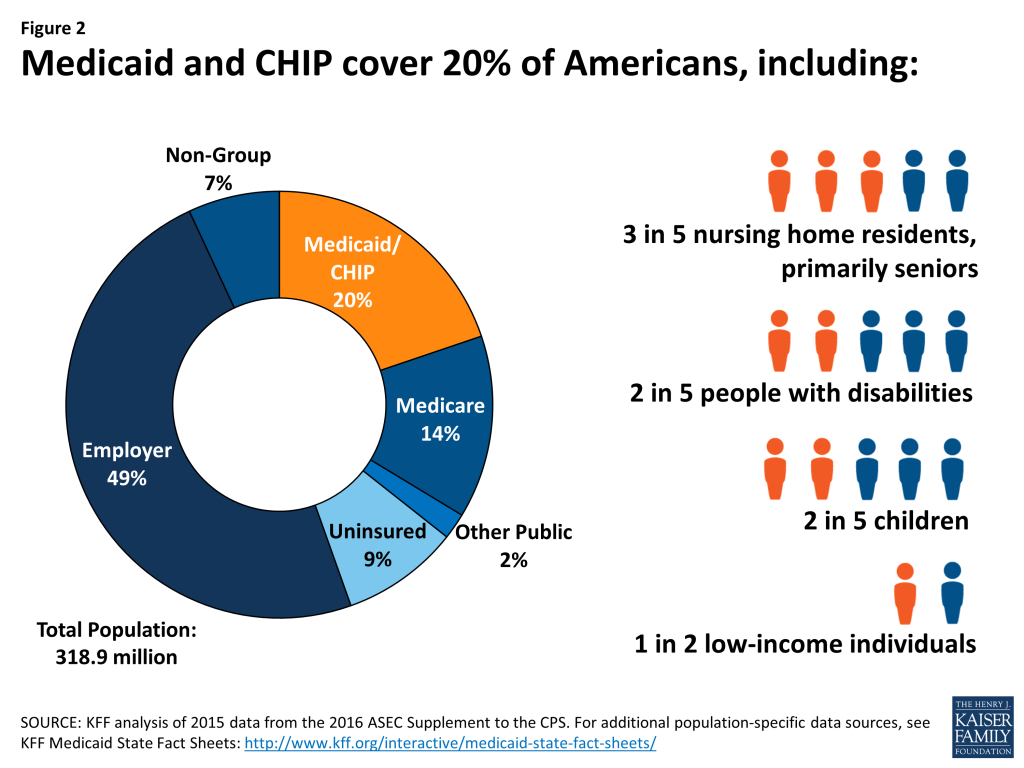
Figure 2: Medicaid and CHIP cover 20% of Americans - Medicaid is the nation’s major source of long-term care financing, which is particularly important in supporting seniors and relieving families’ care burden.
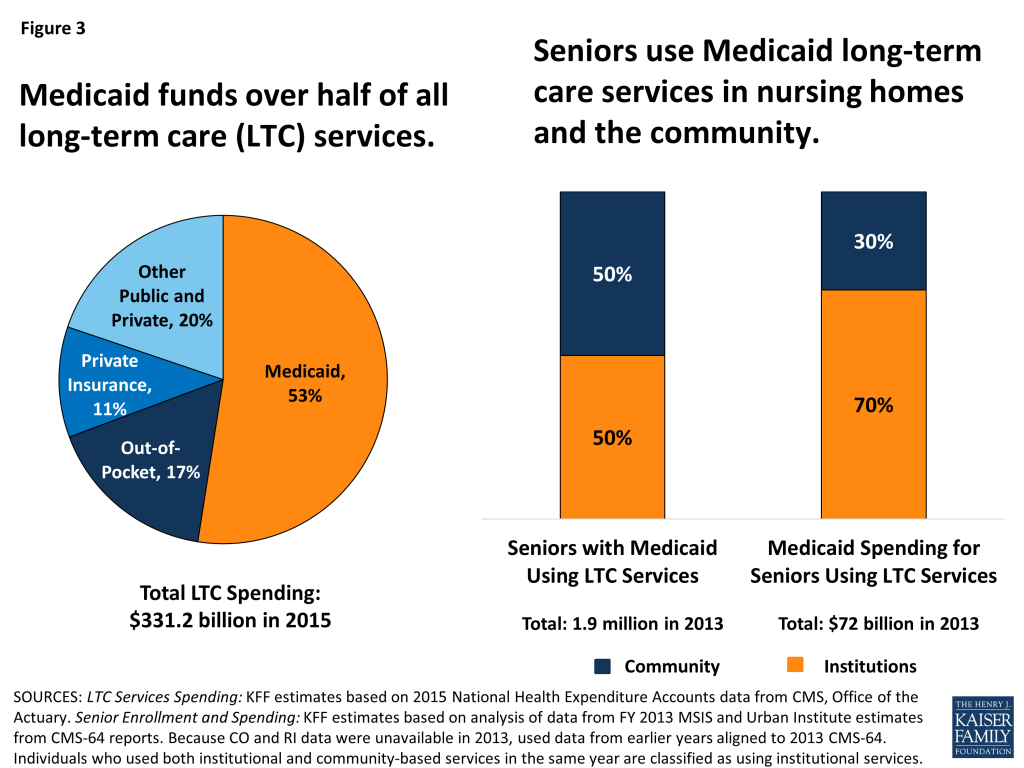
Figure 3: Medicaid funds over half of all long-term care (LTC) services. - Seniors and their family caregivers highlight the importance of Medicaid for meeting their long-term care needs.
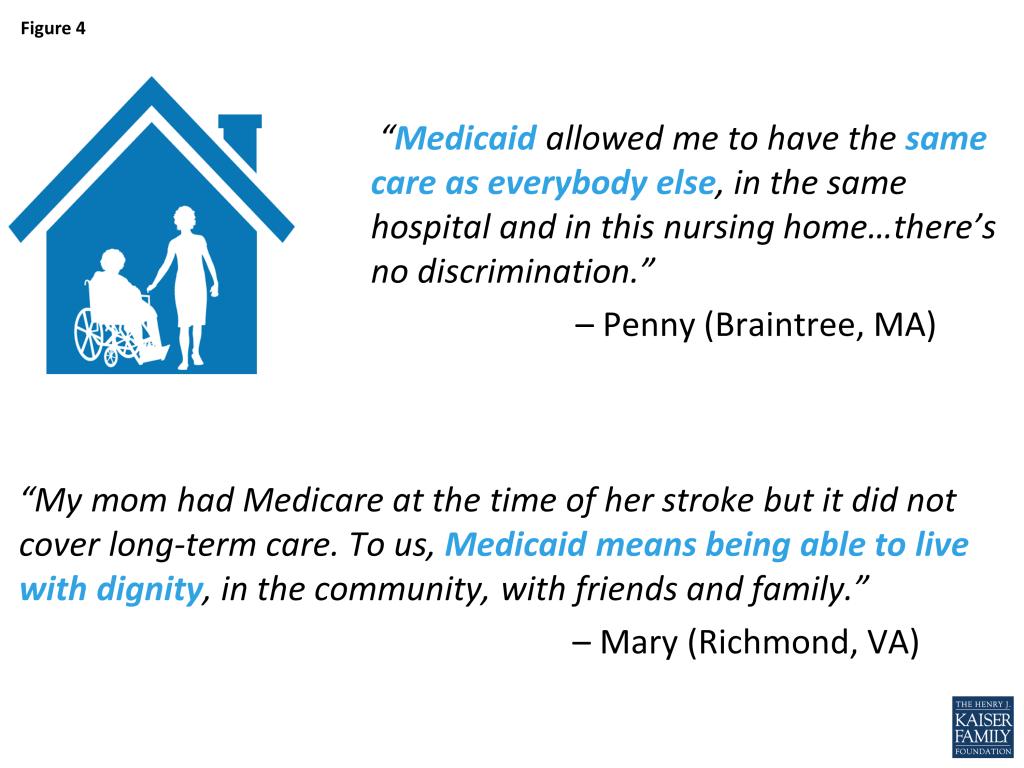
Figure 4 - Medicaid provides benefits for people with disabilities that are often not available or affordable through private coverage.
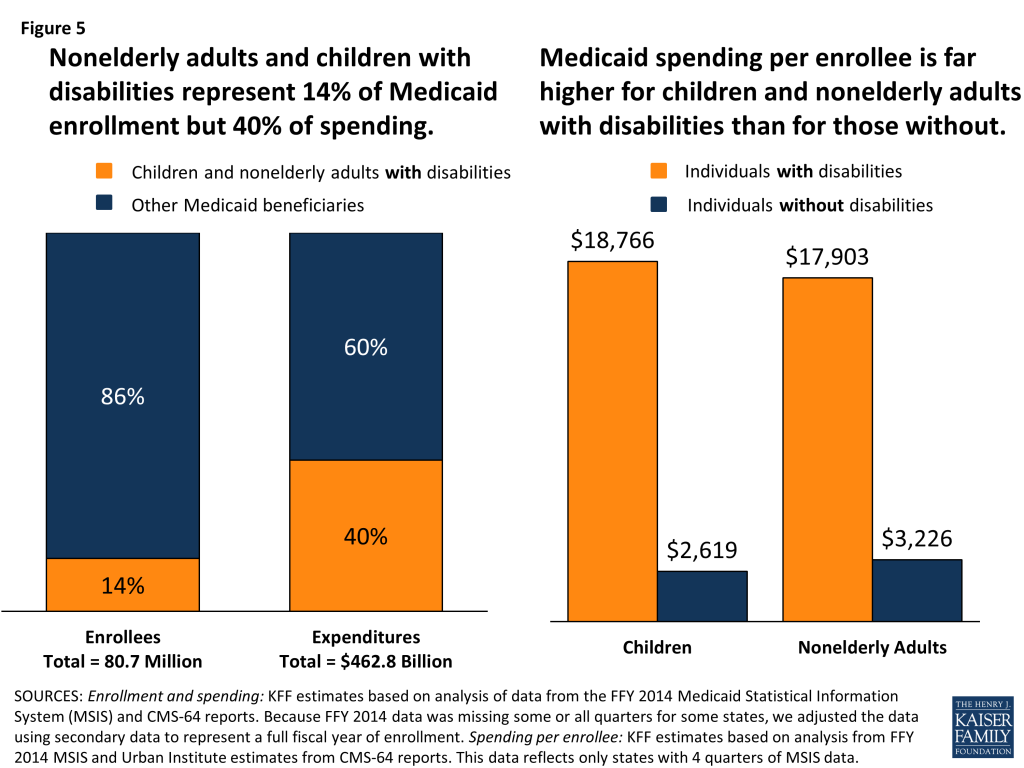
Figure 5: Nonelderly adults and children with disabilities represent 14% of Medicaid enrollment but 40% of spending. - The voices of people with disabilities and their family caregivers highlight Medicaid’s role for children and adults in the community.
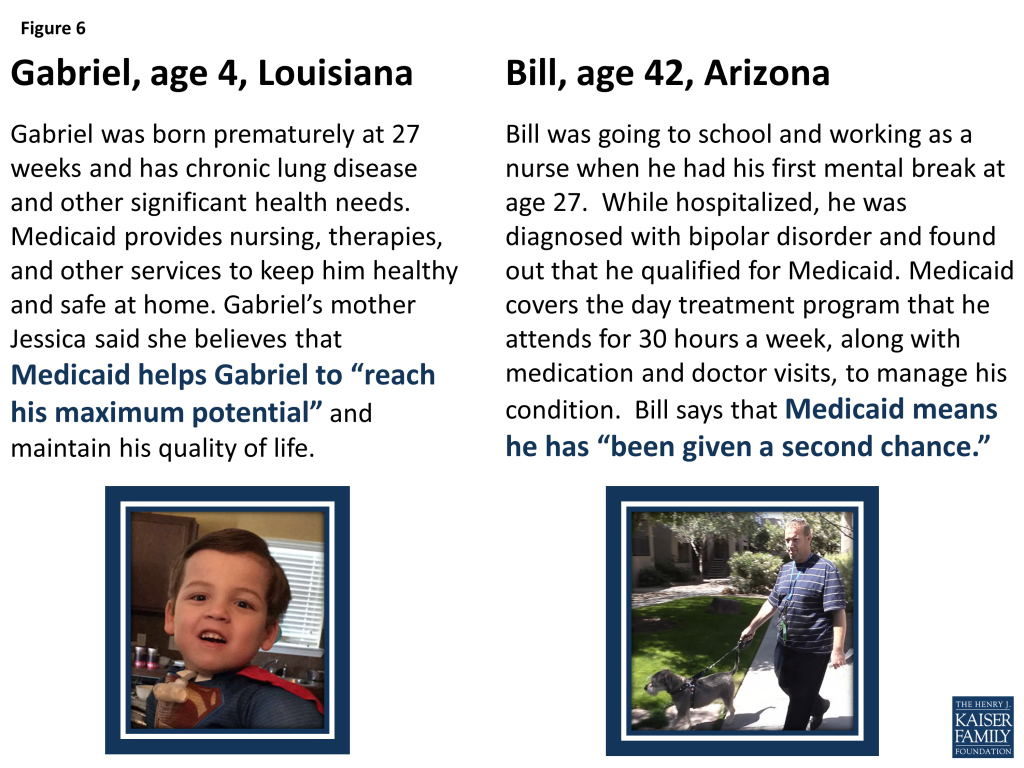
Figure 6 - Medicaid, together with CHIP, has resulted in improved coverage and access to care for children.
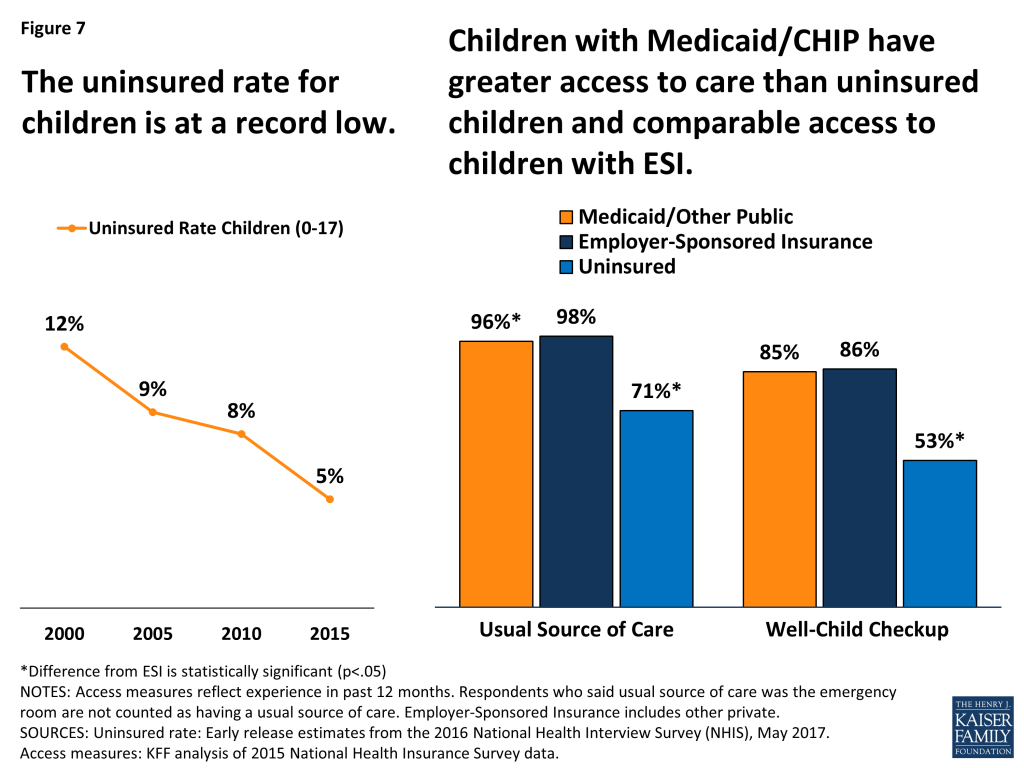
Figure 7: The uninsured rate for children is at a record low. - Parents emphasize the value of having Medicaid for enabling them to afford and access care for their children.
Figure 8 - Thirty-two states have expanded Medicaid coverage for low-income adults with enhanced federal financing.

Figure 9: The Medicaid expansion has led to improvements in coverage, access to and affordability of care, and employment. - Medicaid expansion enrollees highlight how the program supports their ability to work, care for their families, and access needed care.
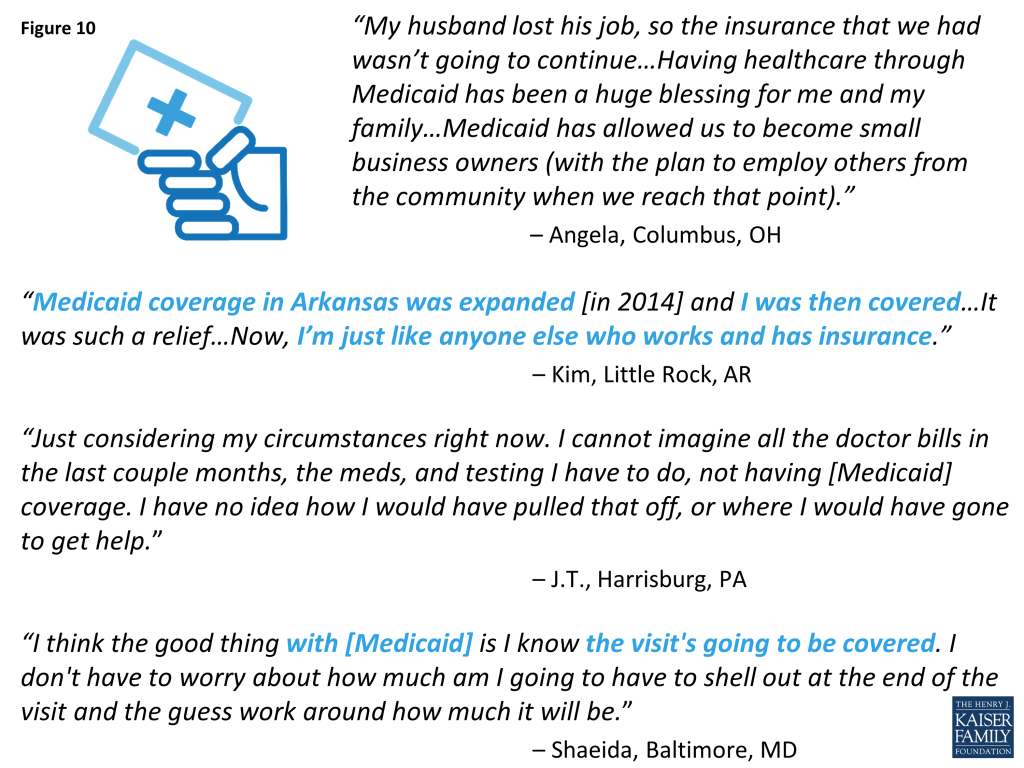
Figure 10 - The American Health Care Act (AHCA) would end the guarantee of federal financing to states and dramatically reduce federal Medicaid financing.
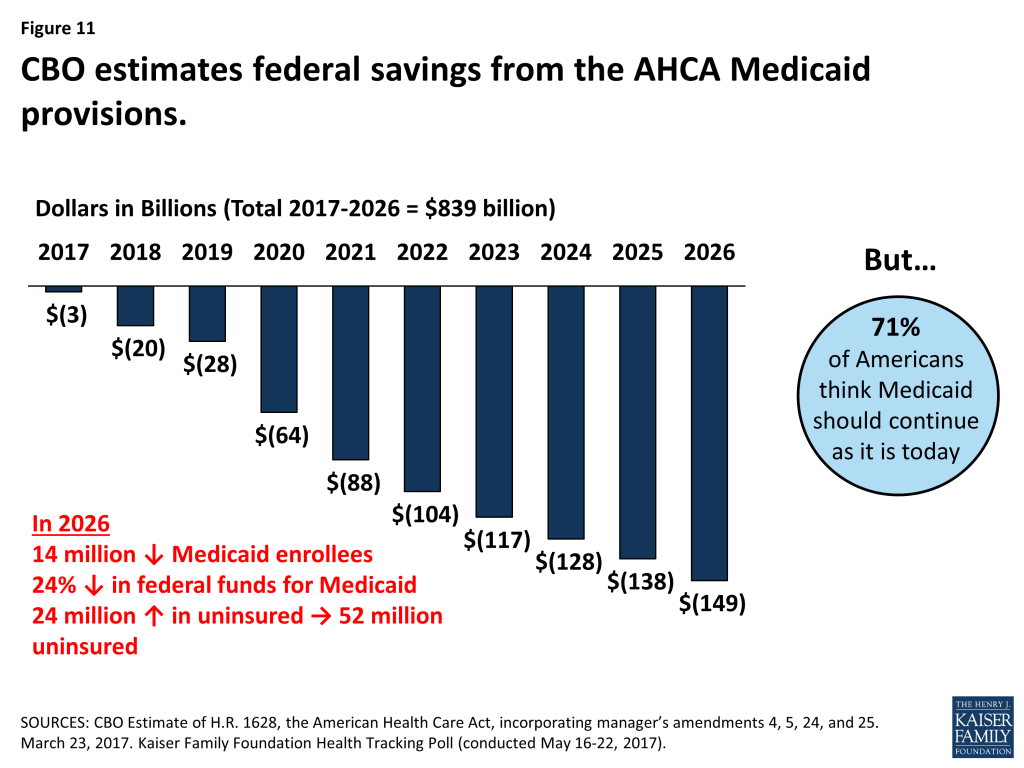
Figure 11: CBO estimates federal savings from the AHCA Medicaid provisions. - A Medicaid per capita cap would lock in state spending and limit states’ ability to respond to changing program needs.

Figure 12: In FY 2014, state full-benefit per enrollee spending by enrollment group varied significantly, especially for high-cost populations - Under a per enrollee cap on federal Medicaid funds, the amount of federal funding is fixed per enrollee. Therefore, states may face incentives to enroll individuals with lower per enrollee costs or may be challenged to finance their programs if a larger share of high-cost individuals enroll.
| Table 1: Average Spending Per Full-Benefit Enrollee by Percentile in Select States, FY 2014 | |||||
| Percentile | Aged in Louisiana | Individuals with Disabilities in Pennsylvania | Adults in Ohio | Adults in Mississippi | Children in Oklahoma |
| 0-25% | $143 | $1,051 | $530 | $1,103 | $131 |
| >25-50% | $1,436 | $10,846 | $2,898 | $3,625 | $735 |
| >50-75% | $16,685 | $17,977 | $4,981 | $4,341 | $1,849 |
| >75-90% | $39,931 | $23,432 | $6,845 | $6,293 | $4,269 |
| >90-95% | $50,036 | $34,642 | $10,492 | $10,147 | $8,186 |
| >95% | $70,173 | $116,515 | $20,143 | $22,205 | $24,571 |
| NOTE: We selected states with spending per enrollee for the given eligibility group that was at or close to the national median.SOURCE: KFF estimates based on analysis of data from the FFY 2014 Medicaid Statistical Information System (MSIS) and Urban Institute estimates from CMS-64 reports. | |||||