Economic and Fiscal Trends in Expansion and Non-Expansion States: What We Know Leading Up to 2014
Executive Summary
Medicaid is the nation’s primary health insurance program for low-income and high-need Americans. Because of the program’s joint federal-state financing structure, Medicaid has a unique role in state budgets because it is both an expenditure item and a source of federal revenue for states. States have significant flexibility within broad federal rules to administer their Medicaid programs. Policy decisions, as well as other factors such as the economy, demographics and state tax capacity are key factors in determining the types and amounts of revenue that states collect as well as how they budget those funds across programs.
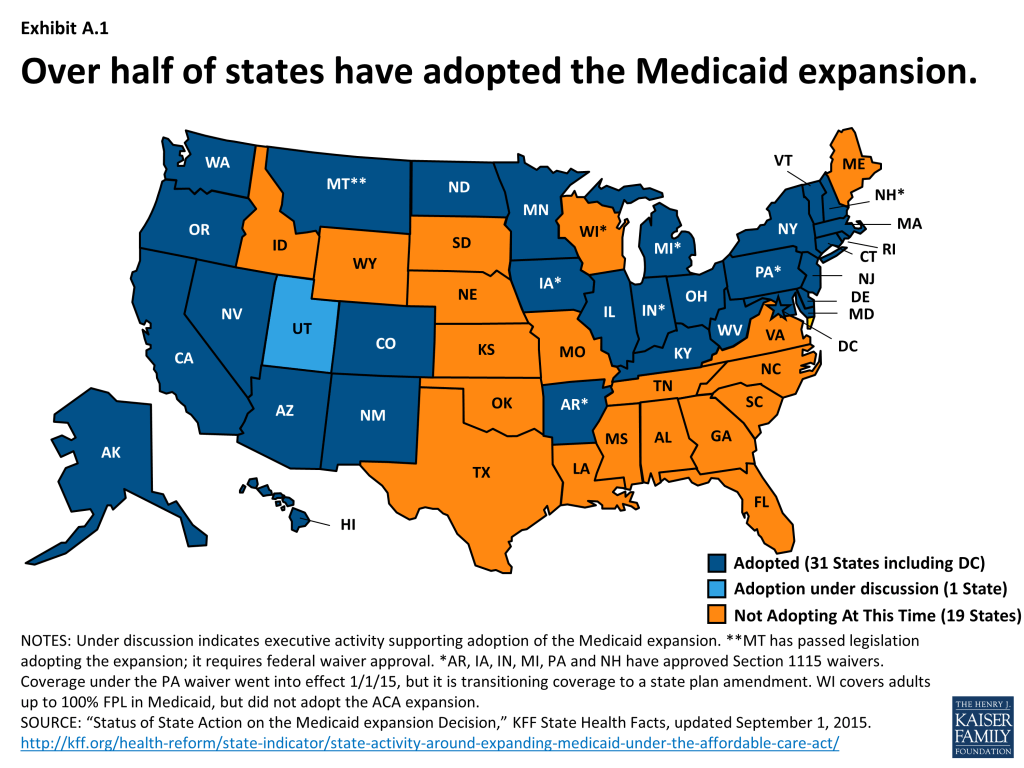
Under the Affordable Care Act (ACA), Medicaid was expanded to nearly all adults with incomes at or below 138 percent FPL. However, the June 2012 Supreme Court decision effectively made the Medicaid expansion optional for states. As of September 1, 2015, 31 states including DC have adopted the Medicaid expansion.1
For those that expand, the federal government pays 100 percent of the Medicaid costs for those newly eligible from January 2014 through December 2016. The federal share then phases down gradually to 90 percent in 2020 and remains at that level thereafter, well above traditional rates. The effects of the Medicaid expansion on state budgets and economies have been key issues for policy makers.
This brief, prepared with the Rockefeller Institute of Government, the public policy research arm of the State University of New York, is designed to provide some insight into the underlying economic and fiscal conditions in expansion and non-expansion states leading up to 2014. Analysis focuses on the typical (i.e. median) state for each group. This analysis will provide a framework against which to measure the impact of expansion decisions going forward. The sections focus on: demographics, tax capacity and revenue, state budgets and employment. Key findings include:
- The typical expansion state was in a better position across the factors analyzed leading up to the ACA Medicaid expansion in 2014.
- Median poverty and uninsured rates were higher in non-expansion states. 2, 3
- Across different measures, the median tax capacity for expansion states has been higher. 4
- Median tax collections per capita have historically been higher in expansion states. 5
- The typical expansion state has historically raised more tax revenue as a share of available resources; the gap between these two groups has increased over time. 6
- The typical expansion state spent more per capita on Medicaid and K-12 education prior to the major ACA coverage expansions. 7
- Health-related employment remained strong during the recession for both groups of states; the typical expansion state has historically had a higher share of employment coming from the health sector. 8
Key Findings: How Do Expansion And Non-expansion States Compare? – Demographics
Introduction
This brief, prepared with the Rockefeller Institute of Government, is designed to provide insight into the underlying economic and fiscal conditions in expansion and non-expansion states leading up to 2014, providing a framework against which to measure the impact of expansion decisions going forward. Each section of this paper presents a series of charts illustrating the key findings between expansion and non-expansion states followed by a summary of the key findings. The sections focus on: demographics, tax capacity and revenue, state budgets and employment. Additional details on the methodology and the variables are included in Appendix A; also included is a summary of the findings is located in the Appendix summary table.
Key Findings
How do Expansion and Non-expansion States Compare? – Demographics
The demographic make-up of a state is a reflection of state fiscal conditions and affects state spending priorities. Several key factors include age, poverty and particularly for looking at expansion vs. non-expansion states, insurance coverage.
Age
- Nationally, children make up nearly a quarter of the population, while the elderly represent almost one-seventh of the population. Since 2000, the growth among children has been relatively flat while growth among the elderly has been increasing at a faster pace. 1
- The typical non-expansion state has a relatively higher share of the population that are children while the typical expansion state has a relatively higher share of the population that are elderly adults. Children as share of the total population is about 4% higher in a typical non-expansion state (25.1% vs. 24.1%) and people over age 65 as share of the total population is about 5% higher in a typical expansion state (14.9% vs. 14.2%). 2
- From 2000 through 2013, both expansion states and non-expansion states have seen declines in the share of the population that are children and increases in the share that are elderly adults. 2
Median Household Income
- Nationally, the real median household income had fallen from its pre-recession peak of over $56,000 to under $52,000 in 2012. Median household income in 2013 was still below pre-recession levels (as well as 2000 levels), but had started to increase slightly since 2012.
- The typical expansion state has historically had a higher real median household income than the typical non-expansion state. 3
- Median household income in 2013 for the typical expansion and non-expansion states was below both pre-recession peaks and 2000 levels. 3
- There is also variation within each group; some non-expansion states (e.g. Virginia and Utah) had some of the highest median household incomes in 2013 while some expansion states (e.g. Arkansas and West Virginia) had some of the lowest median household incomes in 2013. 4
Poverty Rate
- Over the 2000-2013 period, the national poverty rate peaked in 2010 and has since slowly fallen to 14.5% in 2013.
- The typical non-expansion state has historically had a higher poverty rate than the typical expansion state. 5
- There is also variation within each group; three of the highest-poverty states in 2013 were expansion states (Arizona, Kentucky, and New Mexico), while several non-expansion states had very low poverty rates, including South Dakota, Utah, and Virginia. 6
Uninsured Rate
- Prior to the ACA’s major coverage expansions in 2014, over half of all Americans were enrolled in private health insurance (employer and other private coverage), 15.6% were enrolled in Medicaid, 14.7% were enrolled in Medicare and 13.4% were uninsured. 7
- The typical non-expansion state had a higher share of uninsured people prior to the ACA major coverage expansions than the typical expansion state. The number of uninsured people as share of total population was 13.4% in the typical non-expansion state, which is about 17% higher (13.4% vs. 11.5%) compared to the typical expansion state. 8
Key Findings: How Do Expansion And Non-expansion States Compare? – Revenue And Tax Capacity
In debating adoption of the Medicaid expansion, many states have tried to assess the implications for state revenues. For example, some expansion states like Kentucky have noted increased tax revenues since adopting the Medicaid expansion. However, leading up to the implementation of the ACA, expansion and non-expansion states have historical differences across key measures of revenue and tax capacity including tax collections, capacity, and effort. There are also notable differences in the composition of tax revenue sources and tax policy.
Tax Collections
- At a national level, state tax capacity has been increasing since the Great Recession.
- Both groups of states saw declines in real per capital tax collections during the Great Recession; the typical expansion state has recovered faster than the typical non-expansion state. 1
Tax Capacity
- The typical expansion state had greater tax capacity whether measured by personal income, GDP or total taxable resources (TTR) per capita. Tax capacity was about 12% to 16% higher in the median expansion state in 2012, depending on the measure. 2
- There are some exceptions. Wyoming is a non-expansion state that had a higher TTR per capita than any expansion state in 2012 except Alaska, driven by tax revenue potential from oil and minerals. There are some expansion states (West Virginia and Kentucky) which had some of the lowest TTR per capita in this period.
- There has been a widening gap between expansion and non-expansion states in terms of their fiscal capacity. In 2000, the typical expansion state had a TTR per capita 8% higher than the typical non-expansion state ($49,109 vs. $53,070); by 2012, the difference had grown to 16% ($51,805 vs. $60,091). 3
Tax Collections as a Share of Tax Capacity
- The typical expansion state raises much more (25% more) in state and local tax revenue per capita than the typical non-expansion state. 4
- The typical expansion state raises more, even relative to their greater tax capacity; state and local tax revenues as a percent of TTR were about 14% higher in the typical expansion state (7.7% vs. 6.7%). Over time, tax collections as a share of TTR have increased in the typical expansion state (7.3% in 2000 vs. 7.7% in 2012) but decreased in the typical non-expansion state (7.2% in 2000 vs. 6.7% in 2012). 5
Composition of Tax Revenue Sources
- Nationally, 32% of the $1.4 trillion tax revenue collected by state and local governments came from property taxes, followed by general sales taxes (23%) and personal income taxes (22%). Nearly $6 in $10 in tax revenues were collected by state governments; the remainder was collected by localities. 6
- The typical non-expansion state relies much more on relatively regressive general sales taxes (28.8% compared to 18.0% in the typical expansion state.) The typical expansion state relies slightly more on relatively progressive personal income taxes. 7
- There are some exceptions. Non-expansion states like Maine, Virginia, and Wisconsin rely little on sales taxes while expansion states like New Hampshire, Nevada and Washington do not have broad-based income taxes.
Tax Policy Changes
- The analysis of state government legislated tax changes shows that the typical expansion and non-expansion states responded to fiscal challenges created by the Great Recession differently; that the typical expansion state notably raised taxes since fiscal year 2008 while the typical non-expansion state had lowered taxes. 8
Key Findings: How Do Expansion And Non-expansion States Compare? – State Budgets
A significant part of discussions in states over the adoption of the Medicaid expansion has been about state spending priorities. Unlike the federal government, states are generally required to balance their budgets; budgets therefore are a reflection of spending priorities within available resources. Several key factors include total state and local budget spending (spending from all sources – state, federal, and local) as well as spending across categories. Data in this section reflect total spending by state and local governments; this includes federal dollars spent by states and localities as well as spending from state and local sources. In state budgets, Medicaid financing is unique compared to other state spending programs due to the federal matching structure. For those states that adopt the expansion, the share of funding for Medicaid from federal dollars is expected to increase given the higher matching rate for those newly eligible under the Medicaid expansion.
Total State and Local Spending Per Capita
- Spending by state and local governments has slowed in recent years since the Great Recession; direct general expenditures actually declined in 2011 and 2012 compared to the prior year. 1
- The typical expansion state has state and local government spending that is 17% more per-capita than the typical non-expansion state ($8,713 vs. $7,414). 2
- Wyoming and Louisiana are notable exceptions; both are non-expansion states that spent more per-capita than many expansion states. Some expansion states (e.g. Arizona and Nevada) spent notably less than the typical non-expansion state. 3
Distribution Across Spending Categories
- Nationally, state and local governments spent the largest amount (federal, state and local dollars) on a per capita basis for K-12 education, followed by Medicaid-related spending and higher education in FY 2012. 4
- The typical expansion state spent more per capita on Medicaid-related spending (+24%); K-12 education (+18%); police (+20%) and corrections (+11%). 5
- By contrast, the typical non-expansion state spent more per-capita on health and hospitals (+21%), highways (+5%) and higher education (+3%) than the typical expansion state. 5 This may be a reflection of the more rural nature of non-expansion states (hence, higher spending on highways) as well as that non-expansion states have more hospitals owned by state and local governments (leading to higher spending on health and hospitals.) 2
Change in spending on Medicaid, K-12, Health and Hospitals over time
- Medicaid-related spending continued to grow during the Great Recession while spending on health and hospitals slowed and spending through K-12 education declined. 6
- Following the start of the Great Recession, the typical expansion state saw stronger growth in real per capita state-local government spending on Medicaid in comparison to non-expansion states. 7 However, real Medicaid spending per capita declined from 2011-2012, which would have included the end of additional federal matching funds temporarily extended during the Great Recession.3
- Following the start of the Great Recession, both groups saw declines in K-12 spending, though the declines in K-12 spending were much smaller in the typical expansion state. (-0.8% vs. -1.9% on an average annual basis from 2008 to 2012.) 7
Key Findings: How Do Expansion And Non-expansion States Compare? – Employment
Also part of discussions in states over the adoption of the Medicaid expansion has been the effect on employment. State debates have also examined the potential employment gains from the new expansion spending and increased economic activity; early evidence from some expansion states like Kentucky have noted increased employment since adopting the Medicaid Expansion.
Unemployment
- After peaking in 2010 at the height of the economic downturn, the national unemployment rate in 2013 had fallen to 7.4 percent.
- During the Great Recession, both expansion and non-expansion states saw notable increases in the unemployment rate. Unemployment rates have continued to fall for the typical state in both groups since peaking in 2009 or 2010. 1
- There is a notable amount of variation within both groups in terms of the unemployment rate. Expansion states in 2013 had employment rates ranging from 9.5% in Nevada down to 2.9% in North Dakota; Non-expansion states had unemployment rates ranging from 8.7% in Mississippi to 3.8% in South Dakota. 2
Total Employment
- The total number of jobs fell significantly during the economic downturn; while employment had increased in the years leading up to the major ACA coverage expansions, total nonfarm employment had yet to return to pre-Recession levels.
Health-Related Employment
- As total employment levels declined in response to the Great Recession, employment in health and related fields remained strong. 3
- As a result, health-related employment has increased as a share of total employment over time, particularly since the Great Recession. 4
- Health-related employment in the typical expansion state has historically been higher than in the typical non-expansion state. 5
- All states saw strong growth in health-related employment from 2000 through 2013; however growth in this sector slowed for both groups in 2008-2013 compared to the earlier period (2000 to 2007). 6
Appendices: Appendix A – Methodology And Definitions
This analysis focused a series of demographic, fiscal, budget and employment indicators available publicly from the Bureau of Labor Statistics, the Census Bureau, and Department of Treasury, and the Bureau of Economic Analysis. Additional information about the variables included follows. The analysis focused on differences between expansion and non-expansion states over the period from 2000 through 2013 expect for a few sources where the latest available data was for 2012. Analysis of data from the Census Survey of Government Finances, which includes state and local revenue as well as direct general expenditures regardless of fund source (state, local or federal4 ), examines the period from 2004 to 2012; the US Census did not conduct the survey for local governments for 2001 and 2003. Included as expansion states for this analysis were the 31 states that had adopted the Medicaid expansion as of July 2015; however, the District of Columbia is frequently excluded from median calculations in this analysis as it is not consistently included in all data sources. Non-expansion states include the 19 states that have not adopted the expansion at this time as well as Utah where adoption of the expansion is currently under discussion.(Exhibit A.1) To examine differences between these groups, this analysis focuses on the typical expansion state and the typical non-expansion state, which is defined as the median value for each group. Additionally, all monetary values have been converted to real 2013 dollars to control for inflationary changes.
Demographics
Age. State spending priorities are affected by the types of populations they serve. For example, states with higher shares of older populations face higher demands for long term care services, which may lead to higher Medicaid spending as Medicaid is the largest purchaser of long term care services. In contrast, states with higher shares of children may face higher demands for education services.
Median Household Income. Household income, which is a measure of all income from those age 15 and older living in the same household, is a common measure of relative wealth of state residents.
Poverty Rates. Many government assistance programs are targeted to help low-income families. Programs administered or supported by the United States Department of Health and Human Services (HHS) use the department’s federal poverty guidelines. The federal poverty guideline for a family of three in the 48 contiguous states and the District of Columbia was $19,530 in 2013.
Health Insurance. The existing status of health insurance coverage and the number of uninsured have been commonly discussed as factors in a state’s decision to adopt the Medicaid expansion. Coverage varied across states due to the availability of employer-based coverage, the scope of public coverage, regulations in the non-group market, poverty rates, and demographics. The share of the population that is uninsured highlights the gap among different coverage options.
Tax Collections and Revenue
Tax Collections. How much tax revenue is collected determines the size of state budgets that lawmakers must then allocate to different spending priorities. A number of factors play into how much is collected – the state tax capacity (how much state and local governments could potentially collect), the composition of state and local taxes (e.g. general sales taxes, property taxes, etc.) and tax policy changes lawmakers elect to make.
Tax Capacity. A state’s tax capacity refers to the potential amount state and local governments could collect through taxes. There are several measures of tax capacity, such as personal income, a state’s gross domestic product as well as a lesser known measure of a state’s total taxable resources – a measure developed by the Treasury Department that addresses concerns with the incompleteness of other measures.
Tax Effort/Tax Collections as a Share of Capacity. Tax capacity is just one factor in determining how much tax revenue states and local governments collect. How much states and localities collect as a share of their potential is a measure of tax effort. Tax collections alone only illustrate the amount the state was able to collect; collections as a share of their capacity controls for the fact that some states are able to potentially collect more.
Composition of Tax Revenue Sources. State and local governments draw their tax revenues from different sources. The most common sources of tax revenue are property taxes, general sales taxes, personal income taxes, corporate income taxes and selective sales taxes (e.g. alcohol and tobacco.) Tax revenues are also separately collected by state and local governments.
Tax Policy Changes. Another factor in determining the amount of revenue that states collect relates to state lawmaker decisions on tax policy. As with determining spending priorities, state lawmakers also determine the tax rates and types of taxes enacted in a state.
State Budgets and Spending
Total State Budget Spending. Data in this section reflect total spending by state and local governments; this includes federal dollars spent by states and localities as well as spending from state and local sources.
Spending categories. This analysis focuses on the following categories of spending:
- Medicaid-related spending: Refers to medical vendor payments according to Census definitions for their annual survey of state and local government finances. This does not include all Medicaid spending, but refers to payments under public welfare programs made directly to private vendors for medical assistance and hospital or health care on behalf of low-income or other medically needy persons. It captures most, but not all, Medicaid spending.
- Health and Hospitals: Refers to spending related to public health programs and other activities (e.g. public health administration, vita statistics, etc.) as well as support for public or private hospitals outside of public welfare programs (e.g. Medicaid). It can include construction costs of hospitals as well.
- K-12 Education: Refers to spending for operation, maintenance and construction of public schools and facilities for elementary and secondary education, including vocational-technical education.
Employment
Employment. Employment, or the number of jobs, is a strong indicator of economic conditions. This analysis focused on total non-farm employment, which includes private sector and government employment.
Unemployment. Unemployment is also a strong indicator of economic conditions. The unemployment rate is measure of the share of the labor force who are not employed; individuals who are no longer looking for work or those under the age of 16 are not counted as part of the labor force and are excluded from such calculations.
Health-Related Employment. Employment in the health and social assistance sectors as defined by the NAICS definition. This includes jobs in ambulatory health care (physician office, dental offices, etc.) outpatient care centers, medial and diagnostic laboratories, hospitals, home health care, nursing facilities and among others.
Appendices: Appendix Summary Table
| Expansion | Non-expansion | |
Demographics | ||
| Age | Higher Median Share of the Total Population that are Elderly Adults. Shares of the population for children are declining and growing for the elderly for both groups. | Higher Median Share of the Total Population that are Children. Shares of the population for children are declining and growing for the elderly for both groups. |
| Median Household Income | Higher Real Median Household Income. | Lower Real Median Household Income. |
| Poverty Rate | Lower Median Poverty Level. | Higher Median Poverty Level. |
| Health Insurance | Lower Median Uninsured Rate. | Higher Median Uninsured Rate. |
Revenue and Tax Capacity | ||
| Tax Collections | Faster Recovery since the Great Recession. | Slower Recovery since the Great Recession. |
| Tax Capacity | Higher Median Level of Tax Capacity, Regardless of Measure. Median Level of Tax Capacity has been Increasing at a Faster Rate over Time. | Lower Median Level of Tax Capacity, Regardless of Measure. Median Level of Tax Capacity has been Increasing at a Slower Rate over Time. |
| Tax Effort(Collections as a Share of Capacity) | Median Collections per Capita is higher. Median Tax Collections as a Share of Tax Capacity is Higher and has been Increasing on Average. | Median Collections per Capita is lower. Median Tax Collections as a Share of Tax Capacity is Lower and has been Decreasing on Average. |
| Composition of Tax Revenue Sources | Typical State relies more on Personal Income Taxes. | Typical State relies more on General Sales Taxes. |
| Tax Policy Changes | State lawmakers have acted to raise taxes in a number of years since 2008. | State lawmakers have acted to cut taxes in a number of years since 2008. |
State Budgets | ||
| Total State and Local Budget Spending | Higher Median Total Budget Spending per capita. | Lower Median Total Budget Spending per capita. |
| Distribution Across Spending Categories | Higher Median Spending per capita levels on Medicaid, K-12 Education, Police and Corrections. | Higher Median Spending per capita levels for Health and Hospitals, Highways and Higher Education. |
| Change in Spending Across programs | Stronger Growth in Median Spending per capita for Medicaid post-recession. Smaller Decline in Median Spending per capita for K-12 Education post-recession. | Weaker Growth in Median Spending per capita for Medicaid post-recession. Larger Decline in Median Spending per capita for K-12 Education post-recession. |
Employment | ||
| Unemployment | Median Unemployment Rate has Declined in Recent Years. | Median Unemployment Rate has Declined in Recent Years. |
| Health Sector Employment | Health-related Employment is a Higher Share of Total Employment. Strong growth in health-related employment for both groups; growth slowed in 2008-2013. | Health-related Employment is a Lower Share of Total Employment. Strong growth in health-related employment for both groups; growth slowed in 2008-2013. |
Endnotes
- Status of State Action on the Medicaid Expansion Decision, update July 20, 2015. Kaiser Family Foundation, State Health Facts. https://modern.kff.org/health-reform/state-indicator/state-activity-around-expanding-medicaid-under-the-affordable-care-act/. ↩︎
- Over a quarter of hospitals in Non-expansion states were owned by state and local governments in 2013 compared to 16% of hospitals in Expansion states. Hospitals by Ownership Type, 2013. Kaiser Family Foundation, State Health Facts. https://modern.kff.org/other/state-indicator/hospitals-by-ownership/# Additionally, the higher spending per capita for higher education in the typical non-expansion state may be due, in part, to the fact that most expansion states are industrialized, urbanized, northeastern states which have extensive network of private higher education institutions. Therefore, these states may be outliers when it comes to higher education because they don’t spend as much per capita due to existence of large number of private higher education institutions. ↩︎
- The American Recovery and Reinvestment Act (ARRA) provided states with enhanced Medicaid matching rates between October 2008 and June 2011. This enhanced match provided states with $103 billion over the 11 quarters it was in effect. This allowed for state spending on the program to fall; the only two years in the history of Medicaid when annual state funds spending decreased. Miller, Vic, Andy Schneider, Laura Snyder and Robin Rudowitz. Impact of the Medicaid Fiscal Relief Provisions in the American Recovery and Reinvestment Act (ARRA). Kaiser Commission on Medicaid and the Uninsured, October 2011. https://modern.kff.org/medicaid/issue-brief/impact-of-the-medicaid-fiscal-relief-provisions/. Smith, Vern et al. Medicaid in a Historic Time of Transformation: Results from a 50-State Medicaid Budget Survey for State Fiscal Years 2013 and 2014. Kaiser Commission on Medicaid and the Uninsured, October 2014. https://modern.kff.org/medicaid/report/medicaid-budget-survey-archives/. ↩︎
- Direct expenditures spent on medical vendor payments (E74) may include funds spent from any kind of source the state or local government has available to use for. State and local government expenditures data in this survey are collected by function and do not distinguish if the source of funds used was coming from a federal, state or local fund. It may be possible that state and local governments are using federal receipts also to fund medical vendor payments which are not reflected in these expenditure statistics.nEmail correspondence with officials at the Census Bureau, June 2015. ↩︎