Snapshots: Employer Health Insurance Costs and Worker Compensation
Health insurance premiums have increased rapidly over the recent past, growing a cumulative 138% between 1999 and 2010 and outpacing cumulative wage growth of 42% over the same period.1 These figures, which have been widely cited to demonstrate the growing burden of health insurance costs on employers and employees, illustrate overall trends in health benefit costs, but they do not show how this growing burden is affecting employers and employees in different settings. To address this issue, this analysis shows employer costs for payroll and health benefits over an eleven-year period for workers in different occupations and at different establishment sizes.
Our analysis focuses on employer costs for health insurance for workers with access to health benefits and updates our earlier snapshot published in 2008. Employer costs for health insurance increased significantly as a percentage of payroll between 1999 and 2010, and varied meaningfully across the workforce when viewed as cost per hour worked or as a percentage of payroll. Employer costs per hour for health insurance were higher for workers in higher wage occupations than for workers in lower wage occupations, likely because more highly compensated employees want relatively generous health benefits at work and because existing tax subsidies favor those employees.2 Viewed as a percentage of payroll, however, employer costs for health benefits are greater for workers in lower wage occupations than for workers in high wage occupations. This means that workers in lower wage occupations on average get relatively less in employer contributions measured in cost per hour worked, but that what they get represents a relatively higher share of their payroll.
This information can be used by policy makers trying to understand the affordability of employer-sponsored coverage. By showing the large variation in health benefit costs across establishments and occupations, this information helps policy makers better understand the issues facing different types of businesses and workers. We show that employer costs as percentage of payroll vary significantly across workers and settings, highlighting the challenge facing policy makers trying to encourage and provide support for the offering by employers and acceptance by employees of affordable coverage in the workplace.
Our analysis is based on data from the National Compensation Survey (NCS), which is a nationwide survey of labor costs in private and public establishments conducted quarterly by the Bureau of Labor Statistics (BLS).3 Information is provided on employer costs for health insurance for employees with access to health benefits through their employer. Details about the NCS and our analysis are available in a methodological appendix at the end of this analysis, although several facts should be highlighted upfront. First, the data reflect employer costs for health insurance and do not include additional amounts that employees might contribute toward the costs of their coverage. Second, employer costs are affected by enrollment in, and in some cases by eligibility for, health benefits offered by employers. For example, employers may impose a waiting period before newly hired employees are eligible to enroll for health benefits, but these employees are treated as having access to health benefits in the data because most similar workers would be eligible after some period of tenure with the firm.
Definitions of key terms:
|
Employer Costs for Health Insurance
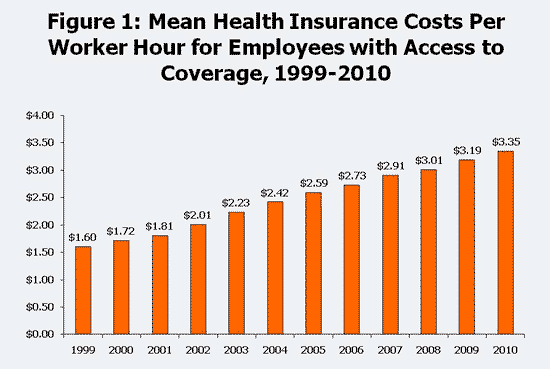
Among workers with access to health benefits, average employer costs for health insurance per employee hour rose from $1.60 to $3.35 during the 1999 to 2010 period (Figure 1). This almost 110% increase in average costs per hour is much larger than the 39% increase in average employer payroll costs per hour for these workers.
| Source: Kaiser Family Foundation calculations based on data from the National Compensation Survey, 1999-2010, conducted by the Bureau of Labor Statistics. |
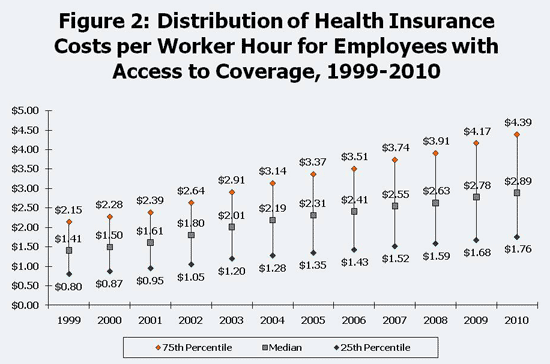
Employer hourly costs varied significantly across workers in each of the years (Figure 2). Looking at 2010 for example, the difference between employer costs at the 25th percentile ($1.76) and 75th percentile ($4.39) was just over $2.50 per hour. These costs per hour may vary for a number of reasons, including: differences across plans in benefits and cost sharing, differences in premium shares borne by employers, differences in the demographic characteristics of workers in sampled establishments (e.g., average age, health status), differences in employee and dependent participation in health benefits, and geographic differences in the costs of health care. For example, workers may have relatively higher employer costs per hour for health insurance because they receive generous benefits, they have an employer that pays a large share of the premium, or they work for an employer with an older workforce or located in an area with relatively expensive costs for health care and/or other goods.
| Source: Kaiser Family Foundation calculations based on data from the National Compensation Survey, 1999-2010, conducted by the Bureau of Labor Statistics. |
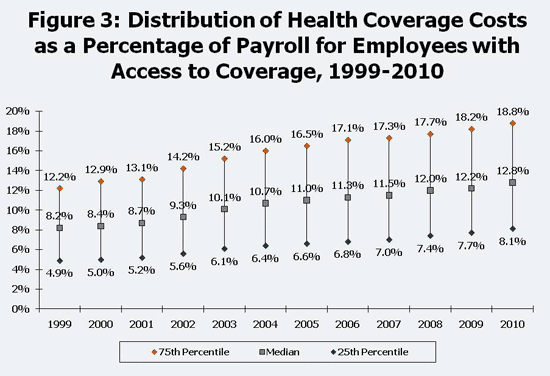
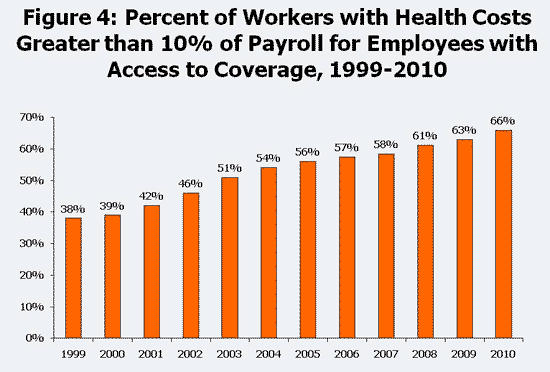
Employer costs for health insurance viewed as a percentage of payroll also showed significant variation (Figure 3). In 2010, the median employer cost was 12.8% of payroll, but 25% of workers with access to health benefits had employer costs for health insurance that were equal to or less than 8.1% of their payroll costs and another 25% had employer costs for health insurance that were equal to or exceeded 18.8% of their payroll costs. Overall, the percentage of workers in jobs where employer costs for health insurance exceeded 10% of payroll rose from 38% to 66% between 1999 and 2010 (Figure 4).
| Source: Kaiser Family Foundation calculations based on data from the National Compensation Survey, 1999-2010, conducted by the Bureau of Labor Statistics. |
| Source: Kaiser Family Foundation calculations based on data from the National Compensation Survey, 1999-2010, conducted by the Bureau of Labor Statistics. |
Figures 3 and 4 help to demonstrate the difficulty of summarizing employer costs for health benefits in simple terms. The wide variation in employer costs, both in costs per hour and as a percentage of payroll, suggests that arguments and policy proposals based on “average costs” may be misleading because there is not a typical or common contribution level or percentage of payroll for health care that relates to most jobs.4 Further, the steady increase over time throughout the distributions for costs per hour and percentage or payroll shows the importance of using current information to analyze affordability and other cost issues related to work-based coverage.
Employer Health Costs by Establishment Size
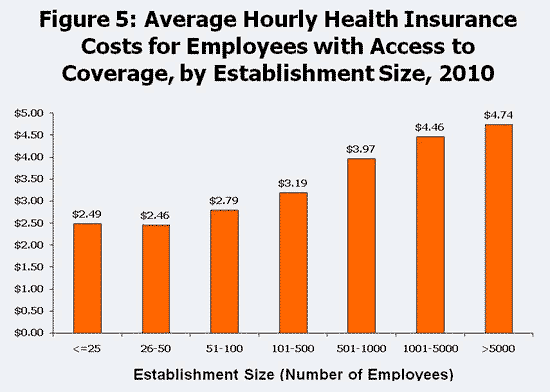
In 2010, average employer costs per worker hour for health insurance generally rose with establishment size (Figure 5). This pattern may indicate that benefits are more generous in larger establishments, which would be consistent with the overall higher average levels of compensation in large establishments.5 Participation by employees and dependents in health benefit offerings may also be higher in large establishments. Results from the Kaiser/HRET Annual Employer Health Benefits Survey show that the percentage of workers covered by their firm who elect family coverage (rather than single coverage) rises with firm size.6 Employer costs for a family policy are usually larger than for single coverage.
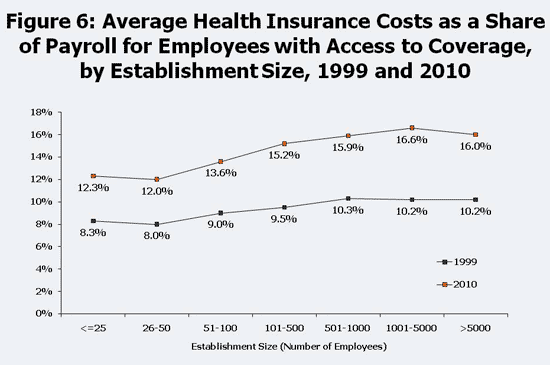
Between 1999 and 2010, employer costs for health insurance increased as a percentage of payroll for all establishment sizes, with increases ranging from 4 to about 6.5 percentage points (Figure 6). While costs as a percentage of payroll generally were higher at larger establishments than for smaller ones, there were some exceptions to the pattern and the differences are not as large as those for costs per hour (Figure 5). An important factor here is that compensation other than health insurance also tends to rise with establishment size.7 So, while employer costs per hour for health insurance were higher for larger establishments, so were their other costs, making the relationship between the two less straightforward.
| Source: Kaiser Family Foundation calculations based on data from the National Compensation Survey, 2010, conducted by the Bureau of Labor Statistics. |
| Source: Kaiser Family Foundation calculations based on data from the National Compensation Survey, 1999 and 2010, conducted by the Bureau of Labor Statistics. |
Employer Health Costs by Occupation
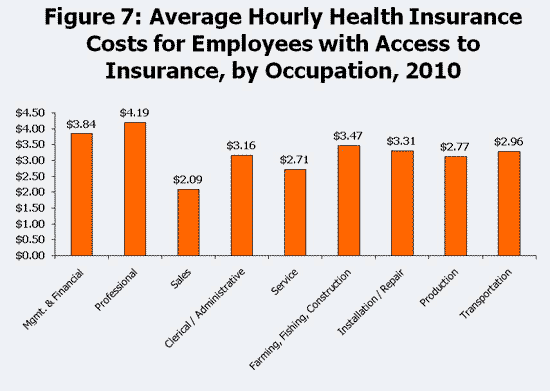
Average employer costs for health insurance varied in 2010 from $2.09 per hour for workers in sales-related occupations to $3.16 for clerical / office support staff and $4.19 for professionals (Figure 7). As discussed above, these differences may be driven by a number of factors, including benefit generosity and differences in benefit participation by workers and dependents.
| Source: Kaiser Family Foundation calculations based on data from the National Compensation Survey, 2010, conducted by the Bureau of Labor Statistics. |
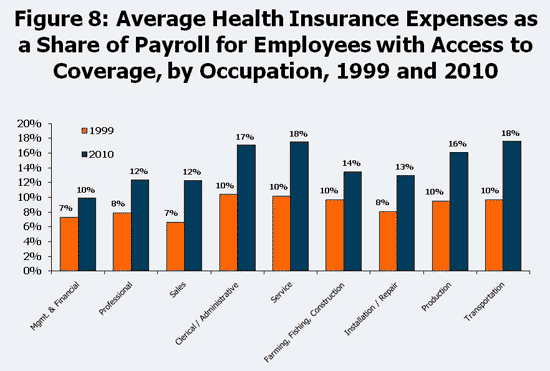
Figure 8 shows, for both 1999 and 2010, average health insurance costs as a percentage of payroll costs by occupation. It is worth noting that although technical and professional occupations had some of the highest health costs per hour (Figure 7), as a share of payroll their costs were relatively low, reflecting the relatively higher wages in these jobs. For service and laborer/cleaner/helper occupations, the levels of costs were relatively low, but comparatively high as a percentage of payroll. Looking at the change over the 1999 to 2010 period, health costs increased relative to payroll for all occupations. However, the size of this change was largest for those with health costs that were large relative to payroll, such as transportation, production, service, and clerical/administrative support occupations.
| Source: Kaiser Family Foundation calculations based on data from the National Compensation Survey, 1999 and 2010, conducted by the Bureau of Labor Statistics. |
Discussion
The data presented in this paper explore the much-noted increase in health care costs as it relates to worker compensation. Although rising health costs have affected all employers and employees with health benefits, there is still a relatively wide range of cost exposure over time and by occupation and establishment size. Health insurance costs for employees in lower paid occupations were smaller in hourly dollar amounts, but made up a larger percentage of payroll due to their lower average earnings. Larger establishments had greater health benefit costs, both on an hourly basis and relative to payroll costs, even though their payroll costs were greater.
The charts above show the significant differences in employer costs for health benefits across establishment size, wage levels and industries, and demonstrate the difficulty in capturing this information by referring to average or typical levels of costs.Policy makers concerned with developing policies to support employer-sponsored coverage and improve its availability and affordability should be mindful of the significant variation in the marketplace today. One thing that employers share, however, is the impact of rising health care costs, where increases across all levels of the distributions show that employers and employees in every circumstance are affected by rising costs.
| This paper was prepared by Gary Claxton and Anthony Damico of the Kaiser Family Foundation’s Health Care Marketplace Project, and is an update to an analysis originally published in 2008. Paul Jacobs, who formerly worked for the Foundation, helped to prepare the prior version. The Kaiser Family Foundation gratefully acknowledges assistance provided by Michael Lettau, Ph.D. of the Office of Compensation and Working Conditions at the Bureau of Labor Statistics in accessing, analyzing, and understanding the Employment Cost Index data. |
Methodological Appendix
The Employment Cost Index (ECI) is a nationwide survey of labor costs in private and public establishments conducted quarterly by the Bureau of Labor Statistics (BLS). The ECI was developed in the mid-1970s to track changes in the costs of employment. Later modifications added data about health and other fringe benefits. Since about 2003, the ECI sample was merged with a broader group of surveys on employer benefits and payroll costs collectively referred to as the National Compensation Survey (NCS).8
ECI/NCS data are constructed by first choosing establishments in private industry and in state and local governments in the 50 states and the District of Columbia. Federal government, agriculture, and private household establishments are excluded from the sample. Then the survey collects information about the costs of employment for up to eight job classifications in each establishment that is surveyed. The data are collected for job classifications, rather than for individual workers, so that continuity within establishments may be maintained over time as individual workers enter and exit the establishment. Jobs are sampled proportional to their prevalence at the establishment. For instance, in a plant which produces coal, separate wage and benefits costs for miners, engineers, and truck drivers may be obtained by the survey, whereas other jobs with fewer employees, such as for accountants and crane operators, may be excluded. The data we use are nevertheless representative of all workers in the United States as of June of each calendar year. The exhibits and calculations are presented on a per-worker-hour basis and include all employees in sampled jobs where health benefits are available, including those that are seasonal, part-time, or temporary. We use data each year from 1999 to 2010.
The data reflect contributions by employers for the cost of health insurance and do not include amounts that employees are required to contribute for their share of the premiums. Thus, the costs shown above do not comprise the full costs of health coverage for employees, and readers should be mindful of this factor when interpreting results. For example, occupations where employers tend to pay a higher share of the total premium cost would have higher employer costs per hour than occupations with lower employer shares, even if benefits levels (e.g., deductibles) and other factors did not differ across the occupations. Readers also should be aware that employer costs for benefits in a job classification are averaged over all of the workers in that job classification, even if workers do not participate in the benefit. As examples, employees offered health benefits may choose not to take them up and new employees may face an exclusion period before they are eligible for benefits from the employer. Thus, differences in employer costs across job classifications or over time may to some extent reflect different participation rates for workers and their dependents.
Hourly costs for payroll and health insurance are provided by the Bureau of Labor Statistics and we used these estimates because they adjust for differences in the number of hours worked annually among employees. Hourly cost of payroll was calculated by combining hourly costs for wages, overtime, vacation pay, sick pay, as well as bonuses and other paid leave. Because the data are collected from establishments, not firms, firm-level characteristics, e.g. firm size, are not available. The paper avoids the use of the term firm, although it uses the terms “employer” and “establishment” synonymously although they may not be equal.
The BLS provides survey weights which enable the researcher to calculate statistics which are representative of workers in the United States in a given year. An adjustment to these weights was made to correct for changes in the composition of industries and occupations in the United States over time. This adjustment allows for a more accurate comparison of figures over time, but only very marginally affected the results presented in this paper.
BLS researchers impute missing data for hourly values when respondents do not provide sufficient data to calculate them. 5.9 percent of observations were missing a response to the question of whether health insurance was offered to workers holding that particular job. Rather than impute a value for these observations, for all statistics, these observations were excluded from our sample.
The Kaiser Family Foundation obtained access to the ECI/NCS through an agreement with the BLS. All analyses were performed on site at the BLS headquarters in Washington D.C. from August to October of 2010 by Kaiser Family Foundation staff.
Notes:
1. Kaiser Family Foundation/Health Research and Educational Trust, Employer Health Benefits 2010 Annual Survey. Available online at: http://ehbs.kff.org/.
2. Kaiser Family Foundation, “Tax Subsidies for Health Insurance,” July 2008. Available online at: https://www.kff.org/health-costs/issue-brief/tax-subsidies-for-health-insurance/.
3. As part of the National Compensation Survey, the Bureau of Labor Statistics collects these data quarterly to develop the Employment Cost Index (ECI) which is designed to measure changes in compensation costs for the civilian workforce. Other details on how the statistics were derived from the ECI data are reported in the Methodological Appendix at the back of this report.
4. Variation at the employer level is somewhat different than the worker-level variation in costs shown here (because many employers have multiple job classifications that may “average-out” some of the worker-level variation). For an establishment-level analysis of health costs using the NCS data, see: Christine Eibner, Kanika Kapur, and M. Susan Marquis, “Employer Health Insurance Costs in the United States,” California HealthCare Foundation, July 2007, available online at: http://www.chcf.org/documents/insurance/EmployerHICostsUS.pdf.
5. In our sample of workers with access to health benefits in 2010, the mean hourly rate of payroll was $23.22 for establishments with less than 25 employees and $37.21 for those with more than 5000 employees. These mean compensation rates grew more or less steadily as establishment size increased.
6. About 30% of workers in firms with 3-199 employees enrolled in family coverage, while about 36% of workers in firms with 200 or more employees did the same. Kaiser Family Foundation/Health Research and Educational Trust, Employer Health Benefits 2010 Annual Survey.
7. See, e.g., Julia I. Lane, Laurie A. Salmon, and James R. Spletzer, “Establishment wage differentials,”Monthly Labor Review, April 2007. Available online at: http://www.bls.gov/opub/mlr/2007/04/art1abs.htm.
8. More information about the ECI and the NCS is available online at: http://www.bls.gov/ncs/home.htm.

