Visualizing Health Policy: What Americans Pay for Health Insurance Under the ACA
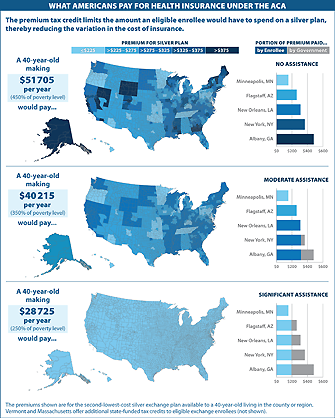
The March 2014 Visualizing Health Policy infographic shows examples of what Americans will pay for health insurance under the Affordable Care Act, using different scenarios for 40-year-old individuals living in different parts of the country.
Visualizing Health Policy is a monthly infographic series produced in partnership with the Journal of the American Medical Association (JAMA). The full-size infographic is freely available on JAMA’s website and is published in the print edition of the journal.