Trends in Medicaid Spending Leading up to ACA Implementation
Executive Summary
In the years leading up to the Affordable Care Act (ACA), Medicaid programs were influenced by several factors, including enrollment growth related to the Great Recession, fiscal pressures and changes in program financing, and preparation and early implementation of some ACA provisions. This paper presents data on Medicaid spending during the period of these changes, the first half of which we refer to as the “recessionary period”, and the second half of which we refer to as the “post-recessionary period”. We use administrative data to first examine overall spending trends and trends by service type. We then draw on additional data to analyze per enrollee spending growth during this period, both by service type and by eligibility group, to understand what drove Medicaid spending. Key findings include:
- Overall, spending on medical services in Medicaid increased by an average annual rate of 5.7 percent over the 2007-2013 period, with average annual spending growth higher during the recessionary period (6.9 percent from 2007-2010) and slowing during the post-recessionary period (4.4 percent from 2010-2013).
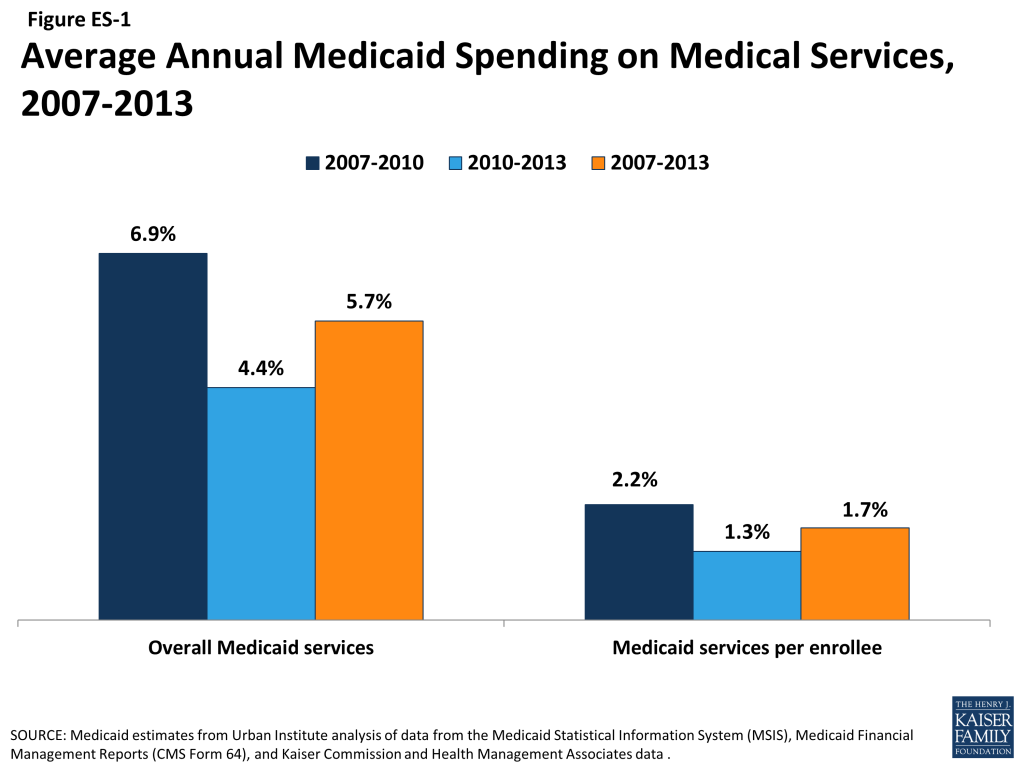
- Overall Medicaid spending is a function of both the number of people served by the program and what the program spends for each person enrolled. On a per enrollee basis, Medicaid spending growth grew by an average annual rate of just 1.7 percent between 2007 and 2013. During the recessionary period, 2007 to 2010 (when overall spending growth was nearly 7 percent), per enrollee spending grew by just 2.2 percent. Average annual growth per enrollee fell to 1.3 percent from 2010 to 2013.
- Enrollment growth among families was a major driver of Medicaid spending growth during the recession. While enrollment among families grew by 7.2 percent a year from 2007 to 2010, spending per enrollee grew by only 4.4 percent. From 2010 to 2013, enrollment growth among families slowed to 3.1 percent a year and per enrollee spending was still about 4 percent, leading overall spending growth for families to slow.
- Between 2007 and 2013, both overall and per enrollee acute care spending grew faster than long-term care spending. This difference reflects enrollment trends, since low-income families gaining Medicaid coverage during the recession are more likely to use acute care services than other types of services. It also reflects particularly slow growth in long-term care spending related to state rebalancing efforts, slow growth in enrollment among the disabled and elderly, and shifts in some long-term care services to managed care.
- Both overall and per enrollee Medicaid spending growth for prescription drugs and institutional long-term care have slowed substantially or declined from 2007 to 2013, while payments to managed care increased over this period. These patterns likely reflect policy decisions in some states to shift provision of prescription drugs or long-term services and supports into managed care contracts. They also may reflect policy choices to increase manufacturer rebates for prescription drugs and “rebalance” long-term care to less expensive community-based services.
- Compared to other benchmarks, Medicaid spending growth has been low from 2007 to 2013. Growth in per enrollee Medicaid spending on medical services was lower than that for national health expenditures per capita, the consumer price index for medical care, and per enrollee spending for private health insurance.
Issue Brief
Introduction
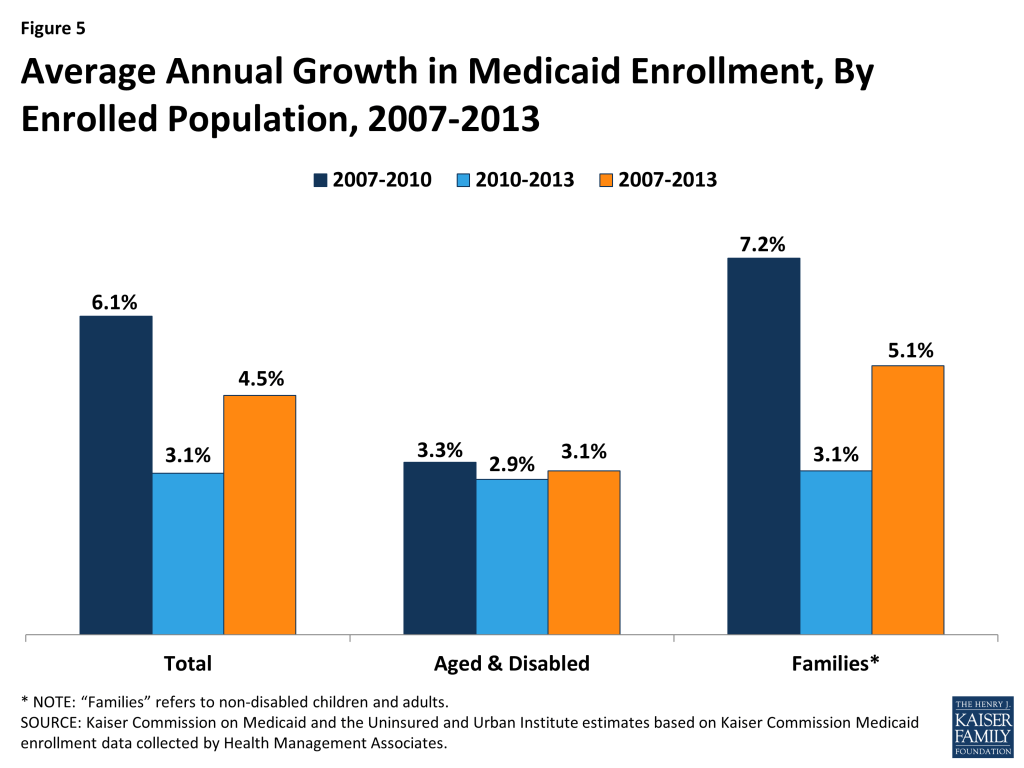
Medicaid spending in recent years has been influenced by several forces. Most notably, the “Great Recession” that began in December 2007 and officially ended in June 2009 led millions of people to lose income and gain Medicaid eligibility during that time. Between 2007 and 2010, unemployment grew from 4.6% to 9.6%, and both real median household income and real per capita income dropped.1 As millions of Americans lost income and health benefits due to job losses during this period, many turned to the Medicaid program to provide health coverage for themselves and their families. Medicaid enrollment grew by more than 8 million between 2007 and 2010, an average annual growth rate of 6.1%.2 Growth was primarily among low-income families (average annual growth of 7.2%) versus people with disabilities and seniors (average annual growth of 3.3%). Since 2010, the economy has been slowly recovering, and enrollment growth has slowed, with average annual growth for both families and the aged and disabled at about 3 percent. Still, many low-income people continue to feel the lingering effects of the recession. The unemployment rate was still 7.4% in 2013 (higher than pre-recession levels), and real median household income continues to be below pre-recession levels.
A related factor affecting Medicaid spending during this time was changes in program financing. During economic downturns, states have difficulty balancing increased demand for assistance from programs like Medicaid with the decline in state tax revenues. In response, Congress has twice passed temporary increases to the federal matching rates (the share of Medicaid costs that the federal government pays) to help support states during economic downturns, most recently in 2009 as part of the American Recovery and Reinvestment Act (ARRA). The ARRA-enhanced matching rates provided states with over $100 billion in total funds over 11 quarters, ending in June 2011. To be eligible for the ARRA funds, states could not restrict eligibility or tighten enrollment procedures in Medicaid or CHIP. The increased federal funds resulted in declines in the level of state spending for Medicaid for the first time in the program’s history.
With the economy continuing to improve, Medicaid enrollment growth across the country slowed considerably in 2012 and 2013. Over those two years, average spending also slowed, but the end of the ARRA enhanced match rates in June 2011 shifted state spending patterns as states tried to mitigate the loss of federal dollars in 2012. This resulted in a dip in spending in 2012 that also affected the annual growth rate for 2013.
Fiscal and budget pressures on Medicaid programs continued to lessen as the economic and fiscal conditions improved in 2013. This allowed some states to implement more program restorations such as increases in provider rates and benefit enhancements, which had not been considered for a number of years. Also in 2013, work was underway to prepare for the ACA coverage provisions set to go into effect in January 2014. While the full effects of these changes are expected to appear in later spending data, there may be some limited effects on spending in 2013. For example, some states such as California and Colorado, which had expanded coverage to childless adults and parents early, saw increased Medicaid enrollment among these populations in the lead up to January 2014, increasing Medicaid enrollment at a time when enrollment trends elsewhere were slowing.3
This paper presents data on Medicaid spending trends during the period of these changes. We use administrative data on Medicaid spending to first examine overall spending trends and trends by service type. We then draw on additional data to analyze per enrollee spending growth during this period, both by service type and by eligibility group, to understand what drove patterns in Medicaid spending. Because year-to-year spending may fluctuate for reasons such as one-time data reporting issues or large policy shifts within a single state (such as a waiver program), we examine spending trends over multiple years: FFY 2007 to 2010, which we refer to as the “recessionary period,” and FFY 2010 to 2013, the “post-recessionary period.”4 A detailed explanation of the data and methods for this analysis is provided in the appendix at the end of this report.
Medicaid Spending Growth by Service Category, 2007-2013
Total Medicaid spending grew from $330.3 billion in 2007 to $454.0 billion in 2013 (Table 1). Focusing on only medical services (i.e., excluding payments to Medicare, disproportionate share hospital (DSH), adjustments and administrative expenses), spending increased from $292.7 billion in 2007 to $407.1 billion in 2013.
As shown in Figure 1, spending on medical services in Medicaid increased by an average annual rate of 5.7 percent over the 2007-2013 period. Medicaid spending growth peaked at the height of the economic recession (8.9% from 2008 to 2009). This pattern reflects the counter-cyclical nature of Medicaid, which expands during economic downturns due to rising enrollment. As the economy slowly improved between 2009 and 2011, spending growth slowed.
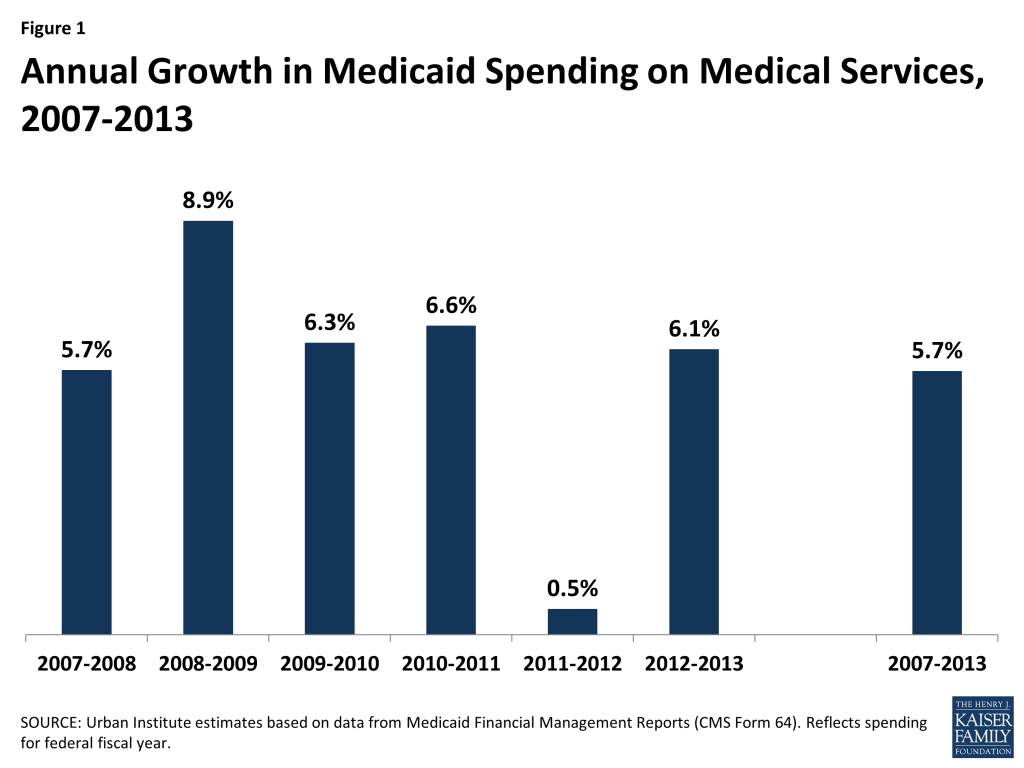
Annual spending growth rates for 2012 and 2013, however, are largely affected by the end of the ARRA enhanced match rates in June 2011. States notably shifted their spending patterns in 2012 to mitigate the loss of federal dollars. This shift resulted in nearly flat spending growth in 2012 (0.5%) and an uptick in 2013 (6.1 %.) However, average spending growth over the two year period was lower than previous years, reflecting declining enrollment growth during this period.
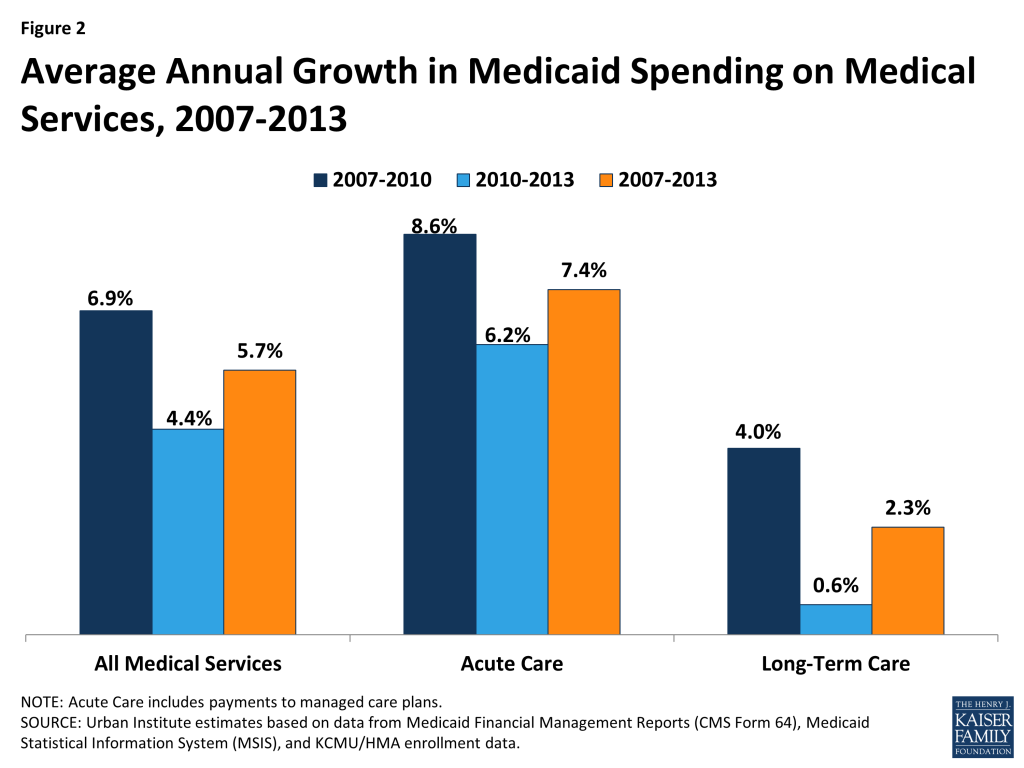
Looking at the entire recessionary period (2007-2010)5 , Medicaid spending on medical services grew at an average annual rate of 6.9 percent, compared to 4.4 percent from 2010 to 2013 (Figure 2). Acute care spending grew at a faster rate than long-term care spending. Acute care spending growth was highest during the recessionary period (8.6 percent from 2007-2010 compared to 6.2 percent from 2010 to 2013). Again, this pattern reflects economic trends, since low-income families gaining Medicaid coverage during the recession are more likely to rely on Medicaid for acute care services than for other types of services.
Acute Care
Medicaid acute care spending grew from $185.3 billion in 2007 to $284.0 billion in 2013, an average annual growth rate of 7.4 percent. Spending growth differed across categories of acute care spending (Figure 3).
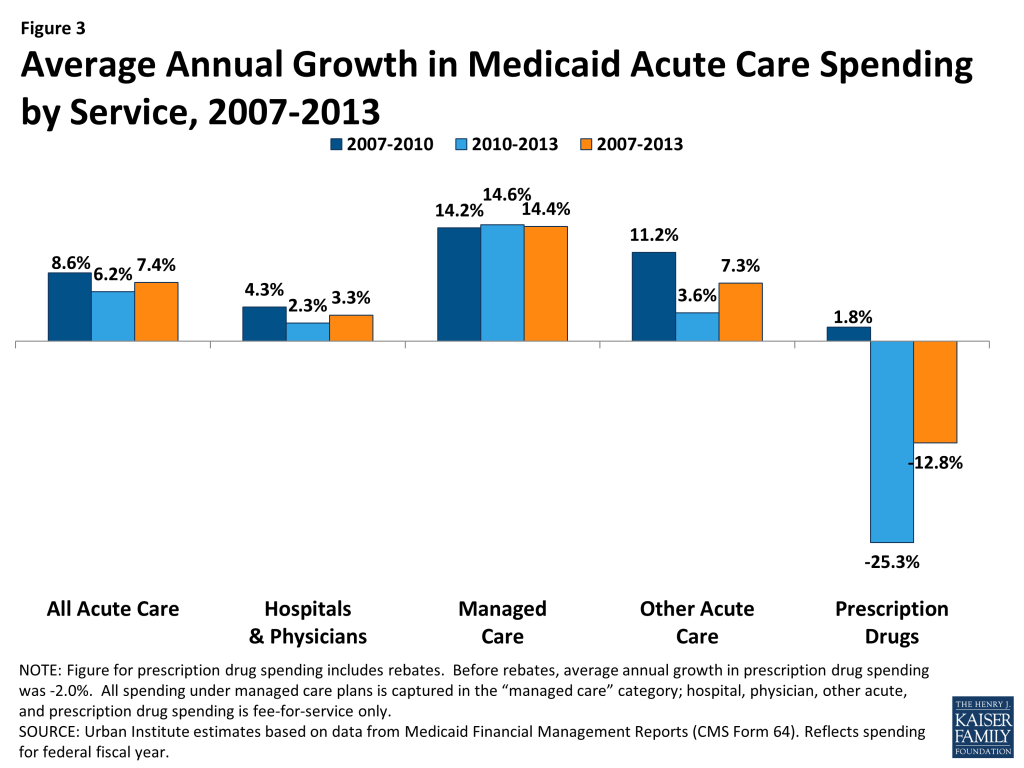
Hospitals and Physicians. Spending on hospitals and physicians increased from $82.3 billion in 2007 to $99.8 billion in 2013, an average annual increase of 3.3 percent. Annual growth was slightly higher during the recessionary period (4.3 percent from 2007 to 2010) than in the post-recessionary period (2.3 percent from 2010 to 2013). Annual growth in spending for this category fluctuated over the period, although some of this pattern could be due to data reporting issues as category definitions changed. Spending in this category was also likely affected by changes in provider reimbursement. During the Great Recession, states turned to provider rate cuts to control costs, just as they did during the economic downturn from 2001 to 2004. As part of an annual survey of Medicaid programs, more states reported provider rate restrictions than increases, including inpatient hospitals and physicians in state fiscal years 2010 through 2012.6 Fluctuations in spending were also affected by changes in a few large states whose hospital spending may have been influenced by one-time factors such as waiver payments.
Managed Care. Within acute care, the fastest-growing category of spending was Medicaid payments to managed care organizations, which increased from $60.7 billion in 2007 to $136.2 billion in 2013.7 The average annual increase in payments to managed care organizations was 14.4 percent during this period, and average annual growth was similarly high during both the recessionary and post-recessionary periods (14.2 percent from 2007 to 2010 and 14.6 percent from 2010 to 2013). This category of spending includes capitated payments by Medicaid to managed care plans for the delivery of benefits to Medicaid enrollees. Plans include both comprehensive plans as well as limited benefit plans that provide just a subset of services such as behavioral health or dental care. Unfortunately, the data do not enable us to determine what managed care plans paid for specific services or providers. The growth in spending on managed care reflects overall Medicaid enrollment growth as well as more services being provided and new populations being covered through managed care.
Other Acute Care. Other acute care spending, which includes dental, other practitioners, abortions, sterilization, PACE programs, emergency services for undocumented aliens, and other care services, grew from $26.3 billion in 2007 to $40.2 billion in 2013, an average annual growth rate of 7.3 percent. Other acute care growth was higher from 2007 to 2010 (11.2 percent) than in the post recessionary period (3.6%). This pattern may reflect particularly high spending in 2010 that resulted from changes in data reporting that shifted some spending from other categories into to the “other acute” care category.
Prescription Drugs. Net Medicaid spending on prescription drugs dropped from $15.0 billion in 2007 to $6.6 billion in 2013, an average annual growth rate of -12.8 percent.8 Prescription drug spending was nearly flat during the recessionary period (average annual growth rate of 1.8 percent from 2007 to 2010) then decreased at a particularly fast rate in the post-recessionary period (average annual growth of -25.3 percent from 2010 to 2013). This negative growth rate is likely due to states shifting prescription drugs into managed care as well as increases in drug rebates. As part of the Medicaid drug benefit, manufacturers provide rebates to the state and federal government. Between 2007 and 2013, rebates accounted for a growing share of gross Medicaid drug spending.9 Further, starting in 2010 with the passage of the ACA, prescription drugs paid for under Medicaid managed care became eligible for rebates, leading many states to shift drug spending into managed care.10 Prescription drug spending has also been a target for many state cost control actions, which may have contributed to slow spending during this period.11
Long-Term Care
Over the period from 2007 to 2013, total long-term care expenditures increased from $107.4 billion in 2007 to $123.0 billion in 2013, an average annual growth of 2.3 percent. Spending growth was particularly low in the post-recessionary period (2010-2013), growing by an average annual rate of less than 1 percent (Figure 4).
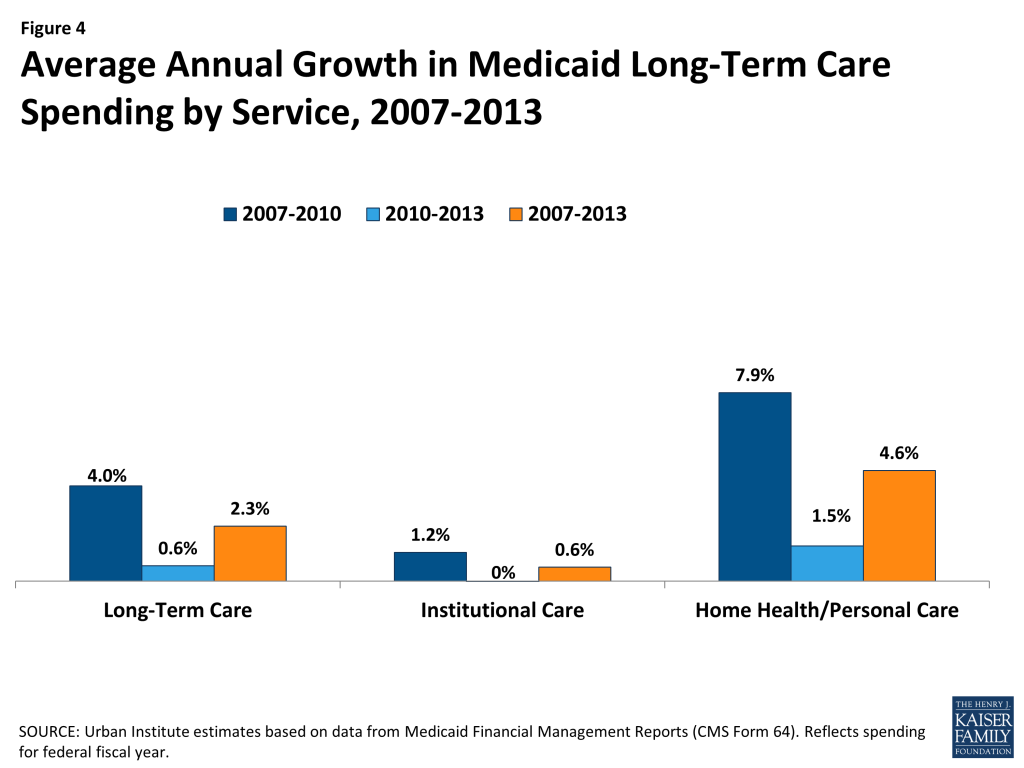
Long-term care includes a range of services that we categorize into two main components: (i) institutional long-term care, such as care provided in nursing facilities and intermediate care facilities for the intellectually and developmentally disabled (ICF-I/DD), and (ii) home health and personal care, which includes home and community-based services. Slow growth in Medicaid long-term care spending was driven by slow growth in institutional care, which grew at an average annual rate of just 1.2 percent from 2007 to 2010 and was flat from 2010 to 2013. With an average annual growth rate of 4.6 percent over the 2007 to 2013 period, spending on home health and personal care grew slightly faster than institutional services. These patterns may reflect state efforts to “rebalance” the provision of long-term care services by shifting resources from institutional to community-based care. The slow growth in institutional service spending may also reflect slow enrollment of elderly and disabled beneficiaries during this period, since this is the population most likely to use nursing home care. Additionally, in recent years, an increasing number of states have incorporated long-term care services as part of their managed care programs, and as a result, long-term care spending is increasingly being captured within managed care spending.
Non-Service Spending
Non-service Medicaid spending includes payments to Medicare programs (e.g. premiums, deductibles, and some cost sharing for dual eligible beneficiary enrollment in Medicare Part A and Part B), disproportionate share hospital (DSH) spending, program administration, and adjustments. Between 2007 and 2013, payments to Medicare increased at an average annual rate of 5.0 percent, DSH grew by 1.0 percent, and administration by 5.7 percent (Table 1). Both payments to Medicare and DSH grew more slowly in the post-recessionary period (2.6 percent and -2.3 percent, respectively) than the recessionary period (7.4 percent and 4.4 percent, respectively). For Medicare payments, this pattern reflects an increase in Medicare Part B premiums in 2010 and then a decrease in premiums in subsequent years. For DSH, the pattern likely reflects policy changes in a few large states that led to declines in DSH spending. Medicaid administration spending grew more quickly between 2010 and 2013 (average annual growth of 8.5 percent) than between 2007 and 2010 (2.9 percent). This pattern may indicate increased state administrative activity to prepare for ACA implementation, activity related to the implementation of major payment and delivery system reforms, or a post-recessionary rebound from tight administrative spending during the fiscal crisis.
Medicaid Spending Growth Per Enrollee, 2007-2013
Medicaid spending is a function of both the number of people served by the program and what the program spends for each person enrolled. Even if spending for each person covered by Medicaid remains stable, growth in the number of people covered by the program will lead to spending growth. As mentioned above, Medicaid enrollment grew between 2007 and 2013, particularly during the recession as people lost jobs and income. Between 2007 and 2013, Medicaid enrollment grew by an average annual rate of 4.5 percent. Growth was particularly high during the recessionary period, 2007 to 2010, when it grew by 6.1% on average. As Figure 5 shows, recession-related enrollment growth was concentrated among families, while enrollment growth among the aged and disabled was relatively steady at around 3 percent through the entire 2007 to 2013 period. In this section, we examine spending per enrollee, which enables us to understand trends in Medicaid spending adjusting for this enrollment growth.
Per Enrollee Spending Growth by Service
These estimates adjust spending per enrollee to control for the effect of the changing composition of Medicaid enrollment, as described in Appendix A. The growth rate in spending per enrollee for a specific service reflects the growth rate of the spending on that service divided by the enrollment growth rate, where the enrollment growth rate is weighted to reflect increases in enrollment in proportion to the use of that specific service among a particular type of enrollee. For example, enrollment growth of the aged and individuals with disabilities, rather than that of families, predominantly affects the growth of institutional long-term care use. Thus, when calculating the spending per enrollee of institutional long-term care, the growth rate of enrollment is weighted to reflect that each aged or disabled enrollee contributes more to long-term care spending than a non-disabled, non-elderly enrollee.
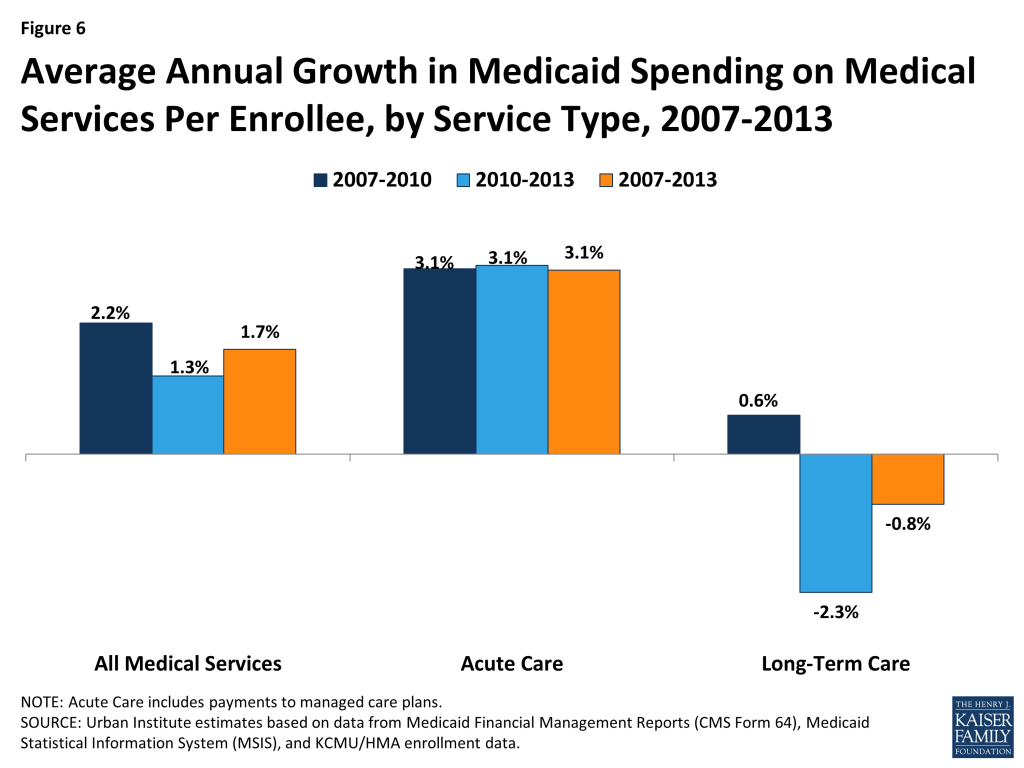
Medicaid spending growth per enrollee was slower over the 2007 to 2013 period than overall spending growth. Per enrollee spending grew by an average annual rate of just 1.7 percent over this period (Figure 6 and Table 2). During the recessionary period, 2007 to 2010 (when overall spending growth was nearly 7 percent), per enrollee spending grew by just 2.2 percent. Average annual growth per enrollee fell to 1.3 percent from 2010 to 2013. Acute care spending per enrollee grew at a average annual rate of 3.1 percent over the 2007 to 2013 period, while long-term care spending per enrollee fell during the period by -0.8 percent.
Within acute care, per enrollee spending growth varied across service categories, similarly to overall spending growth (Table 2). Specifically, per enrollee spending on managed care and other acute care grew the fastest on average, while prescription drug spending per enrollee dropped, particularly from 2010 to 2013. Within long-term care, institutional care spending per enrollee declined by an average of 2.5 percent a year (Table 2). Community-based long-term care spending per enrollee grew by an average of 4.4 percent from 2007 to 2010 but then dropped to an average of 1.4 percent from 2010 to 2013.
Per Enrollee Spending Growth by Eligibility Category
This section examines spending growth per enrollee from 2007 to 2013 by eligibility categories of families (non-disabled adults and children) and seniors and people with disabilities. As in the previous section, these estimates are adjusted for changes in enrollment composition and differential mix of service use across eligibility groups, described in more detail in Appendix A. In short, the analysis uses the 2007 MSIS data to calculate baseline spending by eligibility group; it then uses eligibility group-specific spending growth rate estimates to calculate subsequent years’ spending by eligibility group. These spending growth rate estimates are weighted to account for different mix of service use among different eligibility groups. Because total spending in this analysis is calculated using growth rates applied to the 2007 levels, total spending differs slightly from the estimates in previous figures.
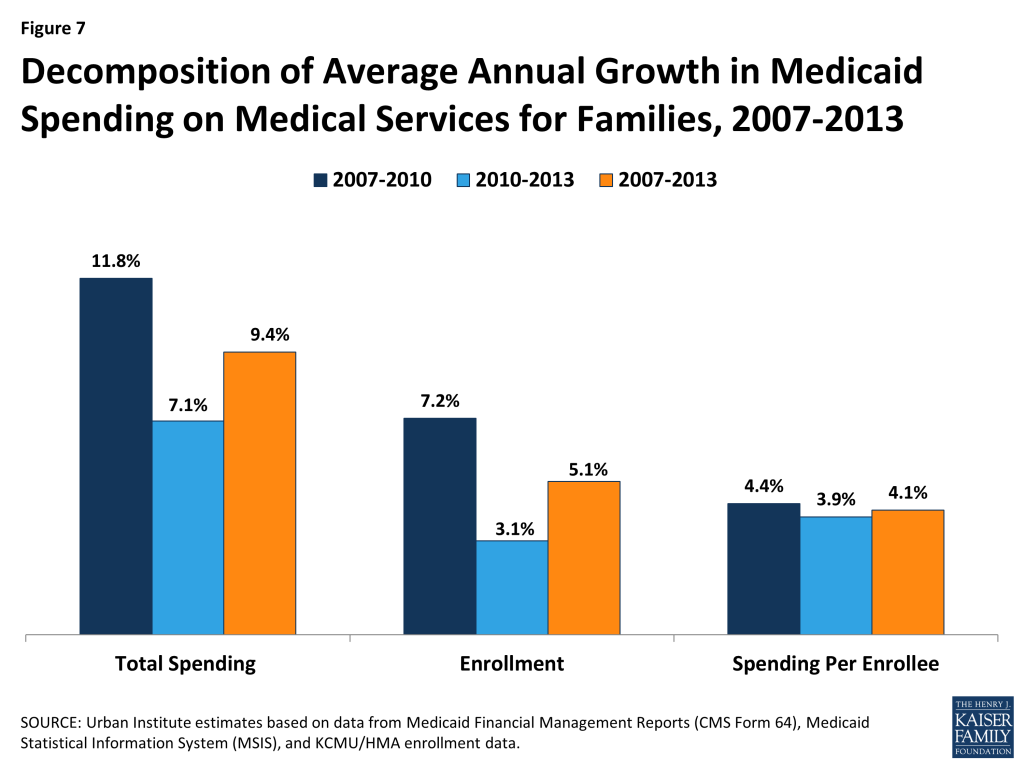
As Figure 7 and 8 show, for families, total spending patterns follow enrollment patterns over the 2007 to 2013 period, peaking during the recessionary period (2007-2010) as enrollment grew during that time. On a per enrollee basis, spending growth for families was relatively stable for the entire 2007 to 2013 period at about four percent. In contrast, total spending patterns for the aged and disabled follow per enrollee spending patterns during the period. For this group, enrollment growth was relatively flat at about three percent on average, while per enrollee spending decreased from 2010 to 2013.
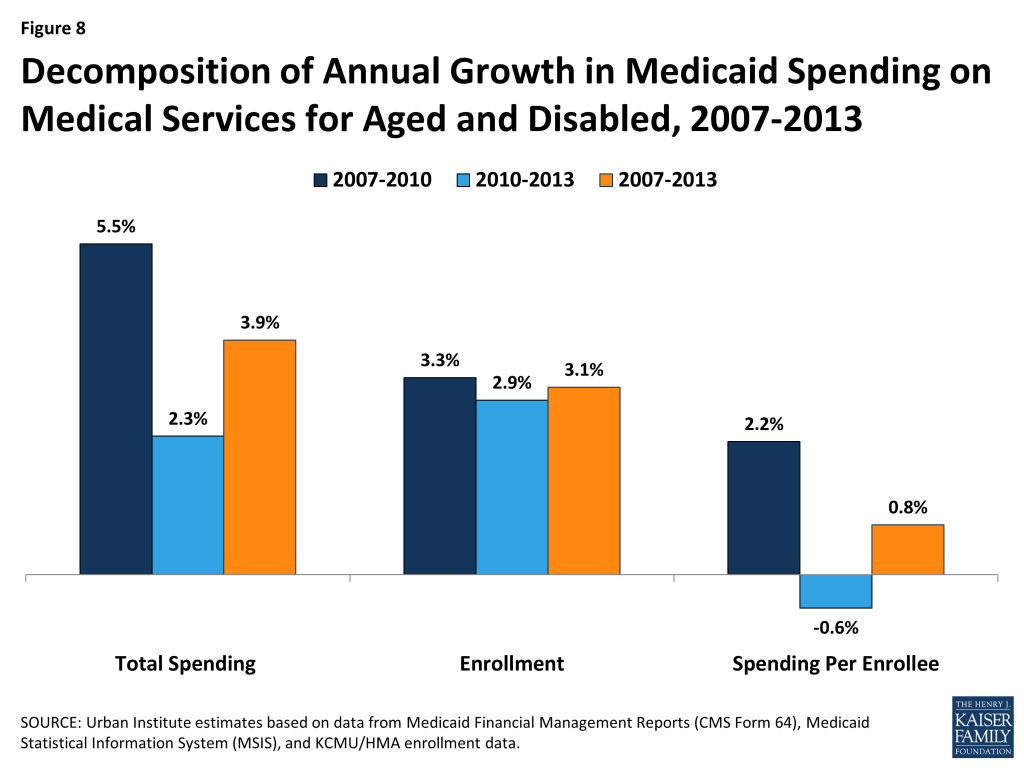
For eligibility groups, these patterns also relate to spending patterns for the service types most frequently used by those eligibility groups. For example, for families, who use Medicaid primarily for acute care services, per enrollee spending growth was stable throughout the period (about 4 percent on average), similar to per enrollee acute care spending. For seniors and people with disabilities—the primary users of long-term care in Medicaid—per enrollee spending growth mirrored long-term care trends: growth was nearly flat over the 2007 to 2013 period, growing at just 0.8 percent on average per year, with a drop in per enrollee spending seen in the latter half of the period.
Discussion
From 2007 to 2013, Medicaid spending on medical services grew by an average annual rate of 5.7 percent, with acute care growing faster than long-term care. Spending growth was higher during the recession, 2007 to 2010 (6.9 percent average growth) and slowed somewhat post-recession, 2010 to 2013 (4.4 percent average growth). On a per enrollee basis, however, spending grew more slowly, and long-term care spending actually declined.
This analysis leads to several key observations about Medicaid spending leading up to the ACA:
Recession-related enrollment of families was a key driver of Medicaid spending between 2007 and 2013. Total Medicaid spending growth increased at the height of the recession. However, the analysis reveals that most of this growth was driven by increases in enrollment, particularly among families, rather than growth in spending per enrollee. Total spending for families increased by 9.4 percent on average from 2007 to 2013, with spending growth particularly high (on average, 11.8 percent) during the recession, 2007 to 2010 (Table 3). However, this growth was largely driven by enrollment, which grew quickly between 2007 and 2010. Per enrollee spending for families grew at a steady rate (around 4%) throughout the period during and after the recession.
These findings indicate that enrollment is a major driver of Medicaid spending patterns, particularly for families. Medicaid enrollment is affected by changes in economic cycles. When the economy does poorly, people not only lose their jobs, but also their access to employer-based health insurance. At the same time, they experience decreases in income that make them eligible for Medicaid under existing eligibility criteria. As a result, during the recession, Medicaid enrollment increased. Enrollment in Medicaid was also affected during this period by protections against eligibility restrictions and increased federal funding included in the American Recovery and Reinvestment Act and by decisions to expand Medicaid eligibility in some states.
Medicaid spending growth has slowed substantially or declined in recent years for prescription drugs and institutional long-term care. Medicaid spending on prescription drugs declined from 2007 to 2013, likely due to both shifting these costs into managed care contracts and recouping an increasing share of drug spending through manufacturer rebates. Further, overall Medicaid spending growth for long-term care was low from 2007 to 2013. Low cost growth in combination with lower but steady rates of enrollment growth for the aged and disabled resulted in a decline in per enrollee spending for long-term care (Table 2). This pattern may reflect low per enrollee spending among people who use these services, driven in part by the shift from institutional to community-based services, which are less expensive.12 States were also increasing their use of managed long term care during the post-recessionary period, which also may have contributed to lower overall spending growth as well as the decline in per enrollee spending for long-term care.13
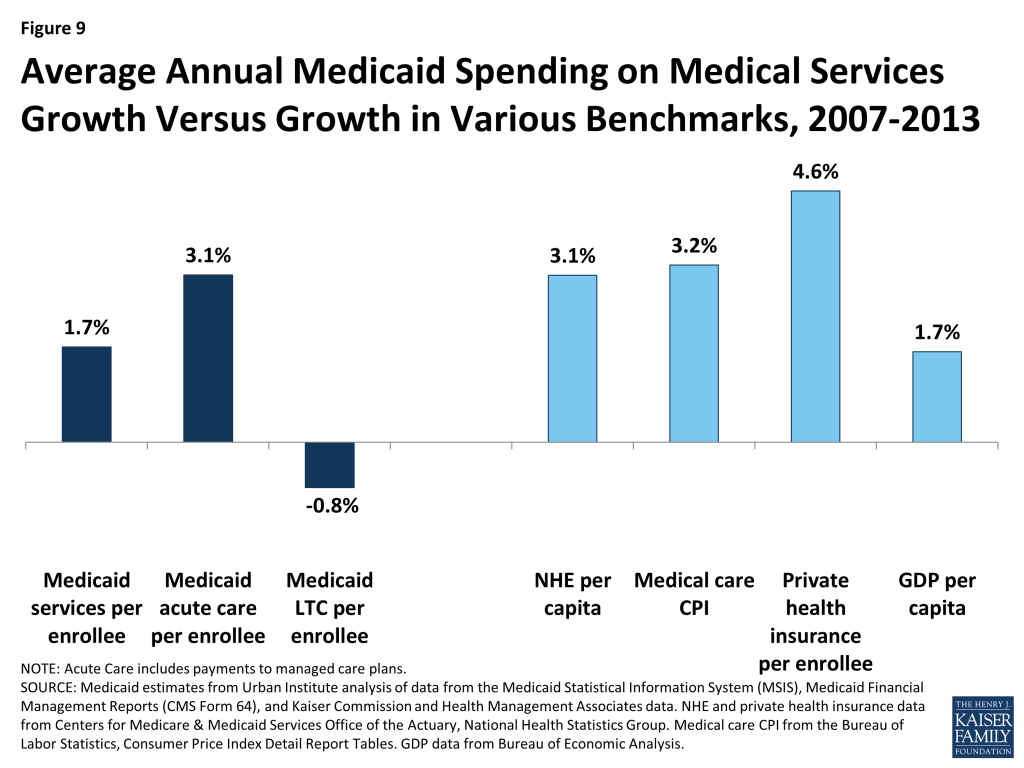
Compared to other benchmarks, Medicaid spending growth per enrollee has been low from 2007 to 2013. On a per enrollee basis, growth in Medicaid spending during this period was slower than growth by other purchasers (Figure 9). Overall per enrollee Medicaid spending on medical services increased by an average of 1.7 percent per year from 2007 to 2013, while national health expenditures per capita increased on average by 3.1 percent annually and the consumer price index (CPI) for medical care (an indicator of the change in prices of medical care) increased by an average of 3.2 percent annually. Comparing growth in Medicaid acute care spending per enrollee to that for private health insurance (which provides primarily acute care benefits), Medicaid spending growth was below that in the private sector, which grew at an average annual rate of 4.6 percent over the period. Medicaid spending on medical services per enrollee grew at the same rate as GDP per capita; while Medicaid acute care spending was higher than GDP per capita, it was on par with the medical care CPI, indicating that it purchases relatively expensive goods.
This KCMU issue brief was prepared by Rachel Garfield, Robin Rudowitz, Katherine Young, and Laura Snyder of the Kaiser Family Foundation and Lisa Clemans-Cope, Emily Lawton, and John Holahan of the Urban Institute.
Tables
| Table 1: National Medicaid Expenditures, by Spending Category and Year, FY 2007-2013 | ||||||||||
| Expenditure Category | Expenditures (in billions) | Average Annual Growth Rate | ||||||||
| 2007 | 2008 | 2009 | 2010 | 2011 | 2012 | 2013 | 2007-2010 | 2010-2013 | 2007-2013 | |
| Total Spending | 330.3 | 350.9 | 377.4 | 400.1 | 425.8 | 429.2 | 454.0 | 6.6% | 4.3% | 5.4% |
| Total Medical Services | 292.7 | 309.3 | 336.7 | 357.8 | 381.5 | 383.6 | 407.1 | 6.9% | 4.4% | 5.7% |
| Acute Care1 | 185.3 | 196.2 | 216.5 | 237.1 | 258.5 | 260.9 | 284.0 | 8.6% | 6.2% | 7.4% |
| Hospitals & Physicians2 | 82.3 | 82.6 | 90.3 | 93.3 | 103.6 | 95.2 | 99.8 | 4.3% | 2.3% | 3.3% |
| Medicaid Managed Care2 | 60.7 | 70.1 | 80.5 | 90.5 | 101.8 | 117.5 | 136.2 | 14.2% | 14.6% | 14.4% |
| Other Acute Care2,3 | 26.3 | 27.2 | 28.8 | 36.2 | 37.1 | 38.4 | 40.2 | 11.2% | 3.6% | 7.3% |
| Prescription Drugs | 15.0 | 15.3 | 15.7 | 15.8 | 14.7 | 8.6 | 6.6 | 1.8% | -25.3% | -12.8% |
| Prescribed Drugs Excluding Rebates | 22.4 | 23.7 | 25.5 | 27.3 | 29.8 | 23.2 | 19.8 | 6.9% | -10.2% | -2.0% |
| Prescription Drug Rebates2 | (7.3) | (8.4) | (9.8) | (11.5) | (15.1) | (14.7) | (13.2) | 16.2% | 4.6% | 10.3% |
| Long-Term Care | 107.4 | 113.0 | 120.2 | 120.7 | 123.0 | 122.7 | 123.0 | 4.0% | 0.6% | 2.3% |
| Institutional Long-Term Care2 | 64.3 | 66.0 | 68.2 | 66.6 | 68.1 | 67.4 | 66.5 | 1.2% | 0.0% | 0.6% |
| Home Health/Personal Care2,4 | 43.1 | 47.0 | 52.0 | 54.1 | 55.0 | 55.2 | 56.5 | 7.9% | 1.5% | 4.6% |
| Medicare Payments2,5 | 11.0 | 11.8 | 12.0 | 13.7 | 15.0 | 14.5 | 14.8 | 7.4% | 2.6% | 5.0% |
| DSH | 15.4 | 17.7 | 17.7 | 17.6 | 17.3 | 17.1 | 16.4 | 4.4% | -2.3% | 1.0% |
| Inpatient Hospital – DSH | 13.0 | 14.4 | 14.7 | 14.7 | 14.3 | 14.3 | 13.4 | 4.2% | -2.9% | 0.6% |
| Mental Health Facility – DSH | 2.5 | 3.3 | 3.0 | 2.9 | 2.9 | 2.7 | 2.9 | 5.3% | 0.4% | 2.8% |
| Medical Services Adjustments6 | (5.2) | (5.5) | (7.3) | (6.9) | (7.5) | (8.0) | (7.1) | 9.4% | 1.1% | 5.2% |
| Administration7 | 16.4 | 17.6 | 18.3 | 17.9 | 19.5 | 22.1 | 22.8 | 2.9% | 8.5% | 5.7% |
| SOURCE: Urban Institute estimates based on data from Medicaid Financial Management Reports (HCFA/CMS Form 64). Annual expenditures reflect nominal spending for the federal fiscal year.1. The “Acute Care” total here includes EPSDT screening spending, which amounted to $0.9B, $1.0B, $1.2B, $1.3B, $1.3B, $1.2B, and $1.3B in FFY 2007, 2008, 2009, 2010, 2011, 2012, and 2013, respectively.2. The CMS-64 was revised beginning with FFY 2010 data, and beginning that year, this category may not be comparable to that of previous years.3. Includes dental, other practitioners, abortion, sterilization, PACE programs, emergency services for undocumented aliens, and other care services.4. Includes home health services, home- and community-based waiver services, personal care, and related services.5. Includes premiums paid for those dually eligible for Medicaid and Medicare as well as Medicare deductibles and coinsurance for Qualified Medicare Beneficiaries (QMBs).6. Includes collections for overpayments.7. Includes immigration status verification system, preadmission screening, family planning, nurse aide training, external quality review, and enrollment broker costs. | ||||||||||
| Table 2: Annual Growth in Spending Per Enrollee by Type of Service, FY 2007 – 2013 | |||||||||
| Annual Growth Rate | Average Annual Growth Rate | ||||||||
| Service Category | 2007-2008 | 2008-2009 | 2009-2010 | 2010 – 2011 | 2011-2012 | 2012-2013 | 2007-2010 | 2010-2013 | 2007-2013 |
| Medical Services | 2.7% | 3.0% | 0.8% | 2.2% | -2.4% | 4.3% | 2.2% | 1.3% | 1.7% |
| Acute Care | 2.8% | 3.4% | 3.1% | 4.2% | -1.9% | 7.0% | 3.1% | 3.1% | 3.1% |
| Hospitals & Physicians | -2.5% | 2.7% | -2.6% | 6.3% | -10.7% | 3.0% | -0.8% | -0.7% | -0.8% |
| Medicaid Managed Care | 12.0% | 6.9% | 5.3% | 7.5% | 12.2% | 14.0% | 8.0% | 11.2% | 9.6% |
| Other Acute Care1 | 0.3% | 0.0% | 18.8% | -1.8% | 0.7% | 2.8% | 6.0% | 0.5% | 3.2% |
| Prescription Drugs | -1.2% | -2.9% | -4.6% | -11.3% | -43.3% | -24.2% | -2.9% | -27.5% | -16.1% |
| Long-Term Care | 2.6% | 2.6% | -3.2% | -1.9% | -3.4% | -1.4% | 0.6% | -2.3% | -0.8% |
| Institutional Long-Term Care | 0.0% | -0.4% | -5.8% | -1.7% | -4.0% | -3.0% | -2.1% | -2.9% | -2.5% |
| Home Health/Personal Care2 | 6.3% | 6.7% | 0.2% | -2.2% | -2.6% | 0.5% | 4.4% | -1.4% | 1.4% |
| SOURCE: Urban Institute estimates based on data from Medicaid Financial Management Reports (HCFA/CMS Form 64), Medicaid Statistical Information System (MSIS), and KCMU/HMA enrollment data. Expenditures reflect nominal spending and exclude payments made under CHIP, Medicare premiums paid by Medicaid for persons eligible for both programs, Disproportionate Share Hospital (DSH) payments, administrative costs, and accounting adjustments. FY 2010 Medicaid Statistical Information System data was used for the proportion of each service category that is represented by the aged/disabled or families. Due to lack of availability of FY 2010 MSIS data for Idaho, FY 2009 Idaho MSIS data adjusted to the given state’s 2010 CMS-64 expenditures was used.1. Includes dental, other practitioners, abortion, sterilization, PACE programs, emergency services for undocumented aliens, and other care services. Other care services could not be calculated separately from other acute care services due to data limitations.2. Includes home health services, home- and community-based waiver services, personal care, and related services. | |||||||||
| Table 3. Average Annual Changes in Enrollment and Medicaid Expenditures on Medical Services by Eligibility Group, FFY 2007 – 2013 | ||||||||||
| Average Annual Growth Rate | ||||||||||
| 2007 | 2008 | 2009 | 2010 | 2011 | 2012 | 2013 | 2007-2010 | 2010-2013 | 2007-2013 | |
| Total Spending ($ Billions) | ||||||||||
| All Enrollees | $293 | $312 | $342 | $366 | $390 | $394 | $414 | 7.7% | 4.2% | 6.0% |
| Families1 | $99 | $107 | $123 | $138 | $152 | $156 | $169 | 11.8% | 7.1% | 9.4% |
| Aged & Disabled | $194 | $205 | $219 | $228 | $239 | $238 | $245 | 5.5% | 2.3% | 3.9% |
| Enrollment (Millions) | ||||||||||
| All Enrollees | 42.4 | 43.7 | 47.1 | 50.5 | 53.0 | 54.4 | 55.3 | 6.1% | 3.1% | 4.5% |
| Families1 | 30.0 | 31.0 | 34.0 | 36.9 | 38.8 | 39.8 | 40.5 | 7.2% | 3.1% | 5.1% |
| Aged & Disabled | 12.4 | 12.7 | 13.1 | 13.6 | 14.1 | 14.6 | 14.8 | 3.3% | 2.9% | 3.1% |
| Spending Per Enrollee | ||||||||||
| All Enrollees | $6,909 | $7,150 | $7,249 | $7,245 | $7,371 | $7,234 | $7,486 | 1.6% | 1.1% | 1.3% |
| Families1 | $3,286 | $3,462 | $3,606 | $3,734 | $3,904 | $3,919 | $4,187 | 4.4% | 3.9% | 4.1% |
| Aged & Disabled | $15,708 | $16,171 | $16,678 | $16,769 | $16,891 | $16,280 | $16,478 | 2.2% | -0.6% | 0.8% |
| SOURCE: Urban Institute estimates based on data from Medicaid Financial Management Reports (HCFA/CMS Form 64), Medicaid Statistical Information System (MSIS), and KCMU/HMA enrollment data. Expenditures reflect nominal spending and exclude payments made under CHIP, Medicare premiums paid by Medicaid for persons eligible for both programs, Disproportionate Share Hospital (DSH) payments, administrative costs, and accounting adjustments. Total spending levels and growth rates differ from those presented in previous tables because the data source and method used to calculate total spending are different. Total spending reflects sums of spending by eligibility group which is calculated by taking the 2007 MSIS spending level for each eligibility group and applying the corresponding growth rates. FY 2010 Medicaid Statistical Information System data was used for the proportion of total spending for an eligibility group that is represented by a particular service. Due to lack of availability of FY 2010 MSIS data for Idaho, FY 2009 MSIS data for this state adjusted to the given state’s 2010 CMS-64 expenditures was used. This method is described in more detail in Appendix A. Growth rates for CPI-U Medical Care come from the Bureau of Labor Statistics, Consumer Price Index Detail Report Tables, Annual Average Indexes 2007 – 2013, Table 1A. Consumer Price Index for All Urban Consumers (CPI-U): U.S. city average, by expenditure category and commodity and service group (1982-84=100, unless otherwise noted), http://www.bls.gov/cpi/cpi_dr.htm.1. The term “families” is used to refer to non-disabled children and adults. | ||||||||||
Appendix: Data Sources And Methods
Data Sources
Because no existing Medicaid data source includes current spending data, current enrollment data, and detailed data on spending per enrollee, we combine data from three sources for this analysis.
CMS-64. The main source for spending data is the Medicaid Financial Management Reports (Form 64) from the Center for Medicare and Medicaid Services (CMS) for federal fiscal years 2007 to 2013, which are used to obtain aggregate spending. These data are available by state and spending category. At this time, the CMS-64 does not report enrollment or spending by eligibility group. However, in the new future, it will report total enrollment, as well as enrollment for the new adult eligibility group.
Beginning with FY 2010 data, the CMS-64 used new spending categories, which aim both to capture additional spending categories (e.g., those related to provisions under health reform) and to increase consistency across states in how certain types of spending (e.g., “other practitioner”) are classified. To compare the FY 2010 data to previous years, we relied on an updated crosswalk of spending categories from CMS to map the new categories to the previous years’ categories. This crosswalk allows us to examine trends over time, but it is possible that some services shifted categories in some states as a result of this change.
The net expenditure for prescription drugs in Medicaid reflects both the cost of the drug/dispensing fee as well as the rebate received from the drug manufacturer. Drug manufacturers are required to pay these rebates to the federal and state governments for outpatient prescription drugs as a condition of Medicaid coverage for the drug. In most cases, we report net drug expenditures (that is, outlays after accounting for rebates), which represent total program spending for prescription drugs. The rebates effectively lower the price that Medicaid pays for prescription drugs. In some cases, specified in the text, we also report spending for prescription drugs excluding rebates.
Medicaid Enrollment. Data on enrollment come from a survey of all 50 states and the District of Columbia conducted by Health Management Associates (HMA) for the Kaiser Commission on Medicaid and the Uninsured (KCMU). These data provide point in time enrollment for June of each year. Total enrollment data were reported for all states and the District of Columbia for two main groups: 1) aged and individuals with disabilities; and 2) child, parent, and other non-aged, non-disabled adult enrollment (throughout the report referred to simply as “family enrollment”).
MSIS. A third data source, the Medicaid Statistical Information System (MSIS), provides detailed, individual level spending and enrollment data stratified by service type and eligibility group. Data from the 2010 MSIS14 are used to estimate spending growth by eligibility group.
Analytic Approach
Accurately estimating per enrollee spending growth rates requires data that can link spending to enrollment groups. This is because simply dividing the total change in spending by the total change in enrollment would bias the estimate of the growth in spending per enrollee. Overall, for the time period of this analysis, spending would be biased downward because of the faster enrollment among less expensive family beneficiaries relative to the aged and disabled. This bias could be even more pronounced among subsets of services. For example, since families account for only a small share of long-term care spending, enrollment growth among families is not likely to affect long-term care spending.
Unfortunately, the CMS-64 does not enable us to stratify Medicaid spending growth for families versus the aged/disabled because CMS-64 data do not associate spending with eligibility groups. Therefore, the analysis presented in this paper draws on the Medicaid Statistical Information System (MSIS), to estimate spending per enrollee growth by eligibility group. MSIS provides detailed individual-level spending and enrollment data stratified by service type and eligibility group, but it is not available for the more recent years in this analysis. We use the 2010 MSIS, as well as the 2007 MSIS, the year corresponding with the start of the time period in this analysis.
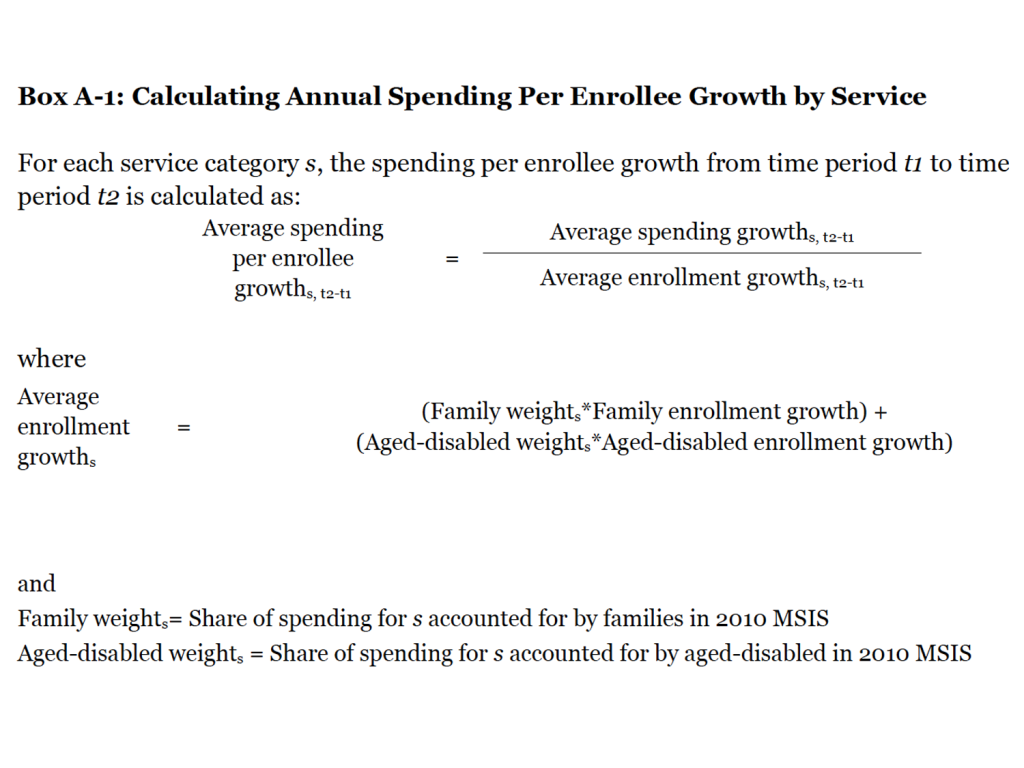
The MSIS is incorporated into the per enrollee estimates in two ways. First, we use the 2010 MSIS data to estimate annual spending per enrollee growth by service in a way that accounts for differences in service use across eligibility groups. To do this, we use MSIS to calculate service-specific annual enrollment growth rates by obtaining service-specific weights for families versus the aged and disabled beneficiaries. These weights are equal to the share of Medicaid spending for each service that each eligibility group generates using the 2010 MSIS. Then, for each service category, we calculate a weighted average of the enrollment growth for the two eligibility groups. For example, the 2010 MSIS indicates that families account for 47 percent of spending on hospitals and physicians, while the aged and disabled beneficiaries account for 53 percent. Thus, we calculate the hospital and physician-specific enrollment growth by weighting the family enrollment growth by 0.47 and enrollment growth for the aged and disabled beneficiaries by 0.53. Finally, we divide the annual spending growth for each service by the weighted annual enrollment growth for each service to calculate the annual spending per enrollee growth for each service (see Box A-1).
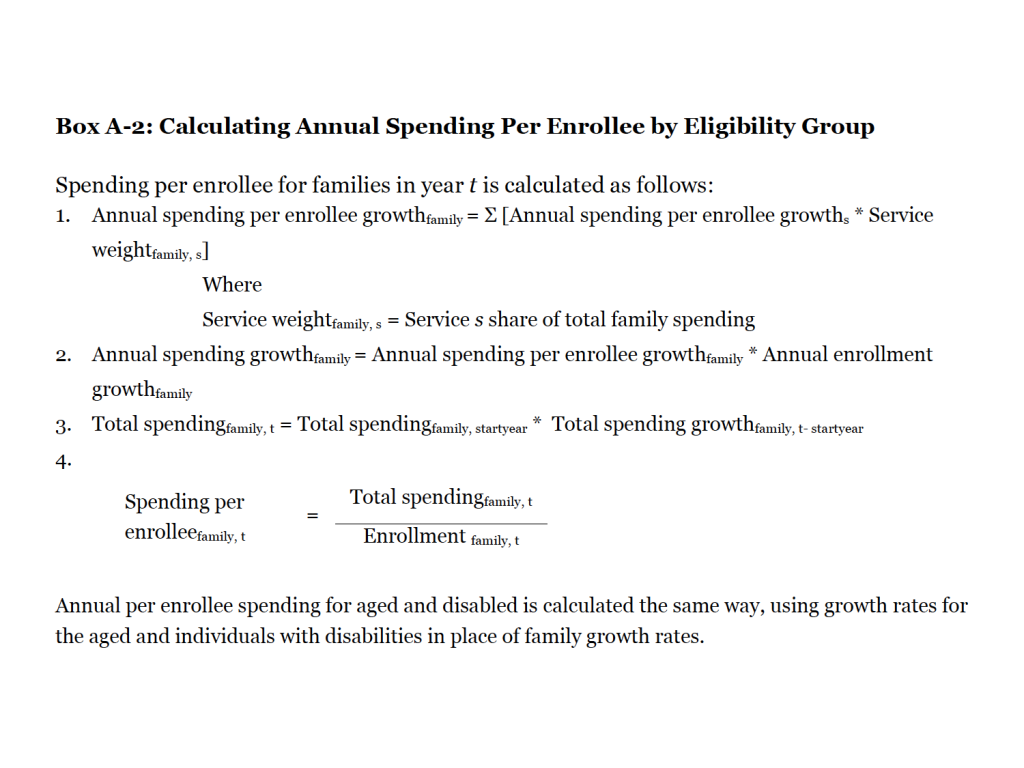
Second, we used MSIS data to estimate annual spending per enrollee growth by eligibility group in a way that similarly accounts for differences in service use across eligibility groups. This analysis enables us to deconstruct total spending growth from year to year into increases in enrollment and increases in spending per enrollee by eligibility group. First, we use the 2007 MSIS to establish baseline spending by eligibility group. Then, to calculate the annual spending per enrollee growth by eligibility group, we weight the annual growth in spending per enrollee for each service by the importance of that service to the specific eligibility group and then aggregate across all services (step 1 in Box A-2). For each eligibility group, we then multiply the annual spending per enrollee growth estimate times the annual enrollment growth. This gives us the annual spending growth rate for each eligibility group (step 2 in Box A-2). Finally, we apply these rates to baseline spending by eligibility group calculated using 2007 MSIS data (step 3 in Box A-2). The spending totals and rates of growth calculated using this method are shown in Table 3 and differ from the spending growth in Figure 5 and Table 1 because the data source and method used to calculate total spending are different. Total spending in Table 3 reflects sums of spending by eligibility group calculated by taking the 2007 MSIS spending level for each eligibility group and applying the corresponding growth rates calculated using data from Medicaid Financial Management Reports (HCFA/CMS Form 64), Medicaid Statistical Information System (MSIS), and KCMU/HMA enrollment data.
Endnotes
- Unemployment data from Bureau of Labor Statistics: Current Population Survey, Labor Force Statistics. Income data from U.S. Census Bureau, Current Population Survey, Annual Social and Economic Supplements. ↩︎
- Kaiser Commission on Medicaid and the Uninsured and Urban Institute estimates based on KCMU Medicaid enrollment data collected by Health Management Associates. https://modern.kff.org/medicaid/issue-brief/medicaid-enrollment-snapshot-december-2013/. ↩︎
- Laura Snyder, Robin Rudowitz, Eileen Ellis and Dennis Roberts. Medicaid Enrollment Snapshot: December 2013. Kaiser Family Foundation, June 2014. https://modern.kff.org/medicaid/issue-brief/medicaid-enrollment-snapshot-december-2013/. ↩︎
- Unless otherwise noted, all years in this brief refer to the federal fiscal year (FFY), which runs from October 1 through September 30. ↩︎
- In this report we refer to FFY 2007 to 2010 as the “recessionary period” and FFY 2010 to 2013 the “post-recessionary period.” ↩︎
- Because hospital inpatient rates typically include inflation adjustment built into their rates, states reporting holding such rates flat as well as reductions in payment rates are considered restrictions. Physician rate restrictions only refer to actual reductions in rates. – Vernon Smith, Kathleen Gifford, Eileen Ellis, Robin Rudowitz and Laura Snyder, Moving Ahead Amid Fiscal Challenges – A Look at State Medicaid Program Spending, Enrollment and Policy Trends. Kaiser Family Foundation, October 2011. https://modern.kff.org/medicaid/report/moving-ahead-amid-fiscal-challenges-a-look-at-medicaid-spending-coverage-and-policy-trends-results-from-a-50-state-medicaid-budget-survey-for-state-fiscal-years-2011-and-2012/. – Vernon Smith, Kathleen Gifford, Eileen Ellis, Robin Rudowitz and Laura Snyder, Medicaid Today; Preparing for Tomorrow – A Look at State Medicaid Program Spending, Enrollment and Policy Trends. Kaiser Family Foundation, October 2012. https://modern.kff.org/medicaid/report/medicaid-today-preparing-for-tomorrow-a-look-at-state-medicaid-program-spending-enrollment-and-policy-trends-results-from-a-50-state-medicaid-budget-survey-for-state-fiscal-years-2012-and-2013/. ↩︎
- The CMS-64 includes a category of spending for payments to managed care plans for delivery of benefits to Medicaid enrollees. We classify these payments as acute care spending since the majority of managed care plans in Medicaid cover acute care (versus long-term care) benefits. ↩︎
- Although outside the time-frame of this analysis, it is worth noting that in January 2006, prescription drug services and spending for beneficiaries dually eligible in Medicare and Medicaid moved from Medicaid to Medicare Part D. ↩︎
- Effective in 2010, the ACA included provisions to increase the base federal rebate, including increasing the federal rebate on most brand name drugs from 15.1% of the drug average manufacturer price (AMP) to 23.1% of AMP. ↩︎
- IMS Institute for Healthcare Informatics, “Shift from Fee-for-Service to Managed Medicaid: What is the Impact on Patient Care? An early review of prescription drug utilization,” April 2013. Available at http://www.imshealth.com/deployedfiles/ims/Global/Content/Insights/IMS%20Institute%20for%20Healthcare%20Informatics/. ↩︎
- Vernon Smith, Kathleen Gifford, Eileen Ellis, Robin Rudowitz and Laura Snyder, Medicaid in a Historic Time of Transformation: Results from a 50-State Medicaid Budget Survey for State Fiscal Years 2013 and 2014. Kaiser Family Foundation, October 2013 https://modern.kff.org/medicaid/report/medicaid-in-a-historic-time-of-transformation-results-from-a-50-state-medicaid-budget-survey-for-state-fiscal-years-2013-and-2014/. ↩︎
- Erica Reaves and MaryBeth Musumeci, Medicaid and Long-Term Services and Supports: A Primer. Kaiser Family Foundation, July 2014. https://modern.kff.org/medicaid/report/medicaid-and-long-term-services-and-supports-a-primer/. ↩︎
- MaryBeth Musumeci. Key Themes in Capitated Medicaid Managed Long-Term Services and Supports Waivers. Kaiser Family Foundation, November 2014. https://modern.kff.org/medicaid/issue-brief/key-themes-in-capitated-medicaid-managed-long-term-services-and-supports-waivers/. ↩︎
- Due to lack of availability of FY 2010 MSIS data for Idaho, FY 2009 MSIS data for this state adjusted to the given state’s 2010 CMS-64 expenditures was used. 2011 MSIS data is available for use, but because data is missing in several states, and because of remaining data quality issues, we opted to use the FY 2010 MSIS. ↩︎