Texas Residents’ Views on State and National Health Policy Priorities
Topline-Kaiser-Family-Foundation-Episcopal-Health-Foundation-Texas-Health-Policy-Survey
Executive Summary
Texas, the nation’s second most-populous state, has a diverse population in terms of race, ethnicity, immigration status, income, and geography. One of 17 states that did not expand Medicaid under the Affordable Care Act, Texas also has the largest number of uninsured residents among U.S. states. In a new survey, the Kaiser Family Foundation and the Episcopal Health Foundation sought to gauge Texans’ views on health policy priorities at both the state and national level.
Overall, the survey finds that health care is a priority for Texans, with over half saying the state legislature should increase spending on health care programs, similar to the share who want to increase spending on public safety and infrastructure, but behind the share calling for increases in public education spending. Within health care, initiatives that would lower the cost of health care and prescription drugs, reduce maternal mortality, improve access to health insurance and provide funding for mental health programs are seen as the highest priorities.
There is also a robust level of support for state action to expand coverage to low-income adults in Texas, including through Medicaid. Roughly two-thirds of Texans say the state government is currently not doing enough to make sure low-income adults can get the health care they need, and the same share says the state should expand its Medicaid program. This support exists in spite of the fact that only three in ten Texans are aware of the fact that Texas has a higher uninsured rate than other states.
Support for Medicaid may be related to the fact that about seven in ten Texans report some level of connection to the program, saying that they themselves, a child, or a close friend or family member has received help from Medicaid at some point. While partisans differ in their opinion of whether the state should expand Medicaid, majorities of Texans across political parties say they have a favorable view of Medicaid and that the program is working well for most low-income people covered by it.
Future briefs based on the survey will cover Texans’ experiences with health care affordability and access, the views and experiences of those with private insurance, women and children’s health care in Texas, and Texans’ views on social determinants of health.
Findings
Texans’ Views on Health Care as a Priority for the State Legislature
Health care programs are one of many spending priorities Texas residents see for their state government. When asked whether the state legislature should increase, decrease, or maintain current levels of spending in various areas, a majority (54 percent) of Texans want spending on health care programs to increase (Figure 1). This is lower than the share who want the state to increase spending on public education (71 percent) and similar to the shares who want increases in spending on infrastructure (55 percent) and public safety (52 percent). By contrast, pluralities of Texans want state spending on transportation and welfare programs to stay about the same.
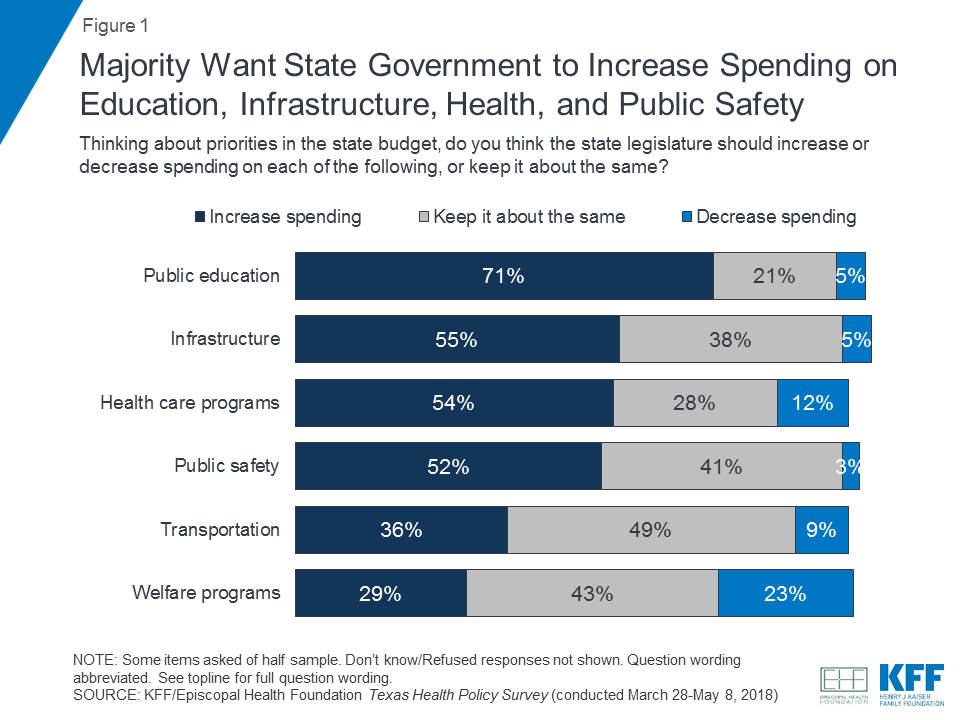
Texans’ views of state spending on health care vary somewhat by demographic group. Democrats, women, Black residents, and those with at least some college education are more likely to support increases in state spending on health care programs. However, across groups few say the state should decrease spending; rather there is a greater preference among Republicans, White and Hispanic residents, and those with no college education to keep state spending at its current level (Table 1).
| Table 1: Views of State Spending on Health Care by Key Demographics | |||||||||||
| Percent who say the state legislature should ______ spending on health care programs: | Party Identification | Gender | Race/Ethnicity | Education level | |||||||
| Dem. | Ind. | Rep. | Male | Female | White | Black | Hisp. | High school or less | Some college | 4-year college degree | |
| Increase | 69% | 55% | 41% | 50% | 59% | 53% | 77% | 46% | 48% | 60% | 58% |
| Decrease | 6 | 13 | 16 | 15 | 9 | 12 | 10 | 13 | 14 | 12 | 11 |
| Keep about the same | 23 | 28 | 34 | 27 | 29 | 27 | 11 | 37 | 33 | 23 | 26 |
| Don’t know/Refused | 1 | 4 | 9 | 8 | 3 | 7 | 2 | 4 | 5 | 5 | 5 |
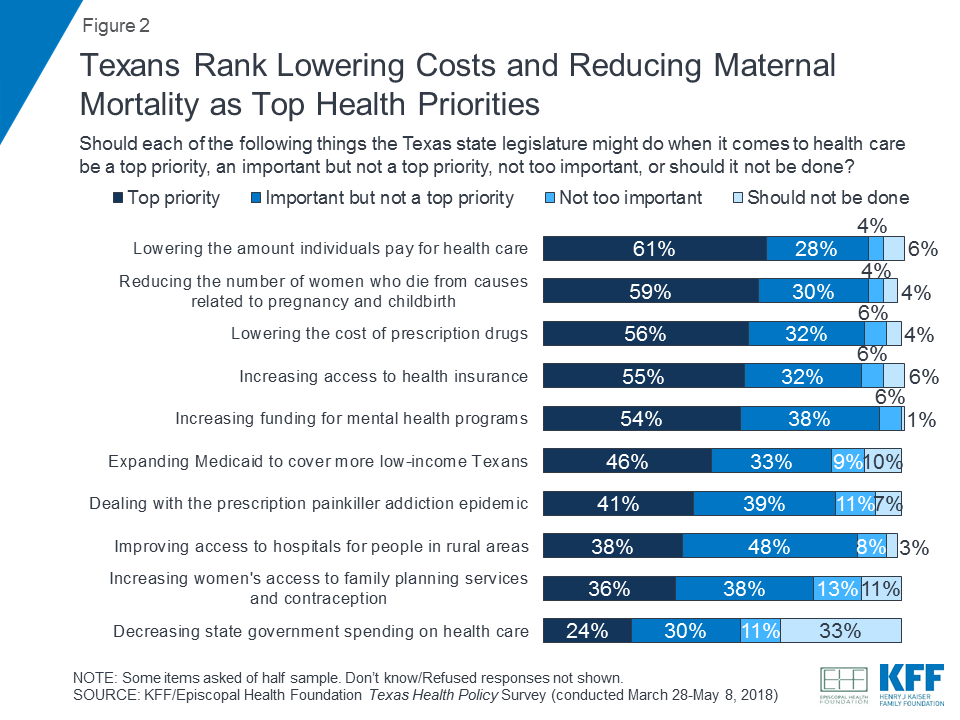
When asked about various things the state legislature might focus on within health care, all are viewed as important by a majority of Texans, with issues of affordability, insurance access, and maternal and mental health rising to the top (Figure 2). Majorities say top priority should be given to lowering what individuals pay for care (61 percent), reducing maternal mortality (59 percent), lowering prescription drug costs (56 percent), increasing access to health insurance (55 percent), and increasing funding for mental health programs (54 percent). Nearly half (46 percent) say expanding Medicaid to cover more low-income Texans should be a top priority, while about four in ten say the same about dealing with the prescription painkiller addiction epidemic (41 percent), improving hospital access in rural areas (38 percent), and increasing contraception access (36 percent). Fewer say the state legislature should place a top priority on decreasing state spending on health care (24 percent), while one-third (33 percent) say this should not be done.
Poll: Texans’ top state health priorities include lowering out-of-pocket costs and reducing maternal mortality
While there are differences in how various demographic groups in Texas view health care priorities for the state legislature, lowering the amount individuals pay for health care and lowering prescription drug costs are seen as a top priority by majorities of Texans regardless of political party, race/ethnicity, gender, or self-reported income level.
Rating the State on Access to Care for Vulnerable Groups
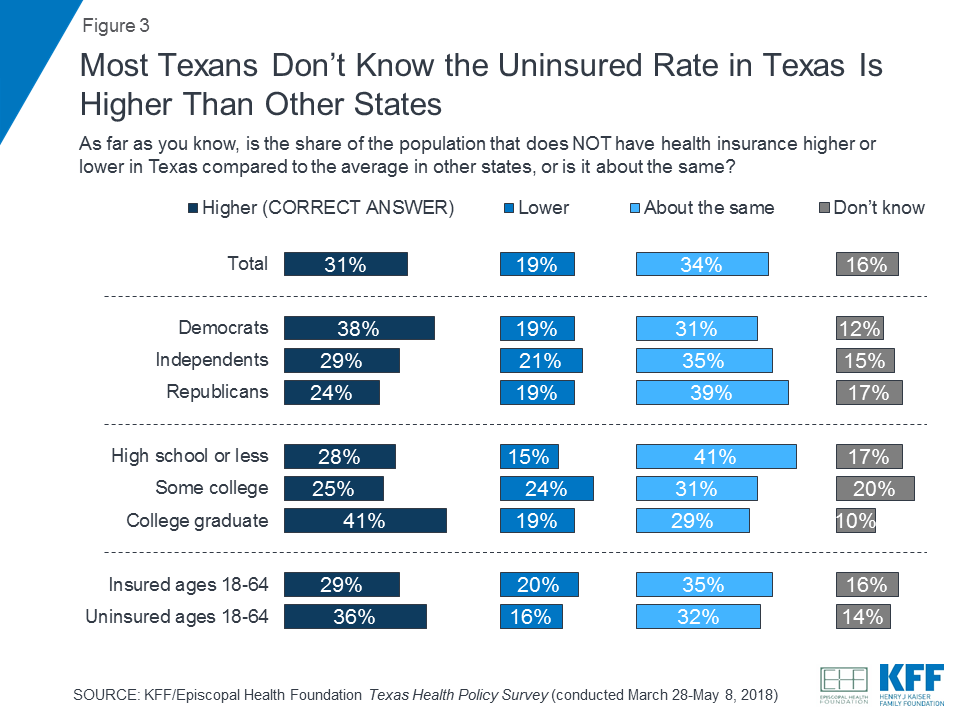
Texas has the largest number of uninsured individuals of any state in the nation. According to Kaiser Family Foundation analysis of Census data, 21 percent of adults between the ages of 19-64 in Texas are uninsured, substantially higher than the national average of 12 percent.1 However, most Texas residents are unaware of this fact. About three in ten (31 percent) correctly answer that the share of the population without health insurance is higher in Texas compared to the average in other states, while about one in five (19 percent) believe the uninsured rate is lower in Texas than other states and about a third (34 percent) think it’s about the same (Figure 3).
Among Texans, Democrats and those with higher levels of education are more likely to be aware of the fact that Texas has a higher uninsured rate than other states. However, those who are uninsured themselves are no more likely than their insured counterparts to be aware of this fact.
Despite this lack of understanding about the uninsured rate, a majority of Texans believes the state should be doing more to provide access to health care for low-income adults. Sixty-four percent of Texas residents say the state government is not doing enough to make sure low-income adults in Texas can get the health care they need, while about a third (32 percent) say the state is doing enough in this area already (Figure 4). Responses are more evenly split when it comes to state efforts to help children and immigrants obtain health care; about equal shares say the state is doing enough and not doing enough to help each of these groups get the health care they need. On the other side of the spectrum, more Texans say the state is doing enough (50 percent) than say it is not doing enough (38 percent) to make sure pregnant women can get needed health care.
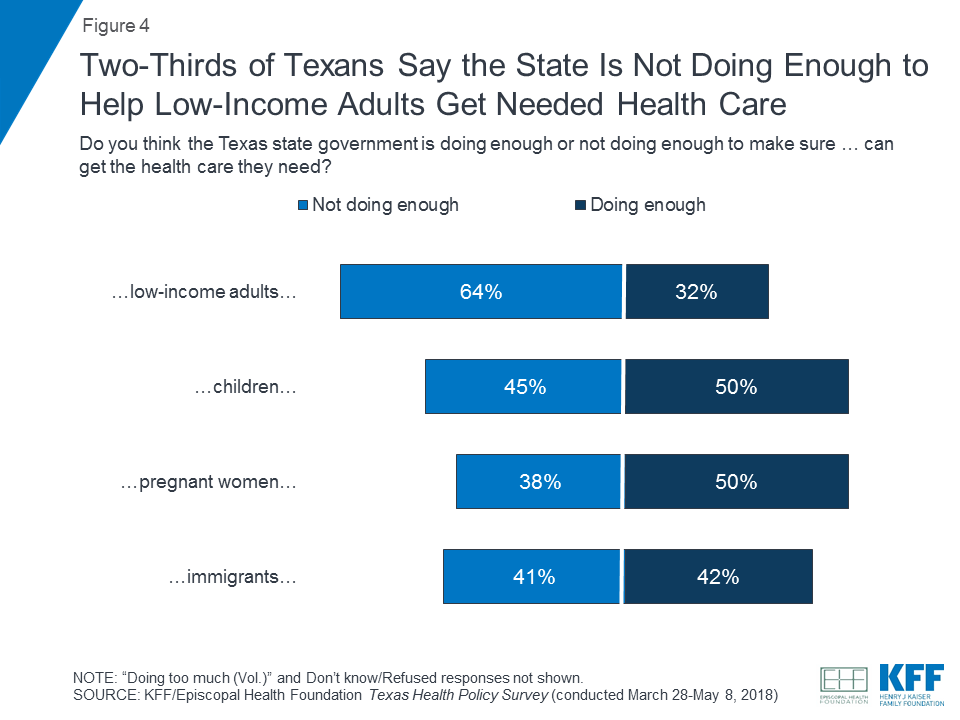
As is true on many questions of health care policy nationally, Democrats in Texas are more likely than Republicans to say the state is not doing enough to help each of these groups get the health care they need. Other demographic differences exist, too. For example, Black residents are more likely than either White or Hispanic Texans to say the state is not doing enough to help low-income adults, children, and pregnant women get needed health care, while both Black and Hispanic residents are more likely than White residents to say the same about immigrants. Similarly, residents with lower incomes are more likely than those with higher incomes to say the state should be doing more to help low-income adults and immigrants get health care. Those who were themselves born outside the U.S. are also more likely than U.S.-born Texans to say the state is not doing enough to help immigrants access care (Table 2).
| Table 2: Perceptions of State Efforts on Helping Different Groups Get Needed Health Care | |||||||||||
| Percent who say the state is not doing enough to help ______ get the health care they need: | Party Identification | Race/Ethnicity | Income (% of FPL) | Nativity | |||||||
| Dem. | Ind. | Rep. | White | Black | Hisp. | Less than 138% | 138%-250% | 250% or more | Native-born | Foreign-born | |
| Low-income adults | 80% | 69% | 43% | 58% | 83% | 65% | 74% | 65% | 57% | 64% | 62% |
| Children | 61 | 46 | 30 | 46 | 65 | 36 | 43 | 46 | 46 | 48 | 33 |
| Pregnant women | 55 | 41 | 17 | 37 | 52 | 34 | 39 | 41 | 37 | 40 | 30 |
| Immigrants | 61 | 43 | 16 | 27 | 54 | 53 | 51 | 41 | 34 | 37 | 56 |
Role of Federal and State Government in Health Care
To a certain extent, Texans’ ratings of the job the state is doing to help different groups access health care reflect underlying preferences about the level of government involvement in the health system. Overall, the vast majority of Texans feel that both the state and federal governments should play at least a minor role in making the health care system work well, with more seeing a major role for the state rather than the federal government (67 percent versus 54 percent, Figure 5).

Reflecting patterns often seen in surveys, partisans differ in their responses to questions about government involvement, particularly at the federal level. While 73 percent of Democrats and 57 percent of independents in Texas say the federal government should play a major role in making the health care system work well, just 28 percent of Republicans agree. Republicans are more likely to support state rather than federal government in health care, with a slim majority (53 percent) of Republicans saying the state should play a major role, along with 70 percent of independents and 78 percent of Democrats. Likely reflecting these partisan differences, Texans who are Black or Hispanic, have lower self-reported incomes, or live in urban areas are more likely than their White, higher-income, suburban and rural counterparts to say both the federal and state government should play a major role in the health care system (Table 3).
| Table 3: Views on the Role of Governments in Making the Health Care System Work Well | |||||||||||||
| Percent who say ______ should play a major role when it comes to making the health care system work well: | Party Identification | Race/Ethnicity | Income (% of FPL) | Geography | |||||||||
| Total | Dem. | Ind. | Rep. | White | Black | Hisp. | Less than 138% | 138%-250% | 250% or more | Urban | Sub-urban | Rural | |
| The federal government | 54% | 73% | 57% | 28% | 39% | 74% | 67% | 65% | 55% | 46% | 60% | 51% | 38% |
| State governments | 67 | 78 | 70 | 53 | 57 | 73 | 78 | 75 | 70 | 60 | 69 | 66 | 57 |
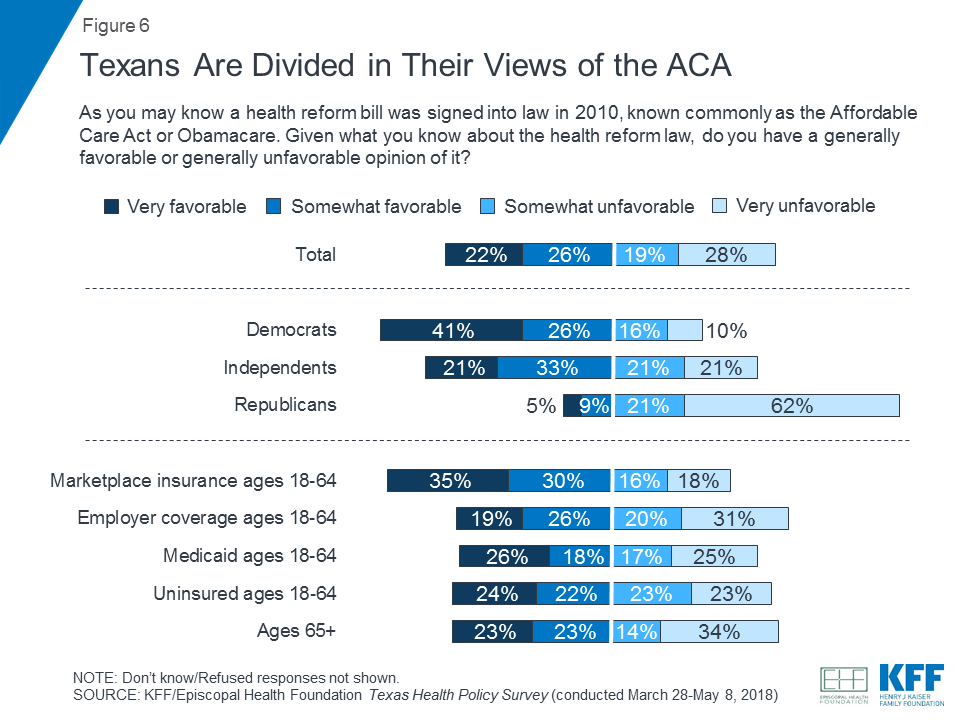
Texans’ Views of the Affordable Care Act
In addition to being divided on the role the federal government should play in the health care system, Texans are also divided in their view of the Affordable Care Act (ACA) – the most comprehensive federal health care legislation of the past several decades. Overall, 48 percent of Texas residents say they have a favorable view of the ACA and about an equal share (47 percent) say they have an unfavorable view (Figure 6). Nationally, the most recent Kaiser Health Tracking poll finds that 49 percent of U.S. adults have a favorable view of the law and 42 percent view it unfavorably.2 Like the nation overall, opinion of the ACA divides sharply along partisan lines in Texas, with two-thirds of Democrats (67 percent) expressing a favorable view of the law and about eight in ten Republicans (83 percent) expressing an unfavorable view. Those who get their insurance from the ACA marketplace are also more likely to express a favorable view of the law than those with employer coverage, Medicaid, the uninsured, or seniors (most of whom get coverage through Medicare).
Texans’ Views and Awareness of Medicaid
As one of 17 states that did not expand Medicaid under the ACA, low-income adults in Texas are eligible for Medicaid only if they meet certain criteria (i.e. people with disabilities, pregnant women, parents with very low incomes). Compared to other U.S. states, particularly those that have expanded Medicaid, adults covered by Medicaid in Texas mostly have very low incomes due to strict eligibility criteria. Roughly 4 million people are covered by Medicaid in Texas, nearly three-quarters of whom are children.3 Among non-elderly adults enrolled in Medicaid in Texas, 60 percent are women.4 Among all non-elderly individuals with Medicaid in Texas (including children), 57 percent are Hispanic, 22 percent are white, and 16 percent are Black,5 and 70 percent are in families with at least one full-time worker.6
Despite relatively strict eligibility criteria, the survey finds that about seven in ten Texas residents report some level of personal connection to the Medicaid program, similar to the share in national Kaiser Health Tracking polls.7 This includes 31 percent who say they personally have received help from Medicaid at some point (either directly receiving health insurance, getting help to pay their Medicare premiums, or having pregnancy-related care or long-term care paid for in part by Medicaid), 11 percent who say they’ve had a child covered by Medicaid, and 29 percent who say a close friend or family member has received help from Medicaid (Figure 7). Reflecting the demographic makeup of Medicaid recipients in Texas, the share reporting a personal connection to Medicaid in the survey is higher among women (78 percent), Hispanic and Black residents (78 percent each), and those with self-reported incomes below 250 percent of the federal poverty level (80 percent). The share reporting a personal connection to Medicaid is similar among Texans living in urban, suburban, and rural areas (71 percent, 70 percent, and 74 percent, respectively).

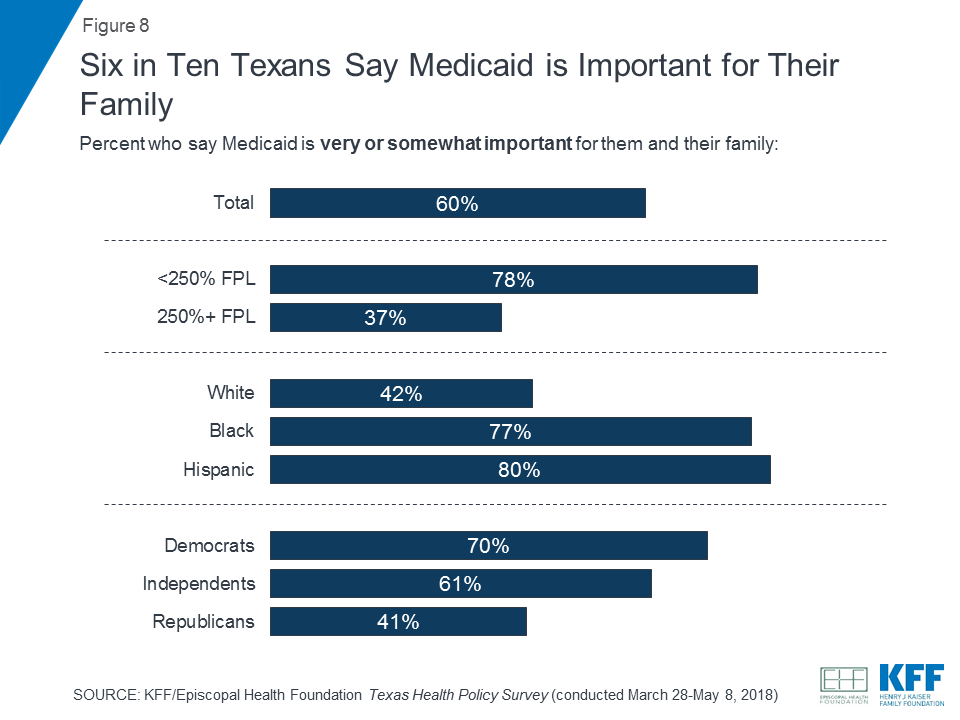
In addition to reporting personal connections to the program, six in ten Texans say Medicaid is either very important (41 percent) or somewhat important (19 percent) to them and their families (Figure 8). Again, the share saying Medicaid is personally important is higher among those with lower incomes as well as residents who are Black or Hispanic. Perhaps reflecting these demographic differences, there is also a partisan difference on this question, with Democrats and independents more likely than Republicans to say Medicaid is important for their families (70 percent, 61 percent, and 41 percent, respectively).
Seven in ten Texans (71 percent) express a very or somewhat favorable view of Medicaid, similar to the 74 percent of adults nationally who said the same in a KFF Tracking Poll in February 2018. In Texas, favorable views of Medicaid are expressed by majorities of both those with a personal connection to Medicaid (73 percent of those with any personal connection, including 76 percent of those currently covered) and those with no connection to the program (65 percent). While majorities across different demographic groups express a favorable view of Medicaid, Texans who are Black or Hispanic, have lower incomes, identify as Democrats, or are currently covered by the program are more likely than their counterparts to say they have a very favorable view of Medicaid (Table 4).
| Table 4: Views on Medicaid by Key Demographic Groups | |||||||||||||
| In general, do you have a favorable or an unfavorable opinion of Medicaid? | Party Identification | Race/Ethnicity | Income (% of FPL) | Medicaid Connection | |||||||||
| Total | Dem. | Ind. | Rep. | White | Black | Hisp. | Less than 138% | 138%-250% | 250% or more | Currently covered | Any connec-tion | No connec-tion | |
| NET Favorable | 71% | 78% | 71% | 60% | 64% | 72% | 78% | 75% | 66% | 70% | 76% | 73% | 65% |
| Very favorable | 34 | 45 | 32 | 22 | 23 | 45 | 44 | 45 | 34 | 24 | 50 | 37 | 25 |
| Somewhat favorable | 37 | 32 | 39 | 38 | 41 | 27 | 35 | 30 | 32 | 46 | 27 | 35 | 40 |
| NET Unfavorable | 26 | 20 | 24 | 36 | 31 | 25 | 19 | 20 | 28 | 27 | 21 | 25 | 29 |
| Somewhat unfavorable | 17 | 13 | 17 | 22 | 21 | 19 | 13 | 15 | 18 | 17 | 13 | 17 | 19 |
| Very unfavorable | 8 | 7 | 7 | 14 | 10 | 6 | 6 | 5 | 10 | 10 | 8 | 8 | 10 |
| NOTE: Don’t know/Refused responses not shown. | |||||||||||||
When asked whether Medicaid is working well for most low-income people covered by the program, six in ten Texans (60 percent) say it is working well, somewhat higher than the 52 percent of adults nationally who said so in a February 2018 KFF poll. Majorities across race/ethnicity, income, and political party in Texas say Medicaid is working well, as do 64 percent of those with a personal connection to Medicaid, including 68 percent of those who are currently covered by the program (Table 5).
| Table 5: Perceptions of the Medicaid Program on Low-Income People in Texas | |||||||||||||||||
| Would you say the current Medicaid program is working well for most low-income people covered by the program in Texas, or not? | Party Identification | Race/Ethnicity | Income (% of FPL) | Medicaid Connection | |||||||||||||
| Total | Dem. | Ind. | Rep. | White | Black | Hisp. | Less than 138% | 138%-250% | 250% or more | Currently covered | Any connec-tion | No connec-tion | |||||
| Working well | 60% | 59% | 58% | 63% | 53% | 54% | 71% | 66% | 60% | 56% | 68% | 64% | 49% | ||||
| Not working well | 33 | 38 | 36 | 28 | 38 | 41 | 24 | 30 | 35 | 35 | 30 | 32 | 38 | ||||
| Don’t know | 7 | 3 | 6 | 9 | 9 | 5 | 4 | 4 | 5 | 9 | 2 | 4 | 12 | ||||
| NOTE: Refused responses not shown. | |||||||||||||||||
While most Texans have a favorable view of Medicaid, knowledge about the program is somewhat mixed.
Texas is one of 17 states that haven’t expanded Medicaid to cover more low-income residents using mostly federal dollars. Most Texans say they favor expansion
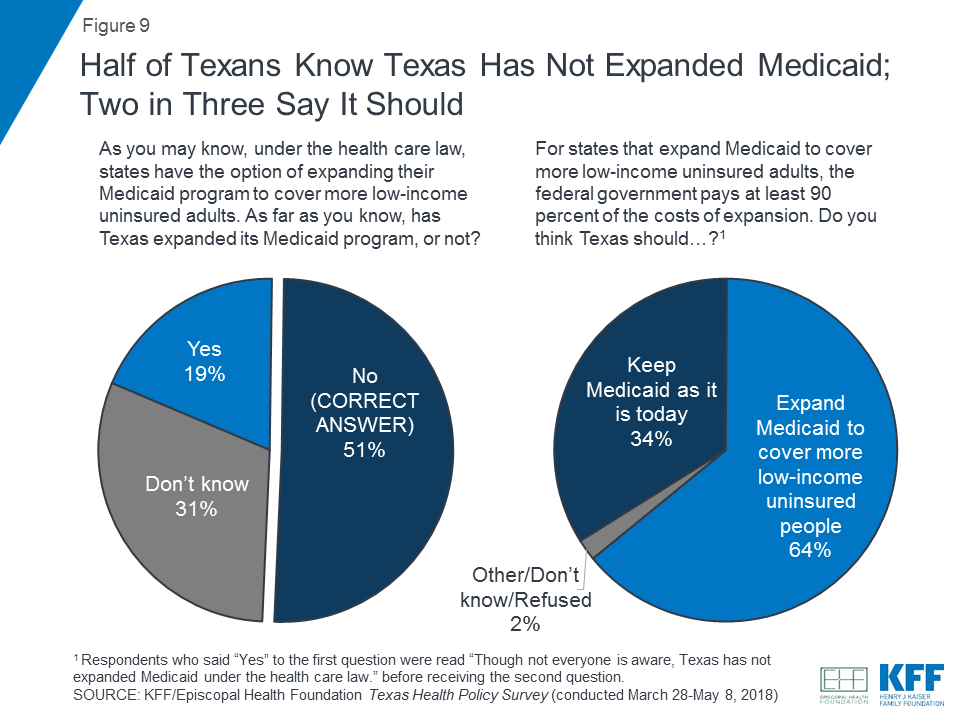
When asked whether Texas has expanded Medicaid under the ACA, about half (51 percent) of Texans correctly answer that the state has not expanded, but one in five (19 percent) incorrectly think it has expanded and three in ten (31 percent) say they don’t know. When asked whether they think Texas should expand Medicaid under the health care law, about two-thirds (64 percent) of Texans say the state should expand its program, while about a third (34 percent) say Medicaid should be kept as it is today (Figure 9).
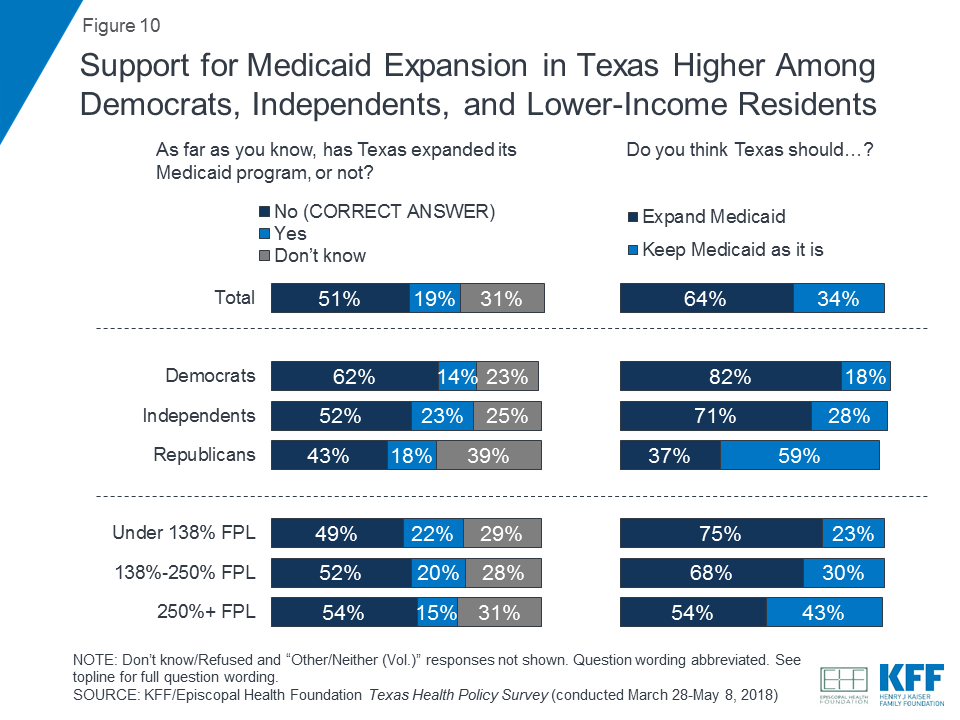
Partisans differ somewhat in both their awareness and opinions of state Medicaid expansion. Democrats are somewhat more likely than Republicans and independents to know that Texas has not expanded its Medicaid program (62 percent, 43 percent, and 52 percent, respectively). The difference is even bigger on the question of what the state should do, with Democrats more than twice as likely as Republicans to want Medicaid expansion in the state (82 percent versus 37 percent). In addition, large shares of Texans with lower incomes – who are more likely to benefit from Medicaid expansion in the state – support such an expansion (75 percent of those with incomes below 138 percent of the federal poverty level and 68 percent of those with incomes between 138 and 250 percent of poverty). Still, there is majority support for expansion in Texas among those who are less likely to be eligible for Medicaid under expansion themselves, with 54 percent of individuals with incomes at least 250 percent of the poverty level saying the state should expand Medicaid (Figure 10).
Methodology
The Kaiser Family Foundation/Episcopal Health Foundation Texas Health Policy Survey was conducted by telephone March 28 – May 8, 2018 among a random representative sample of 1,367 adults age 18 and older living in the state of Texas (note: persons without a telephone could not be included in the random selection process). Interviews were administered in English and Spanish, combining random samples of both landline (439) and cellular telephones (928, including 688 who had no landline telephone). Sampling, data collection, weighting and tabulation were managed by SSRS in close collaboration with Kaiser Family Foundation and Episcopal Health Foundation researchers. Episcopal Health Foundation paid for the costs of the survey fieldwork, and Kaiser Family Foundation contributed the time of its research staff. Both partners worked together to design the survey and analyze the results.
The sampling and screening procedures included an oversample component designed to increase the number of respondents ages 18-64 with Medicaid or non-group health insurance coverage. This included 180 respondents who were reached by calling back respondents in Texas who had previously completed an interview on either the SSRS Omnibus poll or the Kaiser Health Tracking Polls and indicated they fit one of the oversample criteria (based on age and type of health insurance coverage). It also included an oversample of counties with higher shares of Medicaid recipients.
The dual frame cellular and landline phone sample was generated by Marketing Systems Group (MSG) using random digit dial (RDD) procedures. All respondents were screened to verify that they resided in Texas. For the landline sample, respondents were selected by asking for the youngest adult male or female currently at home based on a random rotation. If no one of that gender was available, interviewers asked to speak with the youngest adult of the opposite gender. For the cell phone sample, interviews were conducted with the qualifying adult who answered the phone.
A multi-stage weighting design was applied to ensure an accurate representation of the Texas adult population. The first stage of weighting involved corrections for sample design, including accounting for oversampling of high-Medicaid counties, as well as non-response for the callback sample. In the second weighting stage, demographic adjustments were applied to account for systematic non-response along known population parameters. Population parameters included gender, age, race, Hispanicity (broken down by nativity), educational attainment, phone status (cell phone only or reachable by landline), state region, and residence in a low-income county. This stage excluded the Medicaid and non-group oversample components. Based on this second stage of weighting, estimates were derived for types of health insurance coverage (Medicaid, non-group, employer-sponsored, all else) in the Texas population. The last stage of weighting included all respondents and included health insurance coverage based on the previous stage’s outcomes. Weighting parameters were based on estimates from the U.S. Census Bureau’s March 2017 Current Population Survey (CPS), with the exception of population density of the respondent’s county of residence which was based on the 2010 Census, and telephone use (cell phone-only, landline-only, dual-user) which was based on data from the January-June 2016 National Health Interview Survey.
The margin of sampling error including the design effect for the full sample is plus or minus 3 percentage points. For results based on subgroups, the margin of sampling error may be higher. Sample sizes and margins of sampling error for subgroups are available by request. Note that sampling error is only one of many potential sources of error in this or any other public opinion poll. Kaiser Family Foundation public opinion and survey research is a charter member of the Transparency Initiative of the American Association for Public Opinion Research.
Endnotes
- Kaiser Family Foundation estimates based on the Census Bureau’s March Current Population Survey (CPS: Annual Social and Economic Supplements), 2014-2017, https://modern.kff.org/other/state-indicator/adults-19-64/ ↩︎
- Kirzinger A, Wu B, Munana C, and Brodie M, Kaiser Health Tracking Poll: Preview of the Role of Health Care in the 2018 Midterm Campaigns, May 2018, https://modern.kff.org/health-costs/poll-finding/kaiser-health-tracking-poll-preview-role-of-health-care-2018-midterm-campaigns/ ↩︎
- Texas Health and Human Services, Healthcare Statistics, data for February 2018 accessed May 31, 2018: https://hhs.texas.gov/about-hhs/records-statistics/data-statistics/healthcare-statistics ↩︎
- Kaiser Family Foundation estimates based on the Census Bureau’s March Current Population Survey (CPS: Annual Social and Economic Supplements), 2014-2017, https://modern.kff.org/medicaid/state-indicator/distribution-by-gender-4/ ↩︎
- Kaiser Family Foundation estimates based on the Census Bureau’s March Current Population Survey (CPS: Annual Social and Economic Supplements), 2014-2017, https://modern.kff.org/medicaid/state-indicator/distribution-by-raceethnicity-4/ ↩︎
- Kaiser Family Foundation estimates based on the Census Bureau’s March Current Population Survey (CPS: Annual Social and Economic Supplements), 2014-2017, https://modern.kff.org/medicaid/state-indicator/distribution-by-employment-status-4/ ↩︎
- Kirzinger A, Wu B, and Brodie M, Kaiser Health Tracking Poll – February 2018: Health Care and the 2018 Midterms, Attitudes Towards Proposed Changes to Medicaid, March 2018, https://modern.kff.org/health-reform/poll-finding/kaiser-health-tracking-poll-february-2018-health-care-2018-midterms-proposed-changes-to-medicaid/ ↩︎