The Health Care Priorities and Experiences of California Residents
Introduction
California, the nation’s most populous state and one with a diverse population in terms of race, ethnicity, income, and geography, has often been at the leading edge of national health care trends. A state that fully embraced the Affordable Care Act (ACA), California has the nation’s largest Medicaid program (known in the state as Medi-Cal) with a total enrollment of over 13 million, and the second-largest ACA marketplace enrollment of nearly 1.5 million, just behind Florida. California’s newly-elected governor, Gavin Newsom, made health care a prominent part of his campaign platform in 2018, and announced a sweeping set of health care proposals soon after being sworn in in January 2019.
In late 2018, the Kaiser Family Foundation and the California Health Care Foundation conducted a representative survey of the state’s residents to gauge their views on health policy priorities facing the state, as well as their experiences in the health care system. Key findings from the survey are presented here.
Key Findings: Section 1: Priorities For State Government
As the new governor takes office and a new legislative session begins, health care is an important priority for California residents. Making health care more affordable ranks high on Californians’ list of overall priorities for the new governor and legislature to address, with 45 percent calling it an “extremely important” priority, ranking just behind improving public education (48 percent say this is “extremely important”) and just ahead of affordable housing (40 percent). [Figure 1]
While health care affordability ranks second on the priority list for both Democrats and independents (behind education for each group), it ranks lower for Republicans, whose top priority is immigration enforcement. [Figure 2]
In a new @KaiserFamFound/ @CHCFNews poll, access to mental health care tops California residents’ health care priorities for the new governor and state legislature to address.
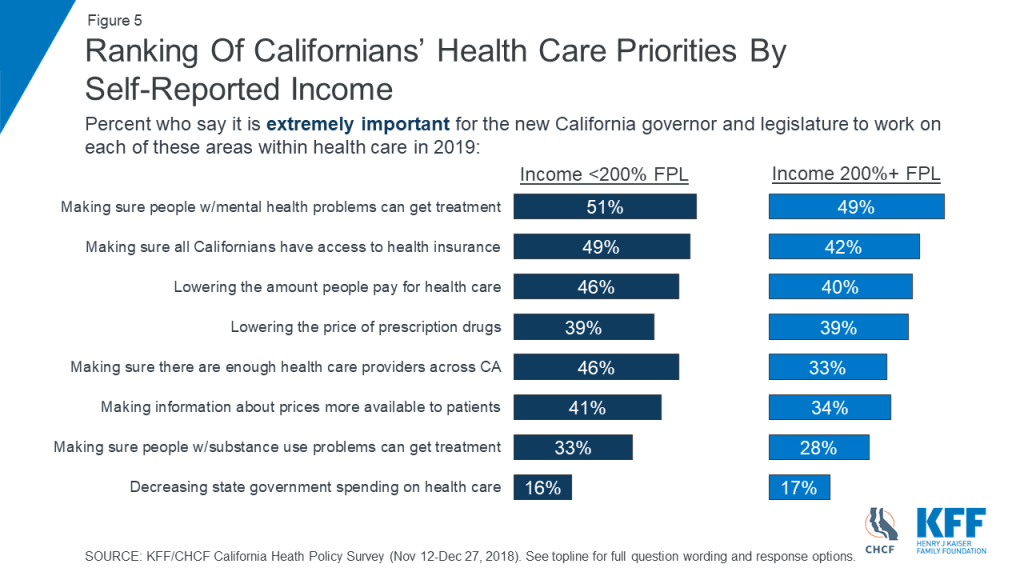
There is broad support for many health care priorities in the state, with the exception of decreasing state government spending on health care. Making sure people with mental health problems can get the treatment they need was identified by 88 percent of Californians as an “extremely” or “very” important priority (including 49 percent “extremely” important). At least three-quarters also see other health priorities as at least “very important,” including making sure Californians have access to health insurance coverage (78 percent, including 45 percent “extremely” important); lowering the amount people pay for health care (81 percent, 41 percent “extremely”); lowering the price of prescription drugs (75 percent, 39 percent “extremely”); making sure there are enough health care providers across California (77 percent, 38 percent “extremely”); and making information about medical prices more available (76 percent, 37 percent “extremely”). [Figure 3]
The survey finds some areas of bi-partisan agreement when it comes to health care priorities in the state, and other areas where priorities differ for residents with different partisan identification. For example, mental health is an area of agreement: ensuring access to mental health treatment is seen as an extremely important priority by substantial shares of Democrats (54 percent), independents (46 percent), and Republicans (43 percent), and ranks in the top two health care priorities for each of these groups. There is less agreement between people of different political parties when it comes to some other priorities. For example, Democrats and independents are much more likely than Republicans to view ensuring access to insurance coverage as an “extremely important” priority (56 percent, 44 percent, and 21 percent, respectively). [Figure 4]
The ranking of most health care priorities is similar across income levels. However, those with lower self-reported incomes (below 200 percent of the federal poverty level) are more likely than those with higher incomes to say making sure there are enough doctors, nurses, and other health care providers across California should be extremely important for the state government to work on in 2019 (46 percent versus 33 percent). [Figure 5]
Figure 1
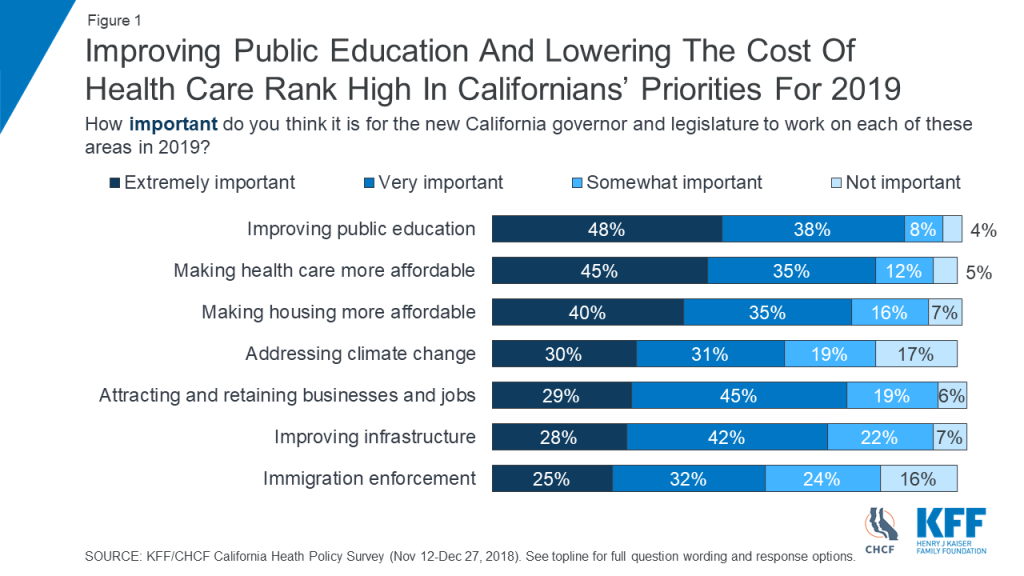
Figure 2
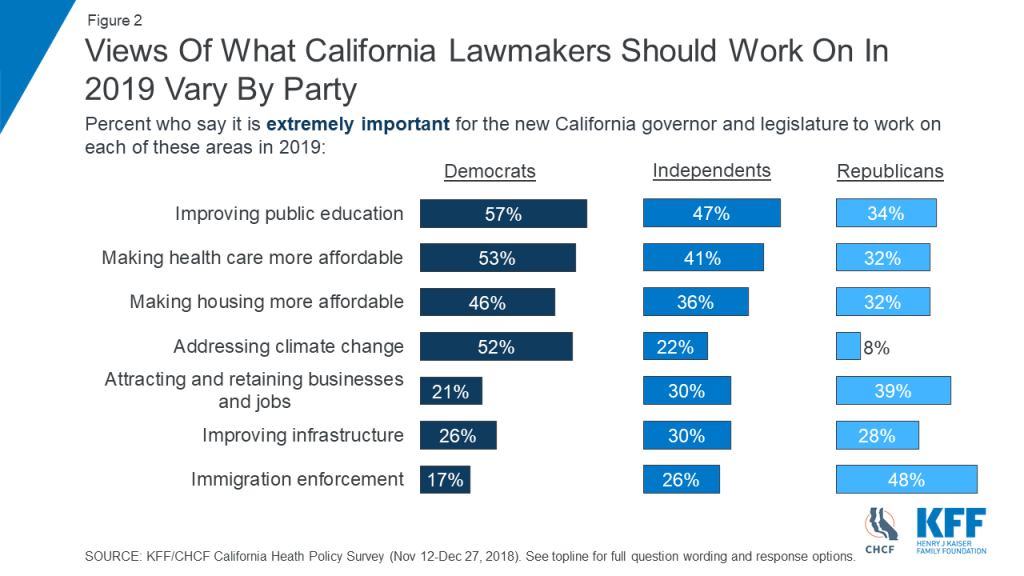
Figure 3
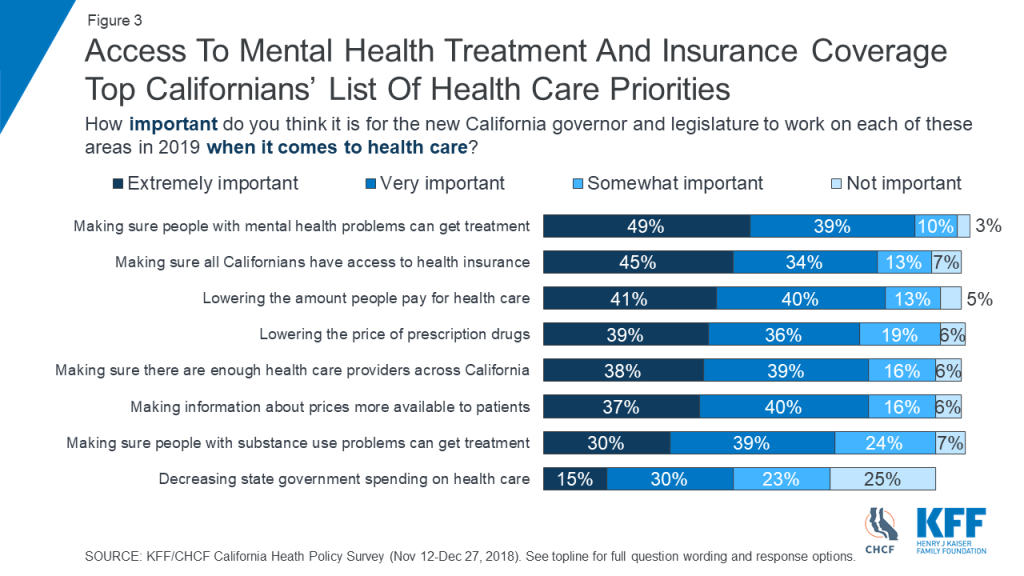
Figure 4
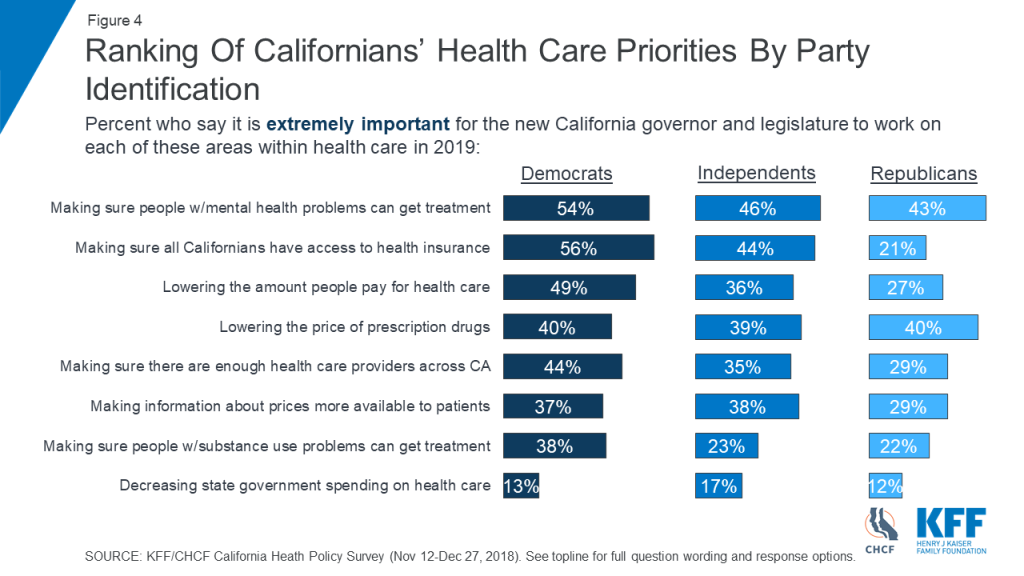
Figure 5
Key Findings: Section 2: Mental Health Coverage And Access To Treatment
As noted above, making sure people with mental health problems can get treatment tops the list of California residents’ health care priorities for the state government to address. This may be related to the fact that about half (52 percent) of Californians say their community does not have enough mental health providers to serve the needs of local residents, compared to 27 percent who say it does have enough and 21 percent who say they don’t know enough to say. In four of the six California regions broken out in the survey, majorities of residents say their community does not have enough mental health providers to serve residents’ needs, with the highest share in Los Angeles County (58 percent). [Figure 6]
In addition, Californians who are Black (75 percent) or Hispanic (57 percent) are more likely than those who are white (49 percent) or Asian (42 percent) to feel their community lacks adequate numbers of mental health providers, and women are somewhat more likely than men to feel this way (57 percent versus 47 percent). [Figure 7]
About a quarter (24 percent) of California residents say that they or a family member sought counseling or treatment for a mental health condition in the past 12 months. [Figure 8] Among this group, nearly two-thirds (63 percent) say their community does not have enough providers.
More broadly, a majority (57 percent) of state residents think that most people with mental health conditions in California are not able to get the services they need, and nearly half (48 percent) say the same about people with alcohol or drug use problems. [Figure 9]
Again, these shares are higher among those who have sought such services: 66 percent of those who say they or a family member sought services for a mental health condition say most Californians are not able to get needed mental health services. Similarly, 61 percent of those who say they or a family member sought treatment for substance use problems say most Californians are not able to get needed treatment services. [Figure 10]
Access to mental health treatment may be a particular issue for residents with Medi-Cal coverage. Among non-elderly Medi-Cal enrollees who say they or a family member sought counseling or treatment for a mental health condition in the past 12 months, four in ten (42 percent) say there was a time when they had to wait longer than they thought was reasonable to get an appointment for these services. Among all Californians who say someone in their family sought mental health treatment, this share is about one quarter (23 percent). [Figure 11]
Treatments for mental health and substance use disorders are widely seen by Californians as effective. About three-quarters (76 percent) of state residents say that counseling and medical treatment is very effective in helping people with mental health conditions lead healthy and productive lives, and a similar share (73 percent) say the same about people with alcohol or drug use problems. [Figure 12]
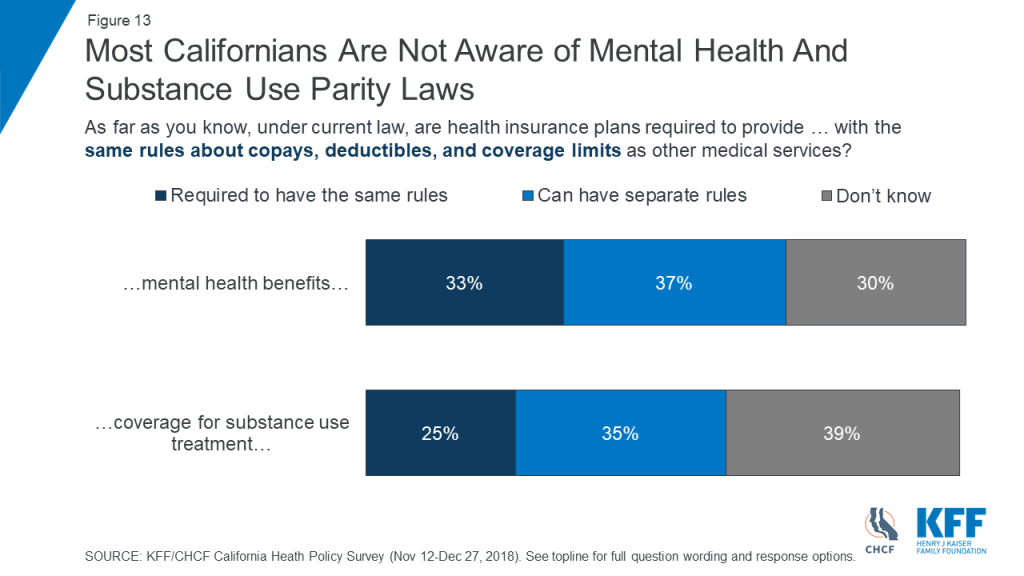
Despite the high priority placed on this issue, few Californians are aware of mental health parity laws that require health insurance plans to provide mental health and substance use disorder treatment benefits that are on par with benefits for other medical services1 . One third (33 percent) know that insurance plans are required to provide mental health benefits with the same rules about cost-sharing and coverage limits as other medical services, and just a quarter know this is the case for coverage of substance abuse treatment. [Figure 13]
Figure 6

Figure 7
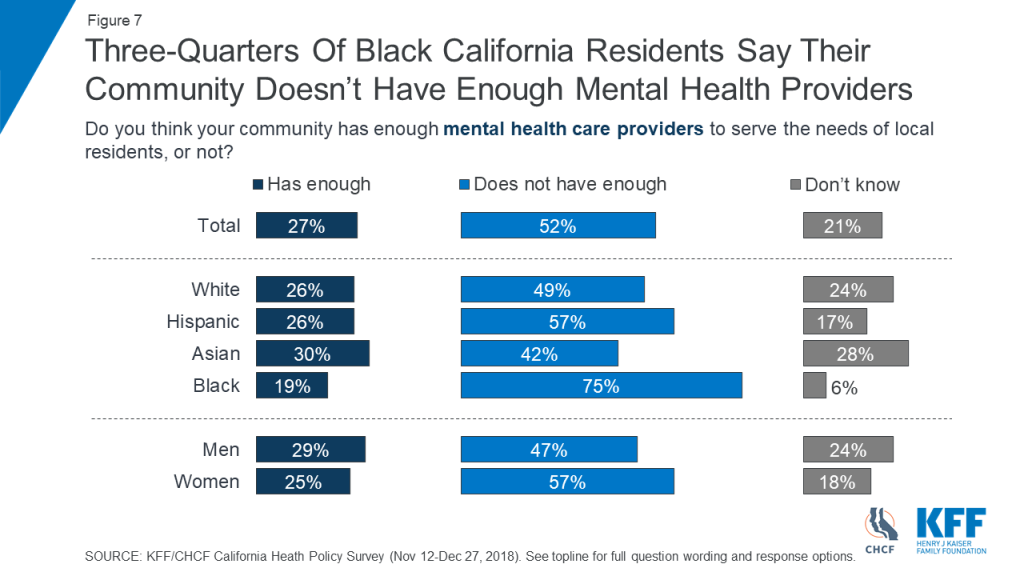
Figure 8
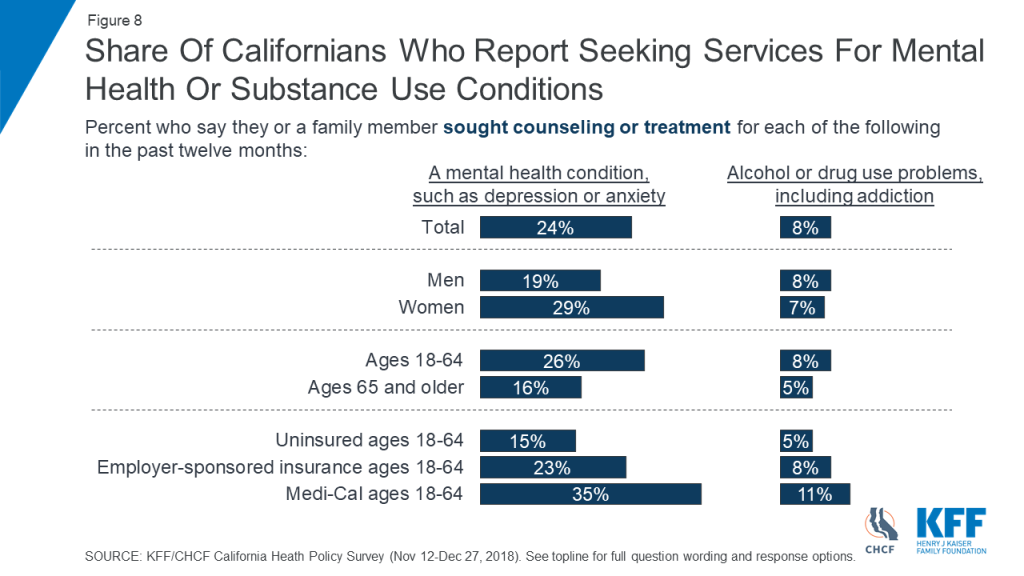
Figure 9

Figure 10
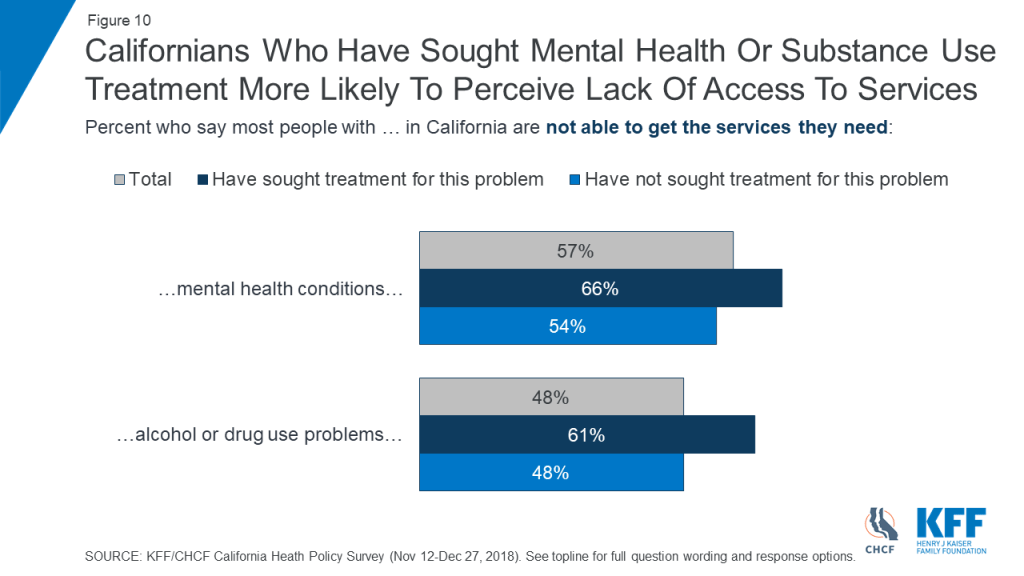
Figure 11

Figure 12
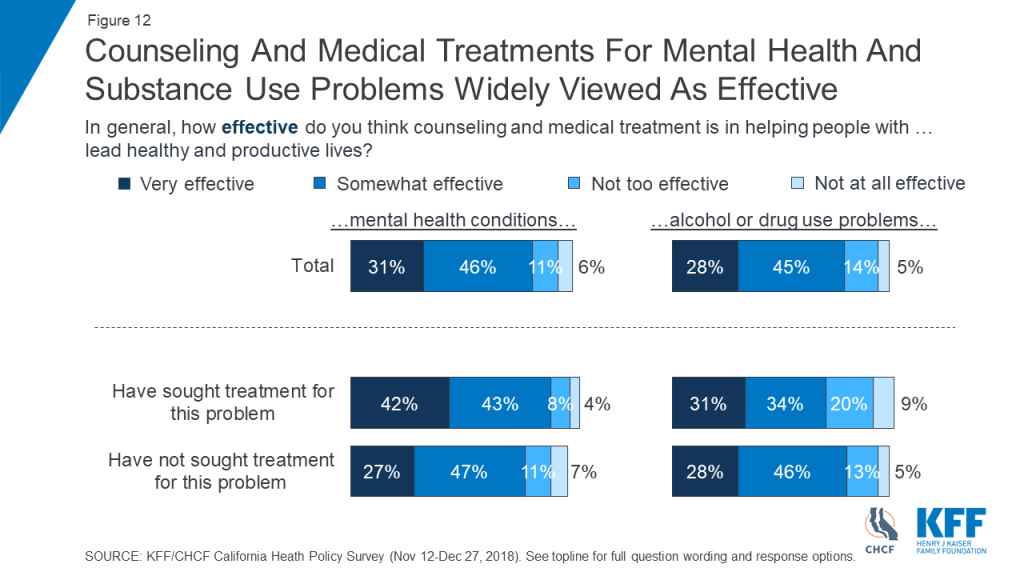
Figure 13
Key Findings: Section 3: Insurance Coverage, Including The Aca, Covered California, Medi-cal, And Single-payer
Views of the Affordable Care Act (ACA) are slightly more favorable in California than they are in the nation as a whole, with 58 percent having a favorable view of the law and 30 percent having an unfavorable view. [Figure 14] In the January 2019 KFF Health Tracking Poll, views of the law nationally were 51 percent favorable and 40 percent unfavorable. This difference is likely due to the fact that Californians lean more Democratic in their party identification than the nation as a whole.
Most Californians also believe the state marketplace, Covered California, is working well (56 percent). Views of both the ACA and the state marketplace are divided along party lines. [Figure 15]
As is true nationally, Medi-Cal, the state Medicaid program, is more popular than the ACA, including across parties. Seven in ten California residents overall have a favorable opinion of Medi-Cal, including large majorities of Democrats (82 percent) and independents (67 percent) and about half (53 percent) of Republicans. [Figure 16] In addition, an overwhelming majority of residents say that Medi-Cal is very or somewhat important for the state of California (91 percent), including large majorities of Democrats (97 percent), independents (90 percent), and Republicans (80 percent). A majority (59 percent) of state residents say the Medicaid program is important for their own family, including about six in ten Democrats and independents (62 percent each) and four in ten Republicans (39 percent). [Figure 17]
While large majorities across income levels and racial/ethnic groups say Medi-Cal is important for the state of California, people who are Black or Hispanic, and those with self-reported incomes below 200 percent FPL are much more likely than their counterparts to say the program is important for their own family. [Figure 18]
Despite high levels of support for the program, misperceptions about Medi-Cal are common. Fewer than four in ten state residents (37 percent) are aware that most working age adults without disabilities who have health insurance through Medi-Cal are working, while a similar share (42 percent) believe most are unemployed and 20 percent say they don’t know. [Figure 19] In fact, 62 percent of non-elderly, non-disabled adults enrolled in Medi-Cal were employed in 2016.2
While making sure Californians have access to health insurance coverage is near the top of the list of Californians’ health care priorities for the new governor and legislature, views are somewhat divided on achieving this through a single-payer health plan in the state. About half the public (48 percent) favors such a plan, while four in ten are opposed. Notably, six in ten California Republicans (62 percent) strongly oppose such a plan, while about half as many Democrats (32 percent) strongly favor it. [Figure 20]
As with national polling, support for single-payer in the state is malleable; support can be pushed as high as 63 percent when opponents are told such a plan would ensure all Californians would have coverage [Figure 21], while opposition can be pushed up to 59 percent when tax increases are mentioned. [Figure 22]
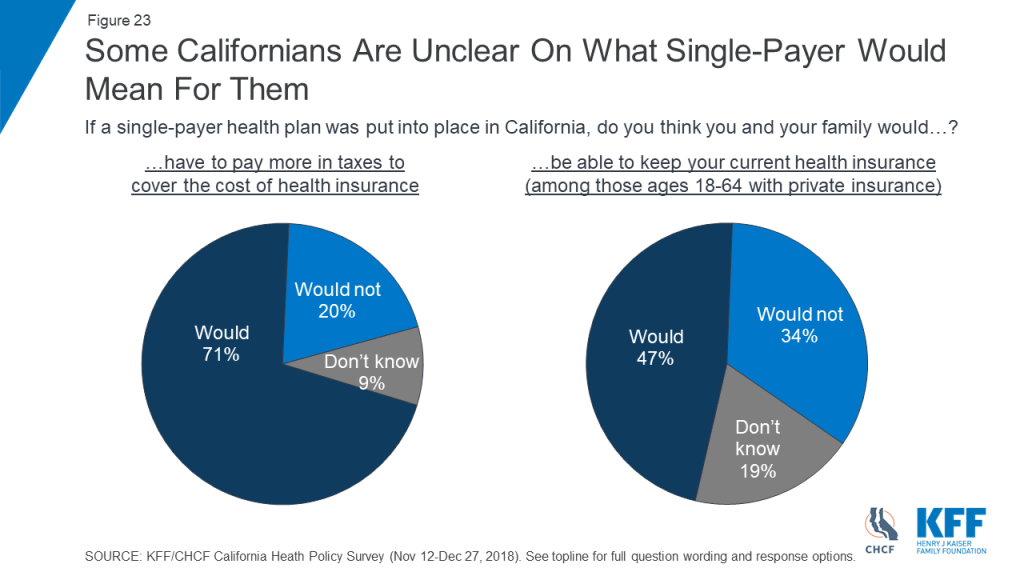
While most Californians (71 percent) believe their family would have to pay more in taxes if a single-payer plan were implemented, nearly half (47 percent) of those ages 18-64 with private insurance incorrectly think they’d be able to keep their current coverage under such a plan. [Figure 23]
Figure 14
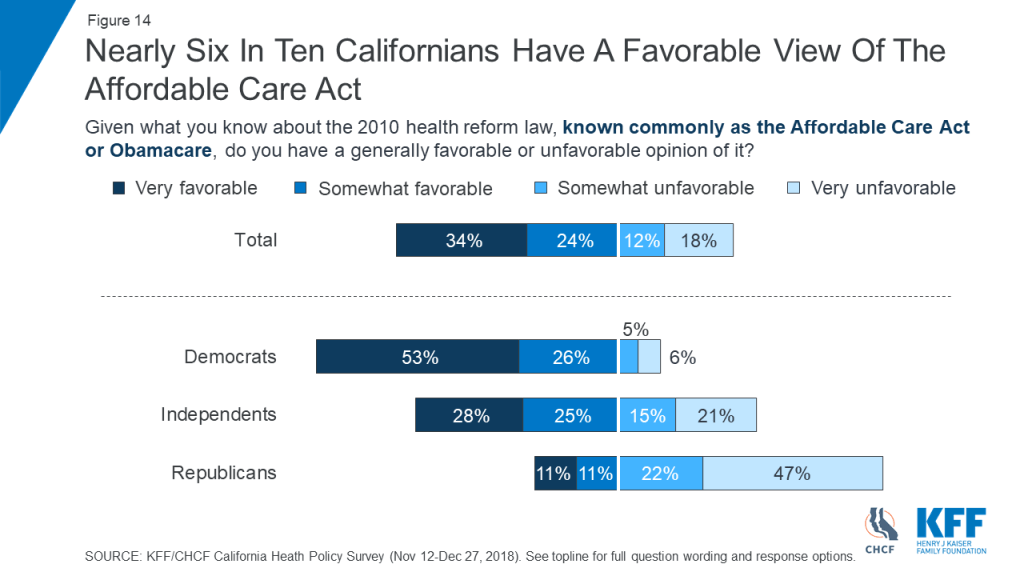
Figure 15

Figure 16
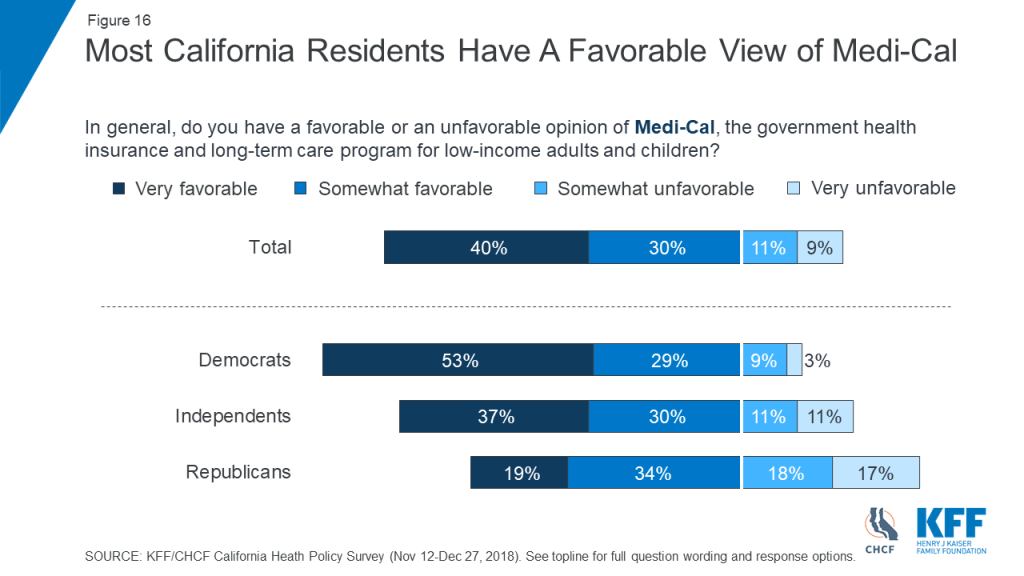
Figure 17

Figure 18
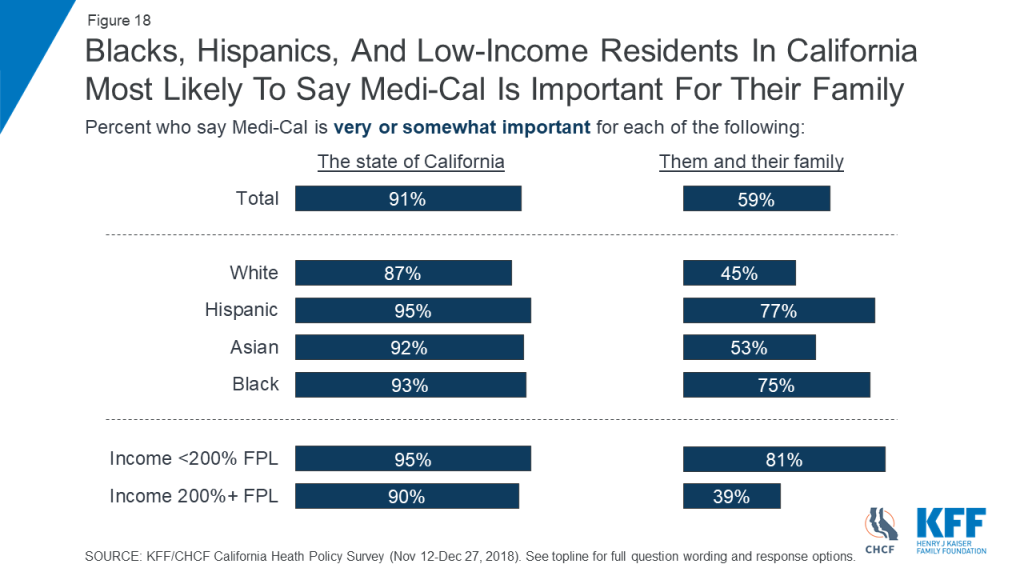
Figure 19
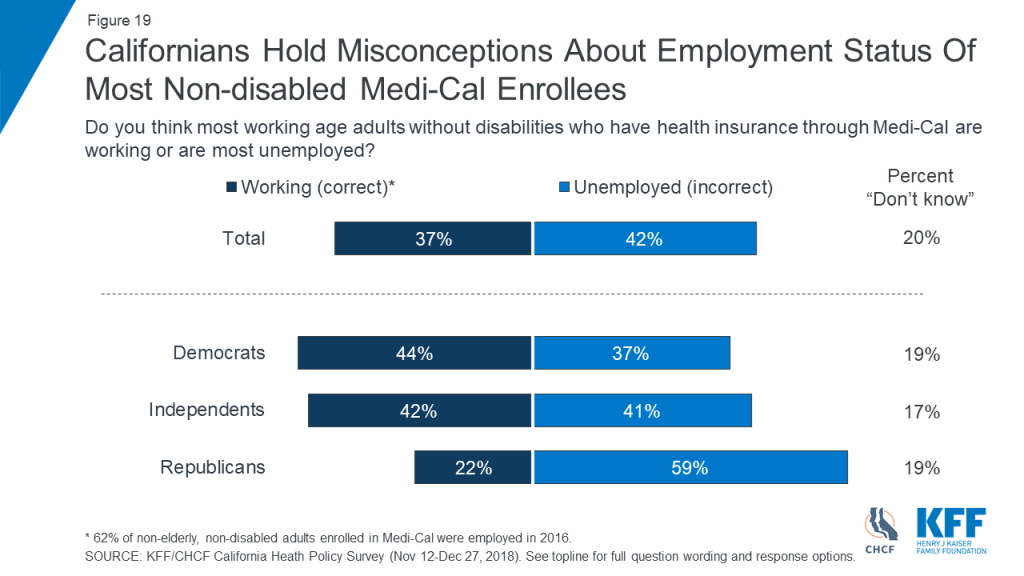
Figure 20
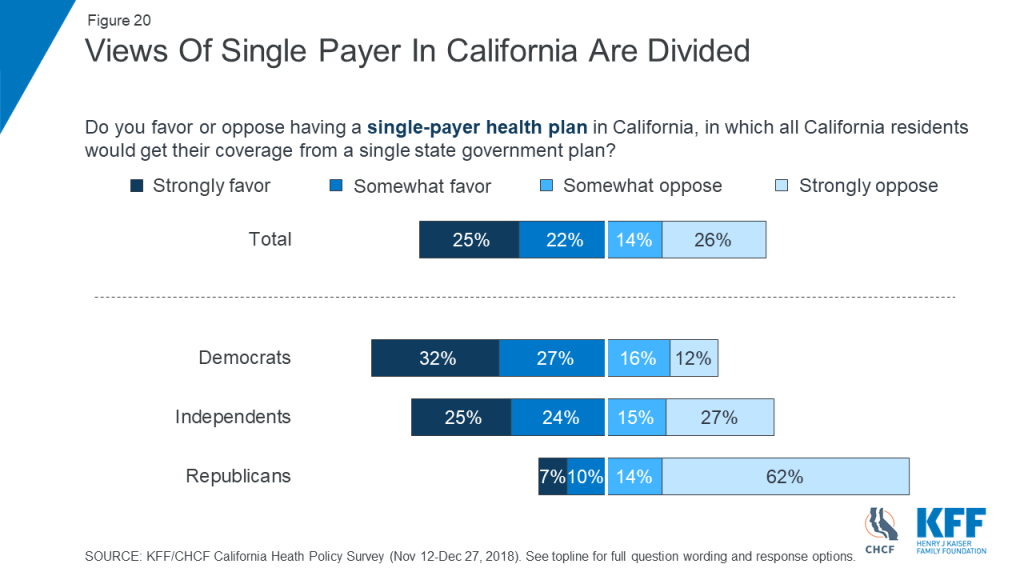
Figure 21

Figure 22
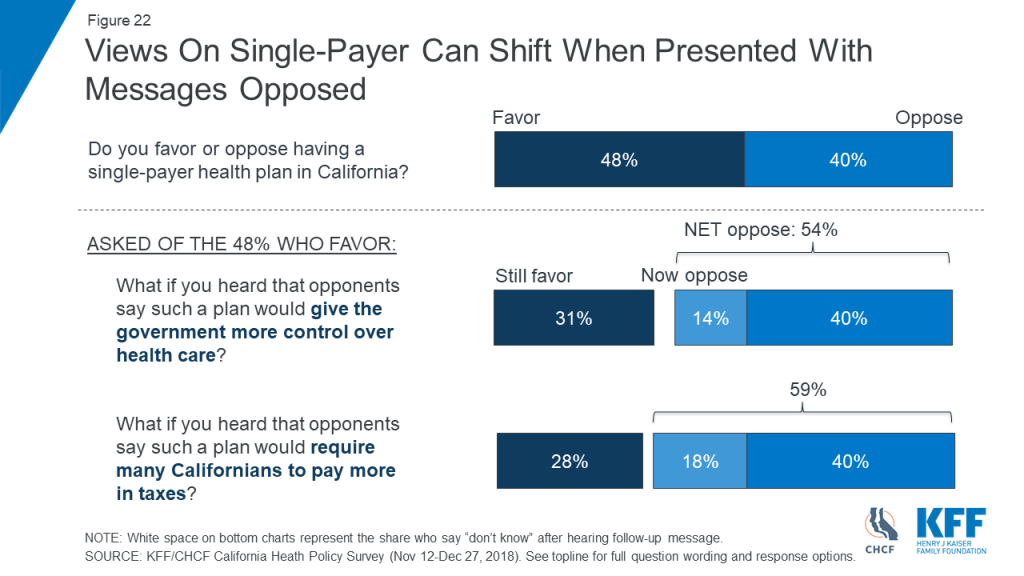
Figure 23
Key Findings: Section 4: Access To Providers And Provider Shortages
About three-quarters (77 percent) of Californians say that “making sure there are enough doctors, nurses, and other health care providers across California” should be an important priority for the state government to address, including 38 percent who call it an “extremely important” priority. About a third of California residents say their community doesn’t have enough primary care doctors (35 percent) or specialists (33 percent) to serve the needs of local residents, and about a quarter (27 percent) say it doesn’t have enough hospitals. [Figure 24]
People who are Black or Hispanic, those with lower incomes, as well as those living in the San Joaquin Valley and the Inland Empire are more likely than their counterparts to say their community lacks adequate numbers of providers. [Figure 25, Figure 26, and Figure 27] These responses are in line with data showing the distribution of both primary and specialty care providers is uneven across the state.3
In addition, waiting times for appointments are an issue for some residents, particularly those with lower incomes and those with Medi-Cal coverage. Nearly a quarter (23 percent) of all state residents say there was a time in the past year when they had to wait longer than they thought was reasonable for an appointment for medical care, rising to 33 percent of those with Medi-Cal coverage. [Figure 28]
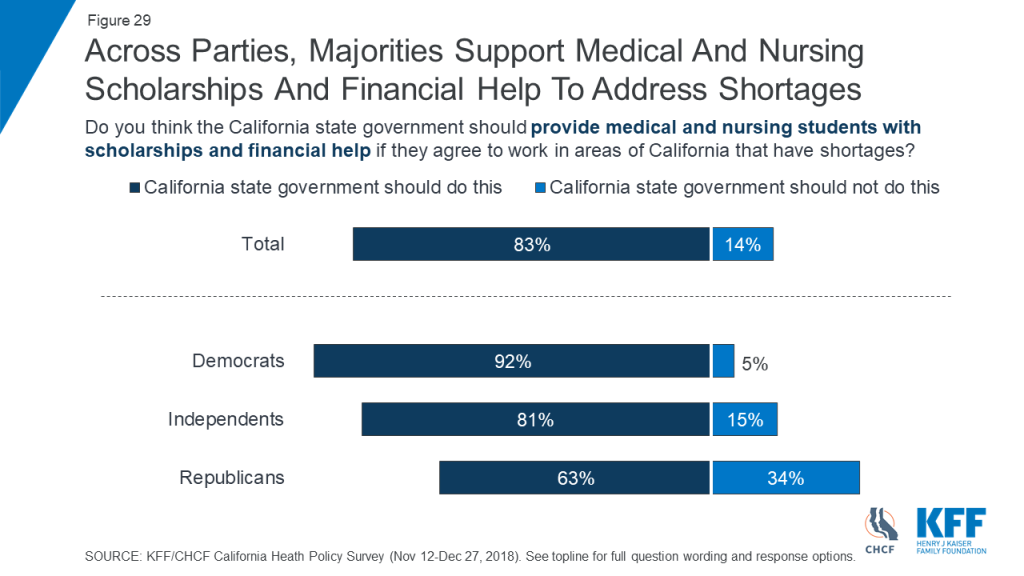
There is broad support (including across parties) for the state government providing medical and nursing students with scholarships and financial help if they agree to work in areas of the state with provider shortages. [Figure 29]
Figure 24

Figure 25

Figure 26
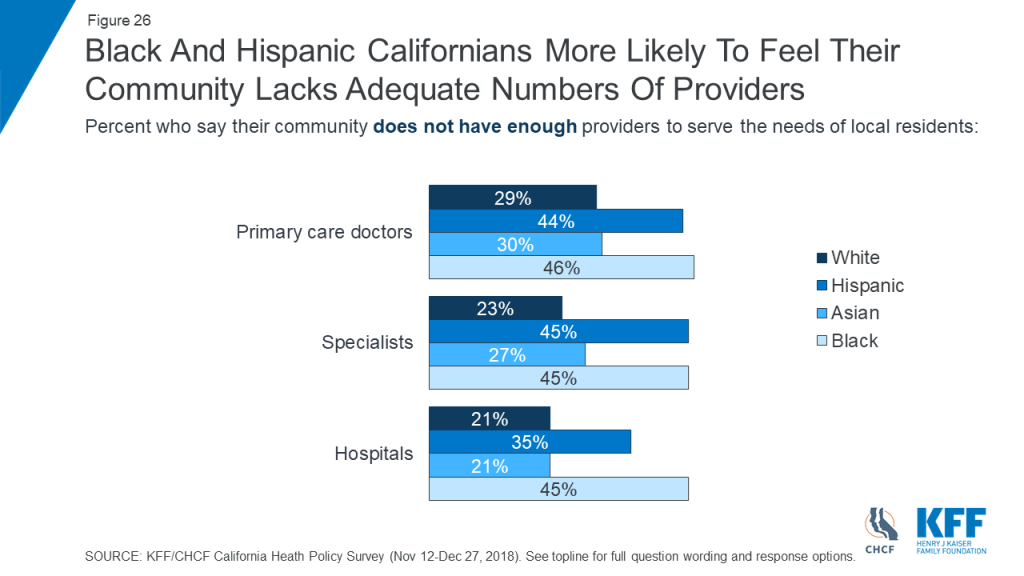
Figure 27

Figure 28
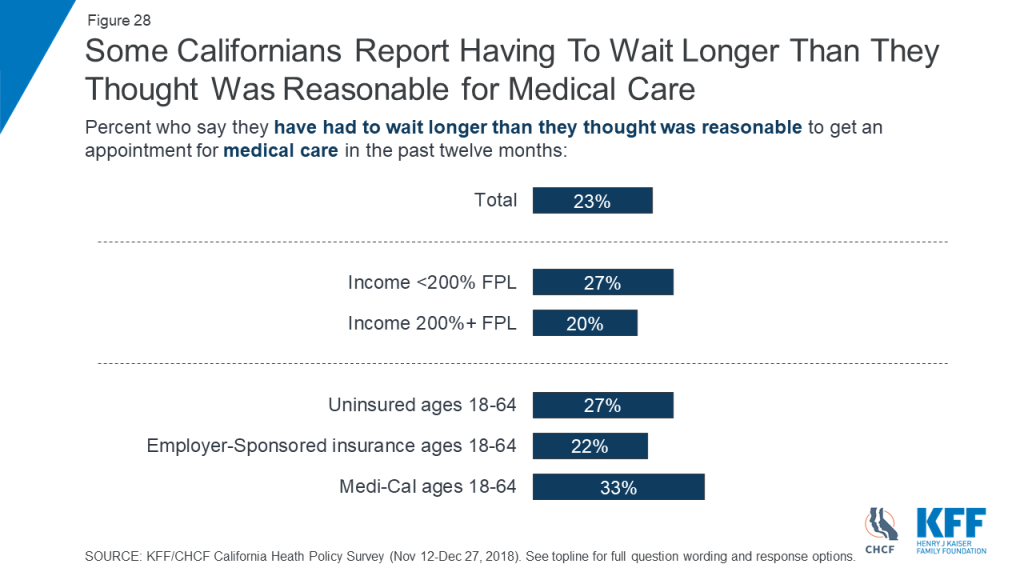
Figure 29
Key Findings: Section 5: Experiences With Health Care Affordability
As noted above, making health care more affordable ranks second in the public’s overall priority list for the incoming administration, just behind improving public education. One reason for this may be people’s own experiences affording health care for themselves and their families. For example, one in five California residents (20 percent) reports problems paying medical bills, rising to three in ten among those with a debilitating medical condition (34 percent), those ages 18-64 who are on Medi-Cal (31 percent) or without health insurance (31 percent), and those with self-reported incomes below 200 of the federal poverty level (29 percent). Problems paying medical bills are also more common among California residents who are Black (30 percent) or Hispanic (28 percent) compared with those who are white (16 percent) or Asian (8 percent). [Figure 30]
Many of those struggling to pay medical bills report having to make certain sacrifices to pay off their bills. For example, about seven in ten of those with bill problems report cutting spending on basic household items (72 percent), two-thirds report putting off vacations or major purchases (66 percent), and 61 percent report using up all or most of their savings to pay their medical bills. [Figure 31]
Unexpected medical bills are also a problem for those with insurance. Three in ten non-elderly Californians with health insurance (31 percent) say there was a time in the past year when they received a medical bill they thought was covered, but their insurance did not cover the bill at all or paid less than they expected. About four in ten of this group (12 percent of all insured Californians) say this happened because the provider was not in their plan’s network. [Figure 32]
Whether or not they have personally experienced such bills, unexpected medical bills represent a large financial worry for Californians. Nearly two-thirds (63 percent) say they are very or somewhat worried about being able to afford unexpected medical bills, ranking higher than worries about affording out-of-pocket medical costs in general (56 percent), prescription drug costs (42 percent), or health insurance premiums (39 percent of those with insurance). Worries about surprise medical bills outrank worries about affording other basic needs, such as transportation costs (53 percent), housing costs (52 percent), and utilities (47 percent). [Figure 33]
Just a third (34 percent) of those with health insurance are aware that California law (through Assembly Bill No. 72 passed in 20174 ) prohibits providers from charging out-of-network prices for care received at in-network hospitals. [Figure 34]
Challenges affording care also may lead some Californians to delay or forgo medical treatments or prescription drugs. Over four in ten residents (44 percent) say they or another family member in their household has postponed or skipped care in the past year because of the cost, including skipping dental care or check-ups (30 percent), putting off or postponing getting health care (20 percent), skipping recommended tests or treatments (19 percent), not filling a prescription for medicine (18 percent), cutting pills in half or skipping doses of a medicine (12 percent), or putting off or postponing getting mental health care (10 percent). [Figure 35]
Californians with lower incomes, those without health insurance, and Black and Hispanic residents are more likely than their counterparts to experience problems paying medical bills, postponing or forgoing health care because of the cost, and worries about affording care. For example, those with self-reported incomes below 200% FPL are almost twice as likely as those with higher incomes to report problems paying medical bills in the past year, and much more likely to report skipping or delaying care (55 percent versus 36 percent). They are also almost twice as likely to say they are very worried about affording unexpected medical bills or general out-of-pocket health care costs. [Figure 36]
Similarly, uninsured Californians are more likely than those with insurance to report medical bill problems (31 percent versus 21 percent), and to say they are very worried about affording unexpected medical bills (63 percent versus 37 percent) or out-of-pocket costs (56 percent versus 30 percent). [Figure 37]
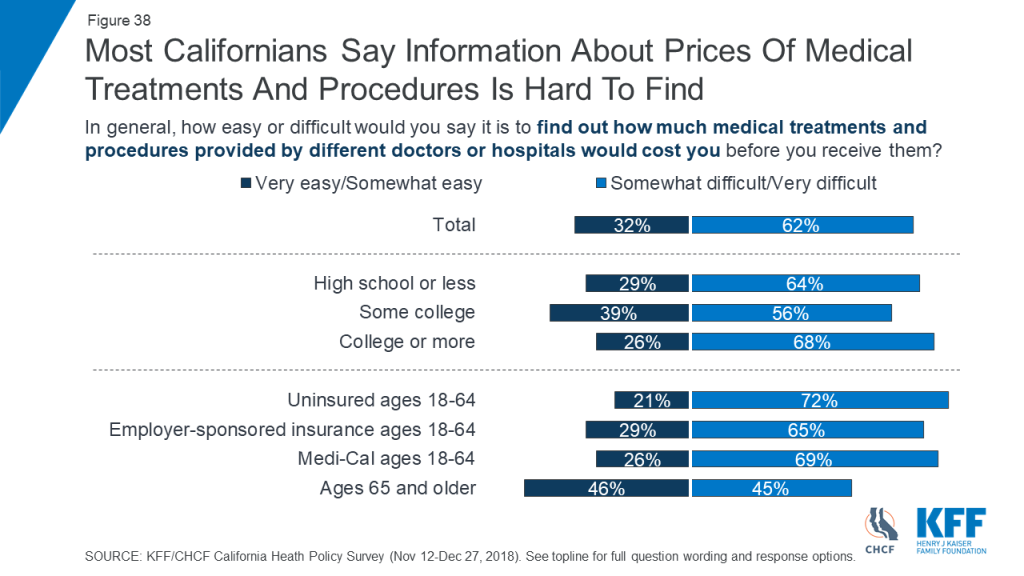
While numerous public and private initiatives seek to increase cost transparency for individuals, most Californians (62 percent) say it is difficult to find out how much different medical treatments and procedures provided by different doctors and hospitals would cost before they receive them. [Figure 38] As noted above, 76 percent of Californians think it is extremely or very important for the new governor and legislature to work on making information about provider costs more widely available.
Figure 30
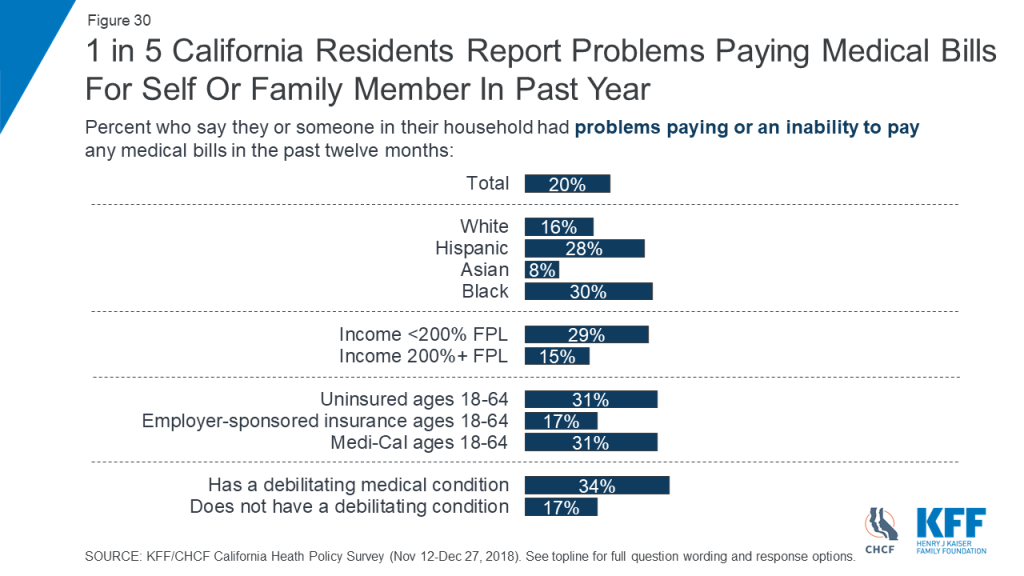
Figure 31

Figure 32
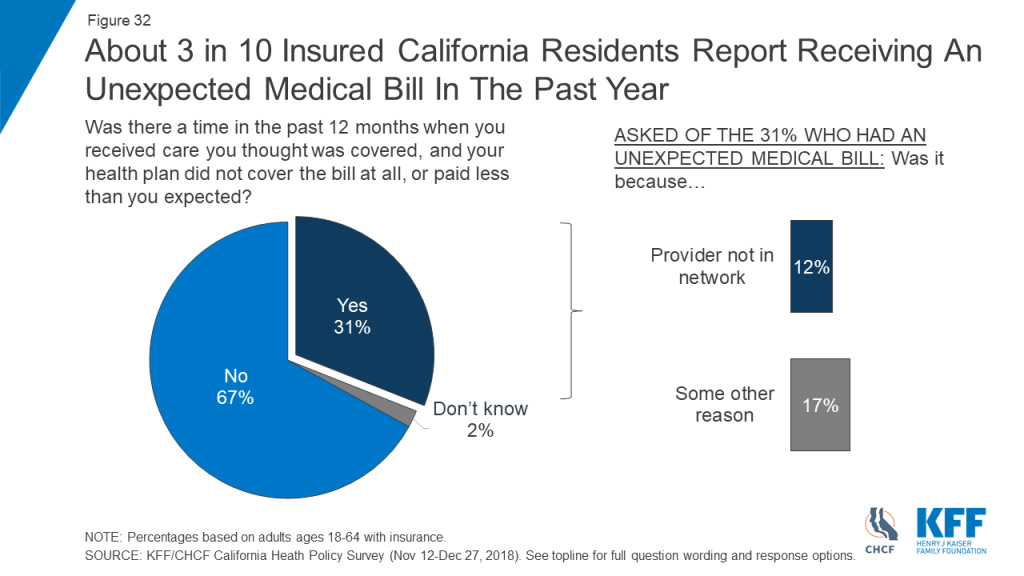
Figure 33
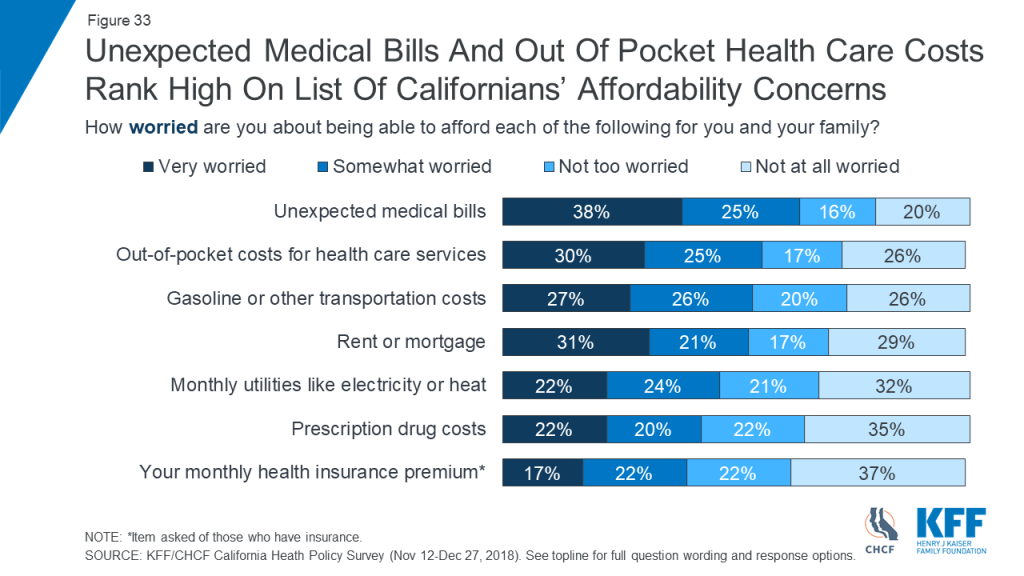
Figure 34

Figure 35
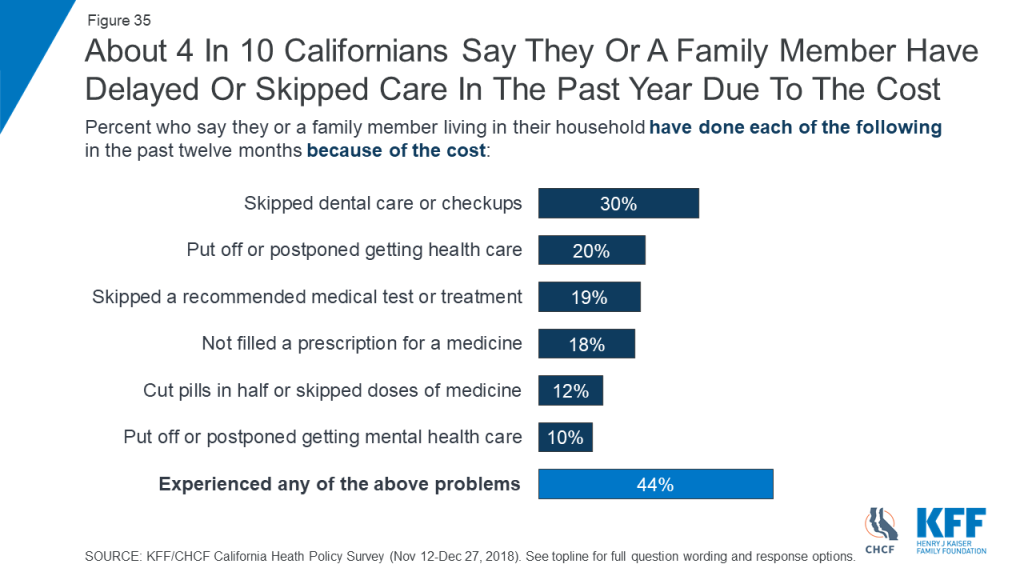
Figure 36

Figure 37

Figure 38
Key Findings: Section 6: Experiences Of The Uninsured
Half of the non-elderly uninsured in California say they’ve been without insurance for 2 years or more. The main reason they report being without insurance is that it’s too expensive or they can’t afford it (31 percent), followed by employment-related reasons (10 percent). [Figure 39]
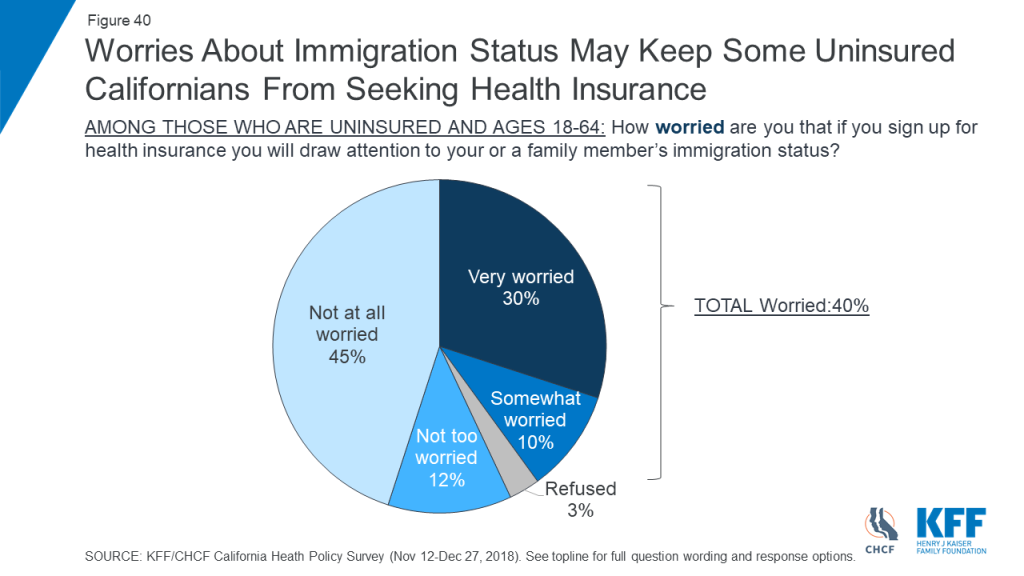
Worries about exposing their own or someone else’s immigration status may also prevent some uninsured Californians from seeking coverage. Four in ten of those without insurance say they are worried that if they signed up for health insurance, they would draw attention to their own or a family member’s immigration status. This includes three in ten who say they are “very worried” and another one in ten who say they are “somewhat” worried. [Figure 40]
Figure 39

Figure 40
Appendices: Appendix A: Survey Methodology
The Kaiser Family Foundation/California Health Care Foundation California Health Policy Survey was conducted by telephone November 12 – December 27, 2018 among a random representative sample of 1,404 adults age 18 and older living in the state of California (note: persons without a telephone could not be included in the random selection process). Interviews were administered in English and Spanish, combining random samples of both landline (476) and cellular telephones (928, including 668 who had no landline telephone). Sampling, data collection, weighting and tabulation were managed by SSRS in close collaboration with Kaiser Family Foundation and California Health Care Foundation researchers. The California Health Care Foundation paid for the costs of the survey fieldwork, and Kaiser Family Foundation contributed the time of its research staff. Both partners worked together to design the survey and analyze the results.
The sampling and screening procedures were designed to increase the number of Black and Asian-American respondents and low-income respondents, including those who have health insurance through Medi-Cal or who are uninsured. This oversample allowed for sufficient numbers of respondents in these subgroups to report their results separately; weighting adjustments were made to adjust their proportions to represent their actual shares of the population in overall results (see weighting description below). The sample included 463 respondents who were reached by calling back respondents in California who had previously completed an interview on either the SSRS Omnibus poll or the Kaiser Health Tracking Polls and indicated they fit one of the oversample criteria (Black, Asian, or low-income respondents, including low-income respondents with Medi-Cal or who are uninsured, and are living in California). It also included 46 respondents with prepaid (or pay-as-you-go) cell phone numbers in California, a group that is disproportionately lower-income.
The dual frame cellular and landline phone sample was generated by Marketing Systems Group (MSG) using random digit dial (RDD) procedures. The RDD frames were stratified by income-level in order to reach more low-income respondents. To address the fact that some qualifying respondents could be reached only by their cell-phone but had an out-of-state phone number, the sample was augmented with a sample of phone numbers outside of California associated with a billing address that indicated in-state residence (n=89). Survey Sampling International (SSI) generated these numbers randomly using Smart Cell sample. All respondents were screened to verify that they resided in California. For the landline sample, respondents were selected by asking for the youngest adult male or female currently at home based on a random rotation. If no one of that gender was available, interviewers asked to speak with the youngest adult of the opposite gender. For the cell phone sample, interviews were conducted with the qualifying adult who answered the phone.
A multi-stage weighting design was applied to ensure an accurate representation of the California adult population. The first stage of weighting involved corrections for sample design, including accounting for the components, the likelihood of non-response for the re-contacted sample, and an adjustment to account for the fact that respondents with both a landline and cell phone have a higher probability of selection. In the second weighting stage, demographic adjustments were applied, at first, to the RDD and Smart Cell sample to account for systematic non-response along known population parameters. Population parameters included gender, age, race, Hispanic ethnicity (broken down by nativity), educational attainment, phone status (cell phone only or reachable by landline), and state region. Demographic parameters were based on estimates from the U.S. Census Bureau’s March 2017 American Community Survey (ACS), and telephone use was based on data for California from the 2016 National Health Interview Survey. Based on this second stage of weighting, estimates were derived for self-reported income as a percentage of the federal poverty level (less than 200%, 200% or higher) by insurance status (Medi-Cal, uninsured, all else) in the California population. The last stage of weighting included all respondents and used poverty level by insurance status, based on the previous stage’s outcomes, as an additional weighting parameter.
The margin of sampling error including the design effect for the full sample is plus or minus 3 percentage points. For results based on subgroups, the margin of sampling error may be higher. Sample sizes and margins of sampling error for subgroups are available by request. Note that sampling error is only one of many potential sources of error in this or any other public opinion poll. Kaiser Family Foundation public opinion and survey research is a charter member of the Transparency Initiative of the American Association for Public Opinion Research.
California regions analyzed in this report are defined as follows:
- Los Angeles County
- South Coast: San Diego and Orange Counties
- Inland Empire: Riverside and San Bernadino Counties
- San Joaquin Valley: San Joaquin, Stanislaus, Merced, Madera, Fresno, Kings, Tulare, and Kern Counties
- Sacramento/North Valley: Shasta, Tehama, Glenn, Butte, Colusa, Yuba, Placer, Sutter, Yolo, El Dorado, and Sacramento Counties
- San Francisco Bay Area: Alameda, Contra Costa, Marin, Napa, San Francisco, San Mateo, Santa Clara, Sonoma, and Solano Counties
Appendices: Appendix B: Demographic Tables
B.1: Tables By Race And Income
| Table B.1.1: Availability Of Health Care Providers In The Community | |||||||||
| Do you think your community has enough _____ to serve the needs of local residents, or not? | Total | Race/Ethnicity | Self-reported Income (% of FPL) | ||||||
| Total | Among Employed | ||||||||
| White | Hisp. | Asian | Black | <200% | 200%+ | <200% | 200%+ | ||
| Hospitals | |||||||||
| Enough | 70% | 74% | 63% | 77% | 54% | 63% | 74% | 64% | 75% |
| Not enough | 27 | 21 | 35 | 21 | 45 | 34 | 22 | 33 | 22 |
| Don’t know | 3 | 5 | 3 | 2 | 1 | 3 | 4 | 3 | 3 |
| Primary care doctors | |||||||||
| Enough | 57% | 61% | 50% | 64% | 47% | 52% | 61% | 49% | 64% |
| Not enough | 35 | 29 | 44 | 30 | 46 | 41 | 31 | 42 | 29 |
| Don’t know | 7 | 10 | 5 | 7 | 7 | 7 | 8 | 9 | 7 |
| Specialists | |||||||||
| Enough | 54% | 60% | 45% | 61% | 45% | 46% | 61% | 45% | 62% |
| Not enough | 33 | 23 | 45 | 27 | 45 | 42 | 24 | 42 | 23 |
| Don’t know | 13 | 17 | 10 | 12 | 10 | 12 | 14 | 13 | 14 |
| Mental health care providers | |||||||||
| Enough | 27% | 26% | 26% | 30% | 19% | 30% | 25% | 27% | 26% |
| Not enough | 52 | 49 | 57 | 42 | 75 | 56 | 51 | 57 | 49 |
| Don’t know | 21 | 24 | 17 | 28 | 6 | 15 | 24 | 16 | 24 |
| Table B.1.2: Importance Of Medi-Cal To State And Family | |||||||||
| How important is Medi-Cal for _____? | Total | Race/Ethnicity | Self-reported Income (% of FPL) | ||||||
| Total | Among Employed | ||||||||
| White | Hisp. | Asian | Black | <200% | 200%+ | <200% | 200%+ | ||
| The state of California | |||||||||
| Very important | 76% | 69% | 88% | 67% | 87% | 84% | 70% | 84% | 70% |
| Somewhat important | 15 | 18 | 7 | 25 | 6 | 10 | 20 | 11 | 19 |
| Not too important | 3 | 4 | 2 | 4 | 2 | 2 | 3 | 2 | 4 |
| Not at all important | 3 | 3 | 2 | 2 | 4 | 2 | 3 | 2 | 3 |
| You and your family | |||||||||
| Very important | 46% | 33% | 66% | 33% | 63% | 69% | 25% | 63% | 23% |
| Somewhat important | 12 | 12 | 10 | 20 | 12 | 11 | 14 | 14 | 15 |
| Not too important | 12 | 15 | 7 | 18 | 9 | 7 | 17 | 10 | 18 |
| Not at all important | 26 | 37 | 12 | 29 | 16 | 11 | 41 | 11 | 41 |
| Table B.1.3: Worries About Affording Health Care | |||||||||
How worried, if at all, are you about being able to afford _____ for you and your family? % who said “very worried”: | Total | Race/Ethnicity | Self-reported Income (% of FPL) | ||||||
| Total | Among Employed | ||||||||
| White | Hisp. | Asian | Black | <200% | 200%+ | <200% | 200%+ | ||
| Your monthly health insurance premium* | 17% | 10% | 27% | 16% | 20% | 26% | 10% | 22% | 10% |
| Out-of-pocket costs when using health care services | 30 | 20 | 47 | 22 | 27 | 44 | 17 | 40 | 19 |
| Prescription drug costs | 22 | 13 | 37 | 10 | 16 | 33 | 11 | 32 | 10 |
| Rent or mortgage | 31 | 19 | 47 | 25 | 31 | 48 | 16 | 48 | 17 |
| Gasoline or other transportation costs | 27 | 20 | 40 | 11 | 35 | 41 | 13 | 38 | 14 |
| Monthly utilities like electricity or heat | 22 | 14 | 35 | 15 | 29 | 36 | 9 | 31 | 9 |
| Unexpected medical bills | 38 | 26 | 53 | 39 | 29 | 51 | 26 | 52 | 27 |
| NOTE: *Item was asked among those who have insurance. | |||||||||
| Table B.1.4: Problems Affording Care Because Of Cost | |||||||||
In the past 12 months, have you or another family member living in your household _____ because of the cost, or not? % who said yes: | Total | Race/Ethnicity | Self-reported Income (% of FPL) | ||||||
| Total | Among Employed | ||||||||
| White | Hisp. | Asian | Black | <200% | 200%+ | <200% | 200%+ | ||
| Skipped a recommended medical test or treatment | 19% | 17% | 20% | 15% | 21% | 24% | 15% | 26% | 16% |
| Not filled a prescription for a medicine | 18 | 14 | 22 | 13 | 17 | 24 | 13 | 21 | 14 |
| Cut pills in half or skipped doses of medicine | 12 | 10 | 15 | 6 | 18 | 18 | 7 | 17 | 7 |
| Put off or postponed getting mental health care | 10 | 11 | 12 | 3 | 9 | 16 | 7 | 19 | 7 |
| Put off or postponed getting health care | 20 | 19 | 21 | 19 | 16 | 28 | 16 | 29 | 19 |
| Skipped dental care or checkups | 30 | 30 | 32 | 22 | 28 | 40 | 23 | 42 | 24 |
| Experienced any of the above | 44 | 43 | 46 | 41 | 39 | 55 | 36 | 56 | 38 |
| Table B.1.5: Problems Paying Medical Bills | |||||||||
| In the past 12 months, did you or anyone in your household have problems paying or an inability to pay any medical bills, such as bills for doctors, dentists, medication, or home care? | Total | Race/Ethnicity | Self-reported Income (% of FPL) | ||||||
| Total | Among Employed | ||||||||
| White | Hisp. | Asian | Black | <200% | 200%+ | <200% | 200%+ | ||
| % who said yes: | 20% | 16% | 28% | 8% | 30% | 29% | 15% | 30% | 15% |
B.2: Tables By Region
| Table B.2.1: Availability Of Health Care Providers In The Community | |||||||
| Do you think your community has enough _____ to serve the needs of local residents, or not? | Total | California Region | |||||
| South Coast | Bay Area | LA County | Sacramento/North Valley | Inland Empire | San Joaquin Valley | ||
| Hospitals | |||||||
| Enough | 70% | 81% | 73% | 72% | 76% | 54% | 51% |
| Not enough | 27 | 17 | 24 | 24 | 23 | 38 | 47 |
| Don’t know | 3 | 2 | 3 | 3 | 1 | 7 | 2 |
| Primary care doctors | |||||||
| Enough | 57% | 71% | 60% | 61% | 46% | 53% | 46% |
| Not enough | 35 | 23 | 28 | 32 | 44 | 40 | 49 |
| Don’t know | 7 | 6 | 11 | 6 | 10 | 7 | 5 |
| Specialists | |||||||
| Enough | 54% | 64% | 59% | 53% | 60% | 50% | 36% |
| Not enough | 33 | 25 | 23 | 33 | 29 | 37 | 54 |
| Don’t know | 13 | 11 | 18 | 13 | 12 | 13 | 10 |
| Mental health care providers | |||||||
| Enough | 27% | 37% | 22% | 28% | 20% | 29% | 25% |
| Not enough | 52 | 40 | 46 | 58 | 54 | 53 | 56 |
| Don’t know | 21 | 22 | 32 | 14 | 25 | 18 | 18 |
| Table B.2.2: Importance Of Medi-Cal To State And Family | |||||||
| How important is Medi-Cal for _____? | Total | California Region | |||||
| South Coast | Bay Area | LA County | Sacramento/North Valley | Inland Empire | San Joaquin Valley | ||
| The state of California | |||||||
| Very important | 76% | 67% | 78% | 77% | 78% | 71% | 84% |
| Somewhat important | 15 | 19 | 16 | 14 | 15 | 19 | 9 |
| Not too important | 3 | 5 | 3 | 3 | 2 | 2 | 4 |
| Not at all important | 3 | 5 | 2 | 2 | 3 | 5 | 1 |
| You and your family | |||||||
| Very important | 46% | 36% | 43% | 47% | 48% | 44% | 69% |
| Somewhat important | 12 | 14 | 12 | 10 | 12 | 18 | 12 |
| Not too important | 12 | 13 | 15 | 15 | 13 | 8 | 6 |
| Not at all important | 26 | 37 | 28 | 25 | 24 | 23 | 12 |
| Table B.2.3: Worries About Affording Health Care | |||||||
How worried, if at all, are you about being able to afford _____ for you and your family? % who said “very worried”: | Total | California Region | |||||
| South Coast | Bay Area | LA County | Sacramento/North Valley | Inland Empire | San Joaquin Valley | ||
| Your monthly health insurance premium* | 17% | 12% | 14% | 17% | 16% | 20% | 31% |
| Out-of-pocket costs when using health care services | 30 | 26 | 22 | 34 | 22 | 31 | 48 |
| Prescription drug costs | 22 | 16 | 20 | 23 | 17 | 23 | 32 |
| Rent or mortgage | 31 | 24 | 25 | 37 | 26 | 30 | 42 |
| Gasoline or other transportation costs | 27 | 24 | 15 | 29 | 24 | 32 | 41 |
| Monthly utilities like electricity or heat | 22 | 18 | 17 | 19 | 23 | 26 | 40 |
| Unexpected medical bills | 38 | 32 | 31 | 38 | 33 | 44 | 49 |
| NOTE: *Item was asked among those who have insurance. | |||||||
| Table B.2.4: Problems Affording Care Because Of Cost | |||||||
In the past 12 months, have you or another family member living in your household _____ because of the cost, or not? % who said yes: | Total | California Region | |||||
| South Coast | Bay Area | LA County | Sacramento/North Valley | Inland Empire | San Joaquin Valley | ||
| Skipped a recommended medical test or treatment | 19% | 15% | 14% | 21% | 21% | 24% | 21% |
| Not filled a prescription for a medicine | 18 | 17 | 14 | 20 | 23 | 16 | 19 |
| Cut pills in half or skipped doses of medicine | 12 | 9 | 6 | 14 | 11 | 15 | 19 |
| Put off or postponed getting mental health care | 10 | 7 | 8 | 12 | 8 | 11 | 10 |
| Put off or postponed getting health care | 20 | 19 | 17 | 22 | 19 | 19 | 21 |
| Skipped dental care or checkups | 30 | 28 | 23 | 31 | 30 | 33 | 39 |
| Experienced any of the above | 44 | 41 | 39 | 46 | 42 | 47 | 49 |
| Table B.2.5: Problems Paying Medical Bills | |||||||
| In the past 12 months, did you or anyone in your household have problems paying or an inability to pay any medical bills, such as bills for doctors, dentists, medication, or home care? | Total | California Region | |||||
| South Coast | Bay Area | LA County | Sacramento/North Valley | Inland Empire | San Joaquin Valley | ||
| % who said yes: | 20% | 15% | 12% | 24% | 26% | 22% | 27% |
B.3. Tables By Insurance Status Ages 18-64
| Table B.3.1: Availability Of Health Care Providers In The Community | |||||
| Do you think your community has enough _____ to serve the needs of local residents, or not? | Total | Insurance Status (Ages 18-64) | Insurance Type (Ages 18-64) | ||
| Insured | Uninsured | Employer-Sponsored | Medi-Cal | ||
| Hospitals | |||||
| Enough | 70% | 70% | 63% | 75% | 57% |
| Not enough | 27 | 26 | 35 | 21 | 40 |
| Don’t know | 3 | 4 | 3 | 4 | 3 |
| Primary care doctors | |||||
| Enough | 57% | 60% | 46% | 65% | 47% |
| Not enough | 35 | 33 | 43 | 27 | 46 |
| Don’t know | 7 | 7 | 10 | 7 | 7 |
| Specialists | |||||
| Enough | 54% | 56% | 43% | 61% | 47% |
| Not enough | 33 | 31 | 39 | 25 | 42 |
| Don’t know | 13 | 12 | 16 | 14 | 11 |
| Mental health care providers | |||||
| Enough | 27% | 28% | 31% | 26% | 27% |
| Not enough | 52 | 51 | 52 | 49 | 58 |
| Don’t know | 21 | 21 | 16 | 25 | 15 |
| Table B.3.2: Importance Of Medi-Cal To State And Family | |||||
| How important is Medi-Cal for _____? | Total | Insurance Status (Ages 18-64) | Insurance Type (Ages 18-64) | ||
| Insured | Uninsured | Employer-Sponsored | Medi-Cal | ||
| The state of California | |||||
| Very important | 76% | 77% | 80% | 72% | 91% |
| Somewhat important | 15 | 15 | 10 | 18 | 7 |
| Not too important | 3 | 2 | 3 | 4 | 1 |
| Not at all important | 3 | 3 | 5 | 3 | 1 |
| You and your family | |||||
| Very important | 46% | 46% | 63% | 29% | 91 |
| Somewhat important | 12 | 13 | 14 | 15 | 5 |
| Not too important | 12 | 14 | 8 | 20 | 1 |
| Not at all important | 26 | 25 | 10 | 33 | 2 |
| Table B.3.3: Worries About Affording Health Care | |||||
How worried, if at all, are you about being able to afford _____ for you and your family? % who said “very worried”: | Total | Insurance Status(Ages 18-64) | Insurance Type (Ages 18-64) | ||
| Insured | Uninsured | Employer-Sponsored | Medi-Cal | ||
| Your monthly health insurance premium* | 17% | 18% | N/A | 15% | 21% |
| Out-of-pocket costs when using health care services | 30 | 30 | 56 | 23 | 44 |
| Prescription drug costs | 22 | 19 | 45 | 14 | 32 |
| Rent or mortgage | 31 | 31 | 48 | 25 | 46 |
| Gasoline or other transportation costs | 27 | 24 | 39 | 18 | 39 |
| Monthly utilities like electricity or heat | 22 | 20 | 36 | 12 | 37 |
| Unexpected medical bills | 38 | 37 | 63 | 32 | 48 |
| NOTE: *Item was asked among those who have insurance. | |||||
| Table B.3.4: Problems Affording Care Because Of Cost | |||||
In the past 12 months, have you or another family member living in your household _____ because of the cost, or not? % who said yes: | Total | Insurance Status(Ages 18-64) | Insurance Type (Ages 18-64) | ||
| Insured | Uninsured | Employer-Sponsored | Medi-Cal | ||
| Skipped a recommended medical test or treatment | 19% | 19% | 30% | 16% | 26% |
| Not filled a prescription for a medicine | 18 | 17 | 28 | 13 | 30 |
| Cut pills in half or skipped doses of medicine | 12 | 12 | 17 | 8 | 21 |
| Put off or postponed getting mental health care | 10 | 10 | 18 | 8 | 14 |
| Put off or postponed getting health care | 20 | 20 | 32 | 17 | 27 |
| Skipped dental care or checkups | 30 | 30 | 41 | 23 | 43 |
| Experienced any of the above | 44 | 45 | 54 | 38 | 57 |
| Table B.3.5: Problems Paying Medical Bills | |||||
| In the past 12 months, did you or anyone in your household have problems paying or an inability to pay any medical bills, such as bills for doctors, dentists, medication, or home care? | Total | Insurance Status(Ages 18-64) | Insurance Type (Ages 18-64) | ||
| Insured | Uninsured | Employer-Sponsored | Medi-Cal | ||
| % who said yes: | 20% | 21% | 31% | 17% | 31% |
Endnotes
- Centers for Medicare & Medicaid Services, The Mental Health Parity and Addiction Equity Act (MHPAEA, Accessed January 16, 2019.https://www.cms.gov/cciio/programs-and-initiatives/other-insurance-protections/mhpaea_factsheet.html ↩︎
- Kaiser Family Foundation, Understanding the Intersection of Medicaid and Work, January 2018. https://modern.kff.org/medicaid/issue-brief/understanding-the-intersection-of-medicaid-and-work/ ↩︎
- California Health Care Foundation, California’s Physicians: Headed for a Drought?, June 25, 2018. https://www.chcf.org/publication/californias-physicians-headed-drought/ ↩︎
- California Legislative Information, AB-72 Health care coverage: out-of-network coverage, September 23, 2016. https://leginfo.legislature.ca.gov/faces/billTextClient.xhtml?bill_id=201520160AB72 ↩︎