Kaiser Health Tracking Poll: October 2014
Kaiser Health Tracking Poll: October 2014
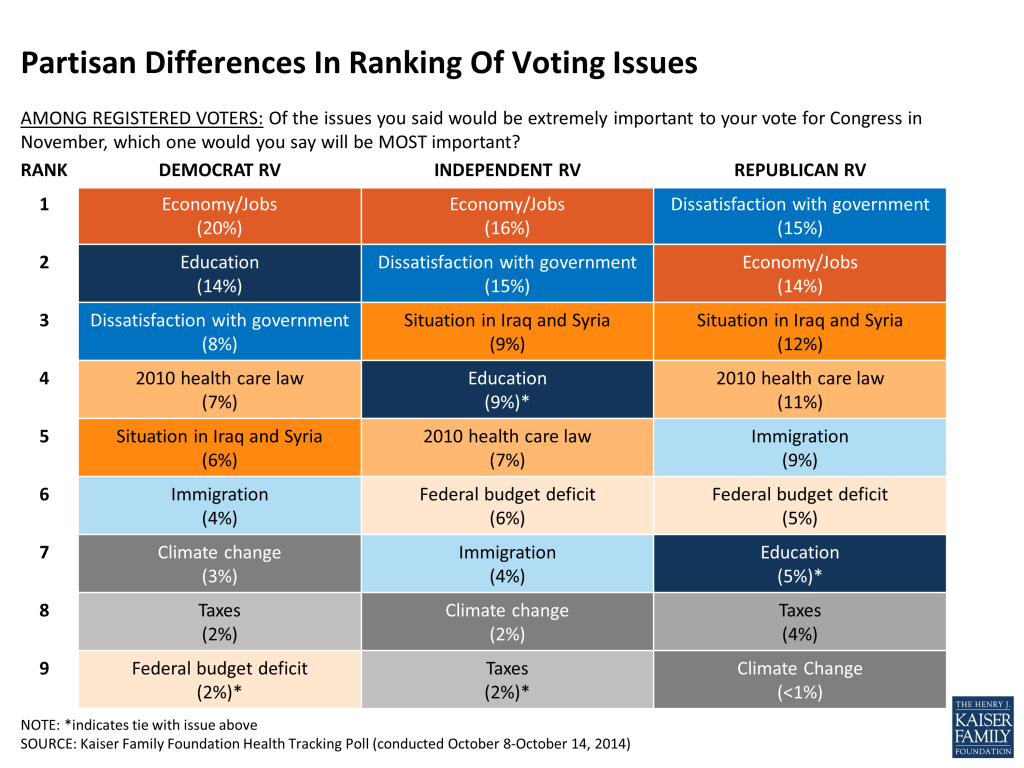
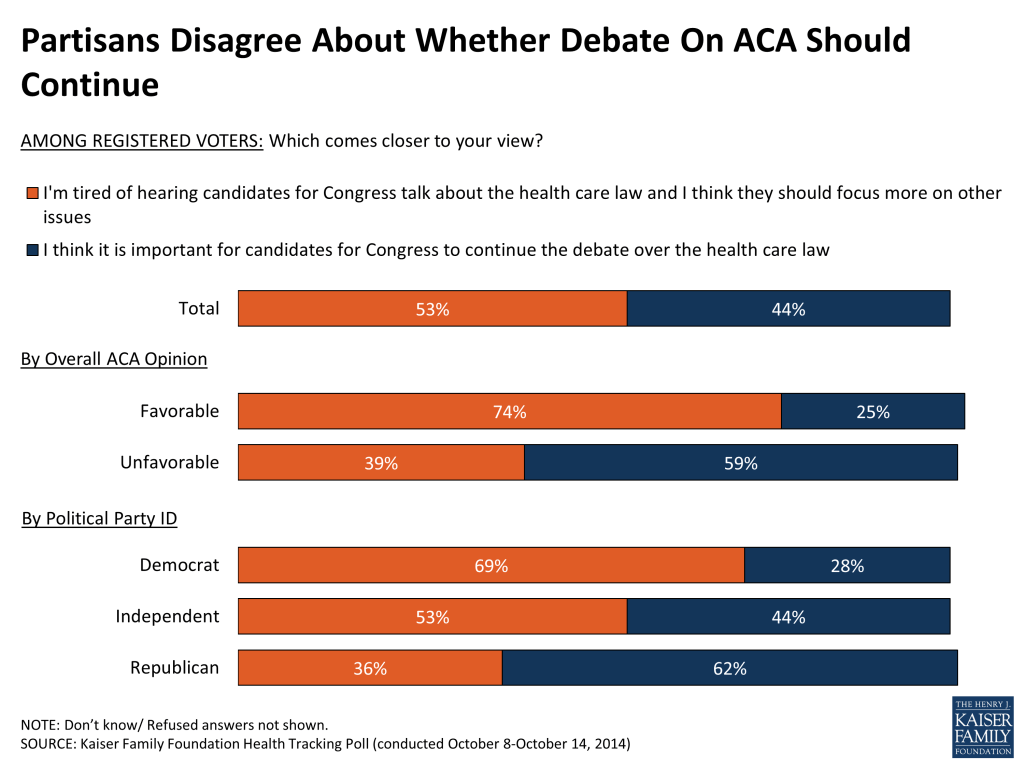
In the final Kaiser Health Tracking Poll before the 2014 midterm elections in November, the Affordable Care Act (ACA) continues to be just one of several issues on voters’ minds. Less than 1 in 10 registered voters (8 percent) identify the ACA as the most important issue to their vote, ranking 5th behind the economy (16 percent), dissatisfaction with government (12 percent), education (10 percent) and the situation in Iraq and Syria (9 percent). The ACA ranks 4th for Democrats, Republicans, and independents alike. Just over half of voters say they’re tired of hearing Congressional candidates talk about the ACA and wish they would move on to other issues, while 44 percent say they want candidates to continue the discussion. Meanwhile, as campaigns make their final appeal to voters, 6 in 10 report seeing political advertising related to the ACA, with more saying they have seen mostly negative advertising about the ACA rather than mostly positive.
On the heels of the election is the start of the ACA’s second open enrollment period on November 15th, and, at this point, one key target – the uninsured – are not yet tuned in. About 9 in 10 of the uninsured are unaware of when the next open enrollment period begins. More specifically, two thirds of the uninsured say they know “only a little” or “nothing at all” about the marketplaces where people can shop for insurance and just over half are unaware of financial assistance available to help low- and moderate-income people purchase insurance. Among the general public more broadly, views on the ACA remain similar to past months with more expressing unfavorable views of the law than favorable and more wanting Congress to work to improve the law rather than repeal it.
Registered Voters’ Views Of The ACA In The Election
ACA Is One Of Many Issues Important To Voters
With the 2014 midterm election less than one month away, the latest Kaiser Health Tracking Poll finds the ACA continues to be a second-tier issue on voters’ minds, and many say they are tired of hearing candidates talk about the law. Just over a quarter (27 percent) of registered voters say the health care law will be an “extremely important” issue in their vote and about another third (35 percent) say it will be “very important”. But when asked to choose the MOST important issue, just 8 percent pick health care, ranking behind the economy (16 percent) and dissatisfaction with government (12 percent) and similar to other issues like education (10 percent), the situation in Iraq and Syria (9 percent), and immigration (6 percent). Additionally, 29 percent of voters do not say that any of these issues are extremely important to their vote, perhaps because no one issue outshines another or they consider other factors more important to their vote such as the personal characteristics of the candidates.
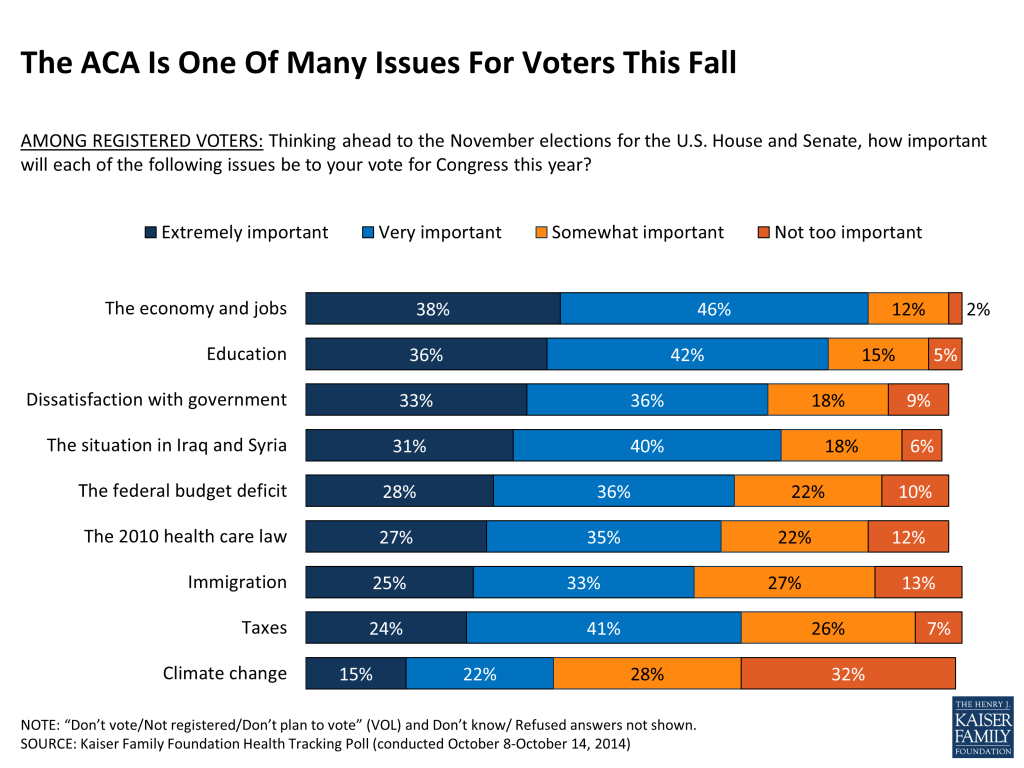
Across party lines, the ACA ranks 4th as voters’ most important issue for Democrats, Republicans, and independents alike.
At this point in the election season, slightly more than half (53 percent) of registered voters say they are tired of hearing candidates for Congress talk about the health care law and would prefer they move on to other issues, while 44 percent say they feel it is important for Congressional candidates to continue debating the issue. About 7 in 10 of Democratic voters and voters with a favorable view of the law say they would like candidates to move on, while about 6 in 10 of Republican voters and voters with an unfavorable view of the law say they think it is important for the debate about the law to continue. Independent voters are in the middle, but tilt toward wanting candidates to move on to other issues.
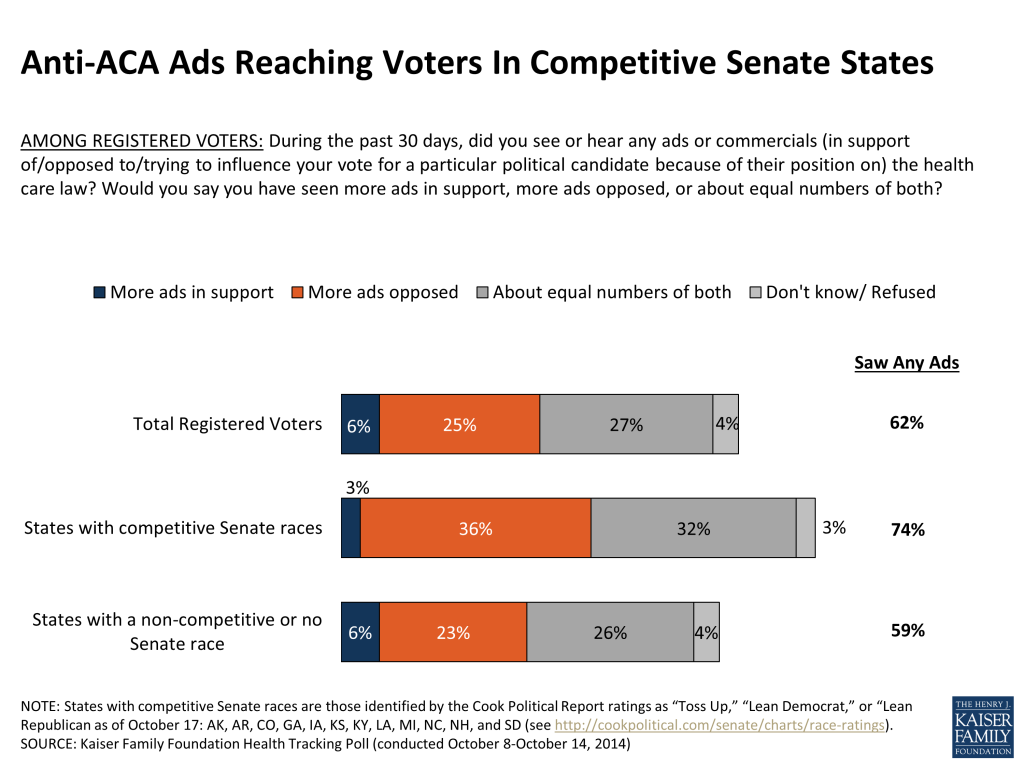
With the midterm elections and the second open enrollment period quickly approaching in November, substantial shares of voters report seeing ads or commercials about the health care law. About 6 in 10 voters (62 percent) say they’ve seen ads in the last 30 days that were opposed to the law, in support of the law, or were trying to influence their vote for a political candidate based on their stance on the law. A larger share of voters report seeing more ads opposed to the law than ads in support of it (25 percent versus 6 percent), although 27 percent say they have seen about an equal number of both and about four in ten (39 percent) say they didn’t see any ads in support of, opposed to or trying to influence their vote. In states with competitive Senate races,1 the share of voters reporting that they have recently seen these ads increases to about three-quarters (74 percent), with over one-third (36 percent) saying more of the ads were negative compared to just 3 percent who said more of the ads were positive.
With open enrollment just around the bend, voters also report seeing advertising related to health insurance. Almost half of voters (45 percent) say they saw an ad from an insurance company about health insurance and a third of voters (33 percent) say that they have seen ads that provide information about how to get health insurance.
ACA-Related Views And Experiences As Open Enrollment Approaches
Nine In Ten Uninsured Unaware Of Start Of Upcoming Enrollment Period
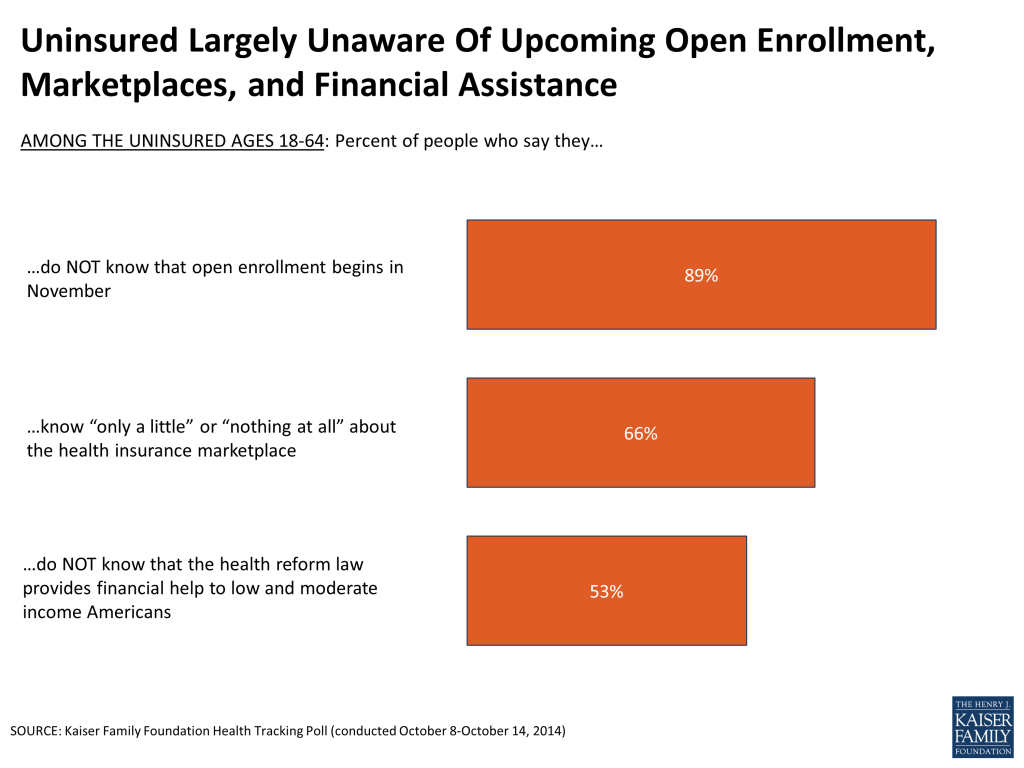
The start of the second open enrollment period under the Affordable Care Act on November 15 is less than a month away, and so far this has not yet come to the attention of one of the primary audiences for open enrollment: the uninsured. Nine in 10 (89 percent) of the uninsured are unaware of when the next open enrollment period begins, including 76 percent who say they don’t know and 13 percent who suggest a time other than November 2014.
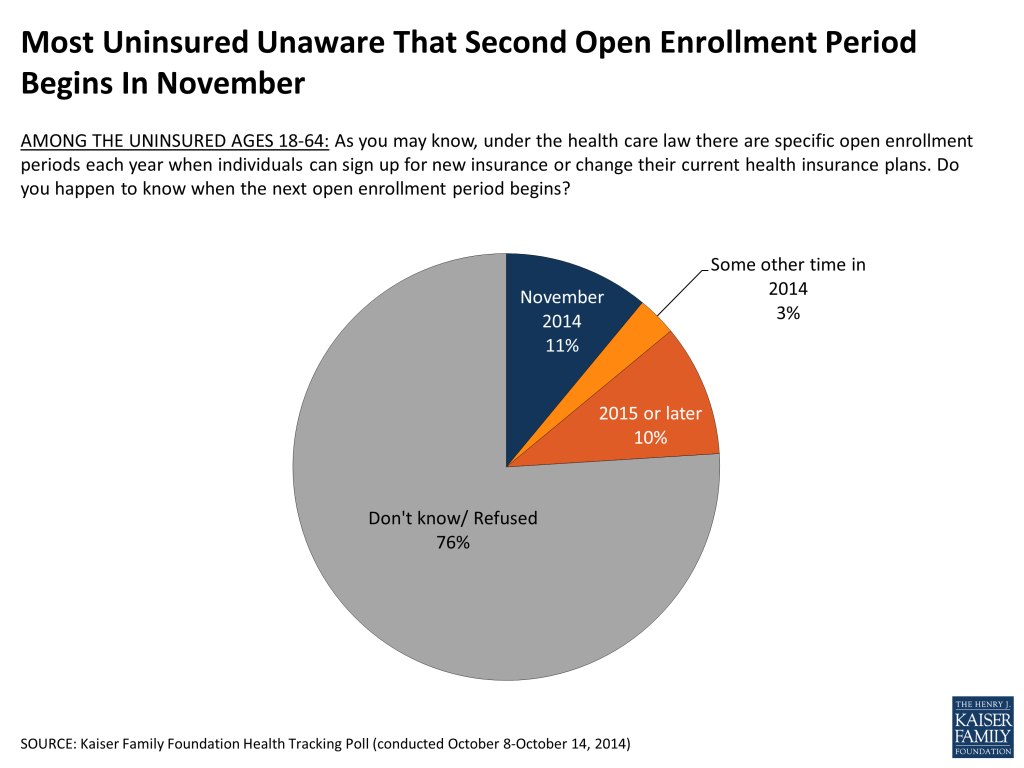
Two-thirds of the uninsured (66 percent) say they know “only a little” or “nothing at all” about the marketplaces where people who don’t get coverage through their employers can shop for insurance and just over half (53 percent) of the uninsured are unaware of the financial assistance available to help low- and moderate-income individuals purchase insurance.
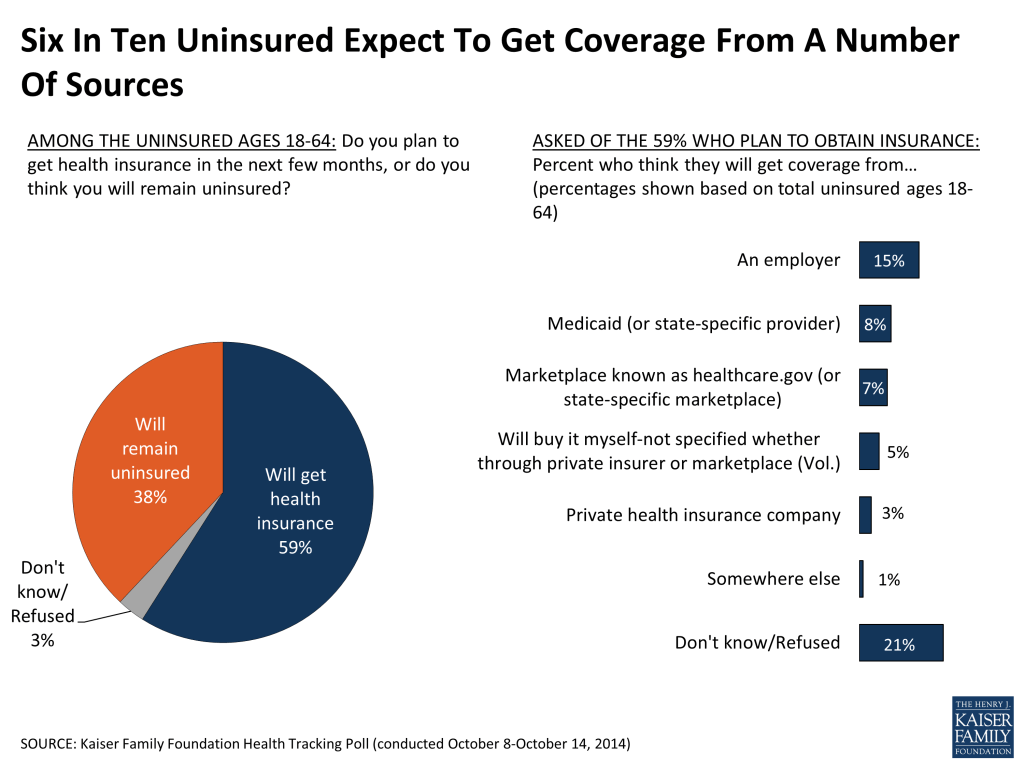
Most Uninsured Plan On Getting Coverage Soon
Although many uninsured are unaware about key features of the ACA that can improve their access to coverage, many say they intend to get coverage soon. Most (59 percent) say they will get covered in the next few months, including 15 percent who expect to get coverage from an employer, 15 percent who expect to purchase it themselves (either from a private insurance company or through a marketplace), and 8 percent who think they will get it from Medicaid. One in five (21 percent) say they expect to get coverage but are unsure where.
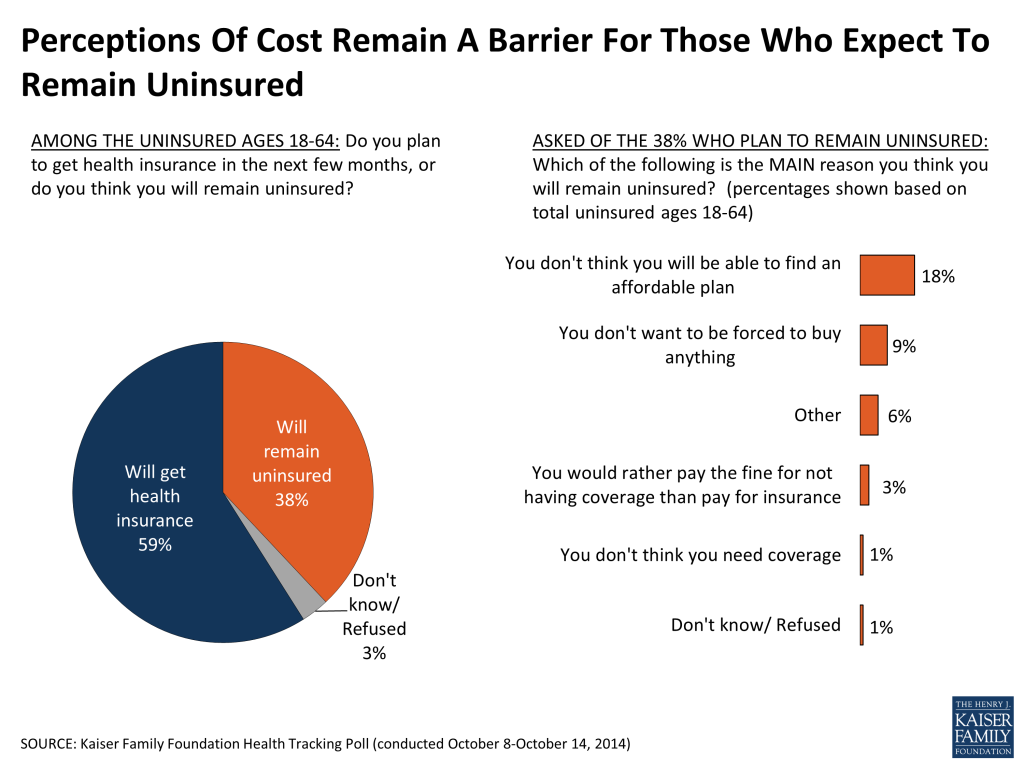
The 4 in 10 who expect to remain uninsured give a variety of reasons why they don’t think they will get coverage. Eighteen percent say they will remain uninsured because they don’t think they will be able to find an affordable plan (18 percent of the uninsured overall), while another 12 percent say they don’t think they will get insurance because they don’t want to be forced to buy anything (including 3 percent who say they would rather pay the fine than pay for coverage).
Who Are The Uninsured?
There are a variety of factors that make the uninsured a difficult group to reach and enroll in coverage. About 6 in 10 (63 percent) report family income of less than $30,000 a year and nearly half (46 percent) have been without health insurance for 2 years or more. In addition, a third (32 percent) identify as Hispanic and 17 percent opted to take the survey in Spanish.
A Check In On The Public’s Views Of The Law
This month’s tracking poll finds few changes in the public’s views of the law. Negative views of the health care law continue to outweigh positive views (43 percent unfavorable, 36 percent favorable). The share expressing an unfavorable opinion had increased to 53 percent in July, but has now returned to levels reported at about this same time last year as the first open enrollment period began.
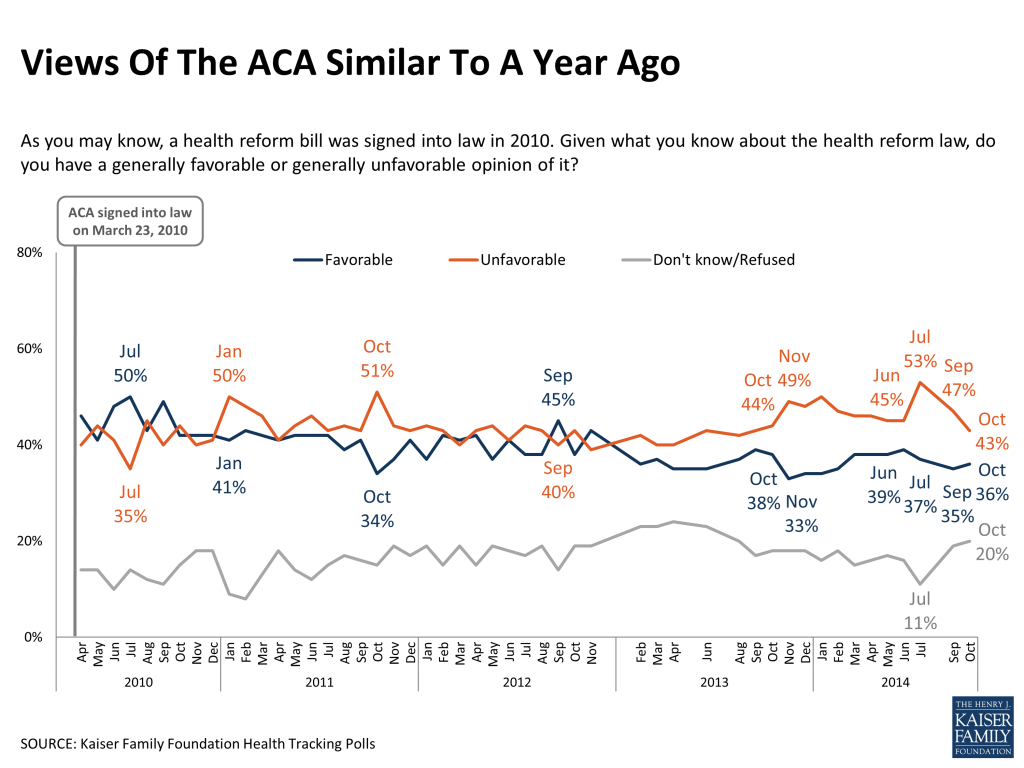
As has been true since the inception of the law, opinion is starkly divided along partisan lines, with three quarters of Republicans (77 percent) reporting an unfavorable opinion of the law and about six in ten Democrats (59 percent) reporting a favorable one.
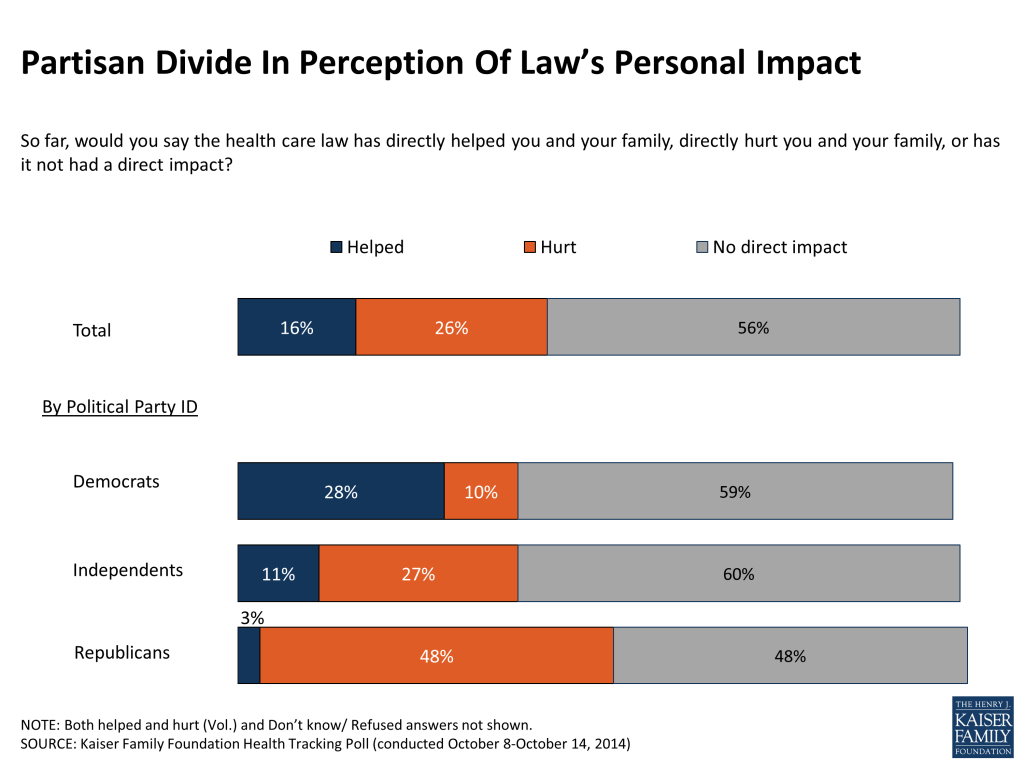
Most Americans (56 percent) say the health care law has had no direct impact on their families. For those who report being impacted, more say the law has hurt them (26 percent) than say it has helped them (16 percent). Perceived personal impact of the law also varies by political affiliation. Republicans are more likely to say they have been hurt by the law (48 percent), Democrats are more likely to say they have been helped (28 percent), and independents fall in the middle of the two, though more independents feel they have been hurt than helped.
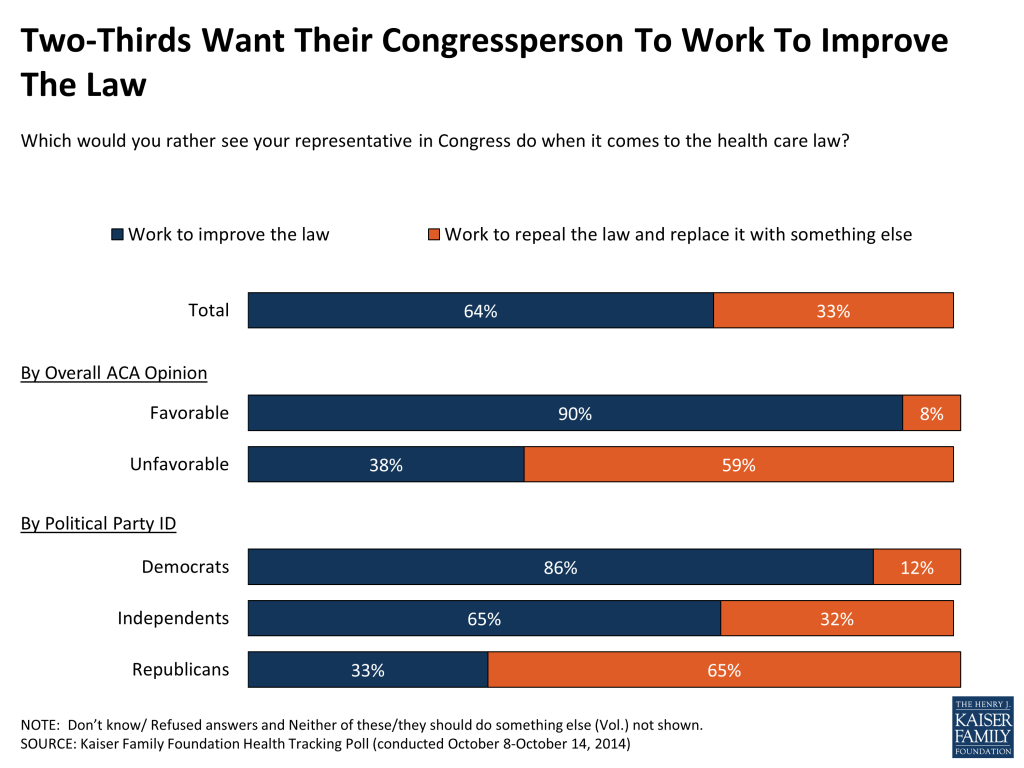
Despite the negative tilt in opinion towards the law overall, nearly two-thirds of the public (64 percent) would rather see their representative in Congress work to improve the law than repeal and replace it with something else (33 percent). A large majority of Democrats (86 percent) want their representative to work to improve the law while a majority of Republicans would rather see their representative work to repeal and replace it (65 percent). Still, sizeable shares of Republicans (33 percent) and those with an unfavorable view of the law (38 percent) say they would rather see their representative work to improve the law than work to repeal and replace it.
This Kaiser Health Tracking Poll was designed and analyzed by public opinion researchers at the Kaiser Family Foundation (KFF). The survey was conducted October 8-14, 2014, among a nationally representative random digit dial telephone sample of 1,503 adults ages 18 and older, living in the United States, including Alaska and Hawaii (note: persons without a telephone could not be included in the random selection process). Computer-assisted telephone interviews conducted by landline (751) and cell phone (752, including 411 who had no landline telephone) were carried out in English and Spanish by Princeton Data Source under the direction of Princeton Survey Research Associates International (PSRAI). Both the random digit dial landline and cell phone samples were provided by Survey Sampling International, LLC. For the landline sample, respondents were selected by asking for the youngest adult male or female currently at home based on a random rotation. If no one of that gender was available, interviewers asked to speak with the youngest adult of the opposite gender. For the cell phone sample, interviews were conducted with the adult who answered the phone. KFF paid for all costs associated with the survey.
The combined landline and cell phone sample was weighted to balance the sample demographics to match estimates for the national population using data from the Census Bureau’s 2012 American Community Survey (ACS) on sex, age, education, race, Hispanic origin, nativity (for Hispanics only), and region along with data from the 2010 Census on population density. The sample was also weighted to match current patterns of telephone use using data from the July-December 2013 National Health Interview Survey. The weight takes into account the fact that respondents with both a landline and cell phone have a higher probability of selection in the combined sample and also adjusts for the household size for the landline sample. All statistical tests of significance account for the effect of weighting.
The margin of sampling error including the design effect for the full sample is plus or minus 3 percentage points. Numbers of respondents and margin of sampling error for key subgroups are shown in the table below. For results based on other subgroups, the margin of sampling error may be higher. Sample sizes and margin of sampling errors for other subgroups are available by request. Note that sampling error is only one of many potential sources of error in this or any other public opinion poll.
| Group | N (unweighted) | M.O.S.E. |
| Total | 1,503 | ±3 percentage points |
| Party Identification | ||
| Democrats | 509 | ±5 percentage points |
| Republicans | 369 | ±6 percentage points |
| Independents | 446 | ±5 percentage points |
| Race/Ethnicity | ||
| White | 1064 | ±3 percentage points |
| Black | 147 | ±9 percentage points |
| Hispanic | 163 | ±8 percentage points |
| Education | ||
| High school graduate or less | 479 | ±5 percentage points |
| Some college | 415 | ±6 percentage points |
| College graduate or more | 601 | ±5 percentage points |
| Gender | ||
| Men | 738 | ±4 percentage points |
| Women | 765 | ±4 percentage points |
| Insurance Status | ||
| Uninsured, ages 18-64 | 145 | ±9 percentage points |
| Insured, ages 18-64 | 910 | ±4 percentage points |
| Registered Voters (RV) | 1,268 | ±3 percentage points |
| Party Identification (among RV) | ||
| Democrats | 449 | ±5 percentage points |
| Republicans | 346 | ±6 percentage points |
| Independents | 360 | ±6 percentage points |
| Opinion of ACA (among RV) | ||
| Favorable opinion of the ACA | 485 | ±5 percentage points |
| Unfavorable opinion of the ACA | 591 | ±5 percentage points |
| Senate Races (among RV) | ||
| States with competitive senate races | 219 | ±8 percentage points |
| States with a non-competitive or no Senate race | 1,049 | ±4 percentage points |
Endnotes
- States with competitive Senate races are those identified by the Cook Political Report ratings as “Toss Up,” “Lean Democrat,” or “Lean Republican as of October 17: AK, AR, CO, GA, IA, KS, KY, LA, MI, NC, NH, and SD (see http://cookpolitical.com/senate/charts/race-ratings). ↩︎