Kaiser Health Tracking Poll: March 2014
Kaiser Health Tracking Poll: March 2014
As the clock ticks down on open enrollment for new coverage options under the Affordable Care Act (ACA), the latest Kaiser Health Tracking Poll finds that six in ten of the uninsured are unaware of the March 31 deadline to sign up for coverage. When reminded of the deadline and the fine for not getting covered, half of those who lack coverage as of mid-March say they plan to remain uninsured. Meanwhile, four in ten of the uninsured are still unaware of the law’s subsidies to help lower-income Americans purchase coverage, and half don’t know about the law’s expansion of Medicaid. Among the public overall, general opinion of the ACA moved in a more positive direction this month for the first time since November’s post-rollout negative shift in opinion. While unfavorable views of the law continue to outpace favorable ones, the gap between negative and positive views now stands at eight percentage points, down from 16 percentage points in January. Four years after the ACA’s passage, a little over half the public says they are tired of hearing the national debate over the law and want the country to focus more on other things, while four in ten say it’s important for the debate to continue. At the same time, six in ten want Congress to keep the law in place and either leave it as is or work to improve it, while three in ten would prefer to see it either repealed and replaced with a Republican alternative or repealed and not replaced.
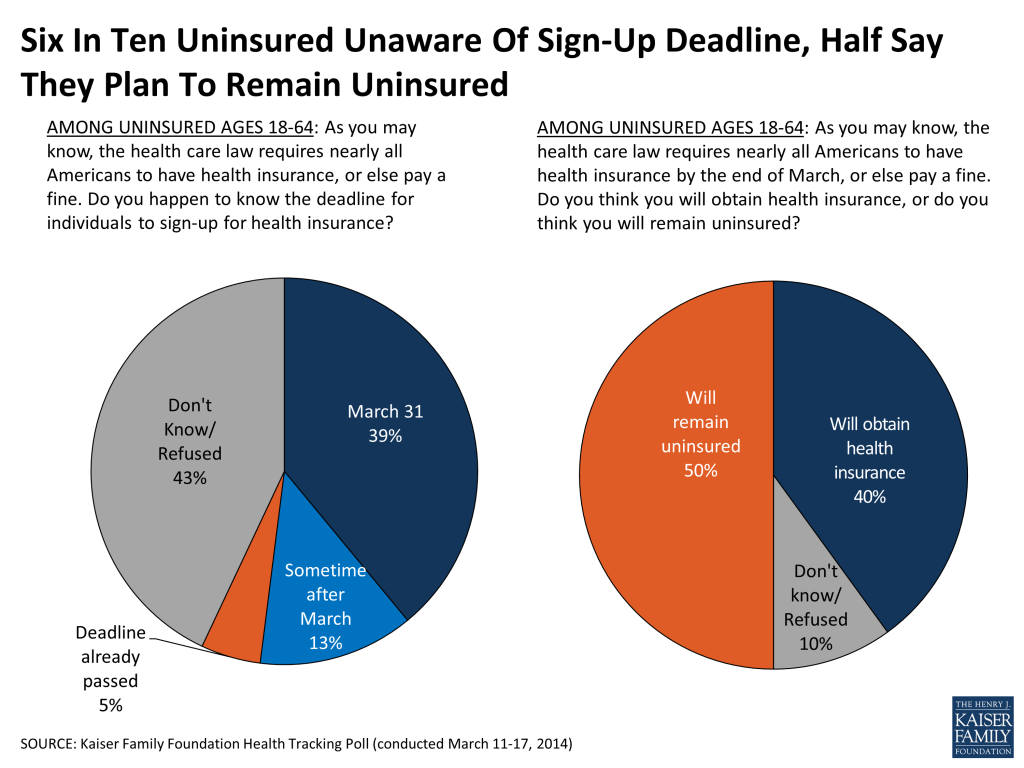
Most uninsured unaware of March 31 deadline, half plan to remain uninsured
In the final days of open enrollment for new health insurance options under the ACA, substantial shares of the uninsured remain unaware of the law’s individual mandate and the looming deadline to sign up for coverage. A third of those who lack coverage as of mid-March are unaware that the law requires nearly all Americans to have health insurance or pay a fine. When it comes to the specifics, four in ten of the uninsured (39 percent) are aware that the deadline to sign up for coverage is at the end of March, leaving about six in ten unaware of the March deadline.
When reminded of the mandate and the deadline, half of those without coverage as of mid-March say they think they will remain uninsured, while four in ten expect to obtain coverage and one in ten are unsure.
A third (33 percent) of the uninsured say they have tried to get insurance for themselves in the past 6 months, including 18 percent who report attempting to get coverage through a health insurance marketplace, 14 percent from Medicaid, and 13 percent directly from a private insurance company. Still, the large majority – 67 percent – say they have not attempted to get coverage.
| FIGURE 2: One-Third Of Uninsured Report Trying To Get Coverage In Past 6 Months | |
| AMONG THE UNINSURED AGES 18-64: Have you tried to get insurance for yourself in the past 6 months, or not? [If yes: From which of the following sources have you tried to get health insurance?] | |
| Yes, have tried to get insurance in past 6 months | 33% |
| Through the health insurance marketplace set up under the health care law* | 18 |
| From Medicaid* | 14 |
| Directly from a private insurance company* | 13 |
| From an employer* | 9 |
| From some other source* | 2 |
| No, have not tried to get insurance | 67 |
| * Multiple responses allowed | |
While some report trying to get coverage from new options available under the ACA, large shares of the uninsured remain unaware of two of the law’s key provisions that could help them get coverage. About half the uninsured are unaware that the ACA gives states the option of expanding their Medicaid programs, and more than four in ten don’t know that it provides financial help to low- and moderate-income individuals to help them purchase coverage. Despite extensive campaigns in media and on the ground attempting to get them enrolled, just one in nine (11 percent) of the uninsured say they have been personally contacted by anyone about the health care law through a phone call, email, text message, or door-to-door visit.
| FIGURE 3: Awareness Of Key ACA Provisions Among The Uninsured | |||
| AMONG THE UNINSURED AGES 18-64: To the best of your knowledge, would you say the health reform law does or does not do each of the following? | CORRECT | INCORRECT | |
| Yes | No | Don’t Know/Refused | |
| Require nearly all Americans to have health insurance or else pay a fine | 66% | 24% | 10% |
| Provide financial help to low and moderate income Americans who don’t get insurance through their jobs to help them purchase coverage | 57 | 32 | 11 |
| Give states the option of expanding their existing Medicaid program to cover more low-income, uninsured adults | 49 | 33 | 19 |
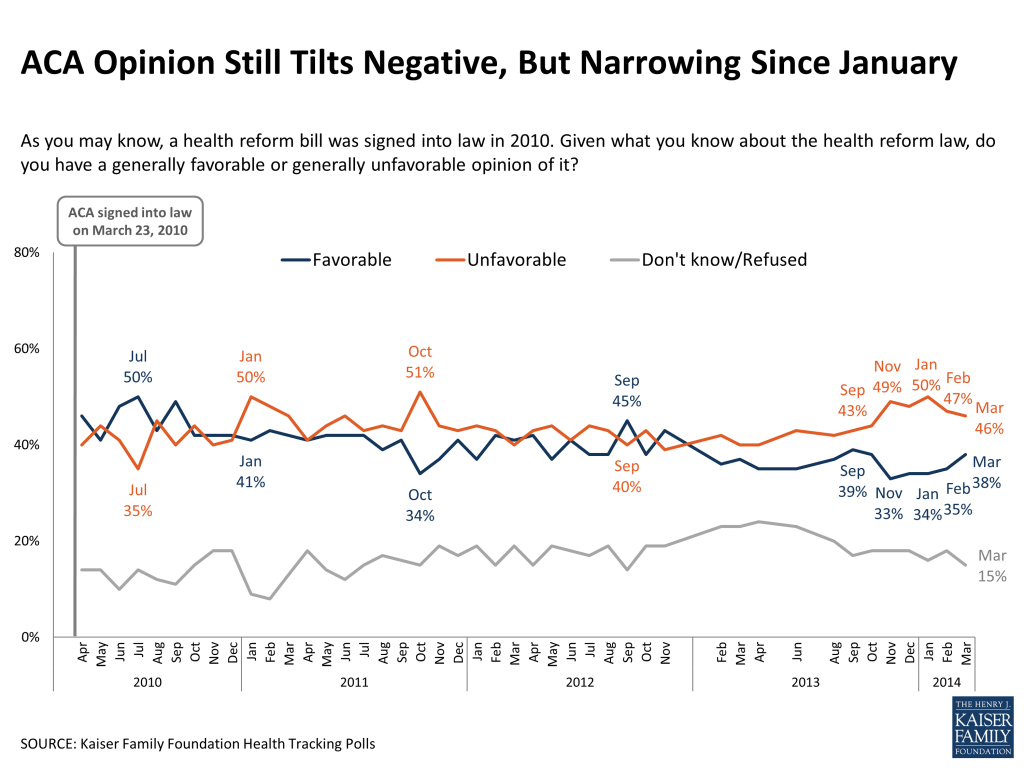
Gap between unfavorable and favorable views shrinks this month, including among uninsured
As the ACA turns four years old, overall public opinion on the law shifted in a more positive direction this month, though unfavorable views still outnumber favorable ones. In March, 46 percent say they have an unfavorable view of the law (down 4 percentage points since January), while 38 percent say they have a favorable view (up 4 percentage points since January). The gap between unfavorable and favorable views is now eight percentage points, down from a recent high of 16 points in November and January.
When those who view the law favorably are asked to say in their own words why they like the law, the most common reason by far is that it will expand access to health care and health insurance (61 percent), followed far behind by a perception that it will make health care more affordable and control costs (10 percent), and that it will be good for the country and people in general (7 percent). Open-ended reasons for unfavorable views are more widely dispersed, the most common being concerns about costs (23 percent), opposition to the individual mandate (17 percent), and concerns about government overreach (10 percent).
| FIGURE 5: In Their Own Words: Reasons For Favorable Views | ||
| AMONG THE 38% WHO HAVE A FAVORABLE VIEW: Could you tell me in your own words what is the main reason you have a favorable opinion of the health reform law? | ||
| Category | Percent Mentioning | Quotes |
| Expanding access to care and insurance | 61% | “Because it allows people without insurance the ability to get insurance.”“Because a lot of people who otherwise would not have insurance will now have it.”“Because I am able to keep my health insurance with my parents until age 26.” |
| Will make health care more affordable/control costs/lower costs | 10 | “Because it makes health insurance affordable for people without insurance.”“Because I think the health care system was too costly and the affordable health care act will cut costs.” |
| Country/people will be better off generally | 7 | “It makes health care better for Americans.”“it is beneficial to the general public.” |
| FIGURE 6: In Their Own Words: Reasons For Unfavorable Views | ||
| AMONG THE 46% WHO HAVE AN UNFAVORABLE VIEW: Could you tell me in your own words what is the main reason you have an unfavorable opinion of the health reform law? | ||
| Category | Percent Mentioning | Quotes |
| Cost concerns | 23% | “It’s too expensive for regular people.”“it’s costing too much money. It’s supposed to help people with low incomes and it’s not.”“Because it’s a financial hardship on the U.S.” |
| Opposed to individual mandate/ Unconstitutional | 17 | “Don’t think it’s right to penalize people who don’t have health care.”“It’s unconstitutional, requiring people to have health insurance.” |
| Government-related issues | 10 | “I don’t like the government making personal decisions for me.”“I believe the government should stay out of health care” “There is too much government in our personal choices.” |
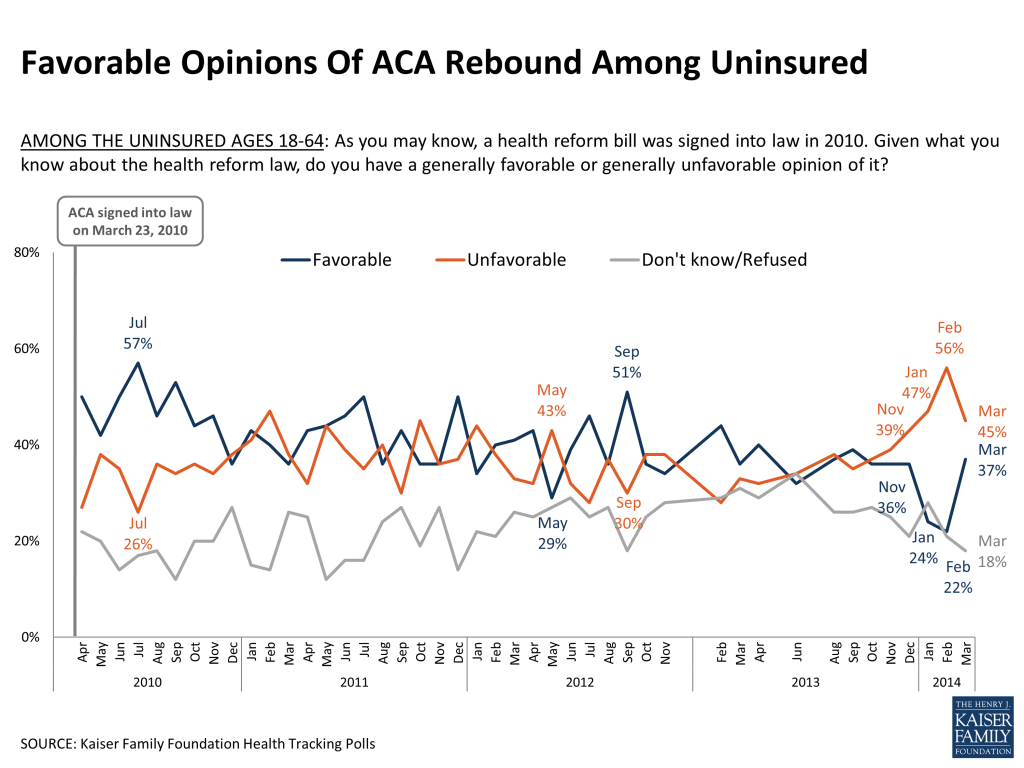
General opinion of the ACA among the uninsured, which had been trending negative for the past several months, also moved in a positive direction this month, returning closer to levels measured at the end of 2013. In March, 45 percent of the uninsured say they have an unfavorable view of the law (compared to 56 percent in February) and 37 percent have a favorable view (up sharply from 22 percent last month). Opinion among the uninsured in tracking polls has shown more month-to-month variation over time than among the total public, at least in part due to the relatively smaller sample size for this subgroup, but this month’s poll finds a clear change in direction, with attitudes shifting more positively towards the law after trending in a negative direction for several months. As more Americans gain coverage under the law, we can expect the group who remain uninsured to change over time, and some changes in opinion may be attributable to changes in who remains uninsured, rather than a shift in opinion among individuals.
The large majority of the public still gives both the federal government and their own state government a rating of “only fair” or “poor” when it comes to implementing the ACA, though ratings for both have inched up slightly since the end of 2013. Twenty-four percent now say the federal government is doing an “excellent” or “good” job, up 8 percentage points since December, and 28 percent now give a positive rating to their state government, up 5 percentage points in the same time frame. Positive ratings for state governments are also somewhat higher in states operating their own health care marketplace (37 percent say “excellent” or “good”) than in states that defaulted to the federal marketplace (24 percent).
| FIGURE 8: Federal And State Governments Get Poor Ratings For ACA Implementation | ||||
| Regardless of whether you support or oppose the health care law, how good a job would you say (INSERT) is doing implementing the law? | The federal government | Your state government | ||
| Total public | Total public | Among those in states operating their own marketplace | Among those in states defaulting to the federal marketplace* | |
| NET Excellent/Good | 24% | 28% | 37% | 24% |
| Excellent | 4 | 5 | 9 | 3 |
| Good | 20 | 23 | 28 | 21 |
| NET Only fair/Poor | 72% | 59% | 51% | 62% |
| Only fair | 33 | 33 | 32 | 33 |
| Poor | 39 | 26 | 19 | 29 |
| Don’t know/Refused | 4% | 14% | 12% | 14% |
| *includes states with a state-federal partnership exchange | ||||
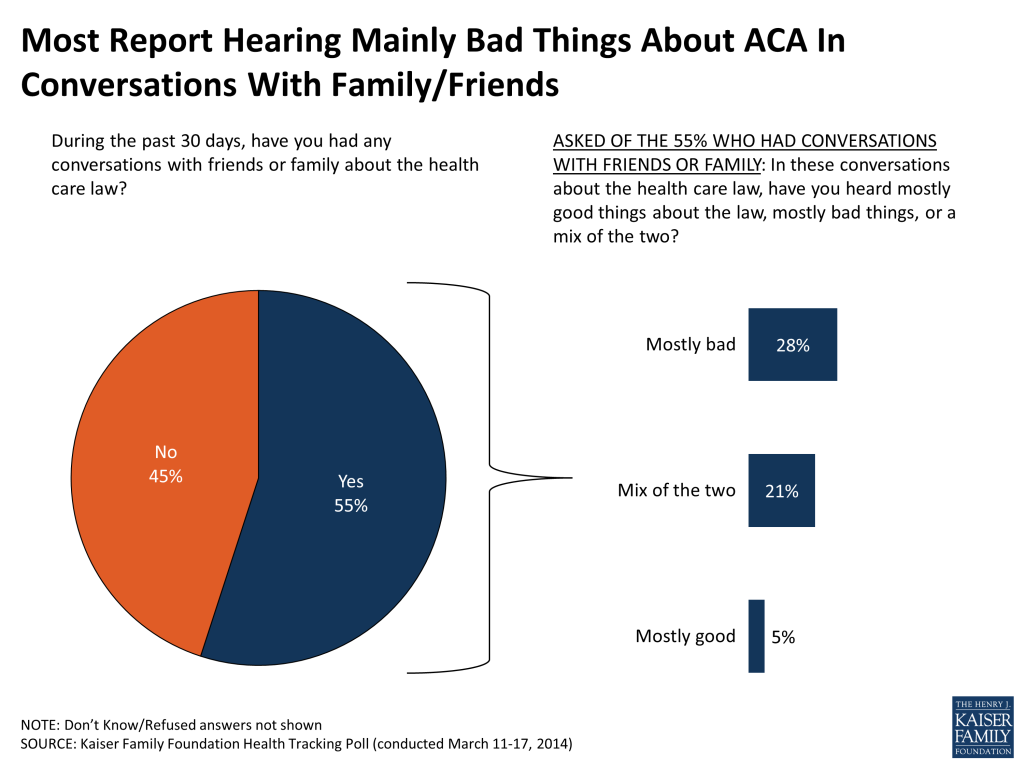
Over half report having personal conversations about ACA, but similar share are weary of national debate
The ACA was a common topic of personal conversations this month, and the public reports that the tone of those conversations was mostly negative. Just over half the public (55 percent) say they had at least one conversation about the law with friends or family in the past month, up from 31 percent in January 2012 (the last time this question was asked). About half those who say they discussed the law with friends or family (28 percent of the public overall) report hearing mostly bad things about the law in these discussions, while a much smaller share (5 percent of the public overall) say they heard mostly good things and the remainder say it was a mix of the two.
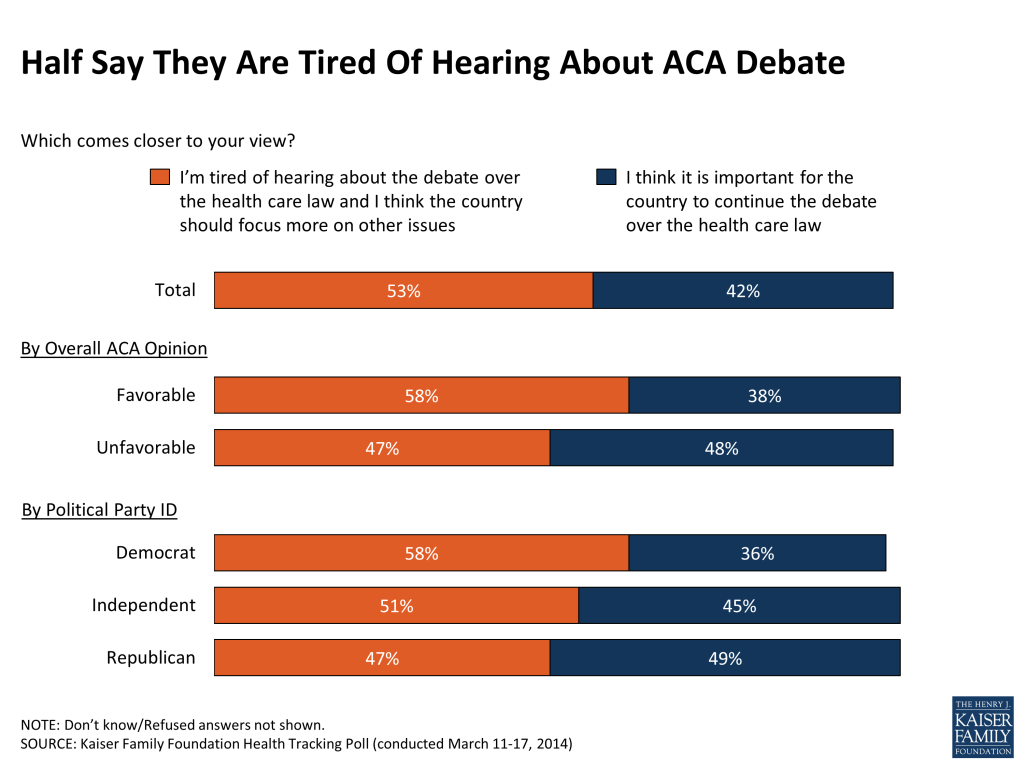
While personal conversations may be on the rise, many Americans appear to be weary of the national debate about the law. Just over half the public (53 percent) say they’re tired of hearing about the debate over the ACA and want the country to focus more on other issues, while about four in ten (42 percent) say they think it’s important for the country to continue the debate. Democrats and those with a favorable view of the law are more likely to say they’re tired of hearing about the debate, while Republicans and those who view the law unfavorably are more evenly split between those who are tired of hearing about it and those who want the debate to continue.
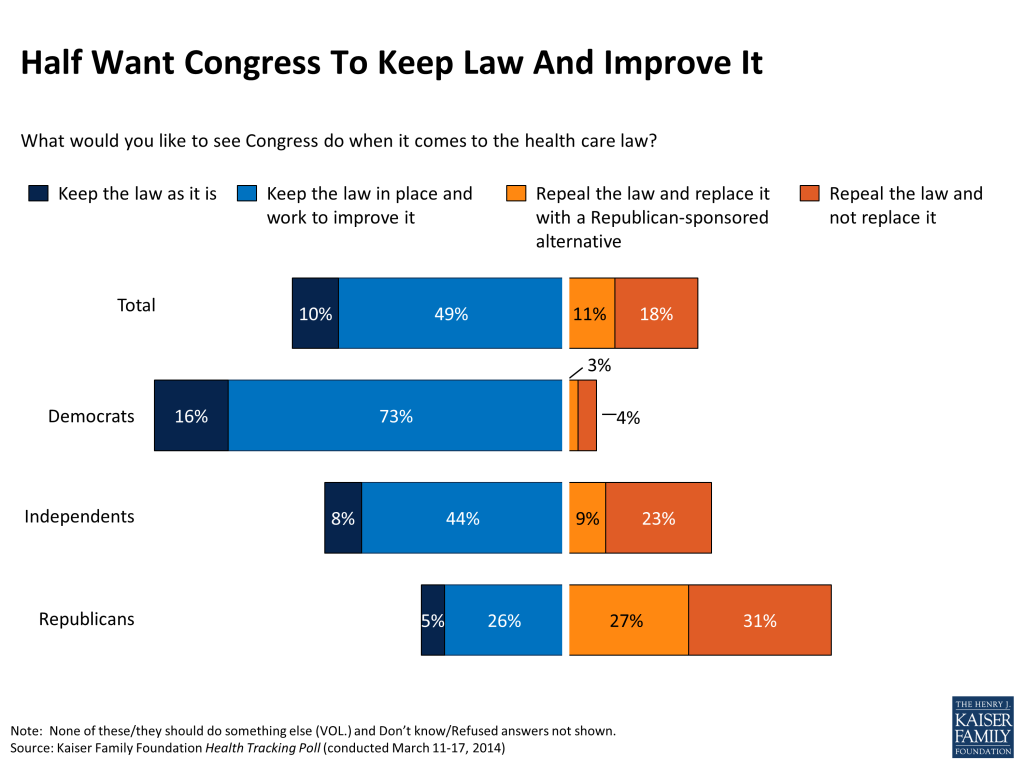
Perhaps reflecting this sense that the debate has gone on long enough, more of the public would like to see Congress keep the law in place and work to improve it (49 percent) or keep it as is (10 percent) rather than repeal it and replace it with a Republican-sponsored alternative (11 percent) or repeal it outright (18 percent).
Individual provisions mostly popular, including across parties, though many are not very well-known
As previous Kaiser tracking polls have found, many of the ACA’s major provisions continue to be quite popular, including across party lines. For example, large shares of Americans – including at least seven in ten overall and at least six in ten Democrats, Republicans, and independents – have a favorable view of the fact that the law allows young adults to stay on their parents’ insurance plans up to age 26, closes the Medicare “doughnut hole” for prescription drug coverage, provides subsidies to low- and moderate-income Americans to help them purchase coverage, eliminates cost-sharing for preventive services, gives states the option of expanding Medicaid, and prohibits insurance companies from denying coverage based on pre-existing conditions. Nearly as many (including a majority across parties) have a favorable view of the “medical loss ratio” provision that requires insurance companies to give their customers a rebate if they spend too little money on services and too much on administration and profits. Somewhat more divisive is the law’s Medicare payroll tax on earnings for upper-income Americans, which is viewed favorably by about three-quarters of Democrats and just over half of independents, but just a third of Republicans.
The glaring exception to the popularity of individual provisions of the law is the requirement that nearly all Americans have health insurance or pay a fine, which is viewed unfavorably by roughly two-thirds of the public.
| FIGURE 12: Many Elements Of ACA Continue To Be Popular Across Parties | ||||
| Percent who say they have a FAVORABLE opinion of each provision of the law | Total Public | Democrat | Independent | Republican |
| Extension of dependent coverage | 80% | 87% | 76% | 76% |
| Close Medicare “doughnut hole” | 79 | 89 | 75 | 73 |
| Subsidy assistance to individuals | 77 | 89 | 74 | 65 |
| Eliminate out-of-pocket costs for preventive services | 77 | 81 | 76 | 75 |
| Medicaid expansion | 74 | 89 | 69 | 62 |
| Guaranteed issue | 70 | 74 | 70 | 69 |
| Medical loss ratio | 62 | 68 | 64 | 54 |
| Increase Medicare payroll tax on upper income | 56 | 77 | 54 | 33 |
| Individual mandate/penalty | 35 | 56 | 31 | 16 |
| Note: Question wording abbreviated. For full question wording, see survey topline. | ||||
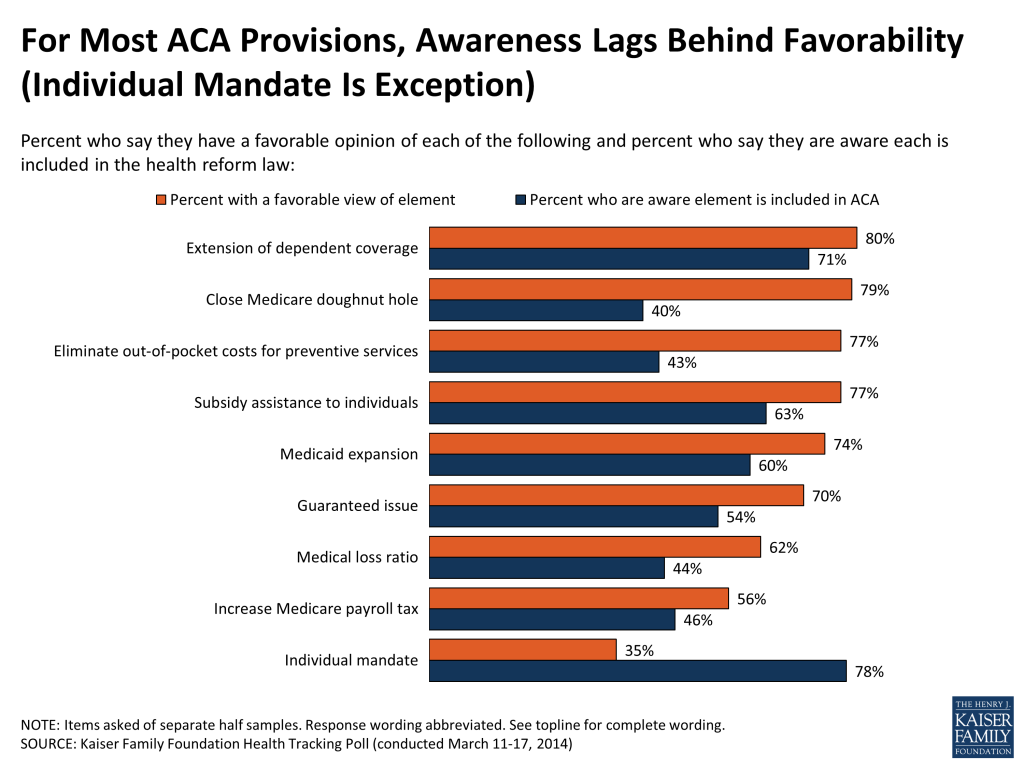
At the same time that the public reports having a favorable view of many of the component parts of the ACA, large shares remain unaware that the law actually does some of these things. A few of the law’s provisions are both popular and relatively well-known – for example, 71 percent are aware that the law extends dependent coverage up to age 26, and eight in ten have a favorable view of this provision. More than half are also aware of several other popular provisions, including the law’s subsidy assistance to low and moderate income individuals (63 percent), Medicaid expansion (60 percent), and the so-called “guaranteed issue” provision that prohibits insurance companies from denying coverage based on health status (54 percent). Yet, in each of these three cases, the share who are aware of the provision lags roughly 15 percentage points behind the share who view it favorably.
Two other popular provisions are even less well-known. Fewer than half (43 percent) are aware that the law eliminates out-of-pocket costs for preventive services, and just four in ten (40 percent, including 38 percent of seniors) know that it gradually closes the Medicare prescription drug “doughnut hole.” At the other end of the spectrum, the law’s least popular provision – the individual mandate – is widely recognized, with nearly eight in ten (78 percent) correctly answering that the ACA requires nearly all Americans to have health insurance or else pay a fine.
Misperceptions also persist about things the ACA does not actually do. For example, nearly half the public (46 percent) think the law allows undocumented immigrants to receive financial help from the government to buy health insurance, and another two in ten (22 percent) are unsure whether it does. A third of the public (34 percent, including 32 percent of seniors) believe the law establishes a government panel to make decisions about end-of-life care for people on Medicare, with another quarter saying they are unsure (23 percent of the public, 25 percent of seniors).
| FIGURE 14: Misperceptions About ACA Continue | |||
| To the best of your knowledge, would you say the health reform law does or does not do each of the following? | CORRECT | INCORRECT | |
| No | Yes | Don’t Know/Refused | |
| Allow undocumented immigrants to receive financial help from the government to buy health insurance | 32% | 46% | 22% |
| Establish a government panel to make decisions about end-of-life care for people on Medicare | 44 | 34 | 23 |
This Kaiser Health Tracking Poll was designed and analyzed by public opinion researchers at the Kaiser Family Foundation (KFF) led by Mollyann Brodie, Ph.D., including Liz Hamel, Bianca DiJulio, and Jamie Firth. The survey was conducted March 11-17, 2014, among a nationally representative random digit dial telephone sample of 1,504 adults ages 18 and older, living in the United States, including Alaska and Hawaii (note: persons without a telephone could not be included in the random selection process). Computer-assisted telephone interviews conducted by landline (753) and cell phone (751, including 415 who had no landline telephone) were carried out in English and Spanish by Princeton Data Source under the direction of Princeton Survey Research Associates International (PSRAI). Both the random digit dial landline and cell phone samples were provided by Survey Sampling International, LLC. For the landline sample, respondents were selected by asking for the youngest adult male or female currently at home based on a random rotation. If no one of that gender was available, interviewers asked to speak with the youngest adult of the opposite gender. For the cell phone sample, interviews were conducted with the person who answered the phone. KFF paid for all costs associated with the survey.
The combined landline and cell phone sample was weighted to balance the sample demographics to match estimates for the national population using data from the Census Bureau’s 2012 American Community Survey (ACS) on sex, age, education, race, Hispanic origin, nativity (for Hispanics only), and region along with data from the 2010 Census on population density. The sample was also weighted to match current patterns of telephone use using data from the January-June 2013 National Health Interview Survey. The weight takes into account the fact that respondents with both a landline and cell phone have a higher probability of selection in the combined sample and also adjusts for the household size for the landline sample. All statistical tests of significance account for the effect of weighting.
The margin of sampling error including the design effect for the full sample is plus or minus 3 percentage points. Numbers of respondents and margin of sampling error for key subgroups are shown in the table below. For results based on other subgroups, the margin of sampling error may be higher. Sample sizes and margin of sampling errors for other subgroups are available by request. Note that sampling error is only one of many potential sources of error in this or any other public opinion poll.
| Group | N (unweighted) | M.O.S.E. |
| Total | 1,504 | ±3 percentage points |
| Uninsured, ages 18-64 | 150 | ±9 percentage points |
| Favorable Opinion of the ACA | 599 | ±5 percentage points |
| Unfavorable Opinion of the ACA | 714 | ±4 percentage points |
| Those in states with state-run exchanges | 519 | ±5 percentage points |
| Those in states with federal exchanges | 985 | ±4 percentage points |
| Democrats | 480 | ±5 percentage points |
| Republicans | 326 | ±6 percentage points |
| Independents | 505 | ±5 percentage points |