Medicaid Moving Forward
Issue Brief
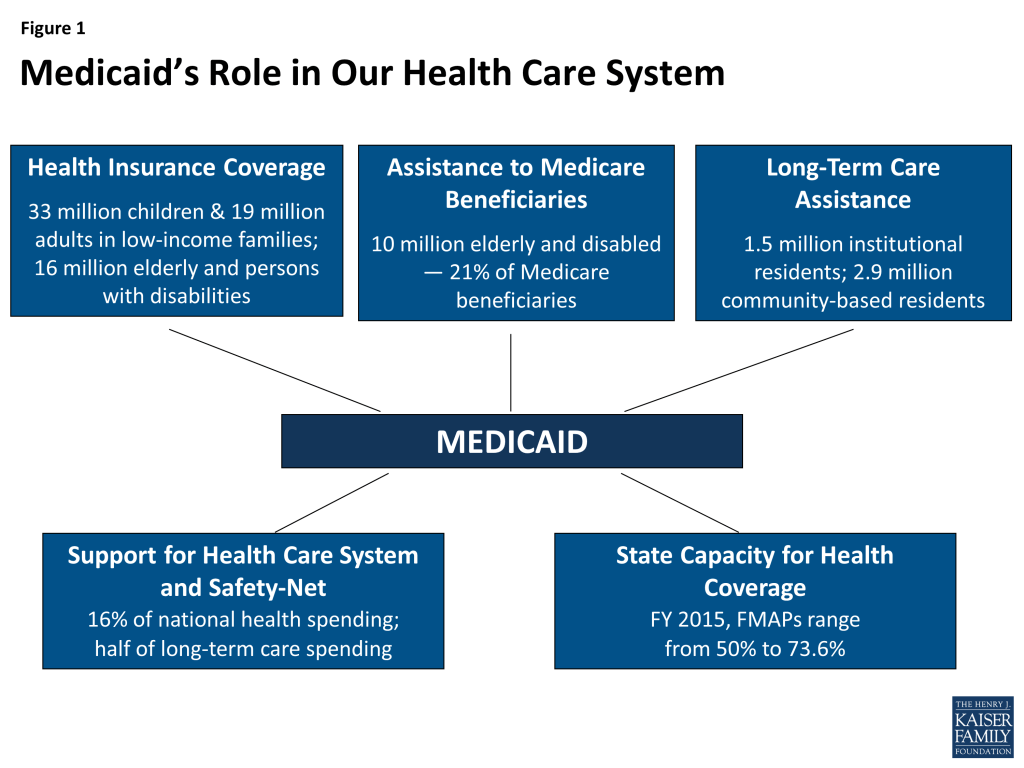
Medicaid is the nation’s main public health insurance program for people with low income and the single largest source of public health coverage in the U.S. covering nearly 70 million Americans. 1 States design and administer their own Medicaid programs within federal requirements, and states and the federal government finance the program jointly. Medicaid plays many roles in our health care system (Figure 1). Medicaid coverage facilitates access to care for beneficiaries, covering a wide range of benefits and tightly limiting out-of-pocket costs for care. As a major payer, Medicaid is a core source of financing for safety-net hospitals and health centers that serve low-income communities, including many of the uninsured. It is also the main source of coverage and financing for both nursing home and community-based long-term care. Altogether, Medicaid finances 16% of total personal health spending in the U.S.
The Affordable Care Act (ACA), enacted on March 23, 2010, expanded the Medicaid program significantly as part of a broader plan to cover millions of uninsured Americans.2 Specifically, the ACA expanded Medicaid eligibility to nearly all non-elderly adults with income at or below 138% of the federal poverty level (FPL) – about $16,245 for an individual in 2015. This expansion established a new coverage pathway for millions of uninsured adults who were previously excluded from Medicaid, beginning January 1, 2014. The law also provided for 100% federal funding of the expansion through 2016, declining gradually to 90% in 2020 and future years. However, the Supreme Court ruling on the ACA in June 2012 effectively made the Medicaid expansion optional for states.
Beyond expanding Medicaid, the ACA introduced other reforms that improve the program in all states, regardless of their Medicaid expansion decision. The law required states to simplify and modernize their enrollment processes, and to create a coordinated eligibility and enrollment system for Medicaid, the Children’s Health Insurance Program (CHIP), and the Marketplace, to facilitate enrollment and promote continuity of coverage. The ACA also established an array of new authorities and funding opportunities for delivery system and payment reform initiatives in Medicare, Medicaid, and CHIP, designed to advance better and more cost-effective models of care, particularly for those with high needs and costs, whose care is poorly coordinated, leading to both serious gaps and costly redundancy. Finally, the law provided new options and incentives to help states rebalance their Medicaid long-term care programs in favor of community-based services and supports rather than institutional care. Collectively, these provisions have accelerated Medicaid innovation already underway in many states. Because Medicaid covers many of the highest-need populations in the U.S., states have unique financial and policy leverage to reform the systems of care that serve them.
Between action in many states to strengthen the Medicaid program and far-reaching ACA provisions in key Medicaid domains, Medicaid is in a period of historic transformation. While data and analysis on the impact of the changes underway will take time to emerge, this issue brief provides a current profile of Medicaid and highlights developments in the program unfolding at the federal and state level. National and state-level data on key dimensions of the Medicaid program are included in a set of tables following the brief.
Who does Medicaid cover?
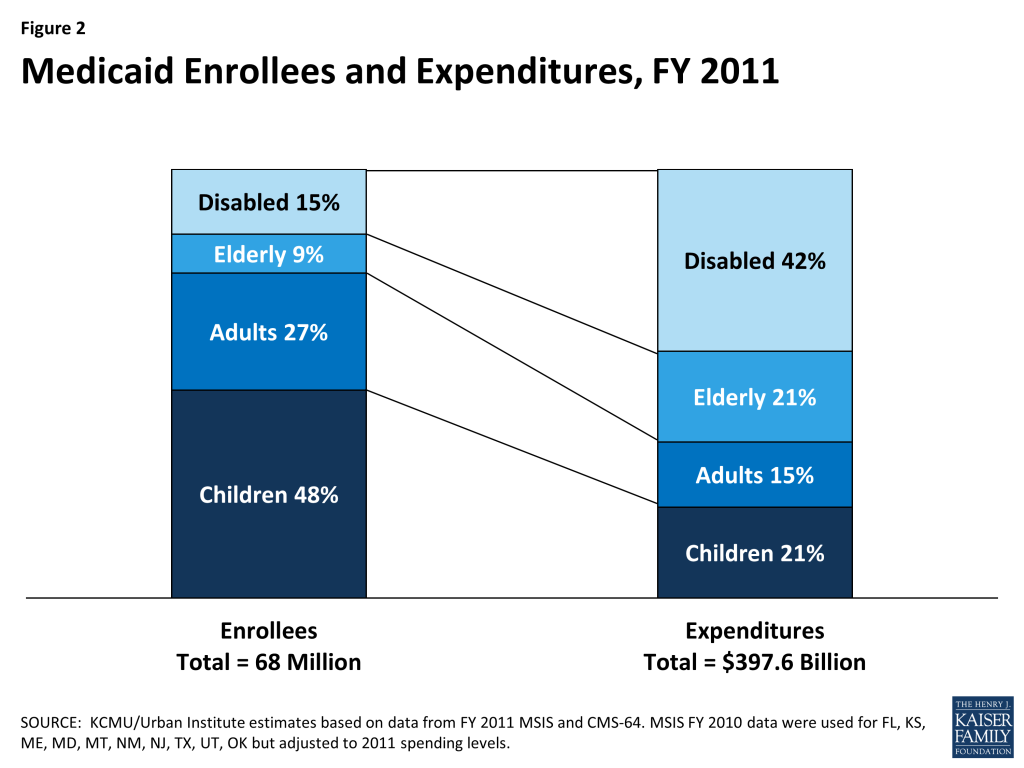
Before the ACA, federal law provided federal funding for Medicaid only for specified categories of low-income individuals: children, pregnant women, parents of dependent children, individuals with disabilities, and people age 65 and older. States were required to cover individuals in these groups up to federal minimum income thresholds, but also had the option to expand coverage to people at higher income levels. Importantly, prior to the ACA low-income adults were largely excluded from Medicaid. In FY 2011, the most current year for which national data are available, about three-quarters of all Medicaid beneficiaries were children and non-elderly, non-disabled adults (primarily, working parents), and the elderly and younger people with disabilities accounted for the remaining one-quarter (Figure 2).
Over the last 25 years, many states have taken action to expand coverage for children. To illustrate, while federal law required states to provide Medicaid for children up to at least 100% FPL (133% FPL for children under age 6), as of January 2015, 27 states (including DC) had expanded eligibility to at least 255% FPL under Medicaid or CHIP, and in 19 of these states, the eligibility cut-off was over 300% FPL. Together, Medicaid and CHIP now cover more than 1 in every 3 children, and the role of the programs is even larger among low-income children and children of color. In December 2014, 29.1 million children were enrolled in Medicaid and CHIP—the vast majority in Medicaid.3
The history of Medicaid coverage of adults is sharply different. In 2013, before the ACA Medicaid expansion took effect, the median state Medicaid income eligibility cut-off for working parents was 61% FPL and, in most states, non-elderly adults without dependent children (“childless adults”) were categorically ineligible for Medicaid.4 States’ income eligibility thresholds have typically been higher for the elderly and people with disabilities. States generally must provide Medicaid automatically to seniors and people with disabilities who receive Supplemental Security Income (SSI) benefits, for which the federal benefit rate is 74% FPL.5 States also have the option to cover elderly individuals and people with disabilities who have more income or high medical expenses relative to their income.6 The ACA did not alter the Medicaid eligibility rules for these two groups, but some adults with disabilities with too much income to qualify through the Medicaid disability pathway may now qualify for Medicaid through the adult expansion group (in states that have adopted the expansion) .
In FY 2010, 14% of all Medicaid beneficiaries – 9.6 million – were “dual eligible” seniors and younger persons with disabilities who are covered by Medicare as well. One of every five Medicare beneficiaries is a dual eligible. Dual eligible beneficiaries are very poor and many have high health and long-term care needs. Medicaid assists them with their Medicare premiums and cost-sharing, and covers full Medicaid benefits for a large majority of them – most importantly, long-term services and supports, which Medicare does not cover.
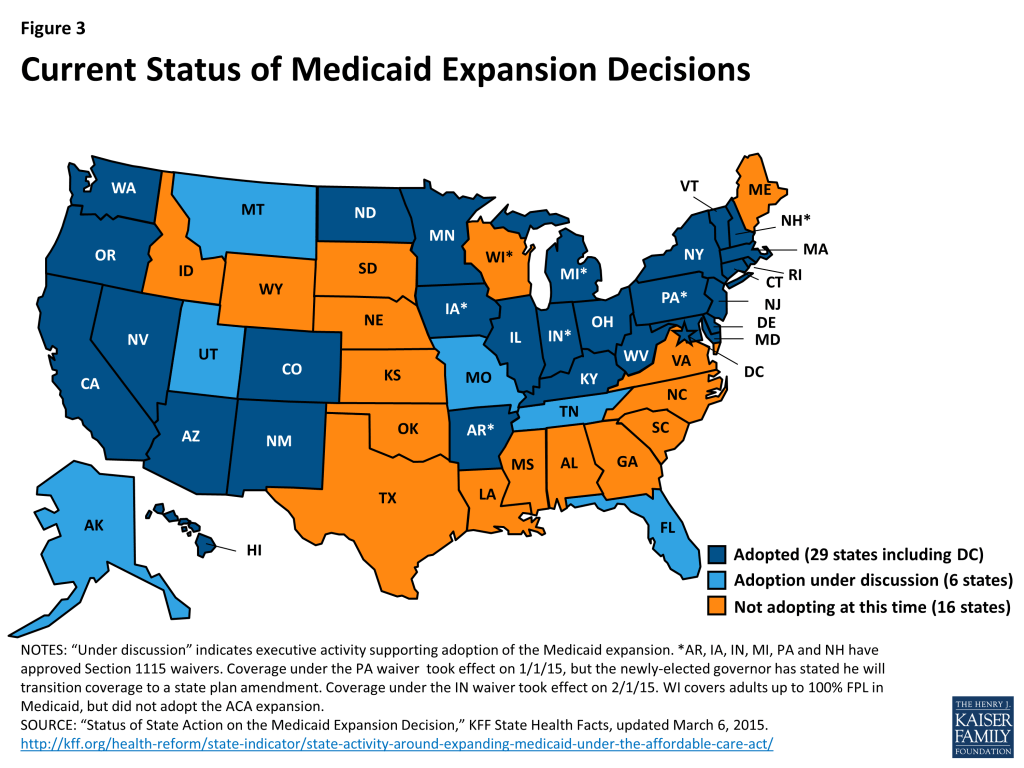
Key ACA reforms. The ACA fundamentally reformed Medicaid by establishing eligibility for nonelderly adults, and also by putting in place a uniform, national minimum income eligibility threshold of 138% FPL for nearly all individuals under age 65. The effect of these changes was to establish Medicaid as the coverage pathway for low-income people in the ACA’s broader system for covering the uninsured. As noted earlier, although the Medicaid expansion was intended to be national, the Supreme Court ruling essentially made it optional for states. To date, 29 states (including DC) have adopted the expansion and six states are discussing it; 16 states are not adopting the expansion at this time (Figure 3). Between the three-month period leading up to the first ACA open enrollment period in October 2013, and December 2014, Medicaid and CHIP enrollment increased by more than 10.7 million individuals in the 49 states reporting data for both periods.7
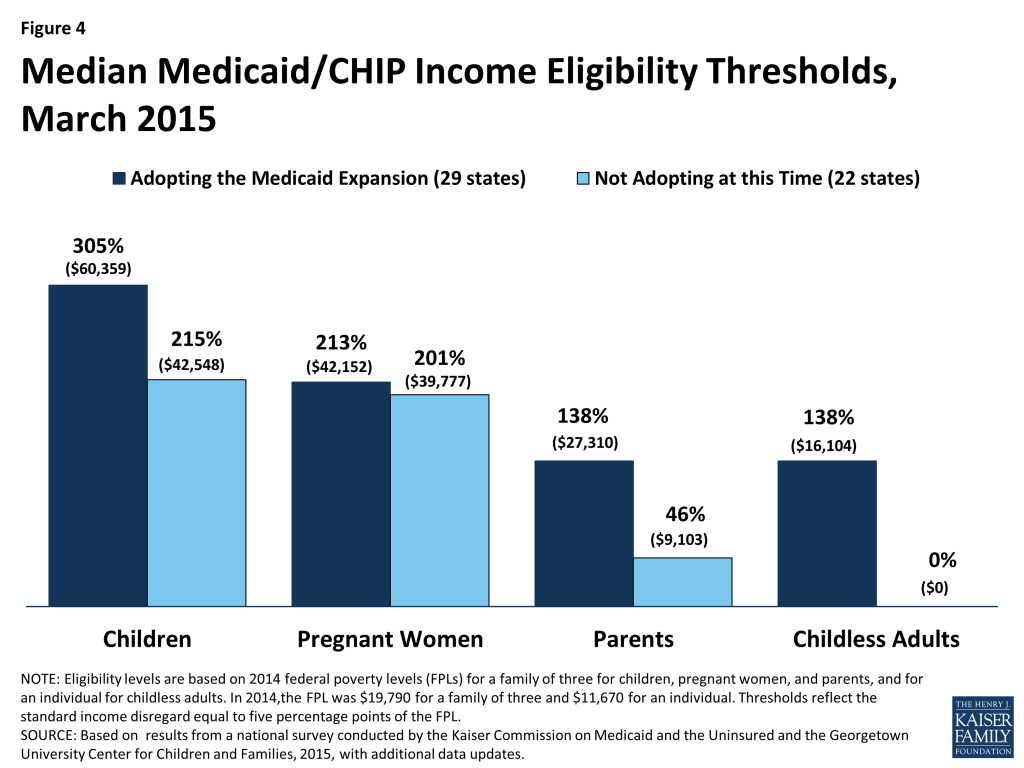
States’ Medicaid expansion decisions have major implications for low-income adults. Whereas the expansion states provide Medicaid for adults up to 138% FPL, as of January 2015, the median Medicaid income limit for parents in the non-expansion states is just 46% FPL (about $9,200 for a family of three in 2015), and in all but one of the non-expansion states, childless adults remain ineligible for Medicaid (Figure 4).8 Because the ACA provided Medicaid eligibility for low-income adults, it did not provide financial assistance to purchase Marketplace coverage for those below 100% FPL. As a result, in the states not adopting the Medicaid expansion, almost 4 million uninsured poor adults fall into a “coverage gap.”9
The ACA protected the gains in children’s coverage that have been achieved over time in Medicaid and CHIP. The national Medicaid minimum income eligibility threshold of 138% FPL applies to all children up to age 19, and the law requires states to maintain at least the eligibility limits they had in place when the ACA was enacted, through September 30, 2019. Also, as of 2014, states must provide Medicaid coverage for children aging out of foster care, up to age 26. Finally, the ACA extends CHIP funding through 2015, and provides for a 23 percentage-point increase in the federal matching rates under CHIP during the period FY 2016-2019 if the Congress extends CHIP funding beyond 2015.10
What services does Medicaid cover?
Medicaid covers a wide range of services to meet the diverse needs of the populations it serves. Medicaid benefits include both acute care services and a broad array of long-term services and supports that Medicare and most private insurance plans do not cover or tightly limit. States have flexibility to charge limited premiums and cost-sharing in Medicaid, subject to federal parameters. Premiums are generally prohibited for beneficiaries with income below 150% FPL. Cost-sharing for people with income below 100% FPL is limited to “nominal” amounts specified in federal regulations, with higher levels allowed for beneficiaries at higher income levels. However, certain groups are exempt from cost-sharing, including mandatory eligible children, pregnant women, most children and adults with disabilities, people residing in institutions, and people receiving hospice care. In addition, certain services are exempt from cost-sharing: emergency services, preventive services for children, pregnancy-related services, and family planning services. Total Medicaid premiums and cost-sharing for a family cannot exceed 5% of the family’s income on a quarterly or monthly basis.11
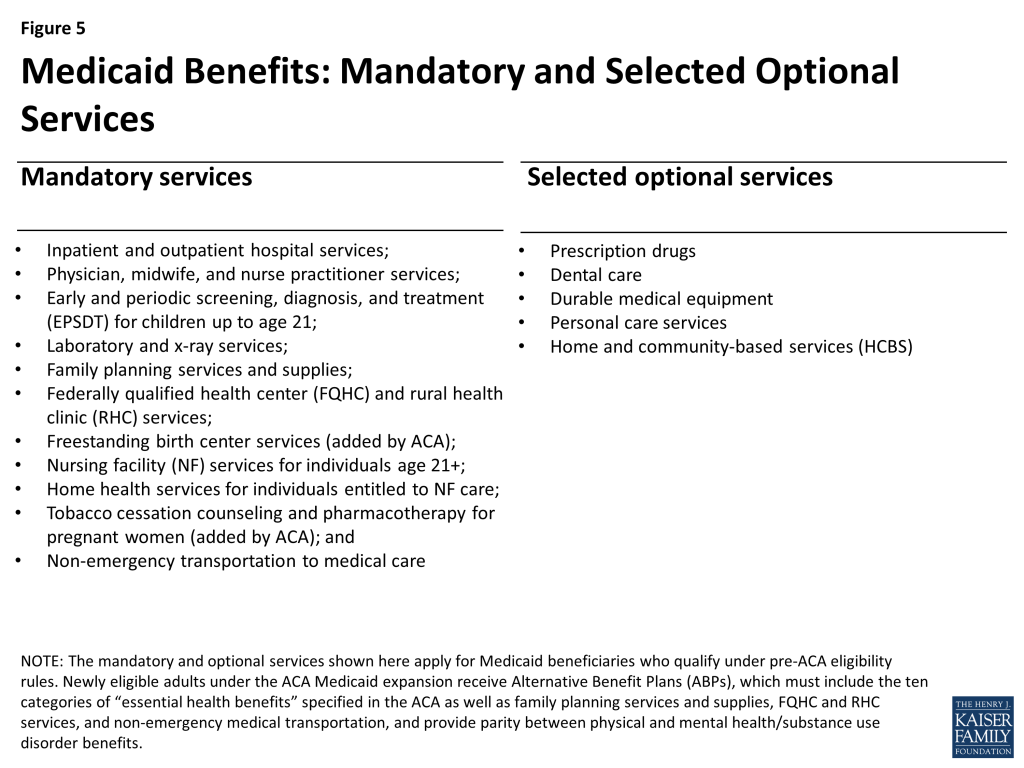
States are required by federal law to cover specified “mandatory” services in Medicaid, and they can also elect to cover many services designated as “optional” (Figure 5); these benefits apply to adults eligible for Medicaid under pre-ACA eligibility rules. Many states choose to cover prescription drugs (all states), dental care, durable medical equipment, and personal care services. The Medicaid benefit package for children, known as EPSDT (Early and Periodic Screening, Diagnosis, and Treatment), is uniquely comprehensive, addressing children’s developmental as well as health care needs, and includes many services that are critical for children with special health care needs. Under EPSDT, children up to age 21 are entitled to all medically necessary Medicaid services, including optional services, even if the state does not cover them for adults.
In addition to nursing facility and home health benefits, which are mandatory long-term care services, states also cover many optional home and community-based services (HCBS).12 HCBS include targeted case management, personal care services, family and caregiver training and support; rehabilitative services, housing coordination to help individuals locate and obtain community housing; and a diversity of other services. Medicaid is the main payer for post-acute institutional and community-based long-term care in the U.S., financing 40% of total spending in this area.13
Until relatively recently, federal law generally required states to provide the same benefits to all Medicaid beneficiaries statewide. Legislation enacted in 2006 gave states limited flexibility to provide “benchmark” benefits to some Medicaid beneficiaries based on one of three commercial insurance plans specified in the law or a benefit package determined appropriate by the HHS Secretary. However, few states actually used the benchmark authority. States also have authority to use Medicaid dollars to pay premiums for job-based health insurance for Medicaid beneficiaries who are offered it, an approach known as “premium assistance.” States must generally provide wrap-around services and cost-sharing protection to fill in any gaps between the private coverage and Medicaid.
Key ACA reforms. Under the ACA, most adults in the new Medicaid expansion group receive “Alternative Benefit Plans” (ABPs), which is the new term for the Medicaid benchmark options just mentioned. Medicaid ABPs must include the same ten essential health benefit (EHB) categories that Marketplace plans under the ACA must include. In addition, ABPs must provide parity between physical and mental health/substance use disorder benefits, offer the full range of EHB preventive services, and cover family planning services and supplies, FQHC and RHC services, and non-emergency medical transportation. Compared to traditional Medicaid benefits for adults, ABPs based on commercial insurance products may provide broader coverage of some services (e.g., behavioral health care, preventive care) and narrower coverage of other services (e.g., prescription drugs, long-term services).14 All but a few states have aligned their ABP with their traditional Medicaid benefit package for adults. Certain populations must have access to all Medicaid state plan benefits, even if they are eligible for Medicaid through the new adult expansion group. They include individuals who are medically frail or have special medical needs, including people with disabling mental health disorders and complex medical conditions, dual eligible beneficiaries, and specified other beneficiary groups.
Revised regulations on Medicaid premiums and cost-sharing limit copayments for those with income at or below 100% FPL to $4 for outpatient services, $8 for non-preferred drugs and non-emergency use of the emergency department, and $75 per inpatient admission; as before, states can charge higher cost-sharing for beneficiaries with income above 100% FPL.15 The prohibition against premiums for those at or below 150% FPL, the exemptions mentioned earlier, and the 5% aggregate cap on premiums and cost-sharing remain in place.
How do Medicaid beneficiaries get care?
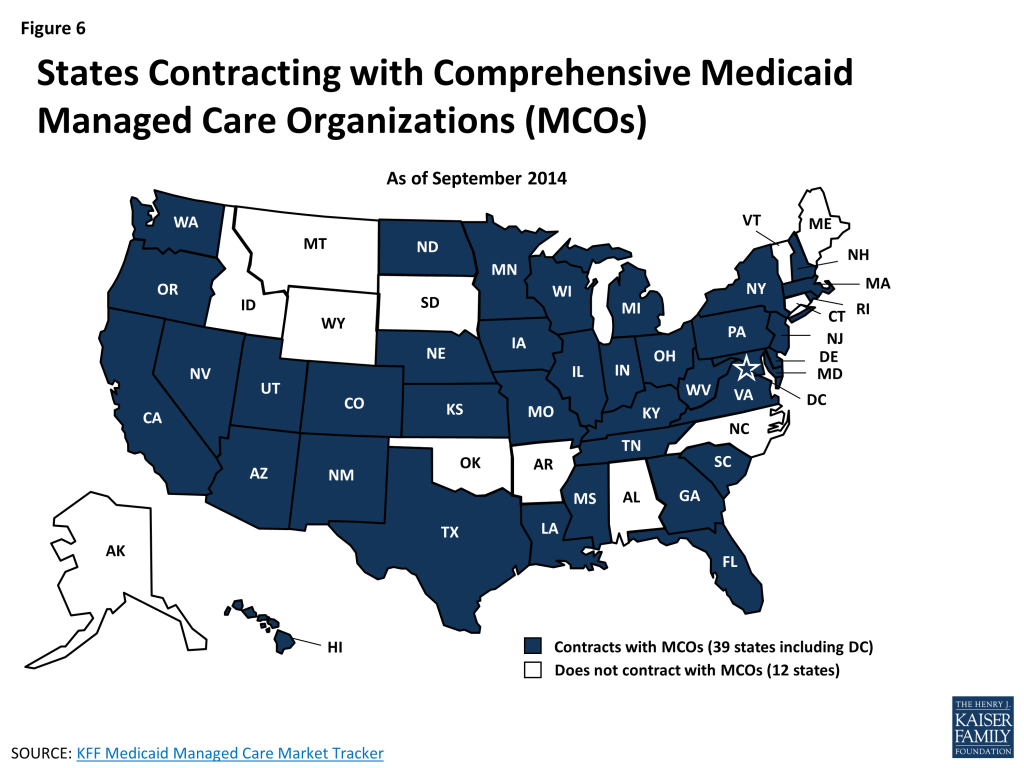
Most Medicaid beneficiaries obtain their care from private office-based physicians and other health professionals. Safety-net health centers and hospitals also play a major role in serving the Medicaid population. Thirty-nine states now contract with comprehensive managed care organizations (MCOs) to serve at least some Medicaid beneficiaries, and nationally, over half of all Medicaid beneficiaries – primarily children and parents – get their care through these plans (Figure 6). States pay the MCOs a monthly premium for each enrolled Medicaid beneficiary. States are relying increasingly on MCOs, expanding managed care to include higher-need Medicaid populations, such as people with disabilities and dual eligible beneficiaries, as well as Medicaid expansion adults. States are also adopting managed long-term services and supports. Many Medicaid beneficiaries who are not in risk-based MCOs are enrolled in Primary Care Case Management (PCCM) programs, in which states pay for care on a fee-for-service basis but also pay contracted primary care providers an additional small monthly fee to coordinate care for their Medicaid patients. Both risk-based managed care and PCCM programs can be understood, in part, as means of establishing networks of participating providers and garnering greater access to care for Medicaid beneficiaries.
On the long-term care front, states have been working over the last several decades to rebalance their programs by devoting more of their long-term care spending to HCBS rather than institutional care. While the majority of Medicaid long-term care spending still goes toward institutional care, the share spent on HCBS continues to grow. In FY 2013, HCBS accounted for 46% of total Medicaid long-term care spending, up from 32% in FY 2002.16
Key ACA reforms. The ACA includes many investments, funding opportunities, demonstration programs, and new authorities designed to drive health care delivery and payment system reforms in Medicaid and other public insurance programs. These provisions have accelerated ongoing innovation in Medicaid programs, including implementation of models like patient-centered medical homes and accountable care organizations (ACOs) that involve a more central role for preventive and primary care, increased care coordination for beneficiaries with complex needs, and financial incentives linked to performance. States are combining and integrating these approaches in different ways with their underlying delivery and payment systems in Medicaid. The ACA also provides states with expanded options and enhanced federal financing to improve access to and delivery of Medicaid long-term services and supports, and to provide incentives to states to shift more long-term care spending to HCBS. Nearly every state has adopted at least one of six key Medicaid LTSS options contained in the ACA, with many states pursuing multiple options.17
How is access to care in Medicaid?
Medicaid beneficiaries fare much better than the uninsured on key measures of access to care, utilization, unmet need, and financial protection. The vast majority of Medicaid beneficiaries have a usual source of care, compared to sizable shares of the uninsured who do not, and they are significantly more likely to see a doctor (Figure 7). Medicaid also lowers financial barriers to care and limits out-of-pocket costs, and Medicaid beneficiaries are much less likely than the uninsured to report unmet health care needs.18 19 20
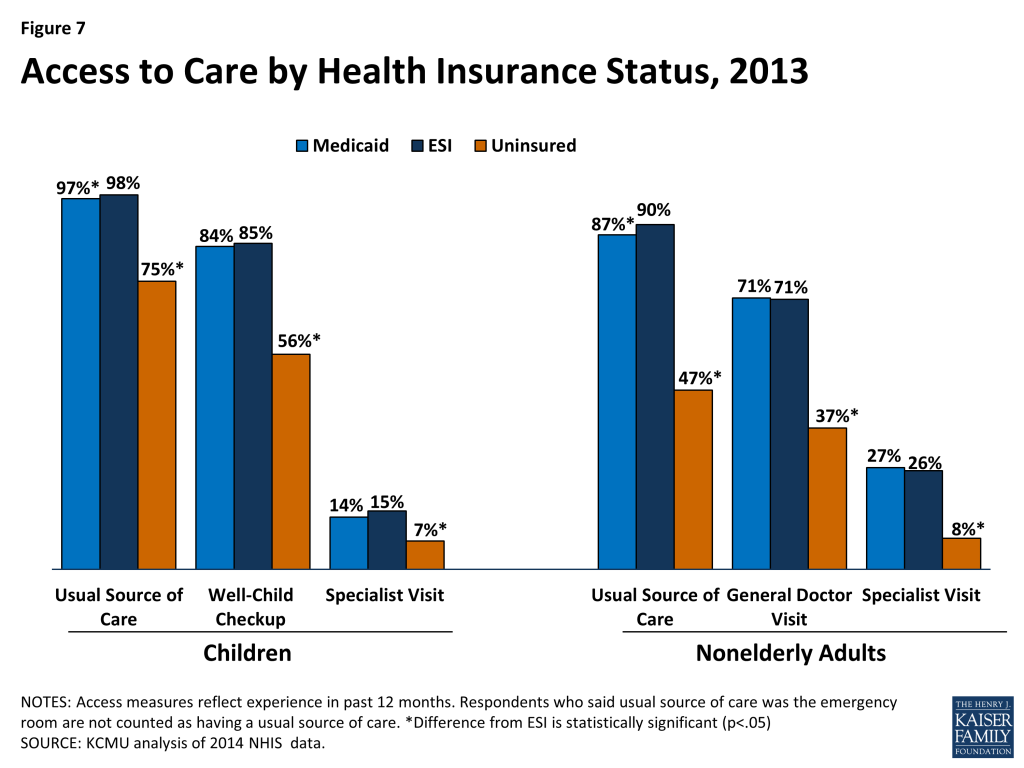
Comparisons between Medicaid and private insurance are also informative. Research based on national surveys shows that both children and adults in Medicaid have access to and use primary and preventive care at rates comparable to their counterparts with employer-sponsored insurance (ESI). When demographic, health status, and socioeconomic differences between the two insured populations are controlled, the shares with a usual source of care are similar, as are the shares with any office or doctor visit, and the shares with any specialist visit.21 Likewise, controlling for these differences, the percentages of children with unmet needs for medical care, dental care, or prescription drugs due to cost are comparable between the two insured groups (and low); among adults, rates of unmet needs due to cost are lower for those with Medicaid, although unmet needs due to non-financial barriers, like transportation, are higher for Medicaid adults.
Although analyses of survey data show quite robust access to care in Medicaid,22 other research highlights important challenges and gaps. Physician participation is more limited in Medicaid than in Medicare or private insurance.23 Physicians’ lower participation in Medicaid is often attributed to low payment rates in Medicaid, although evidence on the impact of fees on participation is mixed.24 Low participation of psychiatrists in Medicaid and shortages of substance abuse treatment professionals25 are a particular concern because of the high prevalence of behavioral health conditions among Medicaid beneficiaries; for beneficiaries with physical and behavioral health comorbidities, lack of access to behavioral health care can adversely affect management of their physical chronic conditions as well. Dentist participation in Medicaid is also low, but children with Medicaid are on par with privately insured children in terms of dental care (overall, use of dental care for children falls well below recommended levels). Adult access to dental care in Medicaid is a more significant problem. Coverage of adult dental services is optional in Medicaid and many states only cover care for pain relief or emergency dental care for injuries, trauma, or extractions; many also impose tight dollar caps on adult dental benefits.26
According to a 2012 report by the Government Accountability Office, 38 states reported that they experienced challenges securing sufficient provider participation in Medicaid, with the leading reasons being overall provider shortages and low Medicaid payment rates.27 “Secret shopper” studies indicate more limited availability of new patient appointments for Medicaid beneficiaries compared to privately insured people.28 As managed care expands, provider payment rates are increasingly a matter of MCO policy rather than states’ Medicaid fee schedules and MCOs are responsible for establishing provider networks that are adequate to meet the needs of their enrollees. State and federal enforcement of network adequacy standards is essential to ensure that Medicaid managed care enrollees have robust access to care. Two recent reports by the HHS Office of Inspector General highlight significant shortcomings in oversight, including limited state enforcement actions against MCO violation of access standards and widespread inaccuracies in Medicaid provider directories.29 Finally, Medicaid beneficiaries face other barriers to access, including limited access to after-hours care and lack of transportation.
Key ACA reforms. The ACA made a number of major investments to expand access to care in Medicaid as enrollment in the program grows. For 2013 and 2014, the law raised Medicaid fees for most primary care physician services to Medicare fee levels, providing full federal financing for the increase. As a result, Medicaid fees for the affected services rose by an average of 73% overall. Study findings showing that the increase in primary care reimbursement rates resulted in higher availability of new-patient appointments for Medicaid enrollees provides evidence that provider payment rates can be an effective lever for expanding access.30 In the Kaiser Family Foundation’s recent 50-state survey of Medicaid directors, 15 states indicated that they planned to extend the primary care physician fee increase in 2015, at least partially.31
The ACA also funded a vast expansion of community health centers and the National Health Service Corps, which supplies many of the physicians and other health professionals who staff them and provide care in underserved areas. As a result of these investments, along with the Medicaid expansion, which gives new revenues to health centers for many previously uninsured patients, health centers have been able to open many new sites, provide more comprehensive primary care services, including dental care and behavioral health services, and serve an increasing number of patients, now totaling over 21 million.
How much does Medicaid cost and how is it financed?
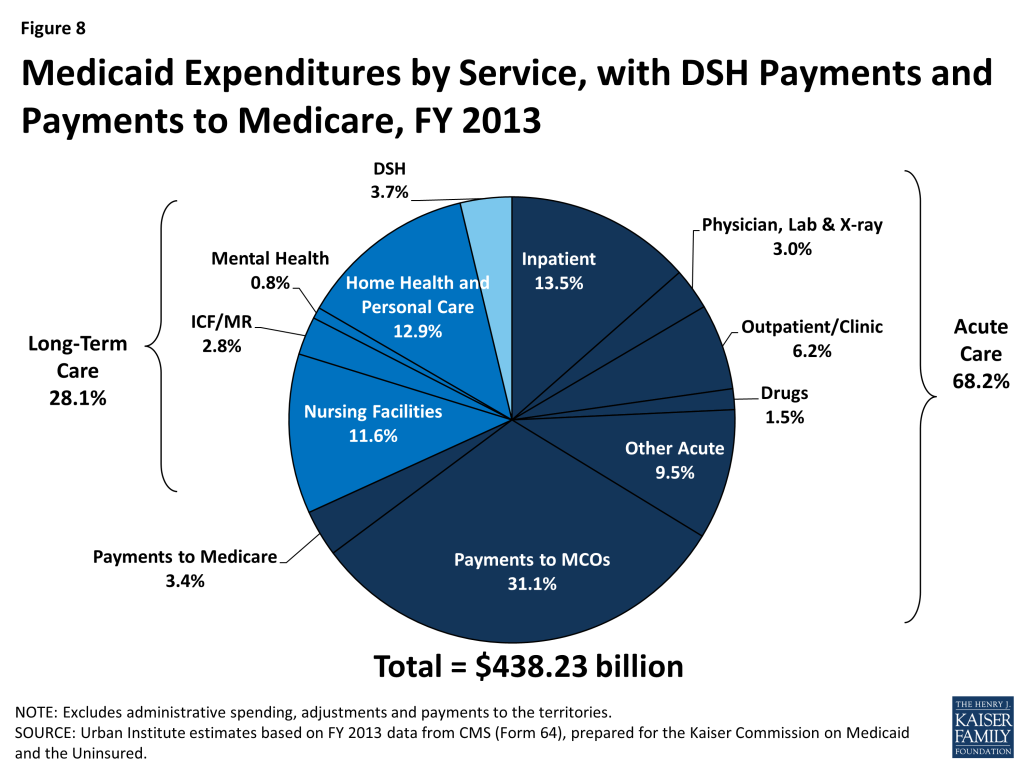
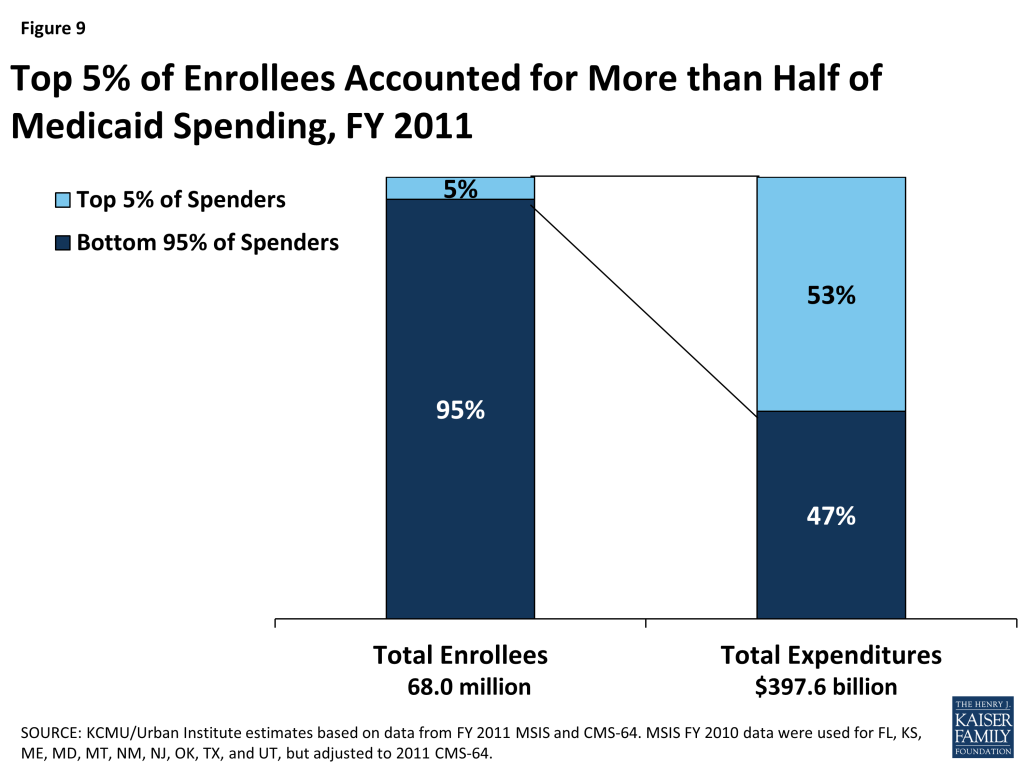
In FY 2013, Medicaid spending on services totaled almost $440 billion. About two-thirds of all spending was attributable to acute care and more than one-quarter was associated with long-term care (Figure 8). Supplemental payments to hospitals that serve a disproportionate share of Medicaid and uninsured patients, known as “DSH,” accounted for 3.7% of spending, and Medicaid spending for Medicare premiums and cost-sharing on behalf of dual eligible beneficiaries totaled 3.4%. As mentioned earlier, almost two-thirds of all Medicaid spending for services is attributable to the elderly and persons with disabilities, who make up just one-quarter of all Medicaid enrollees. Dual eligible beneficiaries alone account for almost 40% of all spending, driven largely by spending for long-term care. The 5% of Medicaid beneficiaries with the highest costs drive more than half of all Medicaid spending (Figure 9). Their high costs are attributable to their extensive needs for acute care, long-term care, or often both.
Medicaid spending is driven by multiple factors, including the number and mix of enrollees, medical cost inflation, utilization, and state policy choices about benefits, provider payment rates, and other program factors. During economic downturns, enrollment in Medicaid grows, increasing state Medicaid costs at the same time that state tax revenues are declining. States under recessionary pressures have frequently sought to constrain Medicaid spending through actions such as cutting provider payment rates or reducing benefits.
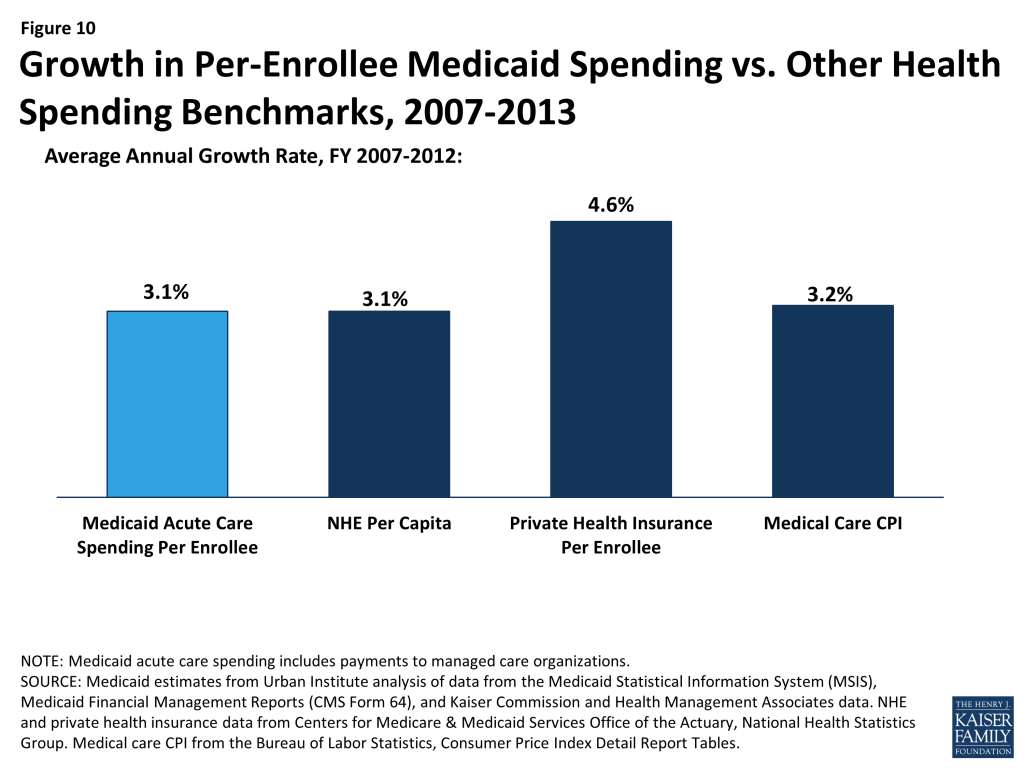
Increasingly, states are undertaking more fundamental transformation of their Medicaid payment and delivery systems both to control costs and to improve care, particularly for high-cost populations. Over the period 2007-2013, average annual growth in total Medicaid spending for acute care was 7.4%, but on a per-enrollee basis, spending growth was 3.1% – on par with both growth in national health expenditures per capita and medical cost inflation, and less than growth in private health insurance premiums per enrollee (Figure 10).32
States and the federal government share the cost of Medicaid. The federal government matches state Medicaid spending at least dollar for dollar for beneficiaries eligible for Medicaid under pre-ACA law. The federal match rate, known as the Federal Medical Assistance Percentage, or FMAP, varies based on relative state per capita income according to a formula specified in federal statute. The FMAP for FY 2015, which began October 1, 2014, ranges from the federal minimum of 50%, to 73.6% in Mississippi, the poorest state today.33 In 2012, the most recent year for which data are available, the federal share of total national Medicaid spending was about 57%.34
Key ACA reforms. The expansion of Medicaid in the states that have implemented it, and greater participation in Medicaid nationwide due to increased outreach and simplified eligibility and enrollment processes, is leading, as intended, to growing enrollment in Medicaid and, in turn, to higher total Medicaid spending. The federal government finances the vast majority of the new costs associated with the Medicaid expansion to adults – the federal match for newly eligible adults is 100% through 2016, and phases down gradually to 90%. In addition, the ACA provides enhanced federal financing for investments that all states can make, including, for example, the establishment of health home programs for Medicaid beneficiaries with chronic conditions, options to expand HCBS, and improvements in Medicaid data systems.
All states, including those not expanding Medicaid, are seeing increased Medicaid costs because of increased participation in Medicaid among people who are eligible under pre-ACA rules. States receive their regular federal match for these beneficiaries. As would be expected, total Medicaid spending growth in FY 2014 and FY 2015 was much higher in the Medicaid expansion states than the non-expansion states, but state Medicaid spending grew more slowly in the expansion states, reflecting these states’ access to the enhanced federal matching funds.35 States expanding Medicaid will pay a small share of the cost for the expansion adults beginning in 2017, reaching a maximum of 10% in 2020. However, many of these states expect offsets or net savings due to reduced state spending for uncompensated care and for state-funded mental health and other programs; broader economic effects of the Medicaid expansion, such as job growth and increased income and state tax revenues; and other impacts. States that are not expanding Medicaid are forgoing substantial federal funding for expanded coverage of their low-income residents.
Looking Ahead
Already an integral source of coverage and access for low-income Americans, including many individuals with complex health and long-term care needs, Medicaid’s role is growing further as the expansion to low-income adults and other key Medicaid reforms take hold. It will be important to track and assess how the program evolves under the ACA, and as Medicaid innovation at the state, health plan, and provider level advances and spreads. The unprecedented transformation and experimentation now underway in Medicaid provide an opportunity to identify successful enrollment and renewal practices, strategies to ensure access to care, effective models of person-centered and coordinated care, and payment systems that align financial incentives with goals for quality and cost. Progress in all these areas can further strengthen the Medicaid program and benefit the millions of people it serves.
Tables
| Table 1: Medicaid Enrollment by Group, FY 2011 | |||||||||
| State | Total | Aged | Disabled | Adult | Children | ||||
| Number | Number | % | Number | % | Number | % | Number | % | |
| United States | 68,039,600 | 6,411,400 | 9% | 10,055,800 | 15% | 18,639,200 | 27% | 32,931,900 | 48% |
| Alabama | 1,062,400 | 118,000 | 11% | 221,600 | 21% | 182,200 | 17% | 540,600 | 51% |
| Alaska | 138,600 | 9,500 | 7% | 18,000 | 13% | 31,400 | 23% | 79,800 | 58% |
| Arizona | 1,264,400 | 90,000 | 7% | 144,500 | 11% | 461,700 | 37% | 568,200 | 45% |
| Arkansas | 717,800 | 70,600 | 10% | 151,400 | 21% | 114,100 | 16% | 381,800 | 53% |
| California | 11,666,700 | 1,038,300 | 9% | 1,063,600 | 9% | 4,905,800 | 42% | 4,659,100 | 40% |
| Colorado | 745,100 | 51,500 | 7% | 94,900 | 13% | 161,100 | 22% | 437,600 | 59% |
| Connecticut | 786,100 | 108,300 | 14% | 82,000 | 10% | 277,400 | 35% | 318,300 | 40% |
| Delaware | 242,600 | 15,100 | 6% | 26,800 | 11% | 103,800 | 43% | 96,800 | 40% |
| DC | 233,600 | 18,800 | 8% | 38,400 | 16% | 92,400 | 40% | 84,000 | 36% |
| Florida | 3,703,400 | 470,200 | 13% | 573,700 | 15% | 762,000 | 21% | 1,897,500 | 51% |
| Georgia | 1,929,800 | 182,000 | 9% | 315,600 | 16% | 300,500 | 16% | 1,131,700 | 59% |
| Hawaii | 284,100 | 25,800 | 9% | 28,500 | 10% | 109,800 | 39% | 120,000 | 42% |
| Idaho | 271,900 | 19,200 | 7% | 43,700 | 16% | 39,100 | 14% | 169,600 | 62% |
| Illinois | 2,927,600 | 225,200 | 8% | 333,000 | 11% | 797,200 | 27% | 1,572,100 | 54% |
| Indiana | 1,231,700 | 93,000 | 8% | 188,500 | 15% | 252,200 | 20% | 698,100 | 57% |
| Iowa | 598,400 | 44,300 | 7% | 85,000 | 14% | 183,700 | 31% | 285,400 | 48% |
| Kansas | 394,400 | 37,700 | 10% | 77,400 | 20% | 54,900 | 14% | 224,300 | 57% |
| Kentucky | 947,100 | 98,300 | 10% | 242,400 | 26% | 144,600 | 15% | 461,800 | 49% |
| Louisiana | 1,285,400 | 117,100 | 9% | 237,300 | 18% | 252,200 | 20% | 678,800 | 53% |
| Maine | 375,900 | 67,300 | 18% | 75,800 | 20% | 106,800 | 28% | 126,000 | 34% |
| Maryland | 975,400 | 77,000 | 8% | 148,800 | 15% | 271,400 | 28% | 478,200 | 49% |
| Massachusetts | 1,508,900 | 154,900 | 10% | 345,200 | 23% | 618,600 | 41% | 389,400 | 26% |
| Michigan | 2,347,500 | 147,800 | 6% | 380,000 | 16% | 629,700 | 27% | 1,189,900 | 51% |
| Minnesota | 1,104,100 | 99,300 | 9% | 140,000 | 13% | 400,800 | 36% | 464,000 | 42% |
| Mississippi | 781,700 | 90,000 | 12% | 170,800 | 22% | 113,700 | 15% | 407,200 | 52% |
| Missouri | 1,148,800 | 96,300 | 8% | 215,800 | 19% | 234,700 | 20% | 602,000 | 52% |
| Montana | 128,800 | 11,000 | 9% | 21,600 | 17% | 20,500 | 16% | 75,700 | 59% |
| Nebraska | 276,300 | 24,700 | 9% | 40,400 | 15% | 47,500 | 17% | 163,800 | 59% |
| Nevada | 388,200 | 30,800 | 8% | 49,700 | 13% | 75,900 | 20% | 231,800 | 60% |
| New Hampshire | 171,500 | 16,300 | 10% | 31,900 | 19% | 22,700 | 13% | 100,600 | 59% |
| New Jersey | 1,055,900 | 151,400 | 14% | 176,300 | 17% | 141,700 | 13% | 586,500 | 56% |
| New Mexico | 576,100 | 42,800 | 7% | 67,900 | 12% | 115,800 | 20% | 349,600 | 61% |
| New York | 5,818,300 | 644,400 | 11% | 713,600 | 12% | 2,309,900 | 40% | 2,150,400 | 37% |
| North Carolina | 1,953,800 | 187,300 | 10% | 334,200 | 17% | 403,200 | 21% | 1,029,200 | 53% |
| North Dakota | 85,600 | 9,500 | 11% | 12,200 | 14% | 18,100 | 21% | 45,900 | 54% |
| Ohio | 2,247,300 | 179,700 | 8% | 383,000 | 17% | 554,500 | 25% | 1,130,000 | 50% |
| Oklahoma | 856,800 | 66,300 | 8% | 122,500 | 14% | 178,500 | 21% | 489,500 | 57% |
| Oregon | 729,500 | 62,900 | 9% | 103,700 | 14% | 210,200 | 29% | 352,700 | 48% |
| Pennsylvania | 2,531,200 | 251,800 | 10% | 640,800 | 25% | 528,700 | 21% | 1,109,900 | 44% |
| Rhode Island | 212,100 | 26,600 | 13% | 43,000 | 20% | 47,100 | 22% | 95,400 | 45% |
| South Carolina | 964,800 | 85,600 | 9% | 163,100 | 17% | 218,400 | 23% | 497,700 | 52% |
| South Dakota | 137,000 | 13,000 | 9% | 19,600 | 14% | 23,000 | 17% | 81,400 | 59% |
| Tennessee | 1,543,600 | 146,200 | 9% | 275,200 | 18% | 317,200 | 21% | 805,000 | 52% |
| Texas | 4,844,300 | 447,300 | 9% | 636,000 | 13% | 636,300 | 13% | 3,124,700 | 65% |
| Utah | 349,600 | 15,200 | 4% | 41,600 | 12% | 88,000 | 25% | 204,800 | 59% |
| Vermont | 200,000 | 22,300 | 11% | 25,700 | 13% | 83,200 | 42% | 68,800 | 34% |
| Virginia | 1,072,100 | 112,900 | 11% | 186,400 | 17% | 178,500 | 17% | 594,400 | 55% |
| Washington | 1,397,000 | 100,300 | 7% | 213,600 | 15% | 289,700 | 21% | 793,400 | 57% |
| West Virginia | 438,500 | 43,400 | 10% | 123,400 | 28% | 63,900 | 15% | 207,900 | 47% |
| Wisconsin | 1,298,700 | 148,200 | 11% | 175,900 | 14% | 451,800 | 35% | 522,600 | 40% |
| Wyoming | 89,100 | 6,000 | 7% | 11,700 | 13% | 13,300 | 15% | 58,100 | 65% |
| SOURCE: Kaiser Commission on Medicaid and the Uninsured and Urban Institute estimates based on data from FY 2011 MSIS. Because 2011 data were unavailable, 2010 MSIS data were used for Florida, Kansas, Maine, Maryland, Montana, New Mexico, New Jersey, Oklahoma, Texas, and Utah. For more detailed data notes, see: https://www.kff.org/medicaid/state-indicator/distribution-of-medicaid-enrollees-by-enrollment-group/ | |||||||||
| Table 2: Medicaid and CHIP Income Eligibility Limits for Children as a Percent of Federal Poverty Level (FPL), January 2015 | |||||||||
| State | Upper Income Eligibility Limit | Medicaid Ages 0-1 | Medicaid Ages 1-5 | Medicaid Ages 6-18 | Separate CHIPAges 0-18 | ||||
| Medicaid Funding | CHIP Funding | Medicaid Funding | CHIP Funding | Medicaid Funding | CHIPFunding | ||||
| Alabama | 317% | 146% | 146% | 105% | 146% | 317% | |||
| Alaska | 208% | 182% | 208% | 182% | 208% | 182% | 208% | ||
| Arizona | 200% (closed) | 152% | 146% | 109% | 138% | 200% (closed) | |||
| Arkansas | 216% | 147% | 216% | 147% | 216% | 112% | 216% | ||
| California | 266% | 213% | 266% | 147% | 266% | 138% | 266% | ||
| Colorado | 265% | 147% | 147% | 113% | 147% | 265% | |||
| Connecticut | 323% | 201% | 201% | 201% | 323% | ||||
| Delaware | 217% | 199% | 217% | 147% | 105% | 138% | 217% | ||
| DC | 324% | 211% | 324% | 151% | 324% | 117% | 324% | ||
| Florida | 215% | 197% | 211% | 145% | 117% | 138% | 215% | ||
| Georgia | 252% | 210% | 154% | 118% | 138% | 252% | |||
| Hawaii | 313% | 196% | 313% | 144% | 313% | 138% | 313% | ||
| Idaho | 190% | 147% | 147% | 138% | 155% | 190% | |||
| Illinois | 318% | 147% | 113% | 147% | 113% | 147% | 318% | ||
| Indiana | 255% | 213% | 146% | 163% | 111% | 163% | 255% | ||
| Iowa | 380% | 245% | 380% | 172% | 127% | 172% | 307% | ||
| Kansas | 247% | 171% | 154% | 118% | 138% | 247% | |||
| Kentucky | 218% | 200% | 147% | 164% | 147% | 164% | 218% | ||
| Louisiana | 255% | 147% | 217% | 147% | 217% | 147% | 217% | 255% | |
| Maine | 213% | 196% | 162% | 162% | 213% | ||||
| Maryland | 322% | 199% | 322% | 138% | 322% | 138% | 322% | ||
| Massachusetts | 305% | 190% | 205% | 138% | 155% | 119% | 155% | 305% | |
| Michigan | 217% | 200% | 148% | 165% | 115% | 165% | 217% | ||
| Minnesota | 288% | 280% | 288% | 280% | 280% | ||||
| Mississippi | 214% | 199% | 148% | 112% | 138% | 214% | |||
| Missouri | 305% | 201% | 153% | 153% | 155% | 305% | |||
| Montana | 266% | 148% | 148% | 148% | 266% | ||||
| Nebraska | 218% | 167% | 218% | 150% | 218% | 138% | 218% | ||
| Nevada | 205% | 165% | 165% | 127% | 138% | 205% | |||
| New Hampshire | 323% | 201% | 323% | 201% | 323% | 201% | 323% | ||
| New Jersey | 355% | 199% | 147% | 112% | 147% | 355% | |||
| New Mexico | 305% | 245% | 305% | 245% | 305% | 195% | 245% | ||
| New York | 405% | 223% | 154% | 115% | 154% | 405% | |||
| North Carolina | 216% | 199% | 215% | 146% | 215% | 112% | 138% | 216% | |
| North Dakota | 175% | 152% | 152% | 116% | 138% | 175% | |||
| Ohio | 211% | 161% | 211% | 161% | 211% | 161% | 211% | ||
| Oklahoma | 210% | 174% | 210% | 156% | 210% | 120% | 210% | ||
| Oregon | 305% | 190% | 138% | 105% | 138% | 305% | |||
| Pennsylvania | 319% | 220% | 162% | 124% | 138% | 319% | |||
| Rhode Island | 266% | 195% | 266% | 147% | 266% | 114% | 266% | ||
| South Carolina | 213% | 199% | 213% | 148% | 213% | 138% | 213% | ||
| South Dakota | 209% | 152% | 187% | 145% | 187% | 116% | 187% | 209% | |
| Tennessee | 255% | 200% | 147% | 138% | 255% | ||||
| Texas | 206% | 203% | 149% | 114% | 138% | 206% | |||
| Utah | 205% | 144% | 144% | 110% | 138% | 205% | |||
| Vermont | 317% | 242% | 317% | 242% | 317% | 242% | 317% | ||
| Virginia | 205% | 148% | 148% | 114% | 148% | 205% | |||
| Washington | 317% | 215% | 215% | 215% | 317% | ||||
| West Virginia | 305% | 163% | 146% | 113% | 138% | 305% | |||
| Wisconsin | 306% | 306% | 191% | 138% | 156% | 306% | |||
| Wyoming | 205% | 159% | 159% | 124% | 138% | 205% | |||
| NOTES: Eligibility levels are based on the 2014 federal poverty level (FPL) for a family of three, and reflect MAGI-converted income standards and an income disregard equal to five percentage points of the FPL.SOURCE: Based on a national survey conducted by the Kaiser Commission on Medicaid and the Uninsured with the Georgetown University Center for Children and Families, 2015, available at https://www.kff.org/medicaid/report/modern-era-medicaid-findings-from-a-50-state-survey-of-eligibility-enrollment-renewal-and-cost-sharing-policies-in-medicaid-and-chip-as-of-january-2015/ | |||||||||
| Table 3: Medicaid Income Eligibility Limits for Pregnant Women and Other Adults as a Percent of Federal Poverty Level (FPL), January 2015 | |||
| State | Pregnant Women | Parents with Dependent Children | Childless Adults |
| Alabama | 146% | 18% | 0% |
| Alaska | 205% | 146% | 0% |
| Arizona | 161% | 138% | 138% |
| Arkansas | 214% | 138% | 138% |
| California | 213% | 138% | 138% |
| Colorado | 200% | 138% | 138% |
| Connecticut | 263% | 201% | 138% |
| Delaware | 217% | 138% | 138% |
| DC | 211% | 221% | 215% |
| Florida | 196% | 34% | 0% |
| Georgia | 225% | 38% | 0% |
| Hawaii | 196% | 138% | 138% |
| Idaho | 138% | 27% | 0% |
| Illinois | 213% | 138% | 138% |
| Indiana | 213% | 24% | 0% |
| Iowa | 380% | 138% | 138% |
| Kansas | 171% | 38% | 0% |
| Kentucky | 200% | 138% | 138% |
| Louisiana | 138% | 24% | 0% |
| Maine | 214% | 105% | 0% |
| Maryland | 264% | 138% | 138% |
| Massachusetts | 205% | 138% | 138% |
| Michigan | 200% | 138% | 138% |
| Minnesota | 283% | 138% | 138% |
| Mississippi | 199% | 28% | 0% |
| Missouri | 201% | 23% | 0% |
| Montana | 162% | 51% | 0% |
| Nebraska | 199% | 55% | 0% |
| Nevada | 165% | 138% | 138% |
| New Hampshire | 201% | 138% | 138% |
| New Jersey | 199% | 138% | 138% |
| New Mexico | 255% | 138% | 138% |
| New York | 223% | 138% | 138% |
| North Carolina | 201% | 45% | 0% |
| North Dakota | 152% | 138% | 138% |
| Ohio | 205% | 138% | 138% |
| Oklahoma | 138% | 46% | 0% |
| Oregon | 190% | 138% | 138% |
| Pennsylvania | 220% | 138% | 138% |
| Rhode Island | 195% | 138% | 138% |
| South Carolina | 199% | 67% | 0% |
| South Dakota | 138% | 53% | 0% |
| Tennessee | 200% | 103% | 0% |
| Texas | 203% | 19% | 0% |
| Utah | 144% | 46% | 0% |
| Vermont | 213% | 138% | 138% |
| Virginia | 148% | 45% | 0% |
| Washington | 198% | 138% | 138% |
| West Virginia | 163% | 138% | 138% |
| Wisconsin | 306% | 100% | 100% |
| Wyoming | 159% | 58% | 0% |
| NOTES: Eligibility levels are based on the 2014 federal poverty level (FPL) for a family of three for parents of dependent children, and for an individual for childless adults. Income eligibility limits reflect MAGI-converted income standards and an income disregard equal to five percentage points of the FPL.SOURCE: Based on a national survey conducted by the Kaiser Commission on Medicaid and the Uninsured with the Georgetown University Center for Children and Families, 2015, available at https://www.kff.org/medicaid/report/modern-era-medicaid-findings-from-a-50-state-survey-of-eligibility-enrollment-renewal-and-cost-sharing-policies-in-medicaid-and-chip-as-of-january-2015/. Data updated to reflect state Medicaid expansion decisions as of February, 2015. | |||
| Table 4: Medicaid Spending by Group (in $ millions), FY 2011 | ||||||||||
| State | Total | Aged | Disabled | Adult | Children | |||||
| $ | $ | % | $ | % | $ | % | $ | % | ||
| United States | $397,635 | $85,355 | 21% | $168,817 | 42% | $61,059 | 15% | $82,401 | 21% | |
| Alabama | $4,367 | $987 | 23% | $1,770 | 41% | $441 | 10% | $1,170 | 27% | |
| Alaska | $1,313 | $220 | 17% | $513 | 39% | $203 | 15% | $377 | 29% | |
| Arizona | $8,878 | $1,136 | 13% | $3,170 | 36% | $2,830 | 32% | $1,741 | 20% | |
| Arkansas | $3,779 | $918 | 24% | $1,750 | 46% | $187 | 5% | $924 | 24% | |
| California | $52,129 | $12,199 | 23% | $21,385 | 41% | $7,770 | 15% | $10,775 | 21% | |
| Colorado | $4,231 | $873 | 21% | $1,803 | 43% | $570 | 13% | $984 | 23% | |
| Connecticut | $5,868 | $1,587 | 27% | $2,015 | 34% | $1,260 | 21% | $1,006 | 17% | |
| Delaware | $1,443 | $204 | 14% | $455 | 32% | $503 | 35% | $282 | 20% | |
| DC | $2,073 | $383 | 18% | $1,035 | 50% | $417 | 20% | $238 | 11% | |
| Florida | $17,257 | $4,136 | 24% | $7,316 | 42% | $2,338 | 14% | $3,467 | 20% | |
| Georgia | $7,703 | $1,384 | 18% | $2,769 | 36% | $1,254 | 16% | $2,296 | 30% | |
| Hawaii | $1,545 | $425 | 27% | $459 | 30% | $413 | 27% | $247 | 16% | |
| Idaho | $1,550 | $198 | 13% | $808 | 52% | $200 | 13% | $343 | 22% | |
| Illinois | $13,108 | $2,236 | 17% | $5,227 | 40% | $2,308 | 18% | $3,338 | 25% | |
| Indiana | $6,473 | $1,394 | 22% | $2,876 | 44% | $904 | 14% | $1,300 | 20% | |
| Iowa | $3,286 | $702 | 21% | $1,606 | 49% | $376 | 11% | $601 | 18% | |
| Kansas | $2,621 | $573 | 22% | $1,271 | 48% | $228 | 9% | $549 | 21% | |
| Kentucky | $5,623 | $944 | 17% | $2,611 | 46% | $723 | 13% | $1,345 | 24% | |
| Louisiana | $6,259 | $1,009 | 16% | $3,096 | 49% | $733 | 12% | $1,420 | 23% | |
| Maine | $2,234 | $582 | 26% | $1,085 | 49% | $243 | 11% | $325 | 15% | |
| Maryland | $7,400 | $1,331 | 18% | $3,359 | 45% | $1,258 | 17% | $1,452 | 20% | |
| Massachusetts | $13,153 | $3,274 | 25% | $5,798 | 44% | $2,538 | 19% | $1,540 | 12% | |
| Michigan | $11,895 | $2,277 | 19% | $5,409 | 45% | $1,935 | 16% | $2,274 | 19% | |
| Minnesota | $8,287 | $1,694 | 20% | $3,581 | 43% | $1,426 | 17% | $1,586 | 19% | |
| Mississippi | $4,170 | $931 | 22% | $1,785 | 43% | $464 | 11% | $989 | 24% | |
| Missouri | $7,454 | $1,416 | 19% | $3,540 | 47% | $705 | 9% | $1,793 | 24% | |
| Montana | $949 | $256 | 27% | $363 | 38% | $100 | 10% | $231 | 24% | |
| Nebraska | $1,592 | $365 | 23% | $703 | 44% | $190 | 12% | $334 | 21% | |
| Nevada | $1,447 | $221 | 15% | $596 | 41% | $181 | 12% | $450 | 31% | |
| New Hampshire | $1,244 | $299 | 24% | $536 | 43% | $83 | 7% | $326 | 26% | |
| New Jersey | $9,222 | $2,730 | 30% | $4,057 | 44% | $738 | 8% | $1,698 | 18% | |
| New Mexico | $3,286 | N/A | N/A | $1,035 | 31% | $629 | 19% | $1,549 | 47% | |
| New York | $51,788 | $13,932 | 27% | $21,565 | 42% | $10,616 | 20% | $5,675 | 11% | |
| North Carolina | $10,211 | $1,715 | 17% | $4,616 | 45% | $1,446 | 14% | $2,435 | 24% | |
| North Dakota | $714 | $226 | 32% | $305 | 43% | $66 | 9% | $116 | 16% | |
| Ohio | $15,406 | $3,569 | 23% | $7,110 | 46% | $2,342 | 15% | $2,385 | 15% | |
| Oklahoma | $4,231 | $661 | 16% | $1,736 | 41% | $563 | 13% | $1,271 | 30% | |
| Oregon | $4,310 | $983 | 23% | $1,543 | 36% | $1,064 | 25% | $720 | 17% | |
| Pennsylvania | $19,773 | $4,397 | 22% | $9,950 | 50% | $1,884 | 10% | $3,542 | 18% | |
| Rhode Island | $1,961 | $368 | 19% | $886 | 45% | $270 | 14% | $437 | 22% | |
| South Carolina | $4,636 | $885 | 19% | $1,968 | 42% | $783 | 17% | $1,000 | 22% | |
| South Dakota | $751 | $142 | 19% | $309 | 41% | $97 | 13% | $204 | 27% | |
| Tennessee | $7,957 | $1,257 | 16% | $3,214 | 40% | $1,501 | 19% | $1,986 | 25% | |
| Texas | $27,011 | $4,492 | 17% | $10,204 | 38% | $2,222 | 8% | $10,093 | 37% | |
| Utah | $1,795 | $178 | 10% | $851 | 47% | $272 | 15% | $493 | 27% | |
| Vermont | $1,258 | $143 | 11% | $388 | 31% | $370 | 29% | $357 | 28% | |
| Virginia | $6,673 | $1,292 | 19% | $2,990 | 45% | $787 | 12% | $1,604 | 24% | |
| Washington | $6,975 | $1,217 | 17% | $3,022 | 43% | $1,071 | 15% | $1,665 | 24% | |
| West Virginia | $2,769 | $614 | 22% | $1,361 | 49% | $274 | 10% | $521 | 19% | |
| Wisconsin | $7,031 | $2,204 | 31% | $2,760 | 39% | $1,234 | 18% | $833 | 12% | |
| Wyoming | $544 | $125 | 23% | $254 | 47% | $51 | 9% | $113 | 21% | |
| SOURCE: Kaiser Commission on Medicaid and the Uninsured and Urban Institute estimates based on data from FY 2011 MSIS and CMS-64 reports. For more detailed data notes, see: https://www.kff.org/medicaid/state-indicator/medicaid-spending-by-enrollment-group/ | ||||||||||
| Table 5: Medicaid Spending Per Enrollee by Group, FY 2011 | |||||
| State | Total | Aged | Disabled | Adult | Children |
| United States | $5,790 | $13,249 | $16,643 | $3,247 | $2,463 |
| Alabama | $4,111 | $8,358 | $7,989 | $2,420 | $2,163 |
| Alaska | $9,474 | $23,321 | $28,554 | $6,467 | $4,720 |
| Arizona | $7,022 | $12,628 | $21,940 | $6,131 | $3,064 |
| Arkansas | $5,264 | $12,994 | $11,564 | $1,638 | $2,420 |
| California | $4,468 | $11,749 | $20,106 | $1,584 | $2,313 |
| Colorado | $5,679 | $16,943 | $19,008 | $3,539 | $2,250 |
| Connecticut | $7,465 | $14,652 | $24,567 | $4,541 | $3,161 |
| Delaware | $5,949 | $13,439 | $16,968 | $4,843 | $2,909 |
| DC | $8,875 | $20,430 | $26,958 | $4,506 | $2,837 |
| Florida | $4,434 | $8,532 | $12,130 | $2,880 | $1,716 |
| Georgia | $3,992 | $7,604 | $8,775 | $4,174 | $2,028 |
| Hawaii | $5,438 | $16,432 | $16,128 | $3,765 | $2,062 |
| Idaho | $5,700 | $10,324 | $18,510 | $5,098 | $2,025 |
| Illinois | $4,477 | $9,926 | $15,696 | $2,895 | $2,123 |
| Indiana | $5,256 | $14,991 | $15,255 | $3,585 | $1,862 |
| Iowa | $5,491 | $15,865 | $18,893 | $2,048 | $2,106 |
| Kansas | $5,996 | $13,643 | $14,829 | $3,745 | $2,212 |
| Kentucky | $5,937 | $9,607 | $10,769 | $5,000 | $2,913 |
| Louisiana | $4,869 | $8,616 | $13,049 | $2,907 | $2,092 |
| Maine | $5,968 | $8,932 | $14,386 | $2,189 | $2,526 |
| Maryland | $7,046 | $16,591 | $20,962 | $4,231 | $2,778 |
| Massachusetts | $8,717 | $21,129 | $16,798 | $4,103 | $3,956 |
| Michigan | $5,067 | $15,403 | $14,234 | $3,073 | $1,911 |
| Minnesota | $7,506 | $17,053 | $25,573 | $3,557 | $3,419 |
| Mississippi | $5,335 | $10,347 | $10,450 | $4,084 | $2,430 |
| Missouri | $6,488 | $14,706 | $16,401 | $3,005 | $2,978 |
| Montana | $7,140 | $22,543 | $16,226 | $4,707 | $2,958 |
| Nebraska | $5,763 | $14,794 | $17,413 | $3,996 | $2,041 |
| Nevada | $3,728 | $7,169 | $11,991 | $2,379 | $1,942 |
| New Hampshire | $7,254 | $18,341 | $16,771 | $3,662 | $3,243 |
| New Jersey | $8,309 | $17,646 | $22,124 | $4,687 | $2,621 |
| New Mexico | $5,803 | N/A | $15,234 | $5,565 | $4,551 |
| New York | $8,901 | $21,620 | $30,221 | $4,596 | $2,639 |
| North Carolina | $5,226 | $9,157 | $13,810 | $3,587 | $2,366 |
| North Dakota | $8,338 | $23,810 | $25,136 | $3,651 | $2,536 |
| Ohio | $6,855 | $19,858 | $18,565 | $4,223 | $2,110 |
| Oklahoma | $4,782 | $10,085 | $13,820 | $2,973 | $2,462 |
| Oregon | $5,908 | $15,626 | $14,878 | $5,064 | $2,041 |
| Pennsylvania | $7,811 | $17,462 | $15,526 | $3,564 | $3,191 |
| Rhode Island | $9,247 | $13,820 | $20,601 | $5,741 | $4,585 |
| South Carolina | $4,805 | $10,346 | $12,068 | $3,583 | $2,009 |
| South Dakota | $5,485 | $10,916 | $15,759 | $4,213 | $2,502 |
| Tennessee | $5,155 | $8,595 | $11,679 | $4,731 | $2,467 |
| Texas | $5,278 | $9,751 | $15,259 | $3,263 | $3,016 |
| Utah | $4,890 | $11,624 | $19,597 | $2,889 | $2,261 |
| Vermont | $6,291 | $6,405 | $15,081 | $4,449 | $5,193 |
| Virginia | $6,224 | $11,447 | $16,042 | $4,411 | $2,698 |
| Washington | $4,993 | $12,140 | $14,147 | $3,696 | $2,099 |
| West Virginia | $6,315 | $14,155 | $11,031 | $4,283 | $2,506 |
| Wisconsin | $5,414 | $14,866 | $15,693 | $2,731 | $1,594 |
| Wyoming | $6,110 | $20,726 | $21,700 | $3,877 | $1,954 |
| SOURCE: Kaiser Commission on Medicaid and the Uninsured and Urban Institute estimates based on data from FY 2011 MSIS and CMS-64 reports. For more detailed data notes, see: https://www.kff.org/medicaid/state-indicator/medicaid-spending-per-enrollee/ | |||||
| Table 6: Medicaid Spending by Type of Service (in $ millions), FY 2013 | |||||||
| State | Total | Acute Care | Long-Term Care | DSH Payments | |||
| $ | $ | % | $ | % | $ | % | |
| United States | $438,233 | $298,840 | 68% | $123,016 | 28% | $16,377 | 4% |
| Alabama | $5,039 | $3,135 | 62% | $1,432 | 28% | $471 | 9% |
| Alaska | $1,356 | $815 | 60% | $520 | 38% | $22 | 2% |
| Arizona | $8,438 | $8,219 | 97% | $45 | 1% | $173 | 2% |
| Arkansas | $4,207 | $2,703 | 64% | $1,443 | 34% | $61 | 1% |
| California | $61,904 | $45,018 | 73% | $14,766 | 24% | $2,120 | 3% |
| Colorado | $5,092 | $3,332 | 65% | $1,566 | 31% | $194 | 4% |
| Connecticut | $6,726 | $3,469 | 52% | $2,983 | 44% | $273 | 4% |
| Delaware | $1,563 | $1,418 | 91% | $133 | 9% | $11 | 1% |
| DC | $2,288 | $1,449 | 63% | $782 | 34% | $56 | 2% |
| Florida | $18,561 | $13,499 | 73% | $4,727 | 25% | $335 | 2% |
| Georgia | $8,960 | $6,203 | 69% | $2,327 | 26% | $430 | 5% |
| Hawaii | $1,630 | $1,489 | 91% | $117 | 7% | $25 | 2% |
| Idaho | $1,672 | $1,092 | 65% | $556 | 33% | $24 | 1% |
| Illinois | $15,658 | $10,640 | 68% | $4,571 | 29% | $447 | 3% |
| Indiana | $7,968 | $4,703 | 59% | $2,927 | 37% | $338 | 4% |
| Iowa | $3,709 | $1,984 | 53% | $1,670 | 45% | $55 | 1% |
| Kansas | $2,578 | $1,863 | 72% | $639 | 25% | $77 | 3% |
| Kentucky | $5,822 | $3,970 | 68% | $1,636 | 28% | $216 | 4% |
| Louisiana | $7,147 | $4,199 | 59% | $2,181 | 31% | $767 | 11% |
| Maine | $2,887 | $2,013 | 70% | $837 | 29% | $37 | 1% |
| Maryland | $7,781 | $5,373 | 69% | $2,274 | 29% | $134 | 2% |
| Massachusetts | $13,166 | $9,340 | 71% | $3,827 | 29% | $0 | 0% |
| Michigan | $12,386 | $9,239 | 75% | $2,760 | 22% | $388 | 3% |
| Minnesota | $8,919 | $5,681 | 64% | $3,191 | 36% | $46 | 1% |
| Mississippi | $4,736 | $3,099 | 65% | $1,419 | 30% | $218 | 5% |
| Missouri | $8,951 | $5,962 | 67% | $2,286 | 26% | $703 | 8% |
| Montana | $1,007 | $614 | 61% | $376 | 37% | $18 | 2% |
| Nebraska | $1,834 | $1,015 | 55% | $773 | 42% | $45 | 2% |
| Nevada | $1,823 | $1,325 | 73% | $417 | 23% | $81 | 4% |
| New Hampshire | $1,203 | $576 | 48% | $585 | 49% | $41 | 3% |
| New Jersey | $10,606 | $5,648 | 53% | $3,659 | 35% | $1,298 | 12% |
| New Mexico | $3,295 | $2,914 | 88% | $356 | 11% | $25 | 1% |
| New York | $54,420 | $32,358 | 59% | $18,640 | 34% | $3,423 | 6% |
| North Carolina | $11,915 | $8,999 | 76% | $2,299 | 19% | $617 | 5% |
| North Dakota | $784 | $298 | 38% | $485 | 62% | $1 | 0% |
| Ohio | $16,803 | $10,056 | 60% | $6,098 | 36% | $649 | 4% |
| Oklahoma | $4,796 | $3,497 | 73% | $1,257 | 26% | $42 | 1% |
| Oregon | $5,111 | $3,541 | 69% | $1,493 | 29% | $77 | 1% |
| Pennsylvania | $21,092 | $12,489 | 59% | $7,755 | 37% | $847 | 4% |
| Rhode Island | $1,920 | $1,443 | 75% | $348 | 18% | $130 | 7% |
| South Carolina | $4,907 | $3,258 | 66% | $1,191 | 24% | $457 | 9% |
| South Dakota | $766 | $465 | 61% | $300 | 39% | $1 | 0% |
| Tennessee | $8,716 | $7,652 | 88% | $984 | 11% | $80 | 1% |
| Texas | $28,339 | $22,518 | 79% | $5,594 | 20% | $227 | 1% |
| Utah | $2,130 | $1,631 | 77% | $470 | 22% | $29 | 1% |
| Vermont | $1,474 | $1,312 | 89% | $124 | 8% | $37 | 3% |
| Virginia | $7,291 | $4,592 | 63% | $2,513 | 34% | $186 | 3% |
| Washington | $8,171 | $5,497 | 67% | $2,308 | 28% | $367 | 4% |
| West Virginia | $3,024 | $1,680 | 56% | $1,269 | 42% | $75 | 2% |
| Wisconsin | $7,106 | $5,264 | 74% | $1,841 | 26% | $1 | 0% |
| Wyoming | $554 | $288 | 52% | $265 | 48% | $0 | 0% |
| NOTES: Expenditures do not include administrative costs, accounting adjustments, or the U.S. Territories. Total Medicaid spending including these factors was $456.0 billion in FY 2013. “DSH” refers to disproportionate share hospital payments. For more detailed data notes, see https://www.kff.org/medicaid/state-indicator/distribution-of-medicaid-spending-by-service/SOURCE: Urban Institute estimates based on data from CMS-64 reports. | |||||||
| Table 7: Federal Medical Assistance Percentages (FMAP), FY 2011-2015 | ||||||
| State | FY 2011 | FY 2012 | FY2013 | FY2014 | FY2015 | Federal Funds Sent to State per Dollar of State Medicaid Spending, FY 2015 |
| Alabama | 68.50% | 68.60% | 68.50% | 68.12% | 68.99% | $2.22 |
| Alaska | 50.00% | 50.00% | 50.00% | 50.00% | 50.00% | $1.00 |
| Arizona | 65.90% | 67.30% | 65.70% | 67.23% | 68.46% | $2.17 |
| Arkansas | 71.40% | 70.70% | 70.20% | 70.10% | 70.88% | $2.43 |
| California | 50.00% | 50.00% | 50.00% | 50.00% | 50.00% | $1.00 |
| Colorado | 50.00% | 50.00% | 50.00% | 50.00% | 51.01% | $1.04 |
| Connecticut | 50.00% | 50.00% | 50.00% | 50.00% | 50.00% | $1.00 |
| Delaware | 53.20% | 54.20% | 55.70% | 55.31% | 53.63% | $1.16 |
| DC | 70.00% | 70.00% | 70.00% | 70.00% | 70.00% | $2.33 |
| Florida | 55.50% | 56.00% | 58.10% | 58.79% | 59.72% | $1.48 |
| Georgia | 65.30% | 66.20% | 65.60% | 65.93% | 66.94% | $2.02 |
| Hawaii | 51.80% | 50.50% | 51.90% | 51.85% | 52.23% | $1.09 |
| Idaho | 68.90% | 70.20% | 71.00% | 71.64% | 71.75% | $2.54 |
| Illinois | 50.20% | 50.00% | 50.00% | 50.00% | 50.76% | $1.03 |
| Indiana | 66.50% | 67.00% | 67.20% | 66.92% | 66.52% | $1.99 |
| Iowa | 62.60% | 60.70% | 59.60% | 57.93% | 55.54% | $1.25 |
| Kansas | 59.10% | 56.90% | 56.50% | 56.91% | 56.63% | $1.31 |
| Kentucky | 71.50% | 71.20% | 70.60% | 69.83% | 69.94% | $2.33 |
| Louisiana | 63.60% | 61.10% | 61.20% | 60.98% | 62.05% | $1.64 |
| Maine | 63.80% | 63.30% | 62.60% | 61.55% | 61.88% | $1.62 |
| Maryland | 50.00% | 50.00% | 50.00% | 50.00% | 50.00% | $1.00 |
| Massachusetts | 50.00% | 50.00% | 50.00% | 50.00% | 50.00% | $1.00 |
| Michigan | 65.80% | 66.10% | 66.40% | 66.32% | 65.54% | $1.90 |
| Minnesota | 50.00% | 50.00% | 50.00% | 50.00% | 50.00% | $1.00 |
| Mississippi | 74.70% | 74.20% | 73.40% | 73.05% | 73.58% | $2.79 |
| Missouri | 63.30% | 63.50% | 61.40% | 62.03% | 63.45% | $1.74 |
| Montana | 66.80% | 66.10% | 66.00% | 66.33% | 65.90% | $1.93 |
| Nebraska | 58.40% | 56.60% | 55.80% | 54.74% | 53.27% | $1.14 |
| Nevada | 51.60% | 56.20% | 59.70% | 63.10% | 64.36% | $1.81 |
| New Hampshire | 50.00% | 50.00% | 50.00% | 50.00% | 50.00% | $1.00 |
| New Jersey | 50.00% | 50.00% | 50.00% | 50.00% | 50.00% | $1.00 |
| New Mexico | 69.80% | 69.40% | 69.10% | 69.20% | 69.65% | $2.29 |
| New York | 50.00% | 50.00% | 50.00% | 50.00% | 50.00% | $1.00 |
| North Carolina | 64.70% | 65.30% | 65.50% | 65.78% | 65.88% | $1.93 |
| North Dakota | 60.40% | 55.40% | 52.30% | 50.00% | 50.00% | $1.00 |
| Ohio | 63.70% | 64.20% | 63.60% | 63.02% | 62.64% | $1.68 |
| Oklahoma | 64.90% | 63.90% | 64.00% | 64.02% | 62.30% | $1.65 |
| Oregon | 62.90% | 62.90% | 62.40% | 63.14% | 64.06% | $1.78 |
| Pennsylvania | 55.60% | 55.10% | 54.30% | 53.52% | 51.82% | $1.08 |
| Rhode Island | 53.00% | 52.10% | 51.30% | 50.11% | 50.00% | $1.00 |
| South Carolina | 70.00% | 70.20% | 70.40% | 70.57% | 70.64% | $2.41 |
| South Dakota | 61.30% | 59.10% | 56.20% | 53.54% | 51.64% | $1.07 |
| Tennessee | 65.90% | 66.40% | 66.10% | 65.29% | 64.99% | $1.86 |
| Texas | 60.60% | 58.20% | 59.30% | 58.69% | 58.05% | $1.38 |
| Utah | 71.10% | 71.00% | 69.60% | 70.34% | 70.56% | $2.40 |
| Vermont | 58.70% | 57.60% | 56.00% | 55.11% | 54.01% | $1.17 |
| Virginia | 50.00% | 50.00% | 50.00% | 50.00% | 50.00% | $1.00 |
| Washington | 50.00% | 50.00% | 50.00% | 50.00% | 50.03% | $1.00 |
| West Virginia | 73.20% | 72.60% | 72.00% | 71.09% | 71.35% | $2.49 |
| Wisconsin | 60.20% | 60.50% | 59.70% | 59.06% | 58.27% | $1.40 |
| Wyoming | 50.00% | 50.00% | 50.00% | 50.00% | 50.00% | $1.00 |
| NOTES: FMAPs displayed here apply to spending associated with beneficiaries who qualify for Medicaid under pre-ACA eligibility criteria. The FMAP for spending associated with newly eligible adults is 100% through FY 2016, declining gradually to 90% by 2020. For more detailed data notes, see: https://www.kff.org/medicaid/state-indicator/federal-matching-rate-and-multiplier/SOURCE: Kaiser Commission on Medicaid and the Uninsured calculations based on FY 2011‐2015 FMAPs published in the Federal Register as follows: FY 2011 FMAP – Vol. 76, No. 107, pp. 32204‐32207; FY 2012 FMAP – Vol. 75, No. 217, pp. 69082‐69084; FY 2013 FMAP – Vol. 76, No. 230, pp. 74061‐74063; FY 2014 FMAP – Vol. 77, No. 23, pp 71420-71423; FY 2015 FMAP – Vol. 79, No. 13, pp.3385-3388. | ||||||
| Table 8: Selected Measures of Health Need among Adults | ||||||
| State | Uninsured Adults<100% FPL1 | % Adults with | % of PopulationLiving in Primary CareHPSAs5 | |||
| Number | % | Disabilities2 | Diabetes3 | Poor Mental Health4 | ||
| United States | 25,694,900 | 37% | 10.1% | 6.2% | 33.7% | 19.2% |
| Alabama | 415,300 | 47% | 14.9% | 11.1% | 34.8% | 37.0% |
| Alaska | 39,800 | N/A | 10.4% | 6.3% | 32.7% | 17.5% |
| Arizona | 733,900 | 43% | 9.8% | 8.1% | 35.2% | 42.2% |
| Arkansas | 275,600 | 42% | 15.3% | 9.2% | 35.9% | 12.3% |
| California | 3,221,300 | 37% | 7.8% | 8.9% | 36.8% | 16.1% |
| Colorado | 322,400 | 36% | 8.4% | 6.0% | 35.3% | 17.7% |
| Connecticut | 239,000 | 28% | 8.2% | 6.4% | 34.9% | 11.0% |
| Delaware | 64,700 | 13% | 10.4% | 7.7% | 32.9% | 22.6% |
| DC | 81,600 | 13% | 9.7% | 8.0% | 37.3% | 38.7% |
| Florida | 1,690,800 | 46% | 9.9% | 8.7% | 34.2% | 24.1% |
| Georgia | 848,600 | 45% | 10.5% | 9.8% | 31.6% | 20.8% |
| Hawaii | 93,900 | 20% | 8.2% | 7.8% | 27.5% | 3.5% |
| Idaho | 123,400 | 38% | 11.0% | 7.7% | 36.7% | 29.9% |
| Illinois | 985,800 | 34% | 8.5% | 8.2% | 38.5% | 27.0% |
| Indiana | 431,800 | 28% | 10.8% | 9.1% | 36.2% | 25.8% |
| Iowa | 189,400 | 37% | 9.6% | 6.9% | 29.6% | 21.4% |
| Kansas | 196,900 | 35% | 10.8% | 8.0% | 30.0% | 23.3% |
| Kentucky | 480,700 | 39% | 15.3% | 10.1% | 37.0% | 18.6% |
| Louisiana | 455,500 | 36% | 13.5% | 10.3% | 34.7% | 43.3% |
| Maine | 94,700 | 21% | 13.6% | 7.4% | 34.2% | 6.6% |
| Maryland | 331,300 | 27% | 8.2% | 8.9% | 33.0% | 17.9% |
| Massachusetts | 494,900 | N/A | 8.9% | 7.2% | 35.8% | 7.3% |
| Michigan | 886,900 | 33% | 11.6% | 9.2% | 35.9% | 17.3% |
| Minnesota | 400,400 | 23% | 8.2% | 6.2% | 30.1% | 7.3% |
| Mississippi | 376,800 | 33% | 15.3% | 11.3% | 32.7% | 57.7% |
| Missouri | 482,800 | 40% | 12.6% | 8.0% | 32.3% | 27.5% |
| Montana | 82,100 | N/A | 10.3% | 6.2% | 32.1% | 26.0% |
| Nebraska | 107,800 | 36% | 8.2% | 7.1% | 30.4% | 1.6% |
| Nevada | 269,500 | 59% | 10.3% | 8.1% | 33.4% | 18.7% |
| New Hampshire | 67,700 | 37% | 9.6% | 7.0% | 32.9% | 3.7% |
| New Jersey | 542,000 | 35% | 7.7% | 8.3% | 31.3% | 0.3% |
| New Mexico | 248,000 | 41% | 13.1% | 8.1% | 33.0% | 42.3% |
| New York | 1,654,300 | 22% | 8.4% | 8.4% | 35.1% | 17.2% |
| North Carolina | 957,600 | 52% | 11.3% | 9.3% | 30.4% | 12.7% |
| North Dakota | 40,500 | N/A | 8.3% | 6.9% | 31.1% | 26.5% |
| Ohio | 975,200 | 32% | 11.9% | 9.4% | 32.2% | 10.2% |
| Oklahoma | 314,900 | 34% | 13.6% | 10.1% | 34.3% | 25.5% |
| Oregon | 370,800 | 31% | 11.7% | 7.2% | 40.2% | 23.5% |
| Pennsylvania | 914,100 | 31% | 11% | 8.7% | 35.5% | 5.0% |
| Rhode Island | 76,300 | 22% | 10.4% | 6.8% | 35.3% | 14.4% |
| South Carolina | 431,500 | 44% | 12.1% | 9.9% | 33.9% | 27.3% |
| South Dakota | 45,200 | N/A | 10.0% | 6.4% | 26.8% | 21.9% |
| Tennessee | 659,700 | 34% | 13.4% | 10.2% | 28.5% | 18.0% |
| Texas | 2,273,100 | 56% | 10.0% | 9.8% | 28.2% | 19.4% |
| Utah | 121,500 | N/A | 8.5% | 7.1% | 38.5% | 19.0% |
| Vermont | 31,800 | N/A | 11.0% | 5.8% | 34.8% | 0.0% |
| Virginia | 482,200 | 41% | 8.4% | 8.1% | 30.1% | 14.6% |
| Washington | 493,000 | 38% | 10.1% | 7.4% | 37.3% | 19.0% |
| West Virginia | 195,600 | 30% | 16.8% | 10.7% | 32.0% | 17.0% |
| Wisconsin | 341,800 | 31% | 9.2% | 7.1% | 35.7% | 14.4% |
| Wyoming | 40,600 | 37% | 9.8% | 6.6% | 30.7% | 25.6% |
| SOURCES: 1-Kaiser Family Foundation estimates based on the Census Bureau’s March 2014 Current Population Survey (CPS: Annual Social and Economic Supplements). 2-Erickson, W., Lee, C., & von Schrader, S. (2014). 2012 Disability Status Report: United States. Ithaca, NY: Cornell University Employment and Disability Institute(EDI). 3-Centers for Disease Control and Prevention: National Diabetes Surveillance System. Available online at: http://www.cdc.gov/diabetes/data/. 4-Kaiser Family Foundation analysis of Behavioral Risk Factor Surveillance System Survey Data (BRFSS), 2014. 5- KCMU calculations based on HRSA Primary Care Health Professional Shortage Area statistics for 2014 and Urban Institute tabulations of 2012 and 2013 ASEC Supplement to the CPS. | ||||||
Endnotes
- FY 2011 Distribution of Medicaid Enrollees by Enrollment Group, FY 2011, https://modern.kff.org/medicaid/state-indicator/distribution-of-medicaid-enrollees-by-enrollment-group/, Kaiser Family Foundation. ↩︎
- The health reform law also provided for new health insurance Marketplaces and premium subsidies for individuals with income between 100% and 400% FPL. ↩︎
- Medicaid and CHIP: December 2014 Monthly Applications, Eligibility Determinations and Enrollment Report, CMS, February 23, 2015, http://www.medicaid.gov/medicaid-chip-program-information/program-information/downloads/december-2014-enrollment-report.pdf ↩︎
- Getting into Gear for 2014: Findings From a 50-State Survey of Eligibility, Enrollment, Renewal and Cost-Sharing Policies in Medicaid and CHIP, 2012-2013 (Kaiser Family Foundation, January 2013), https://modern.kff.org/medicaid/report/getting-into-gear-for-2014-findings-from-a-50-state-survey-of-eligibility-enrollment-renewal-and-cost-sharing-policies-in-medicaid-and-chip-2012-2013/ ↩︎
- States that elect the “209(b)” option are permitted to use financial eligibility standards that are more restrictive than federal SSI rules. However, these states must allow SSI beneficiaries to establish Medicaid eligibility through a “spend-down” by deducting their out-of-pocket medical expenses from their income. See https://modern.kff.org/health-reform/issue-brief/the-affordable-care-acts-impact-on-medicaid-eligibility-enrollment-and-benefits-for-people-with-disabilities/ for a more detailed discussion. ↩︎
- March 2014 Report to the Congress on Medicaid and CHIP (Medicaid and CHIP Payment and Access Commission (MACPAC), March 2014). See Table 11. ↩︎
- CMS op.cit. ↩︎
- Wisconsin provides full Medicaid coverage to adults without dependent children up to 100% FPL although it has not adopted the Medicaid expansion at this time. ↩︎
- https://modern.kff.org/health-reform/state-indicator/number-of-poor-uninsured-nonelderly-adults-in-the-aca-coverage-gap/ See also Rachel Garfield et al., The Coverage Gap: Uninsured Poor Adults in States that Do Not Expand Medicaid – An Update (Kaiser Family Foundation, November 2014), https://modern.kff.org/health-reform/issue-brief/the-coverage-gap-uninsured-poor-adults-in-states-that-do-not-expand-medicaid-an-update/ ↩︎
- Robin Rudowitz, Samantha Artiga, and Rachel Arguello, Children’s Health Coverage: Medicaid, CHIP and the ACA (Kaiser Family Foundation, March 2014), https://modern.kff.org/health-reform/issue-brief/childrens-health-coverage-medicaid-chip-and-the-aca/ ↩︎
- Medicaid: A Primer (Kaiser Family Foundation, March 2013), https://modern.kff.org/medicaid/issue-brief/medicaid-a-primer/ ↩︎
- Medicaid Home and Community-Based Services Programs: 2010 Data Update (Kaiser Family Foundation, March 2014), https://modern.kff.org/medicaid/report/medicaid-home-and-community-based-service-programs/ ↩︎
- KCMU estimates based on 2012 CMS National Health Expenditure Accounts data, available at: http://www.cms.gov/Research-Statistics-Data-and-Systems/Statistics-Trends-and-Reports/NationalHealthExpendData/NationalHealthAccountsHistorical.html ↩︎
- MaryBeth Musumeci, Julia Paradise, Erica Reaves, and Henry Claypool, Benefits and Cost-Sharing for Working People with Disabilities in Medicaid and the Marketplace (Kaiser Family Foundation, October 2014), https://modern.kff.org/report-section/benefits-and-cost-sharing-for-working-people-with-disabilities-in-medicaid-and-the-marketplace-key-themes-8644/ ↩︎
- Federal Register, Volume 78, Number 135, July 15, 2013, http://www.gpo.gov/fdsys/pkg/FR-2013-07-15/html/2013-16271.htm ↩︎
- KCMU and Urban Institute analysis of Centers for Medicare & Medicaid Services (CMS)-64 data. ↩︎
- Molly O’Malley Watts, MaryBeth Musumeci, and Erica Reaves, How is the Affordable Care Act Leading to Changes in Medicaid Long-Term Services and Supports (LTSS) Today? State Adoption of Six LTSS Options (Kaiser Family Foundation, April 2013), https://modern.kff.org/medicaid/issue-brief/how-is-the-affordable-care-act-leading-to-changes-in-medicaid-long-term-services-and-supports-ltss-today-state-adoption-of-six-ltss-options/ ↩︎
- Genevieve Kenney and Christine Coyer, National Findings on Access to Health Care and Service Use for Children Enrolled in Medicaid, MACPAC Contractor Report No. 1, March 2012. ↩︎
- Sharon Long, Karen Stockley, Elaine Grimm, and Christine Coyer, National Findings on Access to Health Care and Service Use for Non-elderly Adults Enrolled in Medicaid, MACPAC Contractor Report No. 2, June 2012, http://www.urban.org/publications/1001623.html ↩︎
- Teresa Coughlin, Sharon Long, Lisa Clemans-Cope, and Dean Resnick, What Difference Does Medicaid Make? (Kaiser Family Foundation, May 2013), https://modern.kff.org/medicaid/issue-brief/what-difference-does-medicaid-make-assessing-cost-effectiveness-access-and-financial-protection-under-medicaid-for-low-income-adults/ ↩︎
- Coughlin et al., Kenney and Coyer, and Long et al. op. cit. ↩︎
- Genevieve Kenney, Brendan Saloner, Nathaniel Anderson, Daniel Polsky, and Karin Rhodes, Access to Care for Low-Income Medicaid and Privately Insured Adults in 2012 in the National Health Interview Survey: A Context for Findings from a New Audit Study, Urban Institute, April 2014, http://www.urban.org/publications/413089.html ↩︎
- Sandra Decker, “Two-Thirds of Primary Care Physicians Accepted New Medicaid Patients In 2011–12: A Baseline to Measure Future Acceptance Rates,” Health Affairs 32(7), July 2013, http://content.healthaffairs.org/content/32/7/1183.abstract; Andrew Bindman, Andrew Chu, and Kevin Grumbach. Physician Participation in Medi-Cal, 2008, California Healthcare Foundation, July 2010, http://www.chcf.org/~/media/MEDIA%20LIBRARY%20Files/PDF/P/PDF%20PhysicianParticipationMediCal2008.pdf; Peter Cunningham and Jessica May, Medicaid Patients Increasingly Concentrated Among Physicians, Tracking Report No. 16, August 2006, http://www.hschange.com/CONTENT/866/ ↩︎
- Stephen Zuckerman, Aimee Williams, and Karen Stockley, “Trends In Medicaid Physician Fees, 2003–2008,” Health Affairs 28(3), May/June 2009, http://content.healthaffairs.org/content/28/3/w510.full#ref-26 ↩︎
- Report to Congress on the Nation’s Substance Abuse and Mental Health Workforce Issue, Substance Abuse and Mental Health Services Administration, U.S. Department of Health and Human Services, January 24, 2013, http://store.samhsa.gov/shin/content/PEP13-RTC-BHWORK/PEP13-RTC-BHWORK.pdf ↩︎
- Medicaid Benefits: Dental Services (Kaiser Family Foundation), https://modern.kff.org/medicaid/state-indicator/dental-services/ ↩︎
- Medicaid: States Made Multiple Program Changes, and Beneficiaries Generally Reported Access Comparable to Private Insurance, General Accountability Office, November 2012, http://www.gao.gov/products/GAO-13-55 ↩︎
- Karin Rhodes, Genevieve Kenney, Ari Friedman, Brendan Saloner, Charlotte Lawson, David Chearo, Douglas Wissoker, and Daniel Polsky,“Primary Care Access for New Patients on the Eve of Health Reform,” JAMA Internal Medicine, June 2014, https://archinte.jamanetwork.com/article.aspx?articleid=1857092; Joanna Bisgaier and Karin Rhodes, “Auditing Access to Specialty Care for Children with Public Insurance,” New England Journal of Medicine, June 16, 2011, http://www.nejm.org/doi/full/10.1056/NEJMsa1013285 ↩︎
- State Standards for Access to Care in Medicaid Managed Care, Office of Inspector General, U.S. Department of Health and Human Services, September 2014, http://oig.hhs.gov/oei/reports/oei-02-11-00320.pdf; Access to Care: Provider Availability in Medicaid Managed Care, Office of Inspector General, U.S. Department of Health and Human Services, December 2014, http://oig.hhs.gov/oei/reports/oei-02-13-00670.pdf ↩︎
- Daniel Polsky, Michael Richards, Simon Basseyn, Douglas Wissoker, Genevieve Kenney, Stephen Zuckerman, and Karin Rhodes, “Appointment Availability after Increases in Medicaid Payments for Primary Care,” New England Journal of Medicine, February 5, 2015, http://www.nejm.org/doi/full/10.1056/NEJMsa1413299 ↩︎
- Vernon Smith, Kathleen Gifford, Eileen Ellis, Robin Rudowitz and Laura Snyder, Medicaid in an Era of Health & Delivery System Reform: Results from a 50-State Medicaid Budget Survey for State Fiscal Years 2014 and 2015 (Kaiser Family Foundation, October 2014), https://modern.kff.org/medicaid/report/medicaid-in-an-era-of-health-delivery-system-reform-results-from-a-50-state-medicaid-budget-survey-for-state-fiscal-years-2014-and-2015/ ↩︎
- Rachel Garfield and Katherine Young, Enrollment-Driven Expenditure Growth: Medicaid Spending During the Economic Downturn, FY 2007-2011 (Kaiser Family Foundation, April 2013), https://modern.kff.org/medicaid/report/enrollment-driven-expenditure-growth-medicaid-spending-during/ ↩︎
- Federal Medical Assistance Percentage (FMAP) for Medicaid and Multiplier, https://modern.kff.org/medicaid/state-indicator/federal-matching-rate-and-multiplier/ (FY 2015). ↩︎
- Federal and State Share of Medicaid Spending, https://modern.kff.org/medicaid/state-indicator/federalstate-share-of-spending/ ↩︎
- Robin Rudowitz, Laura Snyder, Vernon Smith, Kathleen Gifford, and Eileen Ellis, Implementing the ACA: Medicaid Spending & Enrollment Growth for FY 2014 and FY 2015 (Kaiser Family Foundation, October 2014), https://modern.kff.org/medicaid/issue-brief/implementing-the-aca-medicaid-spending-enrollment-growth-for-fy-2014-and-fy-2015/ ↩︎