Data Note: Changes in 2017 Federal Navigator Funding
Data Note
The Affordable Care Act (ACA) created Navigator programs to provide outreach, education, and enrollment assistance to consumers eligible for coverage through the Marketplaces and through Medicaid and requires that they be funded by the marketplaces. For the past two years, the Centers for Medicare and Medicaid Services (CMS) has funded Navigator programs in the 34 states that use the federal marketplace through a multi-year agreement that was expected to continue for the current budget year. In August, CMS officials announced significant reductions to Navigator funding for the 2018 budget year. These funding reductions coming so close to the start of the 2018 open enrollment period will affect the help many Navigators can provide to consumers seeking to enroll in coverage.
This data note analyzes funding changes and discusses the implications for Navigators and consumers. It presents results of a Kaiser Family Foundation online survey of federal marketplace (FFM) Navigator programs conducted from September 22, 2017 – October 4, 2017 about 2017 funding awards (for the 2018 open enrollment period), the relationship between funding amounts and program performance, and the likely impact of funding changes on programs and the consumers they serve. It also includes insights from a roundtable meeting of more than 40 Navigators co-hosted by the Robert Wood Johnson Foundation and Kaiser Family Foundation held on September 15, 2017, as well as analysis of administrative data.
Background
In 2015, CMS signed three-year agreements with Navigator organizations to provide consumer assistance to residents of federal marketplace states. The multi-year agreements promoted continuity and experience among Navigator professionals. Multi-year agreement also spared CMS and Navigators the time and expense involved in reissuing grants during critical weeks leading up to open enrollment. Under the agreements, Navigator programs in the FFM states are required to set goals and report performance data throughout the year relating to specific duties and activities.
Funding amounts under the multi-year agreements have been determined annually — $60 million for the first budget year (which runs September through August), and $63 million for the second budget year. CMS notified continuing programs of the grant amount available to them for the coming year in late spring; programs then submitted work plans, budgets, and performance goals based on that amount. Once CMS approved these plans, final awards were made in late August.
In May 2017, continuing Navigator programs were notified of available third-year funding amounts, which totaled $60 million, with grants for most programs similar to the year-two funding amount. In June, programs submitted their work plans and budgets corresponding to these amounts. The Navigator programs expected final Notice of Awards (NOA) by September 1, 2017.
On August 31, one day prior to the end of the second budget period of the grants, CMS announced it would reduce Navigator funding by more than 40%. CMS issued a bulletin stating that funding for the third year would be based on program performance on its enrollment goals for the second budget period. On September 13, 2017, two weeks into the third budget year of the grant, FFM Navigator programs received preliminary NOAs for third-year funding, which totaled $36.8 million, or 58% of the year-two awards. (See Appendix A for funding awards by program.)
2017 Navigator Funding Reductions
CMS notified Navigator program of their preliminary 2017 grant awards on September 13, 2017. The full list of preliminary awards was obtained and released by a third party (see Appendix A). This section summarizes funding changes based on information from that list.
Funding changes at the state level for 2017 were uneven across states. Three FFM states (Delaware, Kansas, and West Virginia) received no net reduction in year-three Navigator funding. Among the other 31 FFM states, the funding reductions ranged from 10% in North Carolina to 80% or more in Indiana, Nebraska, and Louisiana (Table 1).
| Table 1: 2016 Federal Navigator Funding Awards and Preliminary 2017 Awards as of September 13, 2017, by State | |||
| State | 2016 Funding Award | 2017 Preliminary Funding Award | Percent Change |
| Alabama | $1,338,335 | $1,036,859 | -23% |
| Alaska | $600,000 | $446,805 | -26% |
| Arizona | $1,629,237 | $1,167,592 | -28% |
| Delaware | $600,000 | $600,000 | 0% |
| Florida | $9,464,668 | $6,625,807 | -30% |
| Georgia | $3,682,732 | $1,433,936 | -61% |
| Hawaii | $334,510 | $185,143 | -45% |
| Illinois | $2,581,477 | $1,792,170 | -31% |
| Indiana | $1,635,961 | $296,704 | -82% |
| Iowa | $603,895 | $226,323 | -63% |
| Kansas | $731,532 | $731,532 | 0% |
| Louisiana | $1,535,332 | $307,349 | -80% |
| Maine | $600,000 | $551,750 | -8% |
| Michigan | $2,228,692 | $627,958 | -72% |
| Mississippi | $907,579 | $382,281 | -58% |
| Missouri | $1,815,514 | $729,577 | -60% |
| Montana | $495,701 | $374,750 | -24% |
| Nebraska | $600,000 | $115,704 | -81% |
| New Hampshire | $600,000 | $456,214 | -24% |
| New Jersey | $1,905,132 | $720,545 | -62% |
| North Carolina | $3,405,954 | $3,061,034 | -10% |
| North Dakota | $636,648 | $208,524 | -67% |
| Ohio | $1,971,421 | $568,327 | -71% |
| Oklahoma | $1,162,363 | $798,000 | -31% |
| Pennsylvania | $3,073,116 | $1,988,501 | -35% |
| South Carolina | $1,517,783 | $511,048 | -66% |
| South Dakota | $600,000 | $236,947 | -61% |
| Tennessee | $1,772,618 | $1,497,410 | -16% |
| Texas | $9,217,235 | $6,110,535 | -34% |
| Utah | $902,681 | $394,862 | -56% |
| Virginia | $2,187,871 | $1,108,189 | -49% |
| West Virginia | $600,000 | $600,000 | 0% |
| Wisconsin | $1,338,306 | $749,215 | -44% |
| Wyoming | $605,847 | $183,654 | -70% |
| Total | $62,882,140 | $36,825,245 | -41% |
| Source: List of preliminary grant awards was obtained and released by a third party, not by CMS. | |||
When the multi-year agreement was established, federal funding was allocated across FFM states based on the state’s share of the number of uninsured people, with a minimum amount ($600,000) reserved for each of the smallest states. This allocation formula no longer seems to apply. For example, total funding for Navigators in Indiana ($290,000) was less than that for Navigators in Alaska ($447,000) despite the fact that there are four times as many uninsured residents in Indiana compared to Alaska (422,000 vs 95,600 in 2016). Similarly, funding for Navigators in Ohio was less than that for Navigators in Oklahoma ($568,000 vs $798,000) though there are more uninsured residents in Ohio (631,000 vs 409,000).1
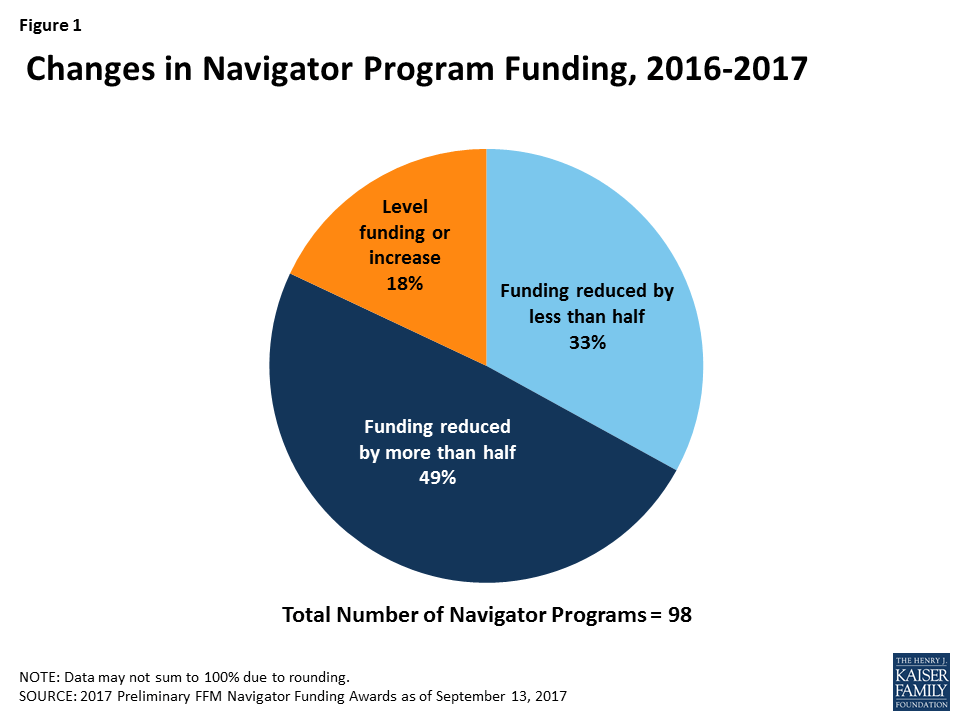
Overall, the funding reductions varied widely across individual Navigator programs. The vast majority (82%) of Navigator programs experienced reductions, while 18% of programs saw their funding stay the same or increase compared to funding levels in 2016. Forty-nine percent of programs had their funding reduced by more than half and more than one-quarter experienced funding reductions of over 75% (Figure 1).
Navigator Program Funding versus Performance
This section summarizes findings from the KFF Survey of FFM Navigators about 2017 funding changes and program performance on certain metrics during the second year of the multi-year agreement. All Navigator programs were contacted, and 51% participated in the survey.
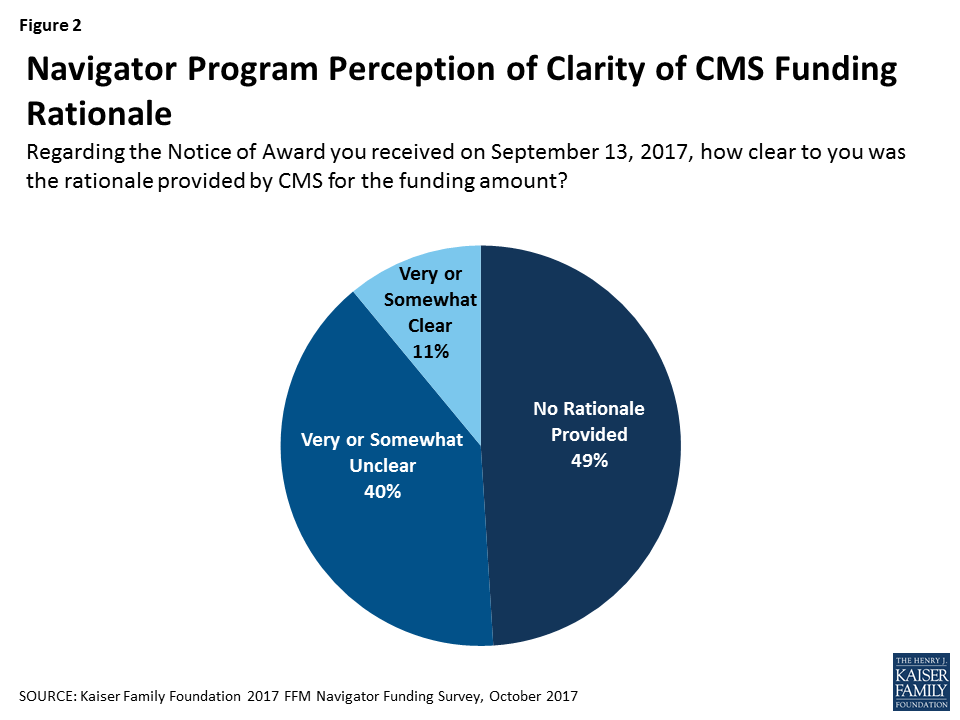
Navigators say the basis for 2017 funding decisions has not been clear. Nearly half (49%) of respondents said that the rationale for the funding notice they received on September 13 was not provided at all, and another 40% said it was unclear (Figure 2).
The August 31 CMS bulletin indicated that funding for the Navigators would be based on performance against year-two “enrollment goals.” According to the bulletin, “a grantee that achieved 100 percent of its enrollment goal for plan year 2017 will receive the same level of funding as last year, while a grantee that enrolled only 70 percent of its enrollment goal would receive 70 percent of its previous year funding level, a reduction of 30 percent. The new funding formula will ensure accountability within the Navigator program.”
It is not clear what metric CMS used to determine funding levels since Navigators have been required to track a number of activities relative to goals, all of which could result in or contribute to enrollment in health coverage. These include:
- Number of consumers assisted with qualified health plan (QHP) selection/enrollment (including reenrollment);
- Number of one-on-one interactions with consumers, including both general and specific inquiries; and
- Number of consumers assisted with applying for Medicaid/CHIP, including referral of consumers in non-expansion states to the state Medicaid office;
- Number of consumers reached through outreach and public education activities.2
Navigator-assisted qualified health plan selection Metric
The number of consumers assisted with QHP selections is the most direct measure of marketplace enrollment tracked by Navigators, although as discussed below, it does not capture all marketplace enrollments that involved Navigator assistance.
There are two measures of Navigator-assisted QHP selections, one self-reported by the programs and one based on data collected by healthcare.gov – the Multidimensional Information and Data Analytics System, or MIDAS data. The healthcare.gov online application includes a field where Navigator staff can enter their identification number for each consumer whom they assist. Navigators report that program staff have not been trained on this data entry and did not consistently enter it. Several weeks after the start of the fourth open enrollment period, some Navigator programs said they were encouraged by their CMS project officers to improve consistency of staff identification numbers on applications. Some say they subsequently received reports from CMS staff during the project year comparing MIDAS and self-reported data on QHP selections that did not match – in some cases by a factor of two – and programs did not know why. Other programs said they did not receive reports from CMS on their MIDAS data. Navigators expressed concern about the accuracy of data counting QHP selections, especially if this will become the basis for future funding decisions.
The survey asked Navigators to provide both their goal and self-reported performance data for Navigator-assisted QHP selections as reported to CMS for the second budget period. Navigator performance relative to the goal was compared to the change in funding from 2016 to 2017. Among programs that provided the performance data, findings include:
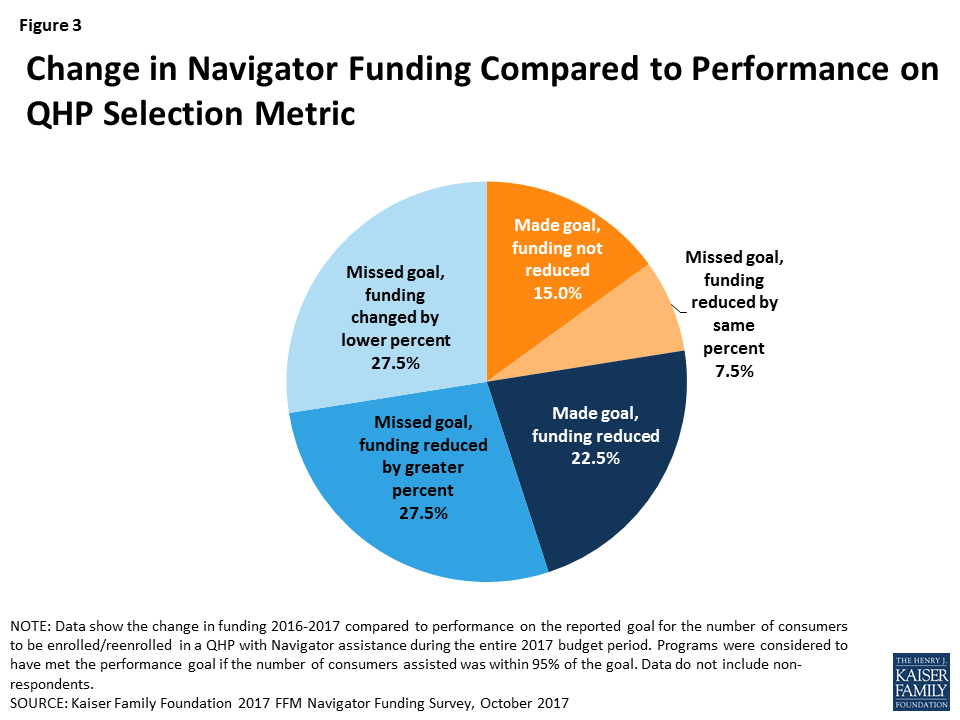
For 22.5% of programs, 2017 funding matches performance on the self-reported QHP selection metric (Figure 3). Included in this group were:
- 15.0% of programs that exceeded or met at least 95% of the goal and whose 2017 funds were not reduced; and
- 7.5% of programs that did not meet the goal and had funding reduced by the same or similar percentage (+/- 5%).
For 77.5% of programs, 2017 funding does not reflect performance on the QHP selection metric. Included in this group were:
- 22.5% of programs that exceeded or met at least 95% of the goal and whose 2017 funds were reduced;
- 27.5% of programs that did not meet the goal and had funding reduced by a greater percentage; and
- 27.5% of programs that did not meet the goal and had funding changed by a smaller percentage.
The QHP selection metric tends to undercount enrollment that is connected to assistance provided by Navigators. Through the survey and at the roundtable, Navigators expressed concern that the QHP selection measure does not reflect the number of consumers whom they help and who ultimately enroll in marketplace health plans. This metric, as defined by CMS, counts only those consumers who select a plan in the Navigator’s presence, a fraction of the total number of individuals who enroll in coverage and who were helped by Navigators. For example, if a Navigator helped a consumer complete her application and reviewed plan choices, but the consumer went home to consider her options and made a final selection that evening, that visit could not be reported as a Navigator-assisted plan selection.3 According to the Kaiser Family Foundation 2016 Survey of Health Insurance Marketplace Assister Programs and Brokers, 18% of assister programs reported that nearly all consumers they helped who were determined eligible to enroll in a QHP made their plan selection during the initial visit. Thirty-five percent said they knew the final plan selection of all or nearly all such consumers whom they helped.
Other Navigator Performance Metrics
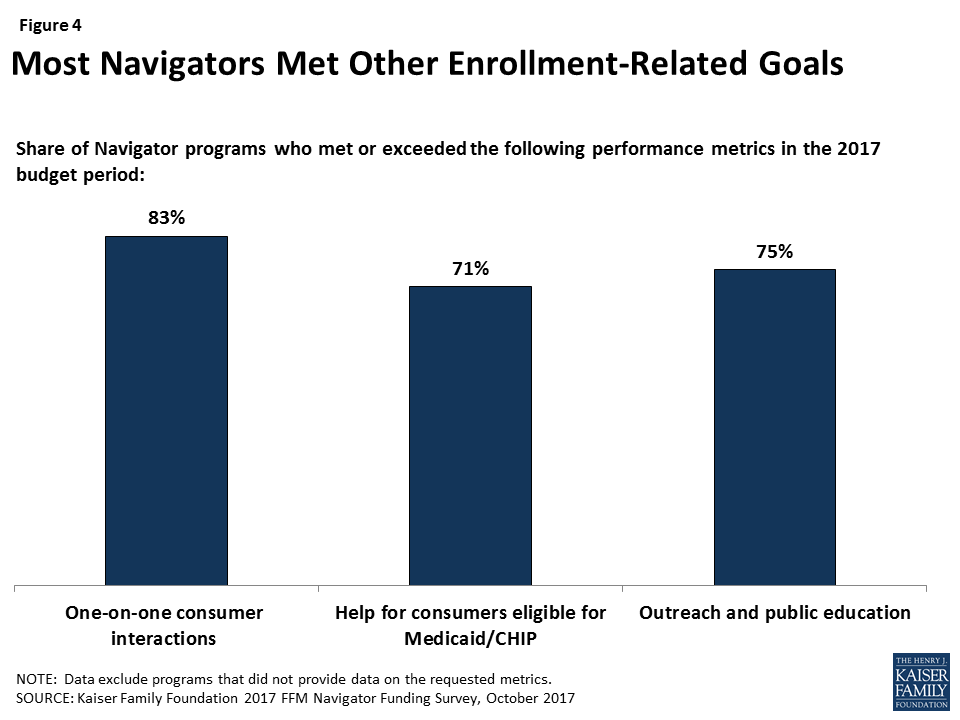
Funding changes for 2017 also do not appear to align with performance on other metrics. Navigators reported goals and performance data on other key metrics that relate to enrollment (Figure 4). Most programs met or exceeded these goals, so these metrics do not appear to be related to the funding reductions. Among programs that answered these questions, Eight in ten programs (83%) met their goals for one-on-one consumers interactions, 71% met their goals for helping consumers enroll in Medicaid or CHIP, and three quarters met their outreach and education event goal.
One-on-one assistance: The most comprehensive measurement required by CMS is the number of consumers provided one-on-one assistance. A one-on-one encounter can involve helping a consumer with any step along the process that ends with enrollment: educating consumers about the availability of plans and assistance, completing a marketplace application for financial assistance, appealing a marketplace decision, reviewing and understanding plan options, or selecting a QHP. Navigators also provide one-on-one assistance to consumers after they enroll so that they can remain covered. Such help includes answering tax reconciliation questions, resolving premium payment disputes, and referring consumers for help with denied claims. Once they have resolved the problem they came in with, many consumers leave and complete the enrollment process on their own. The one-on-one assistance metric would also count consumers who are helped but who do not enroll in coverage. On average, the number one-on-one encounters Navigators reported was 15 times higher than the number of QHP selections.
Medicaid/CHIP enrollment assistance or referrals: The ACA requires a “no wrong door” application process through which consumers can apply through the marketplace, using a single streamlined application, for either private health insurance subsidies or Medicaid/CHIP. Navigators are required to help all consumers with the application. Navigators from Medicaid expansion states noted that most consumers who sought help were ultimately determined Medicaid eligible. At the roundtable, some commented that, when the August 31 bulletin was released, they assumed CMS would base funding on enrollment under both types of coverage.
Outreach and public education: Four years after implementation, the public’s understanding of ACA benefits and requirements remains limited. For example, many consumers continue to be unaware that signups for private non-group health insurance, generally, must take place during open enrollment.4 Turnover in marketplace plans is high, as most participants need non-group coverage only while they are between jobs or other types of coverage. Navigators report that consumers are less likely to seek, or be receptive to, information about the marketplace until they actually need it.
Impact of Navigator Funding Reductions
This section summarizes findings from the KFF Navigator survey as well as insights from the Navigator Roundtable meeting on program changes that may result from the funding reductions.
Most Navigator programs say they will continue to operate in 2018 despite the funding reductions. However, three programs said they will terminate work for year-three. These include two programs – one statewide and one nearly statewide5 – that had been the only Navigator service providers for consumers in most areas of their respective states. Their decision to withdraw was based on the level and timing of funding reductions. The September 13 NOA directed that no more than 10% of the grantee’s award could be spent by programs pending CMS review and approval of the final budget and work plan. Because the preliminary award was announced two weeks into the plan year with final awards scheduled to be made as late as October 28, grantees were faced with maintaining staff payroll and other expenses for as long as two months without assurances they would be reimbursed. The terminating programs, both operated by nonprofits, determined this was not feasible.
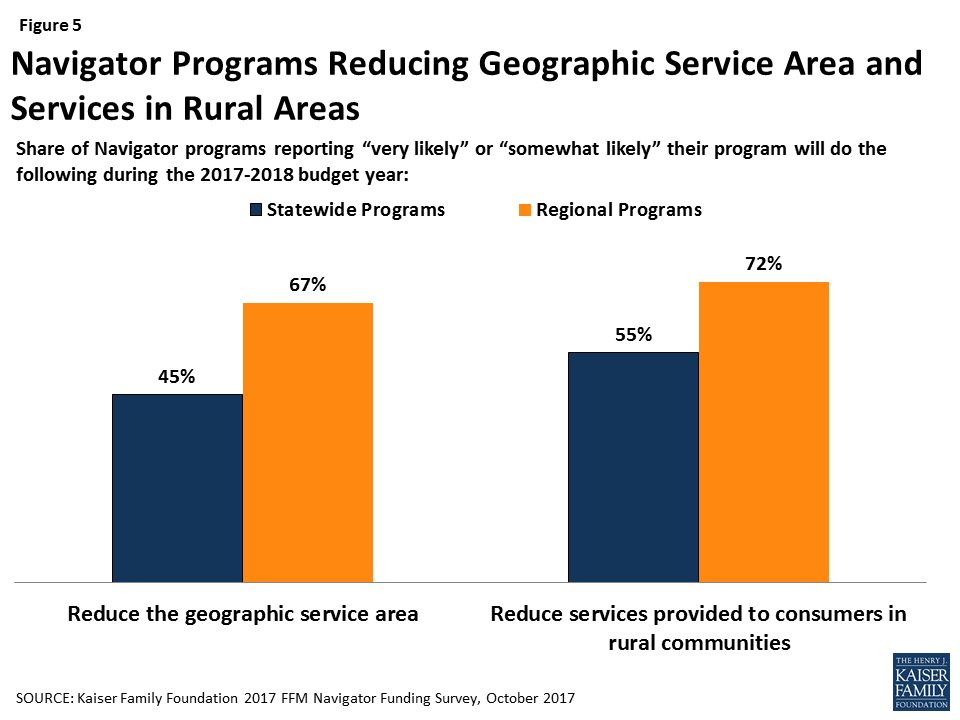
Most programs report they will likely reduce their geographic service area and limit help to rural residents. Among programs whose funding was reduced, 45% of statewide programs and two-thirds of regional programs said it is somewhat or very likely they will have to limit the territory their program will serve in year three. Programs emphasized their inability to afford the same level of travel expenses and/or the cost of satellite offices that they had previously incurred in order to offer in-person help to consumers living farther away. Consumers living in rural communities may be the most affected. Most (55%) statewide Navigator programs and 72% of regional programs expect to limit services to rural residents this year (Figure 5).
Nearly all programs (89%) expect to lay off staff as a result of funding reductions (Figure 6). Some programs expect to cut Navigator staff by 75% or more. The KFF 2016 Assister Survey found that continuity among staff has been high to date. One advantage of the multi-year agreement was to allow staff experience to grow over time. To fill in the gaps left by staff lay-offs, some programs plan to rely more heavily on less experienced volunteers.
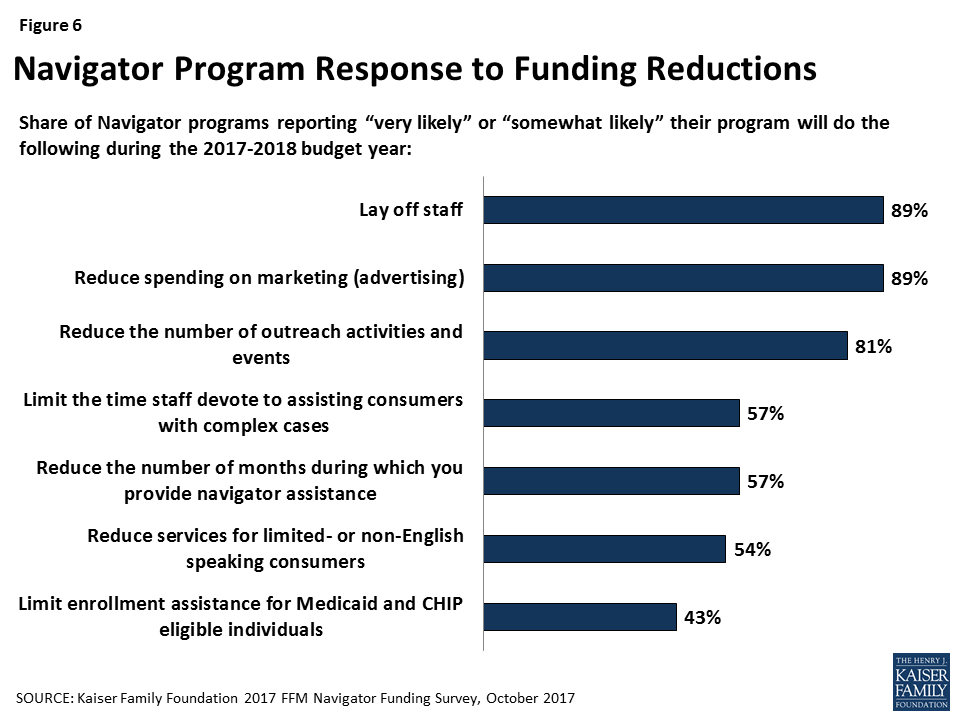
Most Navigator programs expect to reduce services in other ways, as well. Nearly all programs (81%) say they will likely reduce outreach and public education activities as a result of budget reductions. In addition, 89% of programs say they will likely reduce spending on marketing and advertising. Nearly six in ten programs (57%) said they will likely reduce the number of months in which they offer Navigator assistance. Some programs expect to close following open enrollment, others will cut back to a skeletal staff. As a result, consumers who need assistance at tax time, or help with special enrollments or post-enrollment problems during the year, may have difficulty finding it.
Over four in ten programs say it is likely they will curtail help to consumers related to Medicaid. At the roundtable, some discussed a strategy of pre-screening consumers during open enrollment to identify those likely eligible for Medicaid/CHIP. These consumers might be asked to come back at a later date, if they do not have an immediate medical or coverage need, because Medicaid and CHIP enrollment is year round. Other expressed concern that, if CMS bases future funding on QHP plan selections, Navigators in Medicaid expansion states could be disadvantaged.
In addition, 57% of programs say they will likely limit time staff can devote to helping consumers with complex cases. These cases include consumers experiencing identity proofing problems (for example, faced by young adults who have not previously filed income tax returns or established credit ratings).6 They also include consumers with income data-matching problems (for example, self-employed individuals who have difficulty estimating income for the coming year). People who cannot resolve identity or other data verification problems within 90 days risk losing their marketplace coverage or subsidies.
Another 54% of programs say they will likely limit the number of limited English proficiency (LEP) consumers they can serve. Programs often pay a premium for bi-lingual staff, an expense they may no longer be able to afford with reduced funding.
Consumers who need these kinds of assistance may have difficulty finding it elsewhere. Many consumers seek help from other types of marketplace assister programs. Federally qualified health centers (FQHCs) also receive funding from the federal government to provide in-person enrollment assistance, although the authorization for most federal funding expired September 30 and has yet to be extended. In addition, Certified Application Counselor (CAC) programs provide in-person help in the marketplace, though are not paid by the marketplace. The KFF 2016 Assister Survey found that all three types of programs play an important role in helping consumers. They also tend to differ from Navigator programs in some key respects. In particular, Navigator programs typically undergo a higher level of training; they are more likely to operate statewide, sponsor outreach and enrollment events, handle complex cases, and provide help throughout the year.
The KFF 2016 Assister Survey also found that agents and brokers are less likely than marketplace assister programs to serve consumers who need translation services, help with complex cases, and help with Medicaid applications. Brokers and agents are also less likely to help uninsured consumers, immigrants, and consumers who lack internet at home.
Discussion
The Administration’s decision to reduce funding for Navigator programs comes at a challenging time for consumers who rely on coverage through the marketplaces. High-profile insurer exits from the marketplaces, rising premiums, and uncertainty over the federal commitment to funding the cost sharing subsidies are likely sowing confusion among consumers about whether coverage and financial assistance remain available. This confusion, coupled with a shortened open enrollment period, increases demand for the consumer education and in-person enrollment assistance Navigators provide. At a time when more help may be needed, the funding reductions are likely to reduce the level of in-person help available to consumers during this fall’s open enrollment and throughout the 2018 coverage year.
Navigator programs generally report that they do not understand the basis for the funding decisions, and our survey results suggest that there is not a clear link between funding and performance of programs relative to goals on the measures they are required to track and self-report. This ambiguity makes it difficult for programs to plan for the future.
Both the magnitude of the reductions and the timing has caused disruption to Navigator program planning and operations. Programs plan to adopt various strategies in response to the reductions, including reducing their geographic service area and cutting services, such as outreach and assisting with complex cases. Three programs report they will terminate operations, leaving consumers in their states with very limited access to in-person help. While consumers may be able to turn to other assister programs or brokers, less in-person assistance will be available in some areas, especially for people with complex situations or who live in remote or rural communities.
Methods
The Kaiser Family Foundation conducted an online survey of FFM Navigator programs September 22, 2017 – October 4, 2017. All 94 continuing programs from 34 FFM states were invited to participate; 48 programs from 32 states completed the survey, for a response rate of 51%. Survey questions are included in Appendix B.
Additionally, on September 15, 2017, the Robert Wood Johnson Foundation and Kaiser Family Foundation co-hosted a Navigator Roundtable meeting. More than 40 Navigators participated and discussed the 2017 funding awards and strategies for open enrollment.
Appendix
Appendix A
| Appendix Table A: 2016 Federal Navigator Funding Awards and Preliminary 2017 Awards as of September 13, 2017 | |||||
| State | Navigator Grantee Organization | Statewide Program in 2016 | 2016 Funding Award | 2017 Preliminary Funding Award | Percent Change |
| Alaska | Alaska Primary Care Association | Yes | $327,859 | $249,231 | -24% |
| Alaska | United Way of Anchorage | No | $272,141 | $197,574 | -27% |
| Alabama | AIDS Alabama | Yes | $809,944 | $808,594 | 0% |
| Alabama | Tombigbee Healthcare Authority | No | $528,391 | $228,265 | -57% |
| Arizona | Arizona Board of Regents, University of Arizona | No | $537,916 | $460,456 | -14% |
| Arizona | Arizona Association of Community Health Centers | Yes | $1,091,321 | $707,136 | -35% |
| Delaware | Westside Family Healthcare | Yes | $260,904 | $300,000 | 15% |
| Delaware | Chatman, LLC | Yes | $339,096 | $300,000 | -12% |
| Florida | Pinellas County Board of County Commissioners | No | $580,000 | $580,000 | 0% |
| Florida | University of South Florida | Yes | $5,813,294 | $4,929,252 | -15% |
| Florida | The Public Health Trust dba Jackson Health System | No | $278,910 | $205,696 | -26% |
| Florida | Epilepsy Foundation of Florida | No | $1,753,494 | $720,491 | -59% |
| Florida | Community Health Interventions & Sickle Cell Agency, Inc. | No | $489,170 | $146,751 | -70% |
| Florida | Meridian Behavioral Healthcare | No | $549,800 | $43,617 | -92% |
| Georgia | Georgia Association for Primary Health Care | No | $941,522 | $941,522 | 0% |
| Georgia | Georgia Refugee Health and Mental Health | No | $307,088 | $153,544 | -50% |
| Georgia | Health Care Central Georgia dba Community Health Works | Yes | $2,288,988 | $328,870 | -86% |
| Georgia | Boat People SOS | No | $145,134 | $10,000 | -93% |
| Hawaii | Legal Aid Society Hawaii | Yes | $334,510 | $185,143 | -45% |
| Iowa | Visiting Nurse Services of Iowa | No | $180,891 | $171,304 | -5% |
| Iowa | Planned Parenthood of the Heartland | Yes* | $304,373 | $45,019 | -85% |
| Iowa | Genesis Health System | No | $118,631 | $10,000 | -92% |
| Illinois | United Way of Metropolitan Chicago | No | $713,514 | $713,514 | 0% |
| Illinois | Southern Illinois Healthcare Foundation | No | $294,372 | $270,233 | -8% |
| Illinois | Patient Innovation Center NFP | No | $1,052,854 | $736,998 | -30% |
| Illinois | Pekin Memorial Hospital | No | $260,850 | $51,425 | -80% |
| Illinois | Genesis Health System | No | $79,181 | $10,000 | -87% |
| Illinois | Sarah Bush Lincoln Health Center | No | $186,076 | $10,000 | -95% |
| Indiana | Community Action of Southern Indiana | No | $221,987 | $61,950 | -72% |
| Indiana | Affiliated Service Providers of Indiana | Yes | $906,987 | $168,565 | -81% |
| Indiana | Indiana Primary Health Care Association | No | $506,987 | $66,189 | -87% |
| Kansas | Ascension Health | No | $215,471 | $215,471 | 0% |
| Kansas | Kansas Association for the Medically Underserved | Yes | $516,061 | $516,061 | 0% |
| Louisiana | Southwest Louisiana Area Health Education Center | Yes | $1,073,462 | $297,349 | -72% |
| Louisiana | Family Road of Greater Baton Rouge | No | $461,870 | $10,000 | -98% |
| Maine | Fishing Partnership Health Plan | No | $79,000 | $100,000 | 27% |
| Maine | Western Maine Community Action | Yes | $521,000 | $451,750 | -13% |
| Michigan | Midwest Asian Health Association (MAHA) | No | $135,581 | $135,581 | 0% |
| Michigan | Arab Community Center for Economic and Social Services | No | $555,711 | $352,478 | -37% |
| Michigan | Michigan Consumers for Healthcare | Yes | $1,200,000 | $129,899 | -89% |
| Michigan | City of Garden City | No | $300,000 | $10,000 | -97% |
| Missouri | Planned Parenthood of St. Louis | No | $349,908 | $337,293 | -4% |
| Missouri | Missouri Alliance for Area Agencies on Aging | Yes* | $919,902 | $349,251 | -62% |
| Missouri | St. Louis Effort for AIDS | Yes* | $545,704 | $43,033 | -92% |
| Mississippi | The University of Southern Mississippi | No | $359,712 | $327,338 | -9% |
| Mississippi | Oak Hill Missionary Baptist Church Ministries, Incorporated | Yes | $547,867 | $54,943 | -90% |
| Montana | Intermountain Planned Parenthood | No | $337,555 | $374,750 | 11% |
| North Carolina | Legal Aid of North Carolina | Yes | $2,444,703 | $2,444,703 | 0% |
| North Carolina | Randolph Hospital | No | $265,036 | $265,036 | 0% |
| North Carolina | Mountain Projects | No | $396,215 | $317,962 | -20% |
| North Carolina | Alcohol/Drug Council of North Carolina | Yes | $300,000 | $33,333 | -89% |
| North Dakota | Minot State University | Yes | $300,000 | $12,000 | -96% |
| North Dakota | Family HealthCare Center | No | $186,524 | $186,524 | 0% |
| North Dakota | Great Plains Tribal Chairmen’s Health Board | No | $150,124 | $10,000 | -93% |
| Nebraska | HRS/Erase Inc. | No | $145,000 | $39,512 | -73% |
| Nebraska | Community Action of Nebraska | Yes* | $455,000 | $76,192 | -83% |
| New Hampshire | Bhutanese Community of New Hampshire | No | $245,488 | $354,512 | 44% |
| New Hampshire | Bi-State Primary Care Association | No | $354,512 | $101,702 | -71% |
| New Jersey | The FoodBank of Monmouth and Ocean Counties | No | $300,000 | $268,966 | -10% |
| New Jersey | Jewish Renaissance Medical Center | No | $124,797 | $62,061 | -50% |
| New Jersey | Center for Family Services | No | $805,000 | $291,995 | -64% |
| New Jersey | The Family Resource Network | No | $347,327 | $50,813 | -85% |
| New Jersey | Wendy Sykes/The Oranges ACA Navigator Project (OACANP) | No | $325,008 | $46,710 | -86% |
| Ohio | HRS/Erase Inc. | No | $274,392 | $82,360 | -70% |
| Ohio | Ohio Association of Foodbanks | Yes | $1,697,029 | $485,967 | -71% |
| Oklahoma | Oklahoma Community Health Centers | No | $669,230 | $497,312 | -26% |
| Oklahoma | Little Dixie Community Action Agency | Yes* | $493,133 | $300,688 | -39% |
| Pennsylvania | Young Women’s Christian Association of Pittsburgh | No | $257,864 | $232,078 | -10% |
| Pennsylvania | Consumer Health Coalition | No | $728,902 | $592,527 | -19% |
| Pennsylvania | Public Health Management Corporation | No | $392,691 | $254,230 | -35% |
| Pennsylvania | Pennsylvania Association of Community Health Centers | Yes | $948,432 | $612,674 | -35% |
| Pennsylvania | Penn Asian Senior Services | No | $291,844 | $131,054 | -55% |
| Pennsylvania | Pennsylvania Mental Health Consumers Association | No | $453,383 | $165,938 | -63% |
| South Carolina | Palmetto Project | Yes | $1,092,798 | $501,048 | -54% |
| South Carolina | Beaufort County Black Chamber of Commerce | No | $424,985 | $10,000 | -98% |
| South Dakota | South Dakota Community Action Partnership | Yes | $400,000 | $226,947 | -43% |
| South Dakota | Great Plains Tribal Chairmen’s Health Board | No | $200,000 | $10,000 | -95% |
| Tennessee | Family & Children’s Service | Yes | $1,640,618 | $1,497,410 | -9% |
| Texas | Light and Salt Association | No | $448,606 | $448,606 | 0% |
| Texas | MHP Salud | No | $707,066 | $707,066 | 0% |
| Texas | Sacred Heart Health System | No | $1,503,391 | $1,428,221 | -5% |
| Texas | Community Council of Greater Dallas | No | $2,279,507 | $1,863,440 | -18% |
| Texas | Coastal Bend Center for Independent Living | No | $375,277 | $280,927 | -25% |
| Texas | East Texas Behavioral Healthcare Network (ETBHN) | No | $1,027,660 | $415,243 | -60% |
| Texas | South Plains Community Action Association | No | $1,140,806 | $427,595 | -63% |
| Texas | Change Happens | No | $1,330,000 | $488,722 | -63% |
| Texas | Brazos Valley Economic Development Council | No | $150,869 | $37,064 | -75% |
| Texas | Latino HealthCare Forum | No | $254,053 | $13,651 | -95% |
| Utah | Urban Indian Center of Salt Lake | No | $162,591 | $105,278 | -35% |
| Utah | Utah Health Policy Project | yes | $740,090 | $289,584 | -61% |
| Virginia | Boat People SOS | No | $205,398 | $205,398 | 0% |
| Virginia | Virginia Poverty Law Center | Yes | $1,846,210 | $902,791 | -51% |
| Wisconsin | The Board of Regents of the University of Wisconsin System | No | $998,960 | $576,197 | -42% |
| Wisconsin | Northwest Wisconsin Concentrated Employment Program | No | $306,227 | $173,018 | -44% |
| West Virginia | First Choice Services | Yes | $242,319 | $300,000 | 24% |
| West Virginia | West Virginia University Research Corp. | No | $357,681 | $300,000 | -16% |
| Wyoming | Memorial Hospital of Laramie County dba WY Inst Pop Health | Yes | $427,286 | $166,642 | -61% |
| Wyoming | Wyoming Health Council | No | $178,561 | $17,012 | -90% |
| Total | $62,387,582 | $36,825,245 | -41% | ||
| Notes: *Denotes a program that is nearly statewide, covering more than 80% of counties in the state.Source: List of preliminary awards was obtained and released by a third party, not by CMS. Navigator programs with 2017 funding changes were required to submit revised work plans and budgets by September 27, 2017. CMS committed to review and make final award determinations, on a rolling basis, within 30 days. | |||||
Appendix B
| KFF Federal Navigator Funding Survey Questions |
| Funding Awards |
1. What was the amount of funding for your Navigator program indicated in the Notice of Award (NOA) dated September 13, 2017? 2. In about May or June of 2017, did you receive preliminary estimate from CMS of your 2017 award? a. Yes b. No 3. If yes, what was that amount? 4. Regarding the Notice of Award you received on September 13, 2017, how clear to you was the rationale provided by CMS for the funding amount? a. Very Clear b. Somewhat Clear c. Somewhat Unclear d. Very Unclear e. No rationale was provided |
| Performance Goals for 2016-2017 Budget Period |
5. Goal for number of consumers to be enrolled/reenrolled in a QHP with Navigator assistance during the entire 2017 budget period. 6. Goal for number of consumers to be assisted with applying for or being referred to Medicaid/CHIP with Navigator assistance during the entire 2017 budget period. 7. Goal for number of one-on-one consumer interactions (including both general and specific inquiries) during the entire 2017 budget period. 8. Goal for number of consumers expected to be reached through public education and outreach activities, as reported in AssistConnect during the entire 2017 budget period. |
| Self-Reported Performance Data for the 2016-2017 Budget Period |
9. Number of consumers assisted with selecting/enrolling in a QHP (including re-enrollment) during the entire 2016-2017 budget period, as reported through HIOS. 10. Number of consumers applying for or being referred to Medicaid/CHIP with Navigator assistance during the entire 2016-2017 budget period, as reported through HIOS. 11. Number of one-on-one consumer interactions (including both general and specific inquiries) during the entire 2016-2017 budget period, as reported through HIOS. 12. Number of consumers reached through public education and outreach activities during the entire 2016-2017 budget period, as reported in AssistConnect. |
| Impact of Funding Award |
13. As a result of the recent funding award, will your program continue as a navigator for the 2017-2018 budget year? a. Yes b. No c. Don’t Know As a result of the recent funding award, how likely is it that your program will do the following during the 2017-2018 budget year? 14. Provide about the same level of services to about the same number of consumers a. Very Likely b. Somewhat Likely c. Somewhat Unlikely d. Very Unlikely e. Don’t Know f. Not Applicable 15. Reduce the geographic service area a. Very Likely b. Somewhat Likely c. Somewhat Unlikely d. Very Unlikely e. Don’t Know f. Not Applicable 16. Reduce services provided to consumers in rural communities a. Very Likely b. Somewhat Likely c. Somewhat Unlikely d. Very Unlikely e. Don’t Know f. Not Applicable 17. Reduce the number of months during which you provide navigator assistance a. Very Likely b. Somewhat Likely c. Somewhat Unlikely d. Very Unlikely e. Don’t Know f. Not Applicable 18. Limit enrollment assistance for Medicaid and CHIP eligible individuals a. Very Likely b. Somewhat Likely c. Somewhat Unlikely d. Very Unlikely e. Don’t Know f. Not Applicable 19. Reduce services for limited- or non-English speaking consumers a. Very Likely b. Somewhat Likely c. Somewhat Unlikely d. Very Unlikely e. Don’t Know f. Not Applicable 20. Limit the time staff devote to assisting consumers with complex cases a. Very Likely b. Somewhat Likely c. Somewhat Unlikely d. Very Unlikely e. Don’t Know f. Not Applicable 21. Reduce the number of outreach activities and events a. Very Likely b. Somewhat Likely c. Somewhat Unlikely d. Very Unlikely e. Don’t Know f. Not Applicable 22. Reduce spending on marketing (advertising) a. Very Likely b. Somewhat Likely c. Somewhat Unlikely d. Very Unlikely e. Don’t Know f. Not Applicable 23. As a result of the recent funding award, how likely is it that your program will lay off staff in the 2017-2018 budget year? a. Very Likely b. Somewhat Likely c. Somewhat Unlikely d. Very Unlikely e. Don’t Know f. Not Applicable 24. If staff layoffs are being considered, how many FTE staff do you expect to cut? |
| Additional Comments |
| 25. If other key changes to your program or the consumers you serve are likely, please briefly describe them here. |
Endnotes
- See Kaiser Family Foundation State Health Facts, for data on uninsured by state, 2013-2016. Available at modern.kff.org/other/state-indicator/nonelderly-0-64/?currentTimeframe=0&sortModel=%7B%22colId%22:%22Location%22,%22sort%22:%22asc%22%7D ↩︎
- Cooperate Agreement to Support Navigators in Federally-facilitated and State Partnership marketplaces, 2016 Non-Competing Continuation Application, April 14, 2016 ↩︎
- Navigator Cooperative Agreement, HIOS Reporting Guidance, 2016-2017 Budget Period, October 13, 2016 ↩︎
- See for example, Kaiser Family Foundation Tracking Poll, January 2016, which found 85% of uninsured could correctly identify the deadline to enroll in coverage through the marketplace. Available at https://modern.kff.org/health-costs/poll-finding/kaiser-health-tracking-poll-january-2016/ ↩︎
- For this report, we counted as “nearly statewide” Navigator programs that serve 80% or more of counties in their state. ↩︎
- Terri Shaw and Shelby Gonzales, Remote Identity Proofing: Impacts on Access to Health Insurance, January 2016, available at https://www.cbpp.org/research/remote-identity-proofing-impacts-on-access-to-health-insurance ↩︎